Article

Material Erosion and Dust Formation during Tungsten Exposure to Hollow-Cathode and Microjet Discharges

1
National Institute for Lasers, Plasma and Radiation Physics, P.O. Box M G-36, 077125 Magurele, Romania
2
Université Paris-Saclay, CEA, INRAE, DMTS, SCBM, F-91191 Gif-sur-Yvette, France
3
Faculty of Physics, University of Bucharest, 405 Atomistilor Street, 77125 Magurele, Romania
4
CEA, IRFM, F-13108 St Paul Lez Durance, France
*
Author to whom correspondence should be addressed.
Appl. Sci. 2020, 10(19), 6870; https://doi.org/10.3390/app10196870
Submission received: 4 August 2020 / Revised: 7 September 2020 / Accepted: 15 September 2020 / Published: 30 September 2020
(This article belongs to the Special Issue Recent Developments in Fusion Plasma Diagnostics)

Abstract

:
Tungsten erosion and dust occurrence are phenomena of great interest for fusion technology. Herein, we report results concerning the material damage and dust formation in the presence of high temperature and large area or concentrated discharges in helium and argon. In order to generate adequate plasmas, we used tungsten electrodes in two experimental discharge systems, namely a hollow discharge and a microjet discharge. In both exposure cases, we noticed surface modification, which was assigned to sputtering, melting, and vaporization processes, and a significant dust presence. We report the formation on electrode surfaces of tungsten fuzz, nano-cones, nanofibers, and cauliflower- and faced-like particles, depending on the discharge and gas type. Dust with various morphologies and sizes was collected and analyzed with respect to the morphology, size distribution, and chemical composition. We noticed, with respect to erosion and particle formation, common behaviors of W in both laboratory and fusion facilities experiments.

1. Introduction

Nowadays, the research community searches for alternatives to sustain daily human necessities in a clean and carbon-free way [1]. The capability of obtaining energy, in order to power up at low cost and without pollution issues is an important aspect. In this line, thermonuclear fusion promises an important step forward. In tokamaks, like the International Thermonuclear Experimental Reactor (ITER) facility presently under construction, plasma is magnetically confined in a large vacuum chamber shaped as a torus. During operation, plasma instabilities may occur, allowing plasma to come in contact with the inner wall of the vacuum chamber. This may give rise to plasma facing materials erosion, due to plasma–wall interactions. The eroded material could be further redeposited in a layer morphology. Also, due to high internal stresses, the redeposited layers can break, forming small and large size dusts. Dust occurrence represents a continuing concern in the scientific community for the thermonuclear facilities, because it raises the risk of contamination, both for the fusion facility and for the operators [2,3,4,5]. These contaminations come from the capacity of the dust material to incorporate tritium, due to their large specific surface area (SSA). Therefore, laboratory experiments and advanced computer programs were developed at various fusion facilities in order to understand the damage effects of the plasma upon the material wall, and also to analyze the dust production [6].
The identification of materials presenting opportunities for reducing these risks, is of wide interest [7]. Tungsten was selected as a material for the ITER facility divertor area. This material has outstanding properties which include a high melting point, low-sputtering rate, and so on [8]. Experiments related to the microstructural changes of tungsten mono-blocks exposed to pulsed high heat loads were initiated and performed [9]. Also, the morphology of tungsten surface was investigated after helium implantation. Due to this implantation at various parameters (like the using of single- crystal or polycrystalline tungsten), the occurrence of surface nano-structuration and nano-fuzz formation were studied [10]. The investigation of nucleation and subsequent growth of helium-bubbles networks in tungsten materials could explain the appearance of fuzz-like nanostructures [11]. Further, studies for understanding the blistering mechanics of tungsten represent a continuous interest [12,13,14]. Moreover, experiments showed that, in specific situations, pre-damage of W-5% Ta sample induced by Ar+ ions can enhance the deuterium-induced blistering, with higher deuterium retention inside it as compared with an un-damaged W-5% Ta material [15].
In addition, in order to obtain a view of these inevitable issues for the future ITER facility, the computer science domain offers an important and strong alternative. Nowadays, computer science has made remarkable achievements in developing high-class algorithms, from cloud computing, simulations, image encryption, biometric data security [16,17,18,19,20,21,22], to explaining physical phenomena which could occur in ITER-like thermonuclear facilities. Here, studies concerning plasma-surface interactions in tungsten by using high-performance algorithms represents a challenging task, in order to simulate accurate physics phenomena [23]. In this line, various computer-based models were developed, like the 3D computational fluid dynamics (CFD) model, for studying the effect of surface deformation on erosion prediction, due to solid particle erosion in a submerged jet impingement geometry under liquid-solid flow conditions [24]. Also, simulations for comparing the hydrogen and helium clustering characteristics of three interatomic potential energy models were developed, due to plasma–material interactions for fusion applications [25]. Moreover, helium bubble bursting on the surfaces of tungsten material and the formation of fuzzy-like tungsten nanostructures were investigated by using molecular dynamics, Monte Carlo hybrid simulation, STRUCTNRA program, and a phenomenological two-dimensional tungsten fuzz model [26,27,28,29]. Thus, in the future ITER facility, ELMs (large edge-localized modes) are reported to drive a part of the plasma stored energy onto the machine’s material structures. For a time, the duration of the ELMs, QDT( heating power for Deuterium–Tritium plasma in ITER) = 10, a single ELM could release an energy of ~30 MJ causing on the divertor target an energy of 10–15 MJ/m2 [30]. Even if ELMs are supposed to be mitigated to avoid wall erosion, it is likely that they will induce localized melting points on tungsten surfaces, during tokamak operations [31]. This can induce an enhancement of W-source, including occasional expulsion of small droplets (80–100 µm), droplets which could further coalesce and grow, creating disruptions, and ejecting them into plasma [31]. Also, modelling in JET shows that after ~100–200 µs after ELM appearance, a post-ELM state occurs, which could be described as a reduced plasma causing further problems during plasma lifetime [32,33]. Due to these serious ELM appearance, various simulations were made, in order to obtain all the damage possibilities which could be present during ITER operation [34,35,36,37,38,39]. Also, ELMs were studied in the DIII-D [40] and COMPASS tokamak [41]. Recent researches offer possibilities to extend the lifetime of plasma facings components, by proposing an approach of tungsten coating repair [42].
Motivated by the above information, the study of dust occurrence is an ongoing research domain. However, the testing of materials in conditions close to fusion is a costly and difficult task. The availability of Tokamaks is very limited. Post–mortem analyses of samples provides only partial conclusions, and often there is no option for repeating experiments to verify the hypotheses. In fact, as it is argued in reference [43], the WP-PFC work package includes experiments with laboratory heat-load facilities and linear plasma devices (JUDITH, GLADIS, PSI-2, PILOT PSI, MAGNUM, etc.), which are large infrastructures. Therefore, the experiments at normal laboratory conditions, feasible with small personal and at low cost are valuable tools for completing the knowledge of the materials behavior. This is possible because the continuity in the characteristics of materials may extend on large range of parameter values. For example, in the case of tungsten, the exposure of surfaces to heating and He plasma showed the fuzz appearance, in conditions created in Tokamaks [44], Pilot PSI experiments [45], by simultaneously exposure to heat by laser and He plasma [46], but also in normal laboratory hollow cathode discharges [47]. Similarly, particle formation (droplets, debris, nanoparticles) is a common phenomenon in magnetron sputtering and plasma jets [48,49,50], in spite of the fact that plasma configurations are very different for Tokamak plasmas. So, laboratory scale experiments are meaningful even if the conditions are apparently very different, just because they emphasize the similar behaviors of materials.
In this paper, we study the interactions between plasma and tungsten surfaces in order to investigate the erosion/melting/vaporization phenomena, and as a direct consequence, the dust occurrence. Special generating systems were designed and used, namely a hollow cathode (HC) [47] and a microjet discharge (MD) [50]. The experiments were made with helium and argon gas, in order to investigate soft and hard damages of the exposed tungsten surfaces. In both plasma configurations, we have obtained modifications of the exposed tungsten surfaces. The phenomena of erosions (by using He gas) and sputtering (by using Ar gas) were obtained in HC configuration. Nevertheless, melting/vaporization and small erosion evidence were obtained, by using Ar gas in MD configuration. These surface modifications are highlighted in the current paper, along with the appearance of fuzz structures (in the case of using He in MD), the occurrence of dust with various shapes and sizes, nano-cones, and nano-fiber morphologies (in the case of using Ar in MD). Moreover, we were able to collect dust material produced after plasma–material interaction. Nevertheless, dust formation mechanism is described for both HC and MD plasma configurations, along with a statistical description of dust. Several techniques have been used in order to observe the plasma impact on the exposed tungsten material. In this line, the scanning electron microscope (SEM), the contact profiler, and the X-ray photoelectron spectrometer (XPS) instruments were used. All the experiments have been conducted to assess the formation of tungsten dust (particles) as well as the formation of various nanostructures (fuzz, nano-cones, nano-fibers columns, solidified droplets) on the exposed tungsten surfaces.

2. Materials and Methods

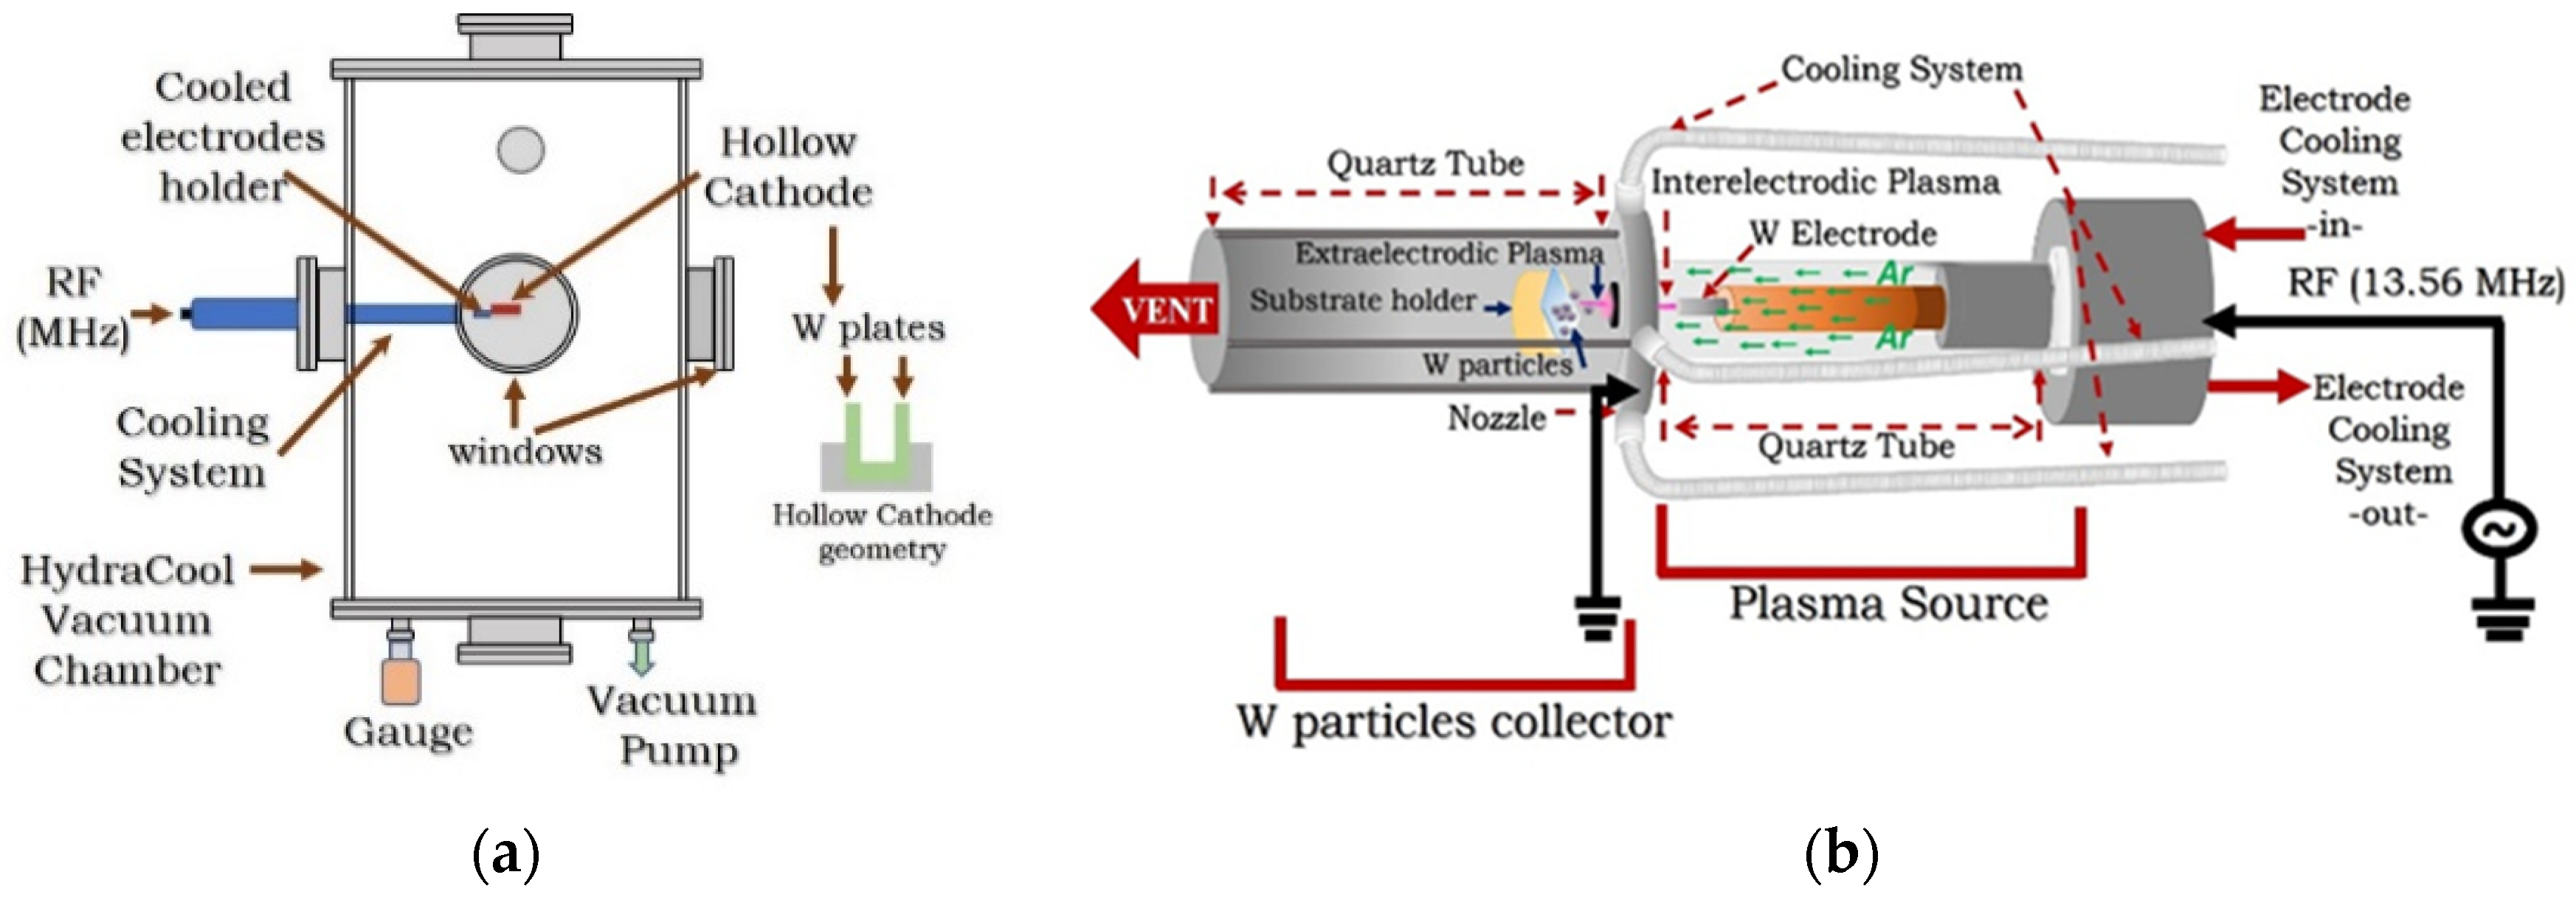
2.1. Dedicated Experimental Setups for Plasma Generation

The hollow cathode [47] (HC) setup (Figure 1a) uses a stainless-steel vacuum chamber (HydraCool, Kurt Lesker company, 30 cm diameter and 60 cm height) inside which are placed two parallel tungsten plates (3 cm × 1.5 cm × 0.3 cm), separated by 3 mm distance, which are electrically connected and serve as RF (13.56 MHz) electrodes. The electrical ground of the discharge is the chamber itself. By applying the RF power, a discharge is ignited between the plate electrode and the chamber wall: in appropriate conditions of pressure and power, the narrow space between the plates becomes the place of a hollowcathode discharge. This happens because the RF discharge is highly asymmetric (the electrode surface is much smaller comparing with the grounded chamber itself) and a high negative self-bias is created on the double plate electrode. The peculiarity of the HC discharges consists in the trapping and oscillation of the discharge electrons in-between the two plates. Because the two plates are both negatively self-biased, which is an effect of the asymmetric RF discharge, the secondary electrons emitted by a plate perpendicular on its surface travel toward the opposing plate from where they are repelled back in the inter-plate space. As a consequence, electron densities in the range of 1019 m−3 and electron temperatures of about 3 eV are peculiar for the discharge. The negative self-bias also causes an important ion bombardment. The experimental parameters corresponding to discharge operation in the HC regime in helium were identified as follows: an input power of 200 W, and pressure of about 40 mbar, and an exposure time of 15 min. The temperature reached by the W plates was between 1200 and 1500 °C, and was measured by using an optical pyrometer (OPTRIS Ctlaser, version 3MH CF3). The material removed from the heated double-plate electrode was collected on a substrate holder and vertically placed above the double plate electrode, at 6 mm, 10 mm, 20 mm, and 40 mm. Experiments were performed for 15 min duration.
The microjet discharge [50] (MD) setup (Figure 1b) comprises two parts. In a quartz tube of 20 mm diameter is enclosed the plasma source, where the RF electrode is a tungsten bar of 1.5 cm length and 5 mm diameter, and the grounded electrode is a disk-shaped plate nozzle. The electrodes are separated by a 3-mm distance. The second part is represented by a larger quartz tube, where the collector is placed. The two setup parts are connected by the plate nozzle and communicate through the nozzle orifice. During discharge ignition, a microjet plasma is formed, anchored with one end on the surface of the electrode and expanding through the nozzle in the collector space [50,51,52]. The formation of the micro plasma channel was studied in Reference [52]. The electron densities, evaluated from spectral data, are in the range of 1020–1021 m−3. The electron temperatures were found to be low, about 0.7 eV. As plasma is highly collisional, the ions energy are low, and sputtering effects by ions should be negligible. The experimental parameters leading to the microjet discharge regime were the input power in the range of 20 W–100 W, gas flow rate of 4000 sccm, pressure 1000 mbar. The material eroded from electrode was collected for 30 min.
Before the experiments the discharge chambers were evacuated at 3 × 10⁻² mbar. We have used used Ar 5.0 (purity ≥99.999%) and He 6.0 (purity ≥99.9999%). The gases were injected by using calibrated gas flow meters. Due to the differences in the system configurations, the pressure was adapted to each plasma method. In the case of hollow cathode discharge, 400 sccm of He and 1000 sccm of Ar gas were continuously introduced, leading to a total inner pressure of 40 mbar. In the case of microjet discharge (MD), we used 4000 sccm for He, or 4000 sccm for Ar. In this case, the pressure inside the experimental system was 1 atm.

2.2. Methods of Surface Characterization and Materials Analysis

The exposed tungsten surfaces were analyzed by using the Scanning Electron Microscope (SEM) FEI Inspect S50, using an acceleration voltage of 15 kV and 20 kV. Statistical analysis was obtained by processing the initial SEM images with ImageJ software (v1.53c version, National Institutes of Health (NIH Image), Washington, DC, USA). We have used the KLA Tencor P-7 contact mode profilometer, equipped with a diamond tip, and having a radius size of 0.150 nm. In order to determine the surface roughness, the samples were scanned for an area of 1.5 × 1.5 mm, with a distance of 10 µm between profiles, an applied force of 1 mg, and a scanning rate of 100 µm/s. All profile measurement units, used in the current paper, are approved by KLA Tencor P-7 instrument. The results were processed with APEX 3D BASIC V7 software program, Digital Surf, Besançon, France, and approved by ISO 25178. For chemical investigations we have used the X-ray Photoelectron Spectrometer (XPS) K-Alpha Thermo Scientific instrument (ESCALAB™ XI+, East Grinstead, UK), equipped with a monochromatic AlKα X-ray source.

3. Experimental Results

3.1. Plasma-W Surface Interactions in the HC Configuration

In order to investigate the influence of He or Ar plasmas interactions with W surfaces at low pressure, we have used W plates with polished surfaces, with an initial roughness (RMS) of 0.0711 µm. The thickness of both parallel plates was chosen to be the same. During experiments, plasma is localized between these two plates. In Figure 2 is presented an optical image of a W plate exposed to Ar plasma. The blackish part, denote by initial, was not affected plasma, being covered by the sample holder. The eroded region (plasma-exposed) is delimited from the initial, and has a grey color in the image. Herewith, for further investigations, the eroded zone was divided in three parts: L = left part, C = central part, and R = right part (Figure 2).
Figure 3 illustrates the modification of the initial W surfaces, at center, when exposed to He and Ar plasma. The initial W plate presents a smooth roughness, while in the case of the plate exposed to a He plasma the morphology indicates an increment of the surface roughness. Moreover, by exposing the plates to Ar plasma, a mountain-like patterning is produced, which can be assigned to the intense erosion process sustained by the bombardment of Ar ions. It is worth mentioning that the results at the left and right sides are similar to those obtained in the center.
For further surface investigations, the exposed W plates were analyzed by profilometry. The measurements were recorded for an area of 1.5 mm × 1.5 mm. Figure 4 presents the results. The homogeneity of the plasma exposure on the surface was established by investigating the roughness, for every case, in three zones (L, C, and R). From the beginning, the RMS of the initial W polished plate was 0.0711 µm. In the case of He plasma exposure, the RMS from L and R (left and right) are approximately the same (0.157 µm and 0.161 µm), while in the central part, the RMS is higher, at 0.198 µm. In the case of Ar plasma exposure, the L and R parts have the same RMS values (4.11 µm and 4.12 µm), and this increased in the central part, up to 5.09 µm (RMS values).
First, the contact profiler analysis supports the SEM investigation. On average, the roughness created by He plasma is about 20 times smaller compared to Ar plasma. Further, the erosion process is more intense, in terms of surface damaging, in case of Ar plasma. Second, the results obtained reveal that, for both He and Ar plasmas, the erosion intensity is equivalent in the left and right sides of the exposed plates, but stronger in the central part of the plates. This surface distribution is explained by the fact that HC plasma is concentrated at the middle of the parallel plates. Also, a lower sample temperature is noticed at the sample margins.

Dust (Particles) Production in HC Configuration

Dust (particles) production represents the consequence of plasma-W surface interactions. The size distributions, shapes, and number of the obtained particles are strongly related to the plasma parameters and with the geometry of the experimental configuration. In this line, we have tried to collect and analyze the produced particles, and compare the influence of He/Ar plasmas-surface interactions upon dust formation. In Figure 5 are shown the results of SEM analyses of the collected material. In both He (Figure 5a) and Ar (Figure 5b) plasma exposure, the material consists of a deposited layer of dust, aggregated from small particles.
Using He plasma, the morphology of the collected dust depends only slightly on the distance. Dust is present predominantly as layers formed from particles, with sizes below 100 nm. Because of the obtained continuous morphologies consisting of merged particles, we could not proceed for size distributions.
In the case of Ar plasma exposure, beside the presence of small particles, the appearance of big agglomerates is observed at increased distances. In Figure 5c are shown the particle size distributions obtained in argon discharge, for each distance. Each histogram was obtained with ImageJ software in manual mode by measuring an area of 3520 µm2 from every initial SEM image. An interesting result occur at 6 mm. Here, we can observe a double histogram, with two distribution peaks at 225 nm and 1725 nm. This result is correlated with SEM image, mainly: the particles are distributed on surface in individual small cauliflower-like particles with sizes around 200 nm, and big agglomerate particles with sizes, which could achieve 2816 nm in diameter. In addition, by calculating the particles mean size of the double histogram, we obtain a value around 537 nm. Increasing the distance at 10 mm, the particles mean size decrease around 520 nm, and with a distribution peak at 425 nm. As we saw in the case of using helium, here at 10 mm we observe a layer of merged particles, and individual cauliflower-like particles on top of it. It is worth mentioning that for the statistical description we have considered only the individual particles. Furthermore, by continuously increasing the distance at 20 mm and 40 mm, the particles morphology is changing, from individual cauliflower-like particles to faced particles arranged in clusters. Also, the size of particles decreases with distance, from a mean size of 511 nm at 20 mm, up to 203 nm (mean size) at 40 mm. We did not observe major changes of the density of particles for all distances. Thus, by considering the unmeasured merged particles, which compose the film, we can assume a higher value of the particles density for the samples obtained at 6 mm and 10 mm.
The processes which are involved in producing particles in hollow cathode (HC) configuration are presented in the following paragraph. In HC configuration, plasma can be described as a homogenous, confined, and stable discharge between the two W parallel plates. HC is characterized by a high density and high energy of the electrons. Here, electrons are trapped and oscillate between the parallel plates, creating numerous ions. The negative self-bias of the plate ensures high energy of the ions, in the range of tens or hundreds of eV, which conducts to sputtering and therefore erosion. In this line, small amount of metallic material is removed from the exposed plates. Further, the metallic material is transported by plasma and gas, from the parallel plates up to the substrate collector. Metallic particles grow and nucleate at two levels. First, during plasma transportation, small particles are formed and grow by surface additions. A second growing stage of the particles could be observed at the collector level. Here, the particles continue to grow forming a film, composed from merged particles. In the case of helium gas, the presence of erosion is highlighted in Figure 3 He/Center, and in the profilometry results (Figure 4, left side column). Sputtering processes occur by using argon gas. Here, the surface of the exposed plates presents morphologies related to mountains and valleys, with sharp edges (Figure 3 Ar/Center) and with a high roughness (Figure 4, right side column).
These results show that by exposing the W plates to He and Ar plasmas, in hollow cathode configuration, dust can be collected even at high distances (40 mm) from the electrode. Dust can be found on the collector surface in the following forms: merged particles as a continuous film, individual cauliflower-like particles, faced particles arranged in clusters, and big agglomerate particles, which are aggregates of small particles.

3.2. Plasma-W Surface Interactions in the Case of Microjet Discharge

In the case of the microjet the discharge evolves like a constricted columnar plasma (microjet discharge–MD), which is always anchored punctually on a small zone (spot) of the electrode surface. Therefore, we focus the study on the modification of the tungsten surface at the spot area. The footprint of the spot is observed in Figure 6. Around the erosion spot is easily to observe signs of local melting. The size and shape of the erosion spot, and the surface morphology in its vicinity are dependent on the input RF power. The effects of the plasma–tungsten surface interaction at high power density values, corresponding to the spot area, were studied by using both He and Ar as gases. Due to experimental constraints, we have chosen to vary the RF input power, in order to understand the appearance of the erosion/melting spot.
The results of the interaction between the micro discharge and tungsten surfaces are presented in Figure 7, Figure 8, Figure 9, Figure 10, Figure 11, Figure 12 and Figure 13.
Thus, in Figure 7, the input power was not so high to produce major changes on surface; however, the results show two type of phenomena of the exposed surfaces. First, there is the appearance of small size fuzz structures, at 20 W, 60 W, and 100 W. Here, at 100 W, in the point where the microjet was anchored, a strong foam/fuzz-like surface structures were formed directly from the electrode. Secondly, signs of removed bulk material from the surface by using an input power of 40 W and 80 W are evident. In fusion domain, helium is well-known for the formation of gas bubbles inside the exposed bulk material. Those bubbles are accumulating inside the bulk material and migrate, forming blisters and fuzz structures on the material surface. These effects are also observed in the present experiments.
The case of Ar microjet (Ar-MD) exposures reveals other interesting results regarding the surface morphologies. Here, the erosions are clearly delimitated and around the spot, and we have identified solidified dust-like particles with various sizes and shapes. By varying the input power from 20 W (Figure 6) up to 100 W (Figure 8), we can observe the increasing of the erosion spot. Also, the bottom of the spot is extremely smooth, and we could not identify spatial features.
In the following figures (Figure 9, Figure 10, Figure 11, Figure 12 and Figure 13), we present images recorded for the margin zones of the exposed electrodes, for an input power between 20 W and 100 W. In contrast with the bottom, the margins of the spot reveal interesting features. They were available only by using Ar gas. In addition, the formed vertically like structures were not observed elsewhere on the substrate collector. In Figure 9, we can observe the investigated margin area, for an input power of 20 W. On the surface of the electrode, particles with cauliflower-like shapes were formed. The SEM images indicate that the surface became particle-like structured.
Further, by increasing the input power to 40 W (Figure 10) in the margin area, we can identify various type of structures: (a) cauliflower structures, (b) columnar structures, and (c) nano-cone structures. The morphology of the observed structures indicates a growth from liquid and vapor phases, thus support the occurrence of electrode local melting and vaporization phenomena. Such morphologies could enhance the catalytic effects and could be used for industrial purposes.
Argon gas is known for its sputtering properties. In our case, we assume that the melting and vaporization phenomenon is combined with the sputtering property of argon, and conducted at the formation of the columns and nano-cone structures. These vertical morphologies were noticed being formed only on a small part at the margin of the Ar plasma–material interaction spot. In Figure 11 is presented the image corresponding to the input power of 60 W. It can be seen also that the surface denotes the redeposition and formation of particles stuck on the bulk material.
Interesting results occur at an input power of 80 W. In Figure 12, we can observe two types of morphologies which are present in the margin zones of the erosion spot. Figure 12a shows erosion traces and redeposit particles. This phenomenon could be related to localized instabilities of the MD configuration. Figure 12b shows the formation of the nanofibers and nanotubes distributed over the bulk material.
Interestingly, at higher input power (100 W), we cannot observe structures in the margin zone of the eroded spot. In Figure 13, we can observe only the spot with a smooth bottom, and the clean surface of the un-affected electrode, even with a detailed analysis of the entire electrode surface.
In the above results, we could observe evidence of material erosion, and a tendency of dust formation near the erosion spot. Having this in mind, we continue to analyze and investigate what happens with the material removed during plasma lifetime

Dust Particles Production with MD Configuration

As in the case of He-HC and Ar-HC configurations, dusts are produced with microjet discharge. Here, the particles were collected on silicon substrates during experiments. In Figure 14 are illustrated the results of the obtained dust, due to He-MD and Ar-MD interactions with tungsten electrode surface, for input powers between 20 W and 100 W. Measurements regarding size distributions were obtained from the initial SEM images using ImageJ software in manual mode. Also, we acknowledge the area of 3520 µm2 which was used in this case for statistical description.
In the case of helium discharge (Figure 14a), on the collector are obtained only small signs of dust (Figure 14, He/100 W) along with removed bulk material. From these results, we can remark that by using helium in the discharge, we removed only small amounts from powered electrode material, and in the same time, we obtained fuzzy structures on the exposed electrode surface. Dust sizes varies from tens of nanometers specific to the small particles observed backward (Figure 14a He/80 W and He/100 W), up to tens of microns. Due to a lack of dust for some samples, and the amount of dust with an undefined morphology, we could not perform a rigorous statistical description for this case.
In the case of argon discharge (Figure 14b), the obtained particles have a cauliflower-like shape, and with sizes which increase with the applied input power. In Figure 14c are illustrated the size distributions for each sample. At 20 W, the particles mean size is 462 nm, and with a distribution peak of the histogram around 300 nm. By increasing the input power at 40 W, the mean size of the particles increases at 508 nm, but the histogram shows a peak distribution at 300 nm. From these first results, we can observe that an important number of particles with dimensions around 300 nm are obtained at 20 W and 40 W. By continuing with a power of 60 W, we obtain particles with sizes around 1134 nm, arriving at dimensions of 2041 nm for 80 W and 4365 nm at 100 W. Thus, according to particle density values, by increasing the power, we obtain fewer particles, but with bigger sizes.
Concerning particle formation in the microjet discharge (MD) for both helium and argon gasses, we will describe the processes in the followings. In MD configuration, plasma is described as a constricted jet, anchored on the surface electrode, in a well-defined spot. In our previous work [50], in the particle formation and transport section, we described the processes involved during tungsten particles production. In this line, we acknowledge the melting and vaporization processes at electrode level, due to heat dissipation in the anchored spot. These processes assure the appearance of metallic tungsten vapors and droplets, being a direct consequence of the fact that the main part from the current is passing through the well-defined spot, thermally affecting the exposed surface. SEM measurements from Figure 6 and Figure 8 illustrates the melting process from the surfaces. Moreover, the presence of big condensed particles, in the margin region of the spot (Figure 10a), reveals the formation of droplets during melting process. Further, the metallic vapors and detached droplets suffer the process of nucleation and condensation, forming the primary W particles. During plasma and gas transportation, the primary particles are continuously growing by atomic addition.
Moreover, the processes involved in particles formation start from the interactions between the microjet discharge (MD) and the powered electrode. In the case of helium gas, the main morphology obtained at electrode level is fuzz. This result is related due to helium incorporation inside the bulk material in bubbles form. Due to inner mechanical stress of the bulk material, He bubbles are pushed up, producing disruptions and formation of the further fuzz at the surface of the bulk material (e.g., Figure 7 at 100 W and 60 W). Thus, particles production in He atmosphere is focused on big particles with undefined morphology (e.g., Figure 14 at 40 W) and very small particles (e.g., Figure 14 at 80 W and 100 W) which could be barely observed in the backward of the big undefined particles. In the case of using argon gas, the interaction spot is well defined, and we observe some traces near spot margins, suggesting the predominance of the erosion processes (Figure 12a). Also, the appearance of columnar morphologies (Figure 10b,c and Figure 12b) is related to the usage of argon, being well-known for sputtering properties, and combined with the melting and vaporization processes, we obtain columnar morphologies, grown from and on the exposed bulk material, at the margin of the interaction spot. Particles with cauliflower and droplet morphologies are also present near interaction spot. The results show that in the case of helium gas, the melting process is not so intense as in the case of argon gas. For both helium and argon gasses, we have already acknowledged at the beginning of this section the morphologies and statistical analysis of the collected particles.
These results are correlated with the fact that, on the surface of the electrodes, He-MD and Ar-MD interact differently with tungsten material. Helium plasma give rise only to a slight erosion at the electrode surface, resulting nano-structuration and blistering, releasing only small amounts of metallic vapors, which could be further transformed in dust. On the other hand, argon plasma interacts strongly with the tungsten electrode surface, giving rise to melting and vaporization, which are the major sources of dust (particles) production. The plasma sputtering thresholds are above 200 eV for He on W and only ~30 eV for mono charged Ar on W material.

4. Chemical Analysis of Produced Dust

The obtained dust (particles) from both HC and MD configurations, were analyzed in order to establish the chemical composition. Survey spectra were recorded at a pass energy of 50 eV to determine the atomic fraction of the tungsten particles surface, while the high-resolution spectra for C1s, O1s, and W4f binding energy regions were measured at a pass energy of 20 eV in order to evaluate the elemental bonding states of the as-resulted dust. Peak positions were calibrated according to the standard C1s peak (284.8 eV). The spectra acquisition and data processing were performed by using the advanced Avantage data software. The W4f spectra were fitted with Gaussian Lorentz product line shaped doublets after Shirley type background subtraction. Several constrains were initially applied, as the full width at half maximum (FWHM) considered identical for both spin-orbit coupling peaks and the energy splitting, and then were allowed to vary. In the following, we present the results of low and high-resolution XPS spectra collected after a 15-s Ar+ etching of the surface of particles deposits.

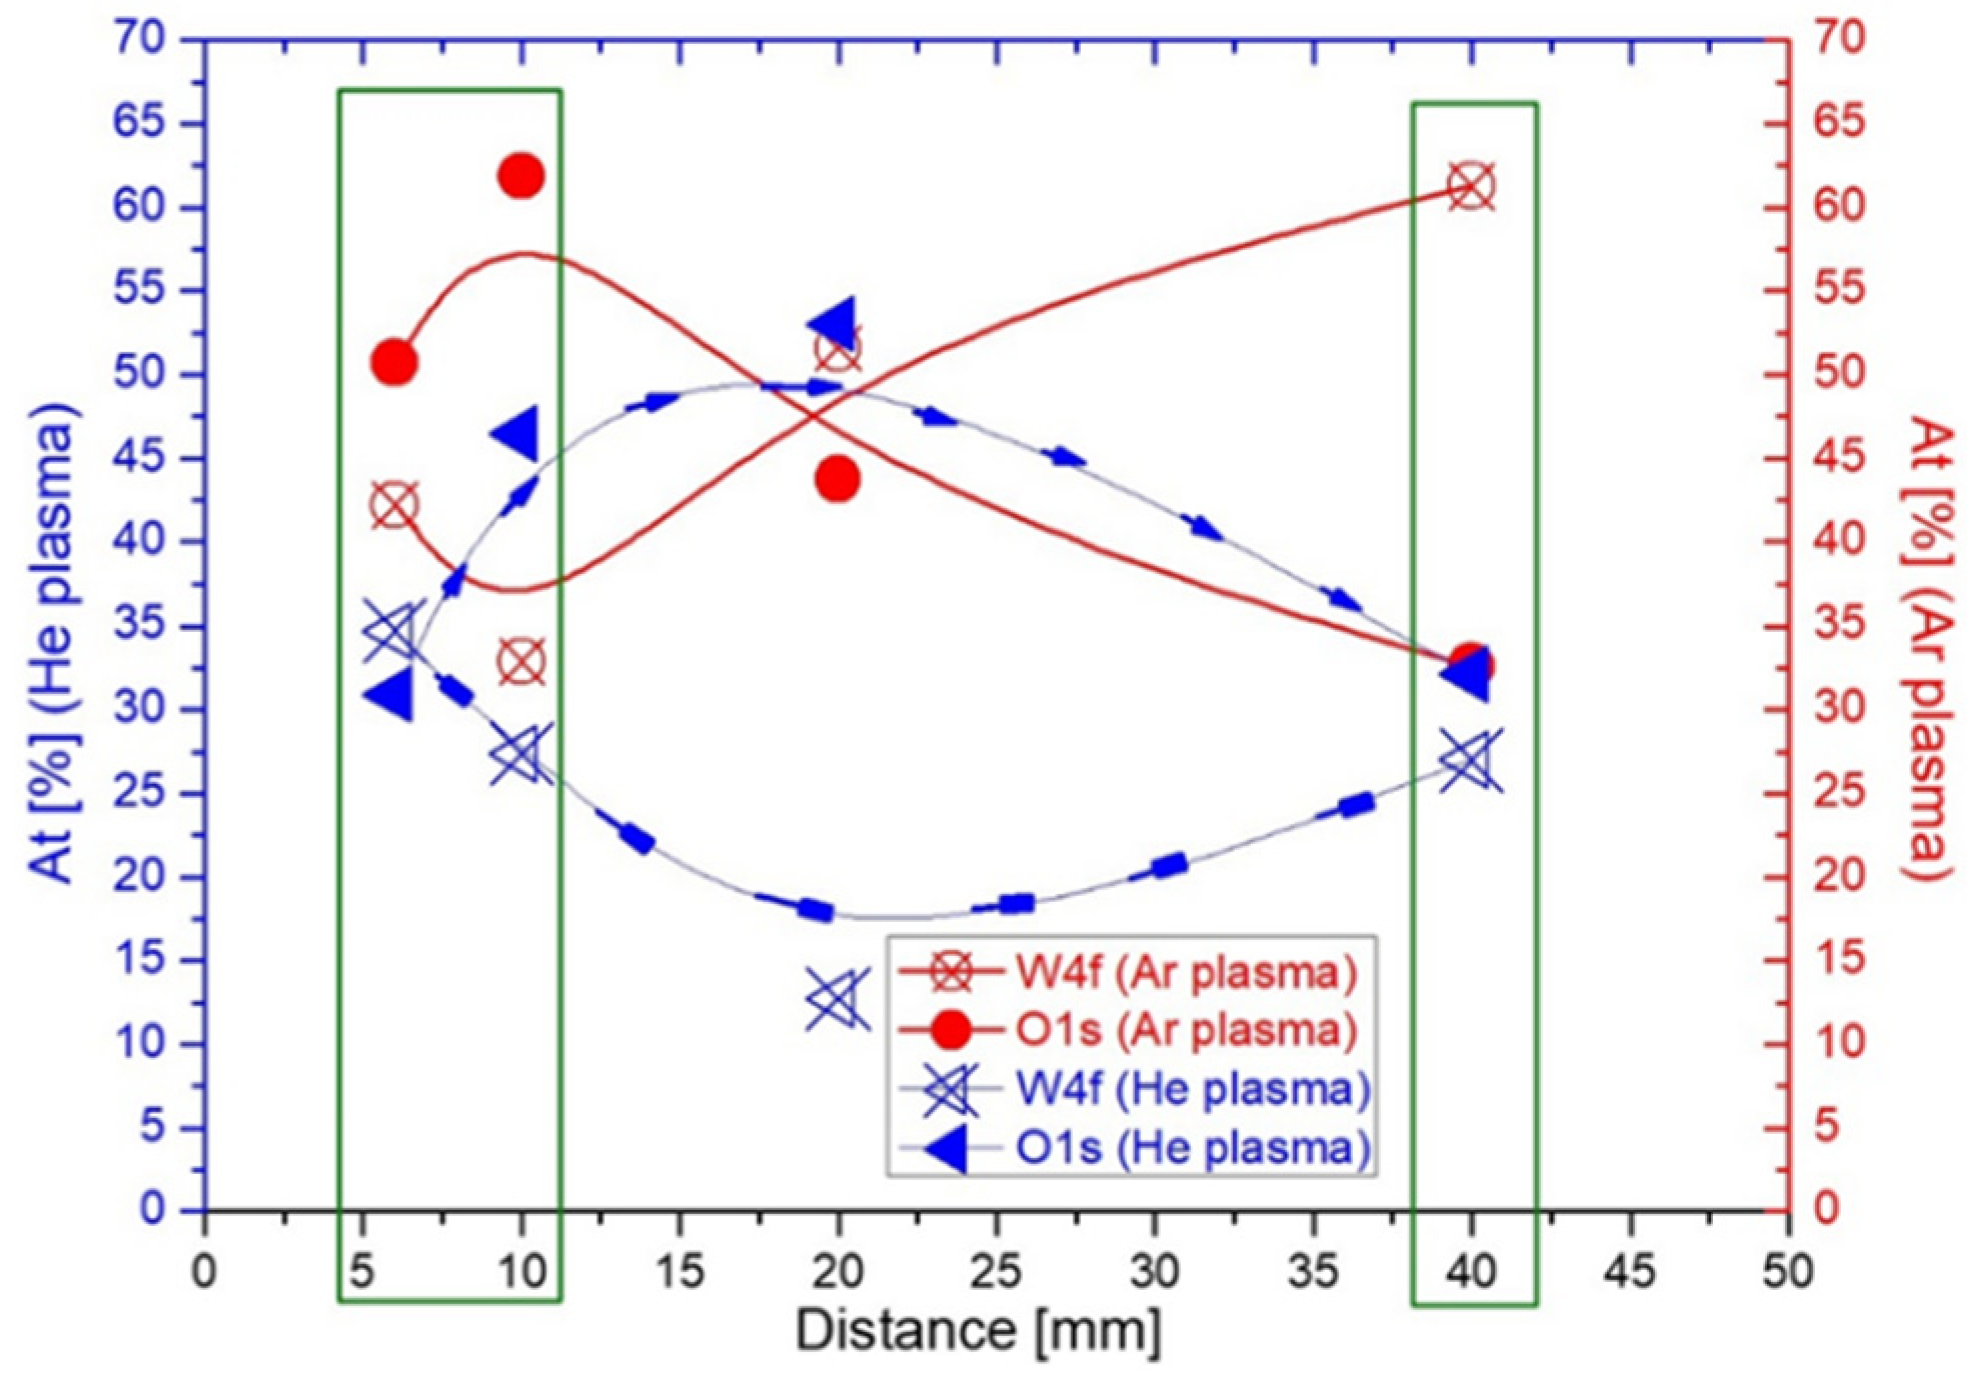
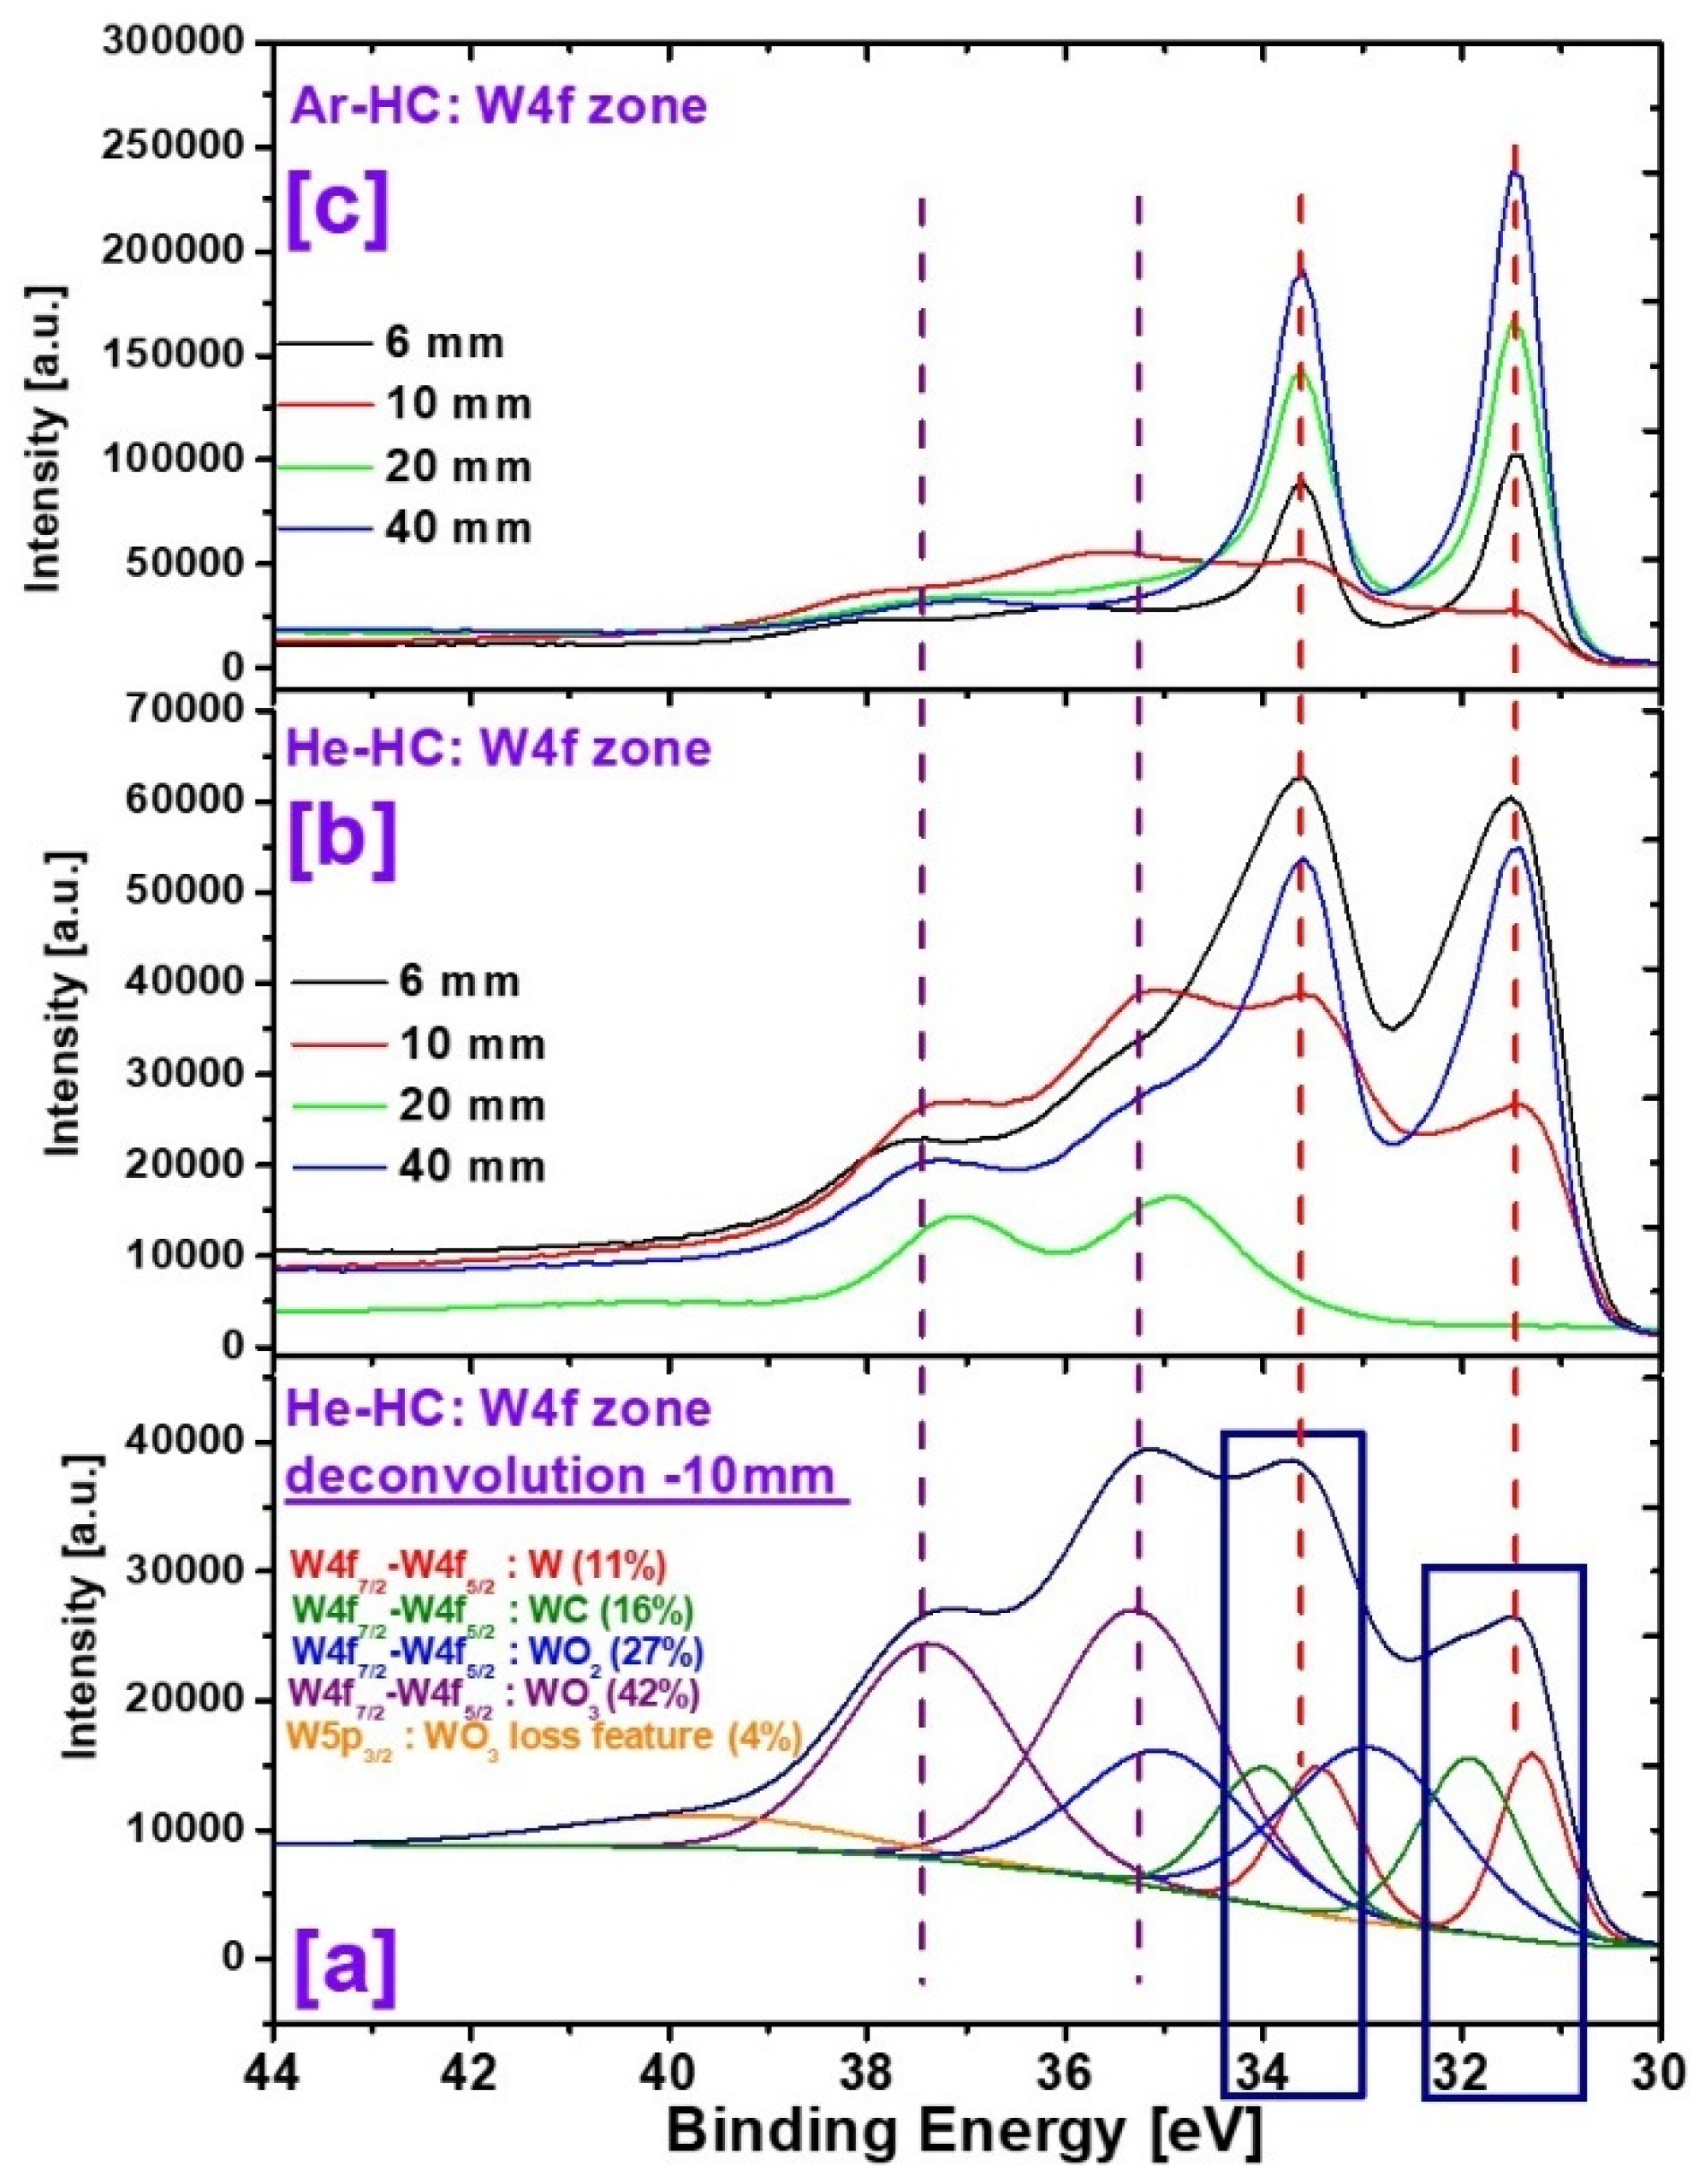
4.1. XPS Analysis of Dust (Particles) Obtained by HC Discharge

Dust obtained in HC configuration, at low pressure, presents specific chemical composition. In this line, in Figure 15 we can observe the survey spectra recorded for dust obtained in He-HC (Figure 15a) and Ar-HC (Figure 15b) configurations. The atomic concentrations of four major zones, mainly the W4f, C1s, N1s and O1s, were measured for HC in Ar and He. These results are presented below, in Table 1. Survey spectra reveal besides the reported peaks, some additional peaks which are assigned to the copper and zinc as contaminants elements. Here, copper is coming from the copper electrode holder, while zinc comes from the entrapped contaminants in the inner wall of the reaction chamber, as a consequence of other previous plasma experiments in the same reaction chamber. These additional peaks were not considered in the quantification of the elemental concentration in the as-synthetized materials, and therefore we did not consider appropriate the assignment of these elements.
Helium plays an important role in fusion facilities, making it a topic extremely studied. As we already mentioned it in this paper, we are aware of its capability of penetrating in the bulk materials. Herein, we wanted to investigate the influence of helium in the removed material, mainly in dust (particles). Even if we have made an etching step, for removing various contaminants, we have observed the presence of the carbon and nitrogen in the particles. It is possible that, during particle formation, helium will enhance the trapping process of the gases in the redeposited materials. From this result, we can observe also that helium plasma amplifies the absorption of carbon in deposited materials, which increase from 15.62% at 6 mm, up to 30.53% at 40 mm. The presence of carbon in the materials could be correlated with the residual compounds from desorption of the inner chamber wall of the experimental system and from the ambient atmosphere, after the material was taken off from the experimental chamber.
In the case of using argon, we can observe the absence of carbon and a very low atomic concentration of nitrogen in the material. In this case, the new formed particles will contain tungsten and oxygen. Moreover, we can observe a decreasing of the oxygen component (from 50.74% up to 32.55%) in the W dust, by increasing the distance between the plasma discharge and the substrate holder (from 6 mm up to 40 mm). By continuing the chemical analysis of the obtained particles, in Figure 16, we have shown the variation with the distance of the atomic concentrations of W and O from the XPS Survey low-resolution spectra, for both He and Ar plasmas in HC configuration. The non-monotonous trend can be explained by the fact that XPS spectra were acquired from an area with low particles density on the substrate surface, resulting in less atomic contribution of metal in recorded spectrum, due to the limitation imposed by the low resolution of optical camera of the XPS. The blue graphs are related to helium plasma exposure (He-HC), while the red graphs are correlated with argon plasma exposure (Ar-HC). In addition, the filed points are related to Oxygen atomic concentrations, while the empty points are assigned to Tungsten atomic concentrations. By using helium, in the obtained particles, we can observe a decreasing of tungsten atomic concentration with increasing the distance between electrode plates and collector. In contrast with helium, argon plasma exposure promotes an increasing trend of tungsten atomic concentration due to distance variations, to the highest concentration of about 61.27% at 40 mm. However, the particles oxidation take place for both He-HC and Ar-HC plasma configurations. The substantial contribution of atomic oxygen in the obtained materials is due, on one hand, to the affinity of this element for metals during the formation process of the metallic particles, and on the other hand, the surface oxidation in the ambient atmosphere. Moreover, the oxidation rate is more pronounced in the case of Ar-HC configuration suggesting that more energetically Ar+ ions favoring the free radicals at the particles surface which are satisfied with oxygen in the natural environment. This phenomenon could be also possible due to a difference in the specific surface area (SSA) of the obtained particles.
In order to have a better understanding of the elemental bonding states of the as-synthetized particles, high resolution spectra were recorded for W4f, O1s and N1s binding energy regions. Herein is presented the deconvolution of the most complex shape corresponding to W4f binding energy region, which suggest the chemical bonding states that can occur in the HC configuration synthesis process.
In Figure 17, three graphs are illustrated which corresponds to the following high-resolution spectra. Figure 17a shows the deconvolution of W4f high resolution spectrum for the material obtained at 10 mm distance in He-HC configuration. Figure 17b shows a comparison of W4f binding energy regions for the resultant materials obtained in He-HC configuration for all investigated distances (6–40 mm). Figure 17c shows the evolution of W4f high resolution spectra for all investigated materials obtained in Ar-HC configuration. The W4f high-resolution spectrum, for the He-HC plasma resulted material (obtained at 10 mm distance), was fitted with four doublets, W4f7/2 and W4f5/2, separated by 2.18 eV, corresponding as follows. An important contribution of 42% is devoted to tungsten trioxide (WO3), a contribution of 27% for tungsten dioxide (WO2), and a lower contribution of 11% for metallic tungsten state (W) and tungsten carbide (WC) with a contribution of 16%, as a consequence of carbon contamination both in the synthesis process and in the natural environment.
The W4f high-resolution spectra recorded for the materials obtained in the case of He plasma for various distances, are displayed in Figure 17b. We can observe that all investigated distances reveal the obtaining of materials with a complex bonding state for the tungsten atom, from metallic tungsten, to tungsten oxides and tungsten carbide.
In the case of 20 mm distance, the tungsten bonding states indicate a simpler structure in the resulted materials, mostly based on the tungsten trioxide. However, in all investigated distances, the carbon contamination is evidenced. Due to the unavoidable carbon contamination in the natural environment, the atomic carbon contribution in the synthesis process is difficult to be quantified.
The evolution of W4f high-resolution spectra recorded for the obtained materials in Ar-HC configuration are depicted in Figure 17c. The chemical structure of the resulted materials for all investigated distances reveals a chemical composition based mainly on tungsten dioxide for 6 mm, 20 mm, and 40 mm. In the case of the 10 mm investigated distance, the envelope for W4f evidences a more complex shape in this case, with the doublets specific to tungsten dioxide and tungsten trioxide. The more complex chemical structure in this case can be explained, either by environment conditions change which can drastically influence a strong temperature dependent process, either by a non-homogeneous plasma localized at this distance which can possibly conduct at a higher oxidation rate.

4.2. XPS Analysis of Dust (Particles) Obtained in MD Configuration

In the case of atmospheric pressure, the particles were analyzed only for Ar-MD configuration. For He-MD configuration we could not obtain enough particles on the collector, due to low erosion/melting of the process. For this reason, in the following, we will present only the results for the particles obtained in argon plasma. The investigation of this process was based on the variation of input RF power. The relative atomic concentration of the produced materials as a function of the input RF power, as determined from the interpretation of XPS survey spectra (Figure 18), is reported in Table 2.
By analyzing the spectra, we could observe the chemical signature of W4f, O1s, C1s and N1s. As we can see in Table 2, the W4f atomic concentration is between 19% and 27%, O1s is ranging between 46% and 55%, C1s is between 12% and 27%, and N1s between 6% and 9%. We could not observe any trend in the atomic concentrations during power increasing. Thus, with MD, although we have used argon, we still have carbon in the particles and a low concentration of nitrogen, in contrast with the particles obtained by using argon HC plasma at low pressure.
The survey spectra recorded for particles obtained in Ar-MD configuration reveal an atomic contribution mostly based on tungsten and oxygen, and low contribution of nitrogen, present as a contaminant in the process of particles formation. Carbon contamination is also noticed here, most probably both from the particle’s formation process and from the natural environment exposure.
Considering, the almost constant value of W/O ratio (0.4) for all investigated input RF powers, we can suppose that chemical structure of these particles is mostly based on tungsten oxides. In the case of 20 W applied RF power, the W/O ratio present a higher value (0.5), suggesting in this case, most probably, a more pronounced tungsten oxidation rate. Therefore, it is very important to have a complex view on the chemical bonding states of tungsten atom in the particles chemical structure.
In this context, in the following we will discuss the influence of input RF power on the W4f energy region, as well as the deconvolution of this specific region for better knowledge of W-O type bonds in the particles chemical structure. Figure 19 presents the evolution of W4f energy region upon applied RF powers, depicted in Figure 19b, and deconvolution of W4f spectrum recorded for 20 W input RF power, depicted in Figure 19a.
The W4f high-resolution spectrum recorded for the material obtained in Ar-MD configuration, at RF input power of 20 W was deconvoluted with four doublets, W4f7/2 and W4f5/2 reveling a complex chemical structure of this material, as follows: tungsten trioxide (WO3) with an important contribution of 46%, tungsten dioxide (WO2) with a contribution of 26%, metallic tungsten state (W) is evidenced with a lower contribution (10%), and tungsten carbide (WC) is also present with a contribution of 18%, as a consequence of carbon contamination both in the synthesis process and in the natural environment. The evolution of W4f spectra, for the particles obtained in Ar microjet configuration with the investigated RF power, reveal a mixed chemical structure with the contribution of various bonding states of tungsten atom, metallic tungsten, dioxide and trioxide of tungsten, as well as tungsten carbide for soft RF input power (20–60 W), while a simpler chemical structure with a major contribution of tungsten trioxide is evidenced in the case of higher input RF power (80–100 W).

5. Conclusions

The paper focuses on the behavior of the tungsten material exposed to a plasma medium, which could be further correlated with particular results from fusion facilities. In this line, the experiments were performed in order to emphasize material damages and dust formation, as direct consequences of the plasma–tungsten surface interactions. For both low and atmospheric pressure, we have used two gases, namely helium and argon, in radiofrequency discharge (13.56 MHz). In fusion facilities, argon could be introduced in the divertor region in order to radiate part of the conducted power, so studding argon is completely fusion relevant.
Low-pressure plasma experiments, in the hollow cathode configuration, offered a perspective for a large area surface damaging. From SEM measurements, we could conclude that both exposed W plates were damaged after plasma exposure. In the case of helium plasma, the surface presents soft erosions all over the plate, while argon plasma had facilitated an intense erosion, making the exposed W plate patterned with mountain-like structures. Further, the profile measurements proved, in terms of roughness, the strong erosion form the exposure to argon plasma. Moreover, we observed an identical phenomenon of the damaged surfaces, for both helium and argon plasma exposures. Mainly in the center of the sample, the roughness is higher (RMSHe = 0.198 µm and RMSAr = 5.09 µm) than in the extremities of the samples (RMSHe = 0.157 µm and RMSAr = 4.12 µm). Moreover, the removed material from the erosion process was collected on substrates at several distances. The predominant morphology of the removed materials is particle-like. XPS analysis confirmed the presence of tungsten in the obtained particles. However, we could observe that helium enhanced the absorption of contaminants and ambient atmosphere elements in particles, though this result is not valid in the case of using argon gas.
Microjet plasma experiments present the damaging phenomena, in a more localized mode, on the exposed surfaces. These results could resemble the ELMs surface damaging phenomena from fusion facilities. For example, for an input power of 20 W, we obtain 215 MW/m2, for an input power of 40 W, we obtain 55 MW/m2, and up to an input power of 100 W, we obtain 44 MW/m2. Also, in large area damaging experiments, we used helium and argon at various input powers. Helium facilitated soft erosions on the exposed surfaces, the formation of fuzz structures at high input powers (100 W), and a low rate of removing of bulk material.
In the case or argon, the erosion spot is better defined and increases with input power. In the margin of the erosion spot, we could identify the formation of various structures: cauliflower particles (at 20 W, 40 W, 60 W, and 80 W) with different shapes, columnar structures, nano-cones (at 40 W), and nanofibers (80 W). The removed material from the exposed tungsten surfaces was collected and analyzed.
In the case of helium, the collected dust is composed from small pieces detached from the bulk material, which is favored by electrode blistering, whereas argon plasma produced particles with a well-defined shape (cauliflower-like shape). XPS measurements made for the particles obtained with argon plasma, and revealed the presence of tungsten and of elements specific ambient atmosphere.
The results show two types of damaging phenomena depending on the input gas. The usage of He leads to the formation of fuzz structures, due to the accumulation of He bubbles in the bulk W material. Erosion/melting/vaporization phenomena were noticed by using Ar gas. Dust is produced and could be collected even at a distance of 40 mm from the erosion place. The obtained dust is oxidized and presents a predominant cauliflower-like shape.
These results could provide support and could be correlated with the events that occur at the wall level in fusion facilities.

Author Contributions

Conceptualization, V.M. and G.D.; methodology, V.M. and G.D.; investigation, V.S., A.B., V.M., and C.S.; writing—original draft preparation, V.M.; writing—review and editing, G.D. and C.G.; visualization, V.M. and V.S.; supervision, G.D.; validation, V.M. All authors have read and agreed to the published version of the manuscript.

Funding

This work was supported by Romanian Ministry of Education and Research, under Romanian National Nucleu Program LAPLAS VI–contract n. 16N/2019. Part of this work has been carried out within the the framework of the Eurofusion consortium and has received funding from the Euratom research and training programme 2014-2018 and 2019-2020 under grant agreement No 633053. The views and opinions expressed herein do not necessarily reflect those of the European Commission. Also, we acknowledge the support in the frame of IFA-CEA project C5-07/2016.

Conflicts of Interest

The authors declare no conflict of interest.

References

  1. Bustreo, C.; Giuliani, U.; Maggio, D.; Zollino, G. How fusion power can contribute to a fully decarbonized European power mix after 2050. Fusion Eng. Des. 2019, 146, 2189–2193. [Google Scholar] [CrossRef]
  2. Grisolia, C.; Rosanvallon, S.; Sharpe, P.; Winter, J. Micro-particles in ITER: A comprehensive review. J. Nucl. Mater. 2009, 386–388, 871–873. [Google Scholar] [CrossRef]
  3. Rubel, M.; Widdowson, A.; Grzonka, J.; Fortuna-Zalesna, E.; Moon, S.; Petersson, P.; Ashikawa, N.; Asakura, N.; Hamaguchi, D.; Hatano, Y.; et al. Dust generation in tokamaks: Overview of beryllium and tungsten dust characterisation in JET with the ITER-like wall. Fusion Eng. Des. 2018, 136, 579–586. [Google Scholar] [CrossRef]
  4. Grisolia, C.; Hodille, E.; Chene, J.; Garcia-Argote, S.; Pieters, G.; El-Kharbachi, A.; Marchetti, L.; Martin, F.; Miserque, F.; Vrel, D.; et al. Tritium absorption and desorption in ITER relevant materials: Comparative study of tungsten dust and massive samples. J. Nucl. Mater. 2015, 463, 885–888. [Google Scholar] [CrossRef]
  5. El-Kharbachi, A.; Chene, J.; Garcia-Argote, S.; Marchetti, L.; Martin, F.; Miserque, F.; Vrel, D.; Redolfi, M.; Malard, V.; Grisolia, C.; et al. Tritium absorption/desorption in ITER-like tungsten particles. Int. J. Hydrogen Energy 2014, 39, 10525–10536. [Google Scholar] [CrossRef]
  6. Humphreys, D.A.; Ferron, J.R.; Hyatt, A.W.; la Haye, R.J.; Leuer, J.A.; Penaflor, B.G.; Walker, M.L.; Welander, A.S.; In, Y. DIII-D integrated plasma control solutions for ITER and next-generation tokamaks. Fusion Eng. Des. 2008, 83, 193–197. [Google Scholar] [CrossRef]
  7. Rowcliffe, A.F.; Garrison, L.M.; Yamamoto, Y.; Tan, L.; Katoh, Y. Materials challenges for the fusion nuclear science facility. Fusion Eng. Des. 2018, 135, 290–301. [Google Scholar] [CrossRef]
  8. Koutsospyros, A.; Braida, W.; Christodoulatos, C.; Dermatas, D.; Strigul, N. A review of tungsten: From environmental obscurity to scrutiny. J. Hazard. Mater. 2006, 136, 1–19. [Google Scholar] [CrossRef]
  9. Shah, V.; van Maris, M.P.F.H.L.; van Dommelen, J.A.W.; Geers, M.G.D. Experimental investigation of the microstructural changes of tungsten monoblocks exposed to pulsed high heat loads. Nucl. Mater. Energy 2020, 22, 100716. [Google Scholar] [CrossRef]
  10. Bannister, M.E.; Meyer, F.W.; Hijazi, H.; Unocic, K.A.; Garrison, L.M.; Parish, M.C. Surface morphologies of He-implanted tungsten. Nucl. Instrum. Methods Phys. Res. B 2016, 382, 76–81. [Google Scholar] [CrossRef] [Green Version]
  11. Sandoval, L.; Perez, D.; Uberuaga, B.P.; Voter, A.F. Formation of helium-bubble networks in tungsten. Acta Mater. 2018, 159, 46–50. [Google Scholar] [CrossRef]
  12. You, J.-H. Mechanics of tungsten blistering: A finite element study. J. Nucl. Mater. 2013, 437, 24–28. [Google Scholar] [CrossRef]
  13. Li, M.; You, J.-H. Mechanics of tungsten blistering II: Analytical treatment and fracture mechanical assessment. J. Nucl. Mater. 2015, 465, 702–709. [Google Scholar] [CrossRef]
  14. Butler, B.G.; Paramore, J.D.; Ligda, J.P.; Ren, C.; Fang, Z.Z.; Middlemas, S.; Hemker, K.J. Mechanisms of deformation and ductility in tungsten—A review. Int. J. Refract. Met. Hard. Mater. 2018, 75, 248–261. [Google Scholar] [CrossRef]
  15. Zhou, H.; Yu, J.; Chen, C.; Zhu, K. Effect of pre-damage induced by argon ions on the deuterium blister formation in tungsten-tantalum alloys exposed to deuterium plasma. Int. J. Hydrogen Energy 2019, 44, 23320–23329. [Google Scholar] [CrossRef]
  16. Dumitru, L.A.; Eftimie, S.; Mihailescu, M.I.; Nita, S.L.; Opris, V.; Racuciu, C. A novel architecture for authenticating scalable resources in hybrid cloud. In Proceedings of the 2016 International Conference on Communications (COMM), Bucharest, Romania, 9–10 June 2016; pp. 251–254. [Google Scholar] [CrossRef]
  17. Dascalescu, A.C.; Boriga, R.; Mihailescu, M.I. A novel chaos-based image encryption scheme. Ann. Univ. Craiova Math. Comput. Sci. Ser. 2014, 41, 47–58, ISSN 1223-6934. [Google Scholar]
  18. Nita, S.L.; Mihailescu, M.I.; Pau, V.C. Security and cryptographic challenges for authentication based on biometrics data. Cryptography 2018, 2, 39. [Google Scholar] [CrossRef] [Green Version]
  19. Mihailescu, M.I.; Racuciu, C.; Grecu, D.L.; Nita, S.L. A multi-factor authentication scheme including biometric characteristics as one factor. Mircea Batran Nav. Acad. Sci. Bull. 2015, 17, 348–353. [Google Scholar]
  20. Nita, S.L.; Mihailescu, M.I. On Artificial Neural Network used in Cloud Computing Security—A Survey. In Proceedings of the 2018 10th International Conference on Electronics, Computers and Artificial Intelligence (ECAI), Iasi, Romania, 28–30 June 2018; pp. 1–6. [Google Scholar] [CrossRef]
  21. Circei, C.; Stoica, C.; Mihailescu, M.I.; Racuciu, C. A new modeling perspective on vocal tract. Mircea Batran Nav. Acad. Sci. Bull. 2016, 19, 354–358. [Google Scholar] [CrossRef]
  22. Nita, S.L.; Mihailescu, M.I. A hybrid searchable encryption scheme for cloud computing. In Innovative Security Solutions for Information Technology and Communications, Proceedings of the SECITC 2018; Lecture Notes in Computer Science; Lanet, J.L., Toma, C., Eds.; Springer: Cham, Switzerland, 2019; Volume 11359. [Google Scholar] [CrossRef]
  23. Wirth, B.D.; Hammond, K.D.; Krasheninnikov, S.; Maroudas, D. Challenges and opportunities of modeling plasma–surface interactions in tungsten using high-performance computing. J. Nucl. Mater. 2015, 463, 30–38. [Google Scholar] [CrossRef] [Green Version]
  24. Parsi, M.; Jatale, A.; Agrawal, M.; Sharma, P. Effect of surface deformation on erosion prediction. Wear 2019, 430–431, 57–66. [Google Scholar] [CrossRef]
  25. Cusentino, M.A.; Hammond, K.D.; Sefta, F.; Juslin, N.; Wirth, B.D. A comparison of interatomic potentials for modeling tungsten–hydrogen–helium plasma–surface interaction. J. Nucl. Mater. 2015, 463, 347–350. [Google Scholar] [CrossRef] [Green Version]
  26. Ito, A.M.; Takayama, A.; Oda, Y.; Tamura, T.; Kobayashi, R.; Hattori, T.; Ogata, S.; Ohno, N.; Kajita, S.; Yajima, M.; et al. Molecular dynamics and Monte Carlo hybrid simulation for fuzzy tungsten nanostructure formation. Nucl. Fusion 2015, 55, 073013. [Google Scholar] [CrossRef]
  27. Ito, A.M.; Yoshimoto, Y.; Saito, S.; Takayama, A.; Nakamura, H. Molecular dynamics simulation of a helium bubble bursting on tungsten surfaces. Phys. Scr. 2014, T159, 014062. [Google Scholar] [CrossRef]
  28. Ito, A.M.; Yoshimoto, Y.; Saito, S.; Takayama, A.; Nakamura, H. Formation of helium induced nanostructure ‘fuzz’ on various tungsten grades. J. Nucl. Mater. 2010, 404, 165–173. [Google Scholar] [CrossRef]
  29. Mayer, M.; Lederer, S. Influence of tungsten fuzz on energy spectra of helium recoiled by 10 MeV oxygen ions. Nucl. Interact. Methods Phys. Res. B 2019, 453, 67–74. [Google Scholar] [CrossRef]
  30. Evans, T.E. ELM mitigation techniques. J. Nucl. Mater. 2013, 438, S11–S18. [Google Scholar] [CrossRef]
  31. Coenen, J.W.; Arnoux, G.; Bazylev, B.; Matthews, G.; Jachmich, S.; Balboa, I.; Clever, M.; Dejarnac, R.; Coffey, I.; Corre, Y.; et al. ELM induced tungsten melting and its impact on tokamak operation. J. Nucl. Mater. 2015, 463, 78–84. [Google Scholar] [CrossRef] [Green Version]
  32. Solano, E.R.; Jachmich, S.; Villone, F.; Hawkes, N.; Corre, Y.; Pitts, R.; Loarte, A.; Alper, B.; Guenther, K.; Koroktov, A.; et al. ELMs and strike point jumps. J. Nucl. Mater. 2005, 337–339, 747–750. [Google Scholar] [CrossRef]
  33. Gauthier, E.; Andrew, P.; Arnoux, G.; Corre, Y.; Roche, H.; JET-EFDA Contributors. Plasma wall interaction during ELMs in JET. J. Nucl. Mater. 2007, 363–365, 1026–1031. [Google Scholar] [CrossRef]
  34. Samaddar, D.; Coster, D.P.; Bonnin, X.; Berry, L.A.; Elwasif, W.R.; Batchelor, D.B. Application of the parareal algorithm to simulations of ELMs in ITER plasma. Comput. Phys. Commun. 2019, 235, 246–257. [Google Scholar] [CrossRef] [Green Version]
  35. Heinola, K.; Ahlgren, T.; Brezinsek, S.; Vuoriheimo, T.; Wiesen, S.; JET Contributors. Modelling of the effect of ELMs on fuel retention at the bulk W divertor of JET. Nucl. Mater. Energy 2019, 19, 397–402. [Google Scholar] [CrossRef]
  36. Pestchanyi, S.; Garkusha, I.; Landman, I. Simulation of tungsten armour cracking due to small ELMs in ITER. Fusion Eng. Des. 2010, 85, 1697–1701. [Google Scholar] [CrossRef]
  37. Sinclair, G.; Gonderman, S.; Tripathi, J.K.; Hassanein, A. Effect of ELM pacing on morphology evolution and erosion of tungsten as a plasma-facing material in a fusion environment. J. Nucl. Mater. 2018, 508, 26–32. [Google Scholar] [CrossRef]
  38. Lunsford, R.; Bortolon, A.; Maingi, R.; Mansfield, D.K.; Nagy, A.; Jackson, G.L.; Osborne, T. Supplemental ELM control in ITER through beryllium granule injection. Nucl. Mater. Energy 2019, 19, 34–41. [Google Scholar] [CrossRef]
  39. Lemahieu, N.; Balden, M.; Elgeti, S.; Greuner, H.; Linke, J.; Maier, H.; Pintsuk, G.; Wirtz, M.; Van Oost, G.; Noterdaeme, J.-M. H/He irradiation on tungsten exposed to ELM-like thermal shocks. Fusion Eng. Des. 2016, 109–111, 169–174. [Google Scholar] [CrossRef]
  40. Knolker, M.; Evans, T.E.; Wingen, A.; Bortolon, A.; Chrystal, C.; Laggner, F.; Moyer, R.A.; Nazikian, R.; Zohm, H. Observation of divertor currents during type-I ELMs on the DIII-D tokamak. Nucl. Mater. Energy 2019, 18, 222–226. [Google Scholar] [CrossRef]
  41. Spolaore, M.; Kovarik, K.; Stockel, J.; Adamek, J.; Dejarnac, R.; Ďuran, I.; Komm, M.; Markovič, T.; Martines, E.; Panek, R.; et al. Electromagnetic ELM and inter-ELM filaments detected in the COMPASS Scrape-Off Layer. Nucl. Mater. Energy 2017, 12, 844–851. [Google Scholar] [CrossRef]
  42. Diez, M.; Firdaouss, M.; Richou, M.; Bultel, A.; Perry, F.; Roche, H.; Grisolia, C.; Missirlian, M. Tungsten coatings repair: An approach to increase the lifetime of plasma facing components. Fusion Eng. Des. 2019, 146, 800–804. [Google Scholar] [CrossRef]
  43. Brezinsek, S.; Coenen, J.W.; Schwarz-Selinger, T.; Schmid, K.; Kirschner, A.; Hakola, A.; Tabares, F.L.; van der Meiden, H.J.; Mayoral, M.-L.; Reinhart, M.; et al. Plasma–wall interaction studies within the EUROfusion consortium: Progress on plasma-facing components development and qualification. Nucl. Fusion 2017, 57, 116041. [Google Scholar] [CrossRef] [Green Version]
  44. Ueda, Y.; Miyata, K.; Ohtsuka, Y.; Lee, H.T.; Fukumoto, M.; Brezinsek, S.; Coenen, J.W.; Kreter, A.; Litnovsky, A.; Philipps, V.; et al. Exposure of tungsten nano-structure to TEXTOR edge plasma. J. Nucl. Mater. 2011, 415, S92–S95. [Google Scholar] [CrossRef]
  45. El-Atwani, O.; Gonderman, S.; Efe, M.; De Temmerman, G.; Morgan, T.; Bystrov, K.; Klenosky, D.; Qiu, T.; Allain, J.P. Ultrafine tungsten as a plasma-facing component in fusion devices: Effect of high flux, high fluence low energy helium irradiation. Nucl. Fusion 2014, 54, 083013. [Google Scholar] [CrossRef]
  46. Wirtz, M.; Berger, M.; Huber, A.; Kreter, A.; Linke, J.; Pintsuk, G.; Rasinski, M.; Sergienko, G.; Unterberg, B. Influence of helium induced nanostructures on the thermal shock performance of tungsten. Nucl. Mater. Energy 2016, 9, 177–180. [Google Scholar] [CrossRef] [Green Version]
  47. Stancu, C.; Stokker-Cheregi, F.; Moldovan, A.; Dinescu, M.; Grisolia, C.; Dinescu, G. Modification of W surfaces by exposure to hollow cathode plasmas. Appl. Phys. A 2017, 123, 618. [Google Scholar] [CrossRef]
  48. Stokker-Cheregi, F.; Acsente, T.; Enculescu, I.; Grisolia, C.; Dinescu, G. Tungsten and Aluminium nanoparticles synthesized by laser and ablation in liquids. Dig. J. Nanomater. Biostruct. 2012, 7, 1569–1576. [Google Scholar]
  49. Acsente, T.; Negrea, R.F.; Nistor, L.C.; Matei, E.; Grisolia, C.; Birjega, R.; Dinescu, G. Tungsten nanoparticles with controlled shape and crystallinity obtained by magnetron sputtering and gas aggregation. Mater. Lett. 2017, 200, 121–124. [Google Scholar] [CrossRef]
  50. Marascu, V.; Lazea-Stoyanova, A.; Bonciu, A.; Satulu, V.; Dinescu, G. Tungsten particles fabrication by a microjet discharge. Mater. Res. Express 2020, 7, 066509. [Google Scholar] [CrossRef]
  51. Marascu, V.; Lazea-Stoyanova, A.; Stancu, C.; Dinescu, G. The influence of plasma operation parameters on synthesis process of copper particles at atmospheric pressure. Plasma Process. Polym. 2018, 15, 1700091. [Google Scholar] [CrossRef]
  52. Teodorescu, M.; Bazavan, M.; Ionita, E.R.; Dinescu, G. Characterization of an argon radiofrequency plasma jet discharge continuously passing from low to atmospheric pressure. Plasma Sources Sci. Technol. 2012, 21, 055010. [Google Scholar] [CrossRef]
Figure 1. Schematic views of: (a) Hollow-Cathode setup configuration, and (b) Microjet discharge configuration.
Applsci 10 06870 g001
Figure 2. Example of Ar plasma exposed W plate; defining the measured regions.
Applsci 10 06870 g002
Figure 3. SEM images illustrating change of the initial W surface morphology by exposure to Hollow-Cathode discharges to He and Ar plasmas.
Applsci 10 06870 g003
Figure 4. Profiler surface analyses (RMS and 3D views)-W plates in Hollow-Cathode discharge: (a) the left-side point of the W sample exposed to He plasma; (b) the center point of the W sample exposed to He plasma; (c) right-side point of the W sample exposed to He plasma; (d) the left-side point of the W sample exposed to Ar plasma; (e) the center point of the W sample exposed to Ar plasma; (f) right-side point of the W sample exposed to Ar plasma.
Applsci 10 06870 g004
Figure 5. SEM images of W dust obtained in Hollow-Cathode discharge: (a) He discharge; (b) Ar discharge; and (c) Particles size distributions for Ar discharge.
Applsci 10 06870 g005
Figure 6. Example of erosion/melting/vaporization damage of W electrode exposed at a microjet discharge in Ar at Prf = 20 W, p = 1000 mbar, t = 30 min.
Applsci 10 06870 g006
Figure 7. SEM images of W surface electrodes exposed to atmospheric pressure He-MD for 20 W–100 W.
Applsci 10 06870 g007
Figure 8. SEM images of W surface electrodes exposed to Ar-MD for 40 W–100 W.
Applsci 10 06870 g008
Figure 9. Margin zone_SEM images of W surface electrodes exposed to Ar-MD.
Applsci 10 06870 g009
Figure 10. Margin zone_SEM images of W surface electrodes exposed to Ar-MD: (a) combinations between cauliflower and solidified droplets shapes, (b) columns structures and (c) nano-cone structures.
Applsci 10 06870 g010
Figure 11. Margin zone_SEM images of W surface electrodes exposed to Ar-MD.
Applsci 10 06870 g011
Figure 12. Margin zone_SEM images of W surface electrodes exposed to Ar-MD: (a) Particles; (b) nanofibers.
Applsci 10 06870 g012
Figure 13. Margin zone_SEM images of W surface electrodes exposed to Ar-MD.
Applsci 10 06870 g013
Figure 14. SEM images of W dust obtained in Microjet Discharge: (a) He discharge; (b) Ar discharge; and (c) Particles size distributions for Ar discharge.
Applsci 10 06870 g014
Figure 15. XPS Survey spectra of the obtained particles: (a) He-HC configuration; (b) Ar-HC configuration.
Applsci 10 06870 g015
Figure 16. XPS analysis of the obtained particles in He-HC and Ar-HC discharges: The influence of distance upon W4f and O1s atomic concentrations.
Applsci 10 06870 g016
Figure 17. XPS analysis of the obtained particles in HC discharge for Ar and He plasmas: The influence of distance upon W4f zone: (a) W4f deconvolution of He-HC at 10 mm; (b) W4f zone of He-HC for 6–40 mm; (c) W4f zone of Ar-HC for 6–40 mm.
Applsci 10 06870 g017
Figure 18. XPS Survey spectra of particles obtained in Ar-MD configuration.
Applsci 10 06870 g018
Figure 19. XPS analysis of the obtained particles in Ar-MD configuration: The influence of input power upon W4f zone: (a) W4f deconvolution of Ar-MD at 20 W; (b) W4f zone of Ar-MD for 20 W–100 W.
Applsci 10 06870 g019
Table 1. Atomic concentrations of the obtained particles in He-HC and Ar-HC.
DistanceAt (%) (He-HC)At (%) (Ar-HC)
W4fC1sN1sO1sW4fC1sN1sO1s
6 mm34.48 ± 0.2915.62 ± 0.6418.75 ± 0.5330.94 ± 0.3242.23 ± 0.24/7.03 ± 2.1350.74 ± 0.20
10 mm27.35 ± 0.3716.67 ± 0.609.49 ± 1.5846.48 ± 0.2232.88 ± 0.30/5.2 ± 2.8861.91 ± 0.16
20 mm12.75 ± 0.7818.45 ± 0.5415.74 ± 0.6453.06 ± 0.1951.60 ± 0.19/4.62 ± 3.2543.78 ± 0.23
40 mm26.99 ± 0.3730.53 ± 0.3310.36 ± 0.9732.12 ± 0.3161.27 ± 0.16/6.18 ± 2.4332.55 ± 0.31
Table 2. Atomic concentrations of the obtained particles in Ar-MD configuration.
Power(RF)At (%) (Ar-MD)
W4fC1sN1sO1s
20 W26.86 ± 0.3712.07 ± 0.836.27 ± 2.3954.8 ± 0.18
40 W20.29 ± 0.4918.99 ± 0.537.28 ± 2.0653.44 ± 0.19
60 W19.65 ± 0.5126.42 ± 0.387.45 ± 2.0146.48 ± 0.22
80 W21.13 ± 0.4719.18 ± 0.526.06 ± 2.4853.63 ± 0.19
100 W21.13 ± 0.4717.32 ± 0.589.26 ± 1.6252.28 ± 0.19

