Abstract
Fundus blood vessel image segmentation plays an important role in the diagnosis and treatment of diseases and is the basis of computer-aided diagnosis. Feature information from the retinal blood vessel image is relatively complicated, and the existing algorithms are sometimes difficult to perform effective segmentation with. Aiming at the problems of low accuracy and low sensitivity of the existing segmentation methods, an improved U-shaped neural network (MRU-NET) segmentation method for retinal vessels was proposed. Firstly, the image enhancement algorithm and random segmentation method are used to solve the problems of low contrast and insufficient image data of the original image. Moreover, smaller image blocks after random segmentation are helpful to reduce the complexity of the U-shaped neural network model; secondly, the residual learning is introduced into the encoder and decoder to improve the efficiency of feature use and to reduce information loss, and a feature fusion module is introduced between the encoder and decoder to extract image features with different granularities; and finally, a feature balancing module is added to the skip connections to resolve the semantic gap between low-dimensional features in the encoder and high-dimensional features in decoder. Experimental results show that our method has better accuracy and sensitivity on the DRIVE and STARE datasets (accuracy (ACC) = 0.9611, sensitivity (SE) = 0.8613; STARE: ACC = 0.9662, SE = 0.7887) than some of the state-of-the-art methods.
1. Introduction
Retinal blood vessel images are often used by doctors as a window to observe the response of various diseases, such as hypertension, coronary heart disease, and diabetes, and vessel abnormalities can reflect the severity of these diseases. Retinal blood vessels are the only blood vessels in the human body that can be obtained without trauma. The fundus camera can directly take images of fundus blood vessels and can respond clearly to microvessels and lesions. Therefore, the research of fundus images has important medical application value. In order to make an effective diagnosis of the disease, it is necessary to accurately segment blood vessels in the fundus. However, because the retinal blood vessel image may have problems such as lesions, uneven lighting, noise, and low contrast between small blood vessels and the background, it is difficult to completely segment the fundus blood vessel image. Therefore, fundus blood vessel image segmentation has become a hot topic at home and abroad.
In recent years, many scholars have conducted extensive and in-depth research on automatic segmentation of fundus blood vessel images and have proposed many segmentation methods. These algorithms can be divided into supervised segmentation and unsupervised segmentation based on whether a gold standard image is required. Unsupervised fundus vascular segmentation does not require a gold standard image as a segmentation standard. For example, Dash et al. [1] proposed a morphological-based fundus image segmentation technology, which can use Kirsch edge detection method to identify retinal vein from retinal image. The advantage of the method is that it can identify the vasculature devoid of any tiny information, but the disadvantage is that the segmentation of microvascular is insufficient. A matching filtering method designed by Zhang et al. [2] used a multi-scale second-order Gaussian derivative filter and performs filtering in the direction score domain to obtain the maximum response. This method has a good effect in dealing with complex vessels, but there is a phenomenon of error segmentation. Abdallah et al. [3] employed a multi-scale tracking method based on Heisson matrix feature vectors and gradient information. This method can extract blood vessels, especially small blood vessels, at different resolutions. Although many scholars have conducted in-depth research on the unsupervised segmentation method, its segmentation effect still needs to be improved. Compared with the unsupervised segmentation method, the supervised segmentation method can segment the fundus blood vessel images more effectively. For supervised fundus blood vessel image segmentation, before being able to use end-to-end deep learning methods for feature learning, researchers must manually extract image features based on prior knowledge of the image. Orlando et al. [4], for example, adopted multi-scale linear detector response and two-dimensional wavelet responses on the green channel as features, used structured output support vector machine to train parameters of a fully connected conditional random field model, and then used the trained conditional random field to segment blood vessels. This method can effectively improve the performance index, but there will be error segmentation in the bright central reflection area. Wang et al. [5] proposed a supervised learning method based on multi-feature and multi-classifier fusion to segment retinal vessels. Four types of features were extracted, and the results of decision tree and AdaBoost classifier were fused together to make a joint decision. This method can effectively improve the accuracy and sensitivity of segmentation, but it needs to be improved compared with the deep learning method. Although the above method has achieved certain effects, the extraction of artificial features requires a wealth of prior knowledge, and it has a large subjectivity for feature extraction, so it may cause problems such as insufficient microvessel segmentation and incorrect segmentation.
The core idea of deep learning is to extract the main representation features from the original data through a series of nonlinear transformations. This feature is multi-level and multi-angle, which also makes the features extracted by deep learning method have stronger generalization and expressive ability, which is exactly what the image segmentation process needs. Convolutional neural network, as an effective deep learning model of image segmentation, has been widely concerned by researchers. Gu et al. [6] proposed a context encoder network (CE-Net) to capture more high-level information, to save spatial information, and to be used for 2D medical image segmentation. Although this method has certain effects on various medical data sets, its accuracy still needs to be improved. Zhou et al. [7] Proposed a neural network structure, UNET + +, for semantic and instance segmentation. By using nested structure and improved hop connection structure, the segmentation performance of the model is effectively improved. The disadvantage of the model is that the parameters increase greatly compared with the original model. Soomro et al. [8] employed a fundus vessel segmentation method based on deep convolutional neural network (CNN). Firstly, image enhancement was performed using fuzzy logic and image processing strategy, and then, an encoding and decoding CNN model with skip connection structure was proposed for retinal blood vessel segmentation.This method can effectively improve the contrast between blood vessel and background, but there is over-segmentation in the segmentation process. Kumawat et al. [9] adoped an improved local phase unit (ReLPU), which is an efficient and trainable convolution layer. When the ReLPU layer is used at the top of the U-Net segmentation network, it can effectively improve the segmentation performance of the U-Net model. The disadvantage of this method is that it cannot segment the microvessels effectively. Tamim et al. [10] proposed an improved Multi-Layer Perceptron (MLP) neural network that can automatically extract and distinguish blood vessels and background pixels in fundus images. This method has strong robustness, but the model is more complex. Cheng et al. [11] used an improved U-Net model, that is, adding dense block structures to the original model, which can effectively improve the accuracy, but the segmentation sensitivity needs to be improved. Francia et al. [12] proposed a double U-Net model structure of fundus image segmentation method. This method uses two U-Net models; the second U-Net model adds residual structure. By adding the information flow extracted from the first U-Net model to the second model, information loss can be effectively avoided. Pan et al. [13] developed an improved U-Net model for retinal vascular segmentation. This method adds the Resnet module to the original structure, which solves the problem that the traditional U-Net model cannot deepen. However, the segmentation results show that the method cannot effectively segment the peripheral blood vessels. Li et al. [14] used a new Resnet module to improve the U-Net. By adding more Resnet modules, the network layer can be deepened, so the model can extract features better. However, with the deepening of the network, the model becomes more complex.
Based on the above problems, such as discontinuous segmentation, difficult segmentation of microvesselss and complex segmentation models, we propose a MRU-Net deep learning model structure, i.e., a multi-scale residual U-shaped network model. The main work of our paper is as follows:
- In MRU-Net, we add a multi-scale feature fusion module in the transition phase between the encoder and decoder and extract the feature information with different granularities using multi-scale dilated convolutions, so as to improve the model’s understanding of context information and to improve the model’s segmentation ability for microvessels.
- In MRU-Net, we add a feature balance module in the skip connection between the encoder and decoder to solve the problem of possible semantic gaps between low-dimensional features in the encoder and high-dimensional features in the decoder.
2. Proposed Method
As shown in Figure 1, the retinal vessel segmentation framework proposed in this paper is divided into two stages, namely training stage and testing stage. The overall process are as follows:
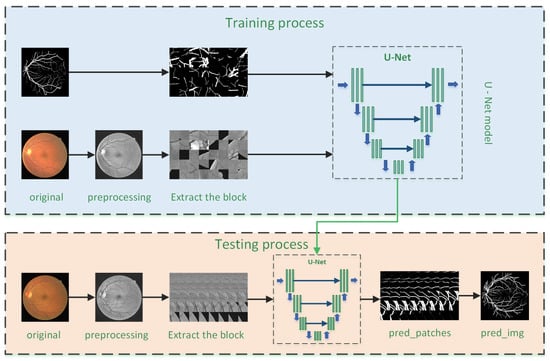
Figure 1.
Overview of the architecture framework: the upper part shows the training process of the model; the lower part shows the test process of the model.
- Data preprocessing: The original retinal blood vessel image cannot be effectively segmented due to factors such as uneven illumination, low noise, and low contrast. Therefore, image preprocessing is required before training to ensure the maximum possible increase in contrast between the retinal blood vessels and the background, thereby effectively improving the segmentation effect.
- Data expansion: Supervised segmentation training requires manual segmentation of images as labels, so data acquisition is difficult, resulting in insufficient training data for deep learning training. To solve this problem, we randomly divided each preprocessed image data into many smaller image blocks to achieve the purpose of expanding the data set.
- Model training: The image block is divided into a training set and validation set according to the ratio of 9:1. The training set is used as the input of U-Net model, and the corresponding gold standard image block is used as the label. The gradient descent method is used to train the model. According to the training effect of the training set and validation set, the model is continuously optimized until the model reaches the optimum.
- Effect test: Firstly, preprocess the test data in the same way; secondly, orderly segment the test image; then, input the segmented image blocks into the trained U-Net model to obtain the corresponding segmentation results; and finally, the segmentation results of each image block are combined to obtain a complete retinal blood vessel segmentation image.
2.1. Image Preprocessing
2.1.1. Data Set
We used two datasets for validation experiments: the DRIVE dataset and STARE dataset.
The DRIVE dataset was derived from the Dutch Diabetic Retinopathy Screening Project [15], in which 400 subjects were aged between 25 and 90 years. The DRIVE dataset randomly selected 40 retinal blood vessel images, of which 20 were used as the training set and 20 were used as the training set. Each image is 584 × 565 in size, and each image has a corresponding expert manual segmentation result and mask image.
The STARE dataset is from the University of California, San Diego [16]. It contains 20 retinal blood vessel images with a size of 700 × 605, 10 healthy images, and 10 pathological images, and each image is provided with a corresponding expert manual segmentation result image.
Figure 2 is a data example of the two datasets, and the three columns are original fundus blood vessel image, manual segmentation of blood vessels, and masks. Since the masks are not given by STARE, we manually created masks among them.
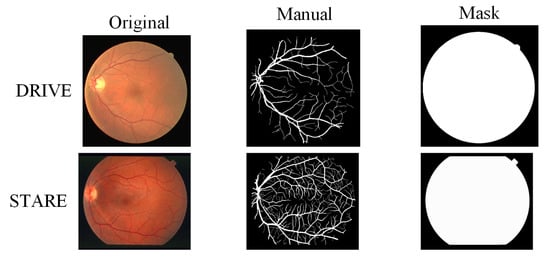
Figure 2.
Data example: the images from left to right are the original image, the manually segmented label, and the mask image.
2.1.2. Image Enhancement
Original retinal blood vessel image data are three-channel image data. Due to the optical effect when taking pictures, contrast between the blood vessels and the background in the fundus image is low, so it cannot effectively distinguish the fundus blood vessels from the background image. Image enhancement preprocessing can effectively enhance the contrast between retinal blood vessels and the background. The image enhancement preprocessing process is divided into the following four types:
- Through the contrast experiment, the green channel of the retinal blood vessel image has a higher contrast, so the fundus blood vessel image of the green channel is selected for experiments.
- The green channel image is processed for data standardization, and the conversion formula is as follows:where is the current pixel value, is the minimum pixel value, and is the maximum pixel value.
- Limited contrast histogram (CLAHE) is used to equalize the normalized image, thereby increasing the contrast between the blood vessel and the background image and making the image easier to segment.
- Gamma adaptive correction is performed according to different pixel characteristics of blood vessels and background images, thereby suppressing uneven light and centerline reflection in the fundus image, and the gamma value was set to 1.2.
The top-down images in Figure 3 are DRIVE and STARE data images, respectively. From left to right: the first column is the original image, and columns 2–5 are the green channel image, the normalized image, the Clahe equalized image, and the gamma locally adaptive correction image, respectively.
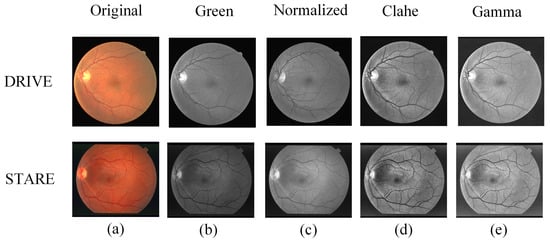
Figure 3.
Examples of parts of the image enhancement process: (a) original image, (b) green channel, (c) normalized, (d) Clahe processing results, and (e) gamma processing results.
2.1.3. Image Expansion
Due to the complexity of manual segmentation of retinal blood vessels, the number of existing images is very scarce, and deep learning is a complex model structure trained based on a large amount of data. When the number is small, the model will be overtrained, which will lead to overfitting. In this paper, the original image data is randomly divided into smaller image blocks to increase the amount of training data.
We randomly cut the original image into 48 × 48 image blocks. The original high-dimensional pixel image segmentation into many low-dimensional pixel images has two main advantages. On the one hand, the high-dimensional image segmentation into more low-dimensional image blocks can effectively play a role in expanding the data, thereby avoiding overfitting caused by a small amount of data. On the other hand, compared with high-dimensional images, the complexity of model design based on low-dimensional image blocks is lower because the U-Net model of low-dimensional images does not need to design deeper layers to extract complex high-dimensional image features and it also effectively reduces the loss of image information caused by the deepening of the model. Figure 4 is an example of several image blocks randomly extracted from the preprocessed DRIVE fundus image.
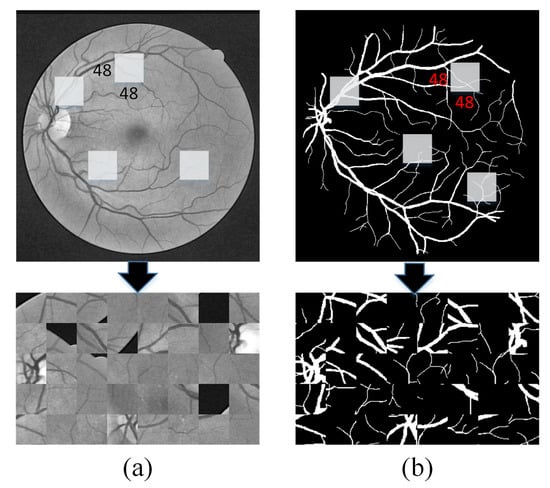
Figure 4.
Samples of random segmentation: (a) randomly extract 48 × 48 patch image blocks from the preprocessed image and (b) the corresponding label from the gold standard image.
2.2. MRU-Net Structure
U-Net [17] has a good effect in the field of medical image segmentation, and many scholars have made different improvements on the segmentation of U-Net network in medical images. The limitation of U-Net and its variants is that. in order to learn more abstract feature information in an image, continuous convolution and pooling operations will be performed, but resolution of image features will be reduced with the deepening of the network. The intuitive expression is that, as the network level deepens, the detailed information in the image will be seriously lost. Based on this, we designed a new U-Net structure, namely MRU-Net. As showned in Figure 5, the proposed model is mainly composed of three modules: a feature encoder–decoder module, a multi-scale feature fusion module, and a skip connection module.
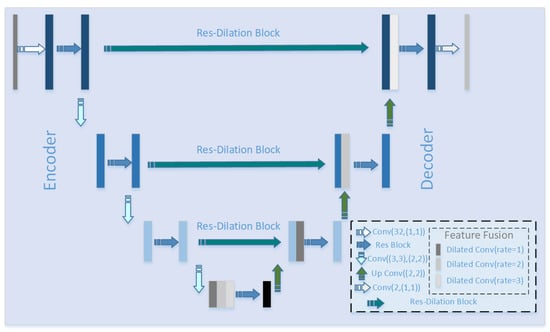
Figure 5.
Improved U-shaped neural network (MRU-Net) structure: the structure of the MRU-Net model is described in the lower right corner of the figure, including the methods used for encoder–decoder, feature fusion, and skip connection.
2.2.1. Encoder–Decoder Structure
In the traditional U-Net structure, each block in the encoder and decoder contains two convolution layers and a pooling layer, but frequent convolution and pooling will cause the image to lose more semantic information. As the depth of the network deepens, the phenomenon of gradient disappearance may occur. In order to avoid the gradient disappearing and speeding up network convergence, the traditional convolution module is replaced by the Resnet module. In addition, the convolution operation with a step size of 2 is used to replace the traditional pooling operation in order to reduce the loss of image information as much as possible. The feature map obtained by the convolution operation has the same dimensions as the feature map obtained by the traditional pooling method.
Figure 6 shows the proposed Res-Block structure. Among them, dropout is used to randomly inactivate some neurons to prevent overfitting during model training; Batch Normalization (BN) is used to normalize the activation value of hidden layer neurons, which can prevent the gradient vanishing due to noise in the retina and can improve the expression ability of the model; each convolutional layer in the paper uses linear correction units for feature extraction. Relu can effectively reduce the complexity of the network and increase the convergence rate of the network. Its formula is as follows:
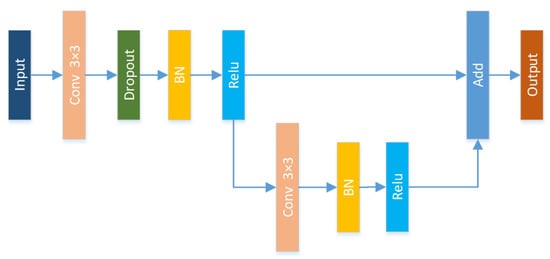
Figure 6.
Res-Block structure: each convolution process includes three processes: dropout, BN, and relu.
2.2.2. Feature Fusion Module
Medical image segmentation is different from traditional scene segmentation and has higher requirements for fine-grained segmentation. The retinal blood vessel image is more complicated, and the difference is large in different parts, such as the main part of the blood vessel and microvessel part. We propose a multiscale dilated convolution [18] fusion method. The fusion method mainly relies on different dilation rates to provide multiple effective fields of view, thereby detecting segmented objects of different sizes. In mathematics, the dilated convolution calculation under two-dimensional signals is shown as follows:
Among them, x is the input feature map, w is the filter, and r is the expansion rate, which determines the stride of sampling the input signal. It is equivalent to convoluting input x with upsampled filters produced by inserting zeros between two consecutive flter values along each spatial dimension. The schematic diagram of the dilated convolution is shown in Figure 7.
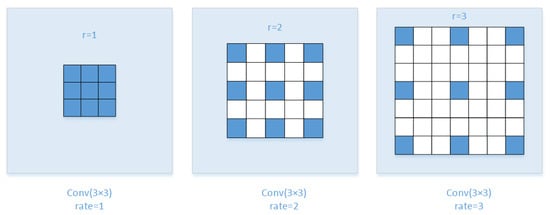
Figure 7.
Schematic diagram of dilated convolution.
Context semantic information is mainly determined by the size of the receiving domain. If the receiving domain can provide more abundant information, then more context information can be used. Pooling operations are usually used to increase the receptive field to extract image features at different scales, but the pooling operation also brings loss of image semantic information. In order to overcome this shortcoming and to effectively extract image features of different dimensions, we have adopted the dilated convolution operation mentioned above. Dilated convolution can expand the receptive field arbitrarily without the need to introduce additional parameters and can use the context information of the image, so it is very suitable for multi-scale image segmentation tasks.
Our proposed multi-scale feature fusion module is shown in Figure 8. Generally, the convolution of a larger receptive domain can extract more abstract features of a large object, while the convolution of a small receptive domain is better for small objects. We use three branches to receive the semantic information in the encoder module. Firstly, the dilated rate in the dilated convolution is set to 1, 2, and 3 to expand the receptive field, thereby extracting feature information of different scales in the encoder module; then, the image semantic features extracted from different dilated rates are combined; and finally, in order to reduce the parameters and computational complexity, the Conv (1 × 1) convolution operation is used to reduce the channel dimension of the feature map to 1/3 of the original dimension.
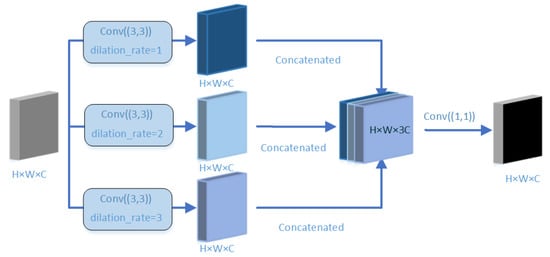
Figure 8.
Feature fusion: first, different dilated convolution rates are used for feature extraction, and then, a 1 × 1 convolution operation is used to reduce the feature map, thereby reducing computational complexity.
2.2.3. Res-Dilated Block
One of the main features of the U-Net model is the addition of a skip connection structure between the encoder and decoder. Decoding is a process of recovering coding sampling, in which there will inevitably be loss of information. The addition of a skip connection structure can supplement the original information in the coding structure to the decoding structure, which helps to supplement the lost semantic information.
Because the U-Net model is a deep structure, as the depth of the model increases, the extraction of image feature information will become more abstract. Ibtehaz et al. [19] have shown that, if skip connection is directly used to merge low-dimensional image information and high-dimensional image information, a semantic gap may be generated due to the large difference between image features, which will affect the segmentation effect. Based on this, in the skip connection, we add the Res-Dilated module that combines the residual network and dilated convolution. On the one hand, the high-dimensional representation information of the image is extracted, and on the other hand, the detailed representation information in the receptive field extraction image is increased. The Res-Dilated structure is shown in Figure 9.
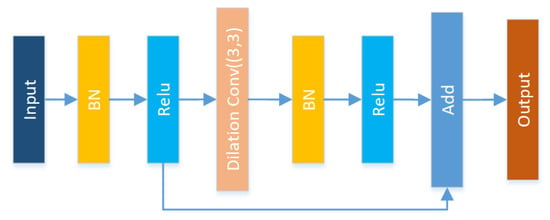
Figure 9.
Res-Dilated block: adding an dilated convolution structure to Resnet.
2.2.4. Loss Function
In U-Net model training, the loss function we use is a binary cross-entropy loss function. The formula of the loss function is designed as follows:
Among them, is the expected output, that is, the real data label, and the value is ; is the actual output, and the value is . In the U-Net network training process, in order to improve its training performance and to obtain better segmentation results, we use Adaptive Moment Estimation (Adam) with the Nesterov momentum term as the optimization algorithm of the model training process. Compared with traditional optimization algorithms, the Adam optimizer has the advantages of high computing efficiency, small memory consumption, and adaptive adjustment of the learning rate. It can also better process noise samples and has a natural annealing effect.
3. Experiment
We used DRIVE and STARE as datasets, where DRIVE contained 40 images (20 training and 20 test images) and STARE contained 20 images (10 training and 10 test images). We extracted the training image with 48 × 48 pixels, and DRIVE randomly extracts about 190,000 image blocks while STARE randomly extracts about 181,500 image blocks. The extracted image blocks were used as the input of the model, 90% of them were used for training data, and 10% of them were used as validation data. In the test set, the image blocks with pixel values of 48 × 48 were moved with the height and width of 5 pixels to extract the image blocks in the test set. The number of training epochs was 20, and the batch size was 64. The environment of this experiment was set up on a Linux system. Network construction and experimental tests were implemented based on Keras and TensorFlow. The GPU configuration was GTX 1080Ti. In the experiment, the parameter quantity of the model was 942,020, and the parameter size was about 3.59 M. The training time of each epoch was about 47 s, the total training time was about 15.6 min, and the total test time was about 53 s.
3.1. Evaluation Indicators
For retinal blood vessel image segmentation, the pixels in the image were actually divided into a blood vessel image and a background image. In order to make a qualitative evaluation of the experimental results of this article, we used several general retinal vessel segmentation performance evaluation indicators:
- Sensitivity (SE): The ratio of the total number of correctly segmented blood vessel pixels to the total number of manually segmented blood vessel pixels.
- Accuracy (ACC): The ratio of the total number of correctly segmented blood vessels and background pixels to the pixels of the entire image.
- precision: The ratio of the actual blood vessel pixels in the segmented blood vessel pixels.
- F1 value: The result of combining sensitivity and precision. When the F1 value is high, the method is more effective.
- Area Under Curve (AUC): The area under the receiver operating characteristic (ROC) curve. The larger the value, the better the segmentation effect.Among them, , , , and respectively represent true positive, true negative, false positive, and false negative.where G is the set of ground truth pixels and P is the set of predicted pixels.
3.2. Experimental Results
3.2.1. Subjective Assessment Results
We performed experiments on two databases: DRIVE and STARE. Several sets of images were randomly selected from the test results of the two databases. Figure 10 and Figure 11 show the intuitive effects of the method in this paper. In the figure, the DRIVE data image and the STARE data image are respectively from top to bottom. Among them are (a) preprocessed images, (b) gold standard images manually segmented by experts, (c) images obtained by segmentation using U-Net models, and (d) images segmented by our proposed method.
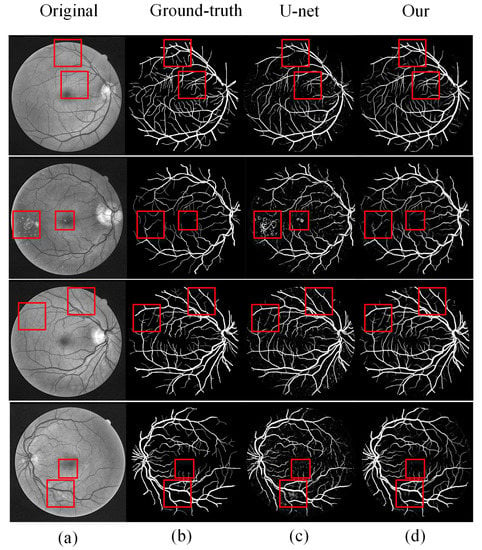
Figure 10.
Comparison of DRIVE segmentation results: (a) original image, (b) ground-truth, (c) U-Net segmentation results, and (d) MRU-Net segmentation results.
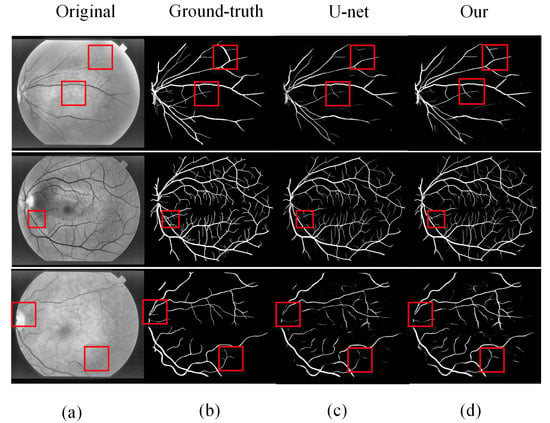
Figure 11.
Comparison of STARE segmentation results: (a) original image, (b) ground-truth, (c) U-Net segmentation results, and (d) MRU-Net segmentation results.
DRIVE analysis: the first and third lines in Figure 10 are two normal retinal images. On the whole, our proposed method achieves better results than the U-Net model, especially in some details, our method has better segmentation results. The first line in the figure marks some details of the differences. It can be seen that the result of U-Net model segmentation has a problem of blood vessel rupture, and our proposed method solves this problem well; as can be seen from the third line of the figure, compared with the U-Net model, our method has a better effect on the segmentation of microvessels and the small vessels have been completely retained. The images in the second and fourth rows of the figure have noise caused by the lesion. The U-Net model is sensitive to noisy data, resulting in a poor segmentation effect. The segmentation effect proposed in this paper also has a more effective segmentation effect in the face of noisy data.
STARE analysis: the three lines of image data in Figure 11 indicate the comparison of the segmentation effects of the U-Net model and the method in this paper. In the first and third rows, U-Net has segmentation breakage and missing vessel segmentation problems; the second line of the retinal blood vessel image is more complicated, and there are many microvessels. Our proposed method also has good results in the face of complex blood vessel images. From this, we can see that our proposed method have a better solution to the problem of microvessel and blood vessel rupture and can perform more coherent and effective segmentation of microvessel.
In order to show the effect of our proposed method more intuitively, the ROC curves of the two data sets shown in Figure 12 are given. From the ROC curve, it can be intuitively seen that the algorithm in this paper has a higher true positive rate and a lower false positive rate and that the blood vessel segmentation error is smaller.
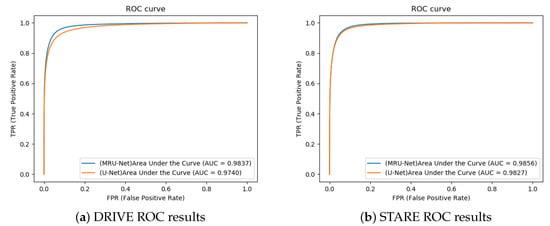
Figure 12.
ROC curve: (a) DRIVE ROC results and (b) STARE ROC results.
3.2.2. Indicator Evalution Results
We conducted two comparative experiments, including (a) model structure comparison and (b) comparison of methods.
In order to explore the improvement effect of the model, the experimental results of different model structures were compared and analyzed, aiming to explore the influence of the improvement of each module on the experimental model. As shown in Figure 13 and Figure 14, Non-FF indicates the experimental results without feature fusion, Non-RD refers to the experimental effect without the Res-Dilated module, and Non-R refers to the experimental results without the Resnet module for encoder and decoder. Through the comparison of experimental results, it can be found that adding feature fusion module can effectively improve the sensitivity (SE) of model segmentation and that the fundus image can be more detailed and effective segmentation; the addition of the Res-Dilated module and Resnet module can reduce the semantic gap between encoder and decoder and effectively improve the transmission of features and reduce the loss of features, so that the overall evaluation index of the model is also improved. On the other hand, although the Resnet and Res-Dilated methods can improve the model, the most significant improvement is the addition of the feature fusion method. Because the size of blood vessels in fundus retinal images is different, the motivation of multi-scale information fusion design is to use different expansion rates to capture multi-scale features, so it can effectively retain the information of microvessels, thus improving the detection accuracy of vascular edges and microvessels. From the data point of view, the value of sensitivity (SE) has been significantly improved, which also reflects that the feature fusion method designed by us improves the segmentation accuracy of more blood vessels.
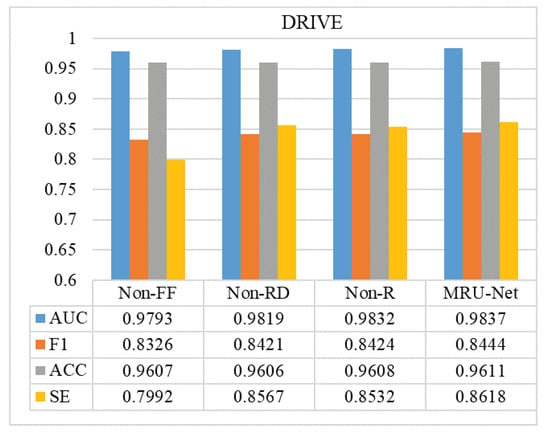
Figure 13.
Comparison of DRIVE results: comparison of the indexes of different model structures in our proposed method.
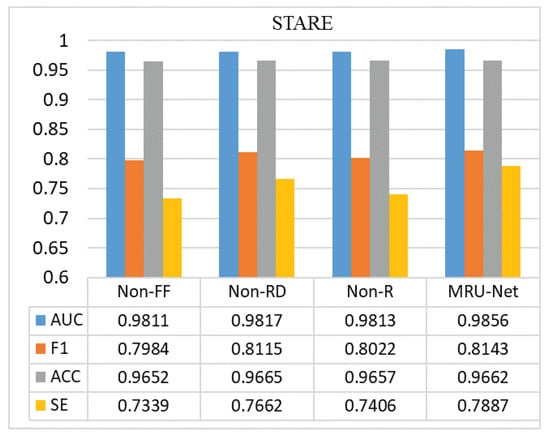
Figure 14.
Comparison of STARE results: comparison of the indexes of different model structures in our proposed method.
In addition, in order to evaluate the effectiveness of our method, the AUC value, F1 value, sensitivity, and accuracy of this method and other methods are compared. Table 1 and Table 2 show the comparison results of this method and other methods. In the DRIVE dataset, the AUC, F1, sensitivity, and accuracy of the proposed method segmentation results reached 0.9837, 0.8444, 0.8618, and 0.9611, respectively. Among them, the AUC, F1, and SE achieved the best results. Compared with other methods, the accuracy rate also has a higher improvement effect, which is only slightly lower than that in [20]. In the STARE dataset, the AUC value, F1 value, sensitivity, and accuracy of the proposed method segmentation results reached 0.9856, 0.8143, 0.7887, and 0.9662, respectively. Among them, the AUC and F1 reached the optimums, ACC was slightly lower than Xiao et al. [20], SE was slightly lower than Lu et al. [21], and good segmentation results are obtained in general. In addition, the confidence ranges of the accuracy of DRIVE and STARE are [0.9604, 0.9625] and [0.9647, 0.9671], respectively.

Table 1.
Evaluation of DRIVE Results.

Table 2.
Evaluation of STARE Results.
We performed t-tests for each performance index, and the experimental results are shown in Table 3. From the results of the t-test, we can see that, compared with other methods, our method has significant differences in the performance of AUC, F1, and SE. In addition, we compare the operation time of the model, and the results are shown in Table 4. Our method takes about 15.6 min to train the model and 2.3 s to segment an image in the test set, which is totally acceptable in the medical field.

Table 3.
t-test result of each index (p < 0.05 significant).

Table 4.
Computation time for processing one image.
4. Discussion
In this paper, the application of a full convolution neural network in fundus blood vessel segmentation is studied. Traditional machine learning methods cannot effectively segment low-contrast microvessels, and there are problems of low segmentation accuracy and sensitivity. Based on this, an improved U-Net model is proposed, which not only realizes the information fusion of high-dimensional features and low-dimensional features but also improves the efficiency of feature use. In this study, experiments were conducted on DRIVE and STARE fundus image databases, and image blocks were randomly extracted to increase the amount of network training data to avoid network overfitting.
In terms of network structure design and parameter setting, based on the traditional U-shaped network, the network is defined as a structure block connected by upsampling or downsampling operations. According to the characteristics of small amount of experimental data, this study randomly extracts image blocks to reduce the dimension of image data, so as to reduce the complexity of the network model. Only three downsampling and three upsampling operations are used. In order to make full use of the feature information extracted from the network and to minimize the loss of feature information, the convolution operation with step size of 2 is used to replace the traditional pooling operation and each structural block is changed to Res-Block. In order to enhance the generalization ability of the network and to better identify the small vessel structure, dropout, batch normalization layer, and relu activation function were added before each convolution layer. Then, in order to better extract the context semantic information of the image and to effectively segment the vascular structure of different scales, we propose a multi-scale dilation convolution fusion method based on dilation convolution. In addition, in order to solve the semantic gap between the encoder and decoder, we propose a Res-Dilated block to replace the skip connection in the traditional U-Net model. As shown in Figure 10, Figure 11, Figure 12 and Figure 13, the traditional U-shaped network can be improved to better segment the blood vessels with central line reflection and the microvessels with low contrast, so that the sensitivity, F1 value, accuracy, and area under ROC curve (AUC) index of this research algorithm are improved.
In order to more intuitively compare the improvement effect of the U-Net model and the segmentation performance of blood vessels, this study compared a variety of deep learning methods including U-Net model. In general, compared with the original U-Net model, the MRU-Net model has less noise points in the vessel probability map. From the details, the results of this study can better segment the small vessels and retain the integrity of the vessels, and the continuity of the vessels is better. In order to observe the influence of lesions on vascular segmentation more intuitively, by comparing with the experimental results of the original U-Net model, it can be seen from Figure 10 that the MRU-Net network proposed in this study can better segment blood vessels and is less affected by the lesion area. Compared with other methods, it can be seen from the detection indicators that our method achieves an optimal effect in three indicators of F1, SE, and Jaccard in the DRIVE dataset and that the AUC index is only slightly lower than that in the literature [27]. Although the ACC index is better than most methods, it needs to be improved. In the STARE dataset, our method achieves the best results in AUC, F1, and Jaccard; the ACC index is only slightly lower than in the literature [20,27]; and SE is slightly lower than in the literature [20].
Our main contribution is to propose a simple and effective multi-scale information fusion module, which uses the parallel convolution layer with different dilated rates to sample the feature map and to get the feature information of different scales, which improves the detection performance of vessel edges and microvasculature. In order to visually show the contribution of this paper, we compare and analyze the effect of feature fusion and Resnet. The results on the DRIVE dataset are shown in Table 5. It can be seen from Table 5 that feature fusion has a good effect on model improvement.

Table 5.
Comparative analysis of feature fusion and Resnet.
It can be seen from the intuitive results and indicator evaluation results that our proposed method has excellent effects on retinal vessel image segmentation. For complex blood vessel images, standards close to manual segmentation by experts can be obtained. In addition, we invited five experts with medical image processing background to evaluate the subjective results. Among them, four experts think our method is effective for the segmentation of fundus images, and another expert points out that some of our segmentation results are excessive segmentations hoping to be improved in future research.
5. Conclusions
Using artificial intelligence to assist doctors in segmenting retinal blood vessel images is helpful to doctors quickly diagnosing the disease and has important practical significance. We propose an improved U-Net model structure for the current fundus vessel image segmentation with poor segmentation effect and difficult microvessel segmentation. The model structure adds a residual learning unit to the encoder structure and decoder structure of the traditional U-Net model, which is more conducive to the transmission and retention of information; a feature fusion module is added in the transition phase of the model’s encoding structure and decoding structure, which aims to extract feature information of different granularities in the original image, which is more conducive to retaining fine-grained image features, so that tiny blood vessels can be better segmented; the Res-Dilated module is introduced in the skip connection, which can make the decoding structure network supplement the original information while reducing the semantic gap between the encoding and decoding stages. Through experimental verification analysis on two datasets of DRIVE and STARE, our proposed method has an excellent segmentation effect. This proposed method achieved 0.9611, 0.8618, and 0.9837 in DRIVE and 0.9662, 0.7887, and 0.9856 on STARE for respectable accuracy, sensitivity, and AUC performance metrics. Compared with the current methods, our method has better performance on the whole.
Although our method has good performance, it still needs further improvement. Our method can effectively segment microvessels, but some of them may still be discontinuous. In addition, based on the current experimental conditions, we only tested on DRIVE and STARE datasets, and more clinical data are needed for verification in the future. Our future work is to continue to optimize the effect of retinal microvascular segmentation. On the one hand, contrast between the blood vessel and the background is increased by optimizing the preprocessing steps; on the other hand, the segmentation effect is improved by continuously improving the model.
Author Contributions
Conceptualization, H.D. and X.C.; investigation, H.D., L.C., and K.Z.; writing—original draft, H.D.; writing—review and editing, X.C. and L.C. All authors have read and agreed to the published version of the manuscript.
Funding
This work has been supported by National Key Research and Development Program of China (NO. 2018YFC1604000).
Conflicts of Interest
The authors declare no conflict of interest.
References
- Dash, J.; Bhoi, N. Retinal Blood Vessel Extraction Using Morphological Operators and Kirsch’s Template. In Soft Computing and Signal Processing; Springer: Berlin/Heidelberg, Germany, 2019; pp. 603–611. [Google Scholar]
- Zhang, J.; Dashtbozorg, B.; Bekkers, E.; Pluim, J.P.; Duits, R.; ter Haar Romeny, B.M. Robust retinal vessel segmentation via locally adaptive derivative frames in orientation scores. IEEE Trans. Med. Imaging 2016, 35, 2631–2644. [Google Scholar] [CrossRef]
- Ben Abdallah, M.; Malek, J.; Azar, A.T.; Montesinos, P.; Belmabrouk, H.; Esclarín Monreal, J.; Krissian, K. Automatic extraction of blood vessels in the retinal vascular tree using multiscale medialness. Int. J. Biomed. Imaging 2015, 2015. [Google Scholar] [CrossRef]
- Orlando, J.I.; Prokofyeva, E.; Blaschko, M.B. A discriminatively trained fully connected conditional random field model for blood vessel segmentation in fundus images. IEEE Trans. Biomed. Eng. 2016, 64, 16–27. [Google Scholar] [CrossRef]
- Wang, X.; Chen, D.; Luo, L. Retinal blood vessels segmentation based on multi-classifier fusion. In Proceedings of the 2018 Chinese Control And Decision Conference (CCDC), Shenyang, China, 9–11 June 2018; pp. 3542–3546. [Google Scholar]
- Gu, Z.; Cheng, J.; Fu, H.; Zhou, K.; Hao, H.; Zhao, Y.; Zhang, T.; Gao, S.; Liu, J. CE-Net: Context encoder network for 2D medical image segmentation. IEEE Trans. Med. Imaging 2019, 38, 2281–2292. [Google Scholar] [CrossRef] [PubMed]
- Zhou, Z.; Siddiquee, M.M.R.; Tajbakhsh, N.; Liang, J. Unet++: Redesigning skip connections to exploit multiscale features in image segmentation. IEEE Trans. Med. Imaging 2019, 39, 1856–1867. [Google Scholar] [CrossRef] [PubMed]
- Soomro, T.A.; Afifi, A.J.; Shah, A.A.; Soomro, S.; Baloch, G.A.; Zheng, L.; Yin, M.; Gao, J. Impact of Image Enhancement Technique on CNN Model for Retinal Blood Vessels Segmentation. IEEE Access 2019, 7, 158183–158197. [Google Scholar] [CrossRef]
- Kumawat, S.; Raman, S. Local phase U-Net for fundus image segmentation. In Proceedings of the ICASSP 2019—2019 IEEE International Conference on Acoustics, Speech and Signal Processing (ICASSP), Brighton, UK, 12–17 May 2019; pp. 1209–1213. [Google Scholar]
- Tamim, N.; Elshrkawey, M.; Abdel Azim, G.; Nassar, H. Retinal Blood Vessel Segmentation Using Hybrid Features and Multi-Layer Perceptron Neural Networks. Symmetry 2020, 12, 894. [Google Scholar] [CrossRef]
- Cheng, Y.; Ma, M.; Zhang, L.; Jin, C.; Ma, L.; Zhou, Y. Retinal blood vessel segmentation based on Densely Connected U-Net. Math. Biosci. Eng. 2020, 17, 3088. [Google Scholar] [CrossRef]
- Francia, G.A.; Pedraza, C.; Aceves, M.; Tovar-Arriaga, S. Chaining a U-Net With a Residual U-Net for Retinal Blood Vessels Segmentation. IEEE Access 2020, 8, 38493–38500. [Google Scholar] [CrossRef]
- Xiuqin, P.; Zhang, Q.; Zhang, H.; Li, S. A fundus retinal vessels segmentation scheme based on the improved deep learning U-Net model. IEEE Access 2019, 7, 122634–122643. [Google Scholar] [CrossRef]
- Li, D.; Dharmawan, D.A.; Ng, B.P.; Rahardja, S. Residual U-Net for Retinal Vessel Segmentation. In Proceedings of the 2019 IEEE International Conference on Image Processing (ICIP), Taipei, Taiwan, 22–25 September 2019. [Google Scholar]
- Staal, J.; Abràmoff, M.D.; Niemeijer, M.; Viergever, M.A.; Van Ginneken, B. Ridge-based vessel segmentation in color images of the retina. IEEE Trans. Med. Imaging 2004, 23, 501–509. [Google Scholar] [CrossRef] [PubMed]
- Hoover, A.; Kouznetsova, V.; Goldbaum, M. Locating blood vessels in retinal images by piecewise threshold probing of a matched filter response. IEEE Trans. Med. Imaging 2000, 19, 203–210. [Google Scholar] [CrossRef] [PubMed]
- Ronneberger, O.; Fischer, P.; Brox, T. U-Net: Convolutional Networks for Biomedical Image Segmentation. In International Conference on Medical Image Computing and Computer-Assisted Intervention, Proceedings of the Medical Image Computing and Computer-Assisted Intervention—MICCAI 2015, Munich, Germany, 5–9 October 2015; Springer: Berlin/Heidelberg, Germany, 2015. [Google Scholar]
- Chen, L.C.; Papandreou, G.; Kokkinos, I.; Murphy, K.; Yuille, A.L. Deeplab: Semantic image segmentation with deep convolutional nets, atrous convolution, and fully connected crfs. IEEE Trans. Pattern Anal. Mach. Intell. 2017, 40, 834–848. [Google Scholar] [CrossRef]
- Ibtehaz, N.; Rahman, M.S. MultiResUNet: Rethinking the U-Net architecture for multimodal biomedical image segmentation. Neural Netw. 2020, 121, 74–87. [Google Scholar] [CrossRef] [PubMed]
- Xiao, X.; Lian, S.; Luo, Z.; Li, S. Weighted Res-UNet for high-quality retina vessel segmentation. In Proceedings of the 2018 9th International Conference on Information Technology in Medicine and Education (ITME), Hangzhou, China, 19–21 October 2018; pp. 327–331. [Google Scholar]
- Lu, J.; Xu, Y.; Chen, M.; Luo, Y. A Coarse-to-Fine Fully Convolutional Neural Network for Fundus Vessel Segmentation. Symmetry 2018, 10, 607. [Google Scholar] [CrossRef]
- Gao, X.; Cai, Y.; Qiu, C.; Cui, Y. Retinal blood vessel segmentation based on the Gaussian matched filter and U-net. In Proceedings of the 2017 10th International Congress on Image and Signal Processing, BioMedical Engineering and Informatics (CISP-BMEI), Shanghai, China, 14–16 October 2017; pp. 1–5. [Google Scholar]
- Hu, K.; Zhang, Z.; Niu, X.; Zhang, Y.; Cao, C.; Xiao, F.; Gao, X. Retinal vessel segmentation of color fundus images using multiscale convolutional neural network with an improved cross-entropy loss function. Neurocomputing 2018, 309, 179–191. [Google Scholar] [CrossRef]
- Feng, S.; Zhuo, Z.; Pan, D.; Tian, Q. CcNet: A cross-connected convolutional network for segmenting retinal vessels using multi-scale features. Neurocomputing 2020, 392, 268–276. [Google Scholar] [CrossRef]
- Jin, Q.; Meng, Z.; Pham, T.D.; Chen, Q.; Wei, L.; Su, R. DUNet: A deformable network for retinal vessel segmentation. Knowl. Based Syst. 2019, 178, 149–162. [Google Scholar] [CrossRef]
- Guo, S.; Wang, K.; Kang, H.; Zhang, Y.; Gao, Y.; Li, T. BTS-DSN: Deeply supervised neural network with short connections for retinal vessel segmentation. Int. J. Med. Inform. 2019, 126, 105–113. [Google Scholar] [CrossRef]
- Sekou, T.B.; Hidane, M.; Olivier, J.; Cardot, H. From Patch to Image Segmentation using Fully Convolutional Networks—Application to Retinal Images. arXiv 2019, arXiv:1904.03892. [Google Scholar]
- Orujov, F.; Maskeliunas, R.; Damaševičius, R.; Wei, W. Fuzzy based image edge detection algorithm for blood vessel detection in retinal images. Appl. Soft Comput. 2020, 94, 106452. [Google Scholar] [CrossRef]
- Dasgupta, A.; Singh, S. A fully convolutional neural network based structured prediction approach towards the retinal vessel segmentation. In Proceedings of the 2017 IEEE 14th International Symposium on Biomedical Imaging (ISBI 2017), Melbourne, Australia, 18–21 April 2017; pp. 248–251. [Google Scholar]
- Liskowski, P.; Krawiec, K. Segmenting Retinal Blood Vessels With Deep Neural Networks. IEEE Trans. Med. Imaging 2016, 35, 2369–2380. [Google Scholar] [CrossRef] [PubMed]
- Jebaseeli, T.J.; Durai, C.A.D.; Peter, J.D. Segmentation of retinal blood vessels from ophthalmologic Diabetic Retinopathy images. Comput. Electr. Eng. 2018, 73, 245–258. [Google Scholar] [CrossRef]
- Fu, H.; Xu, Y.; Lin, S.; Wong, D.W.K.; Liu, J. DeepVessel: Retinal Vessel Segmentation via Deep Learning and Conditional Random Field. In Proceedings of the International Conference on Medical Image Computing and Computer-Assisted Intervention, Medical Image Computing and Computer-Assisted Intervention—MICCAI 2016, Athens, Greece, 17–21 October 2016; Springer: Berlin/Heidelberg, Germany, 2016. [Google Scholar]
- Girard, F.; Kavalec, C.; Cheriet, F. Joint segmentation and classification of retinal arteries/veins from fundus images. Artif. Intell. Med. 2019, 94, 96–109. [Google Scholar] [CrossRef] [PubMed]
- Li, Q.; Feng, B.; Xie, L.; Liang, P.; Zhang, H.; Wang, T. A cross-modality learning approach for vessel segmentation in retinal images. IEEE Trans. Med. Imaging 2015, 35, 109–118. [Google Scholar] [CrossRef]
© 2020 by the authors. Licensee MDPI, Basel, Switzerland. This article is an open access article distributed under the terms and conditions of the Creative Commons Attribution (CC BY) license (http://creativecommons.org/licenses/by/4.0/).