Article

Study on Dynamic Behavior of Bridge Pier by Impact Load Test Considering Scour

1
Railroad Structure Research Team, Korea Railroad Research Institute, 176 Cheoldobangmulgwan-ro, Uiwang-si, Gyeonggi-do 16105, Korea
2
Advanced Infrastructure Research Team, Korea Railroad Research Institute, 176 Cheoldobangmulgwan-ro, Uiwang-si, Gyeonggi-do 16105, Korea
*
Author to whom correspondence should be addressed.
Appl. Sci. 2020, 10(19), 6741; https://doi.org/10.3390/app10196741
Submission received: 10 August 2020 / Revised: 24 September 2020 / Accepted: 24 September 2020 / Published: 26 September 2020
(This article belongs to the Special Issue Buildings and Structures under Extreme Loads II)

Abstract

:
In this study, for the establishment of a safety evaluation method, non-destructive tests were performed by developing a full-scale model pier and simulating scour on the ground adjacent to a field pier. The surcharge load (0–250 kN) was applied to the full-scale model pier to analyze the load’s effect on the stability. For analyzing the pier’s behavior according to the impact direction, an impact was applied in the bridge axis direction, pier length direction, and pier’s outside direction. The impact height corresponded to the top of the pier. A 1-m deep scour was simulated along one side of the ground, which was adjacent to the pier foundation. The acceleration was measured using accelerometers when an impact was applied. The natural frequency, according to the impact direction and surcharge load, was calculated using a fast Fourier transform (FFT). In addition, the first mode (vibratory), second mode (vibratory), and third modes (torsion) were analyzed according to the pier behavior using the phase difference, and the effect of the scour occurrence on the natural frequency was analyzed. The first mode was most affected by the surcharge load and scour. The stability of the pier can be determined using the second mode, and the direction of the scour can be determined using the third mode.

1. Introduction

The maintenance of railway bridges is required due to their special structures and socioeconomic roles. Therefore, technologies that can facilitate maintenance of the target performance based on reasonable inspections, measurements, evaluations, decision-making, repairs, and reinforcement procedures are required. However, the number of bridges that are damaged not only by structural problems but also by various environmental factors is gradually increasing. In particular, when flooding occurs, scouring occurs due to runoff in the ground adjacent to the bridge piers crossing the river, causing the bridge to collapse. This not only seriously affects the safety of people, but can also cause enormous losses to society and economy over a long period of time. Additionally, it is reported that the first cause of the bridge failure is not the structural defect of the bridge, but the destruction of the foundation due to scouring around the pier during flooding [1,2,3,4]. In general, railway bridges do not suddenly collapse; warnings are usually provided in advance. It is difficult to identify these abnormal signs via personnel-oriented irregular inspections or regular inspections at long-term intervals performed with inspection vehicles. Worldwide, studies have actively investigated the development of technologies for detecting the collapse of bridge piers in advance. In April 1987, a bridge collapsed at the Schoharie creek in New York, USA owing to the scour that occurred on the bottom surface of the pier footing. This accident resulted in more than ten human casualties as well as significant economic damage, and a research fund of 11 million USD was supported for the scour alone. Since then, research has been supported on a national level, led by the National Cooperation Highway Research Program (NCHRP). In addition, the Federal Highway Administration (FHWA) prepared the technical manuals of Hydraulic Engineering Circular (HEC)-18 [5], HEC-20 [6], and HEC-23 [7] for bridge scour, river stability, and countermeasures, respectively, due to active research and evaluation programs since 1987. These manuals are being used for the analysis and design of the bridge scour. Most of these studies, however, are focused on bridges that are built on sandy soils; thus, the characteristics of scour on soils other than sandy soils have not been considered. For scour analysis, the formula proposed by HEC-18 has been widely used. It is difficult to apply the formula to soils other than sand because the formula was obtained on the basis of experiments conducted on sand. Recently, a method that considered the scour rate and the influence of time [8] was proposed for clayey soils, and a new approach that used the erosion index [9] was attempted for rocky soils. In the Netherlands, systematic and comprehensive research on the scour pattern has been conducted as a national project by Dutch Delta Works since 1953. This research project was led by the Ministry of Transport, Public Works, and Water Management as well as Delft Hydraulics. Delft Hydraulics derived a semi-empirical scour formula as a function of time and location. This was achieved by performing numerous laboratory experiments while considering a variety of variables that are related to the hydraulic properties of the flow and the scour materials. They prepared a comprehensive technical manual that is referred to as the Breusers-equilibrium method on the scour phenomenon. This is based on the average flow velocity and the relative turbulence intensity of the flow and the dominant characteristics of time for the maximum scour depth [10].
As mentioned above, many projects have been conducted on the stability evaluation for piers and many studies have also been conducted. In previous research, the scour effect was simulated where the actual scour occurred by numerical analysis [11,12]. Cooley and Tukey [13] developed a fast Fourier transform (FFT) algorithm. Research on the bridge stability analysis and monitoring of the basis of this method has been conducted for many years [14,15,16,17,18]. In addition, many studies have been conducted to judge the state of the pier by its natural frequency. Sanayei and Maser [19] conducted research on the static measurement by using a vehicle load to estimate the ground stiffness of a bridge foundation. When a 200 kN truck passed each bridge that was built on a pile foundation and a footing, respectively, the stiffness ratio of the measured and theoretical values according to the foundation type were compared. Nishimura [20] introduced an impact vibration test method that measures the natural frequency of a pier by using the response waveform that was obtained by exciting its head with a weight of 300 N and it determines the stability from the changes in the natural frequency. Haya et al. [21] examined the possibility of estimating the natural frequency of a spread foundation pier with a microtremor measurement. They also compared the results of the impact excitation experiment and the microtremor measurement for a field bridge, and they reported that it was impossible to measure the natural frequency with a microtremor measurement. Samizo et al. [22], however, conducted research on a method for defining the natural frequency by measuring the microtremor of the existing bridge piers. Keyaki et al. [23] proposed a method that can identify the natural frequency by using the tremor measurement results alone without the impact vibration test results. Samizo et al. [24] developed a technique for evaluating the stability of the foundation. This was achieved by measuring the vibration of the pier using hydraulic power and analyzing the natural frequency change, and they also conducted research on soundness diagnosis indicators. Abe and Nozue [25] proposed a soundness diagnosis indicator that has a correlation with the natural frequency through a model test and the verification by a field measurement. Masahiro [26] proposed a statistical formula based on several measurement results by using the impact vibration test method. Japan’s Ministry of Land, Infrastructure, and Transport [27] specified calculation formulas for each foundation type and the foundation soil type for railway maintenance standards, and they proposed a formula for the natural frequency of spread-foundation-type single-track piers.
As mentioned above, the stability of bridge substructures is closely related to the safety problem of bridges. The safety diagnosis and inspection, however, are focused on the materials for the bridge as well as structural problems, and there is no quantitative evaluation method for the substructures.
In this study, an impact load test was performed to analyze the effect of the surcharge load and scouring of the pier. This paper was focused on a bridge with shallow foundation and a plate girder deck because this is the most diffused typology in Korea. The full-scale model pier was built to analyze the effect of the surcharge load and confirm the mode shape and mode number of the bridge pier. Through the impact load experiment, it was possible to determine the three mode number of the pier according to the direction of the impact load. In addition, scouring was simulated using the pier of abandoned railway. The three mode number identified in the full-scale model experiment was derived and the effects of scouring were analyzed with natural frequencies.

2. Test Set-Up

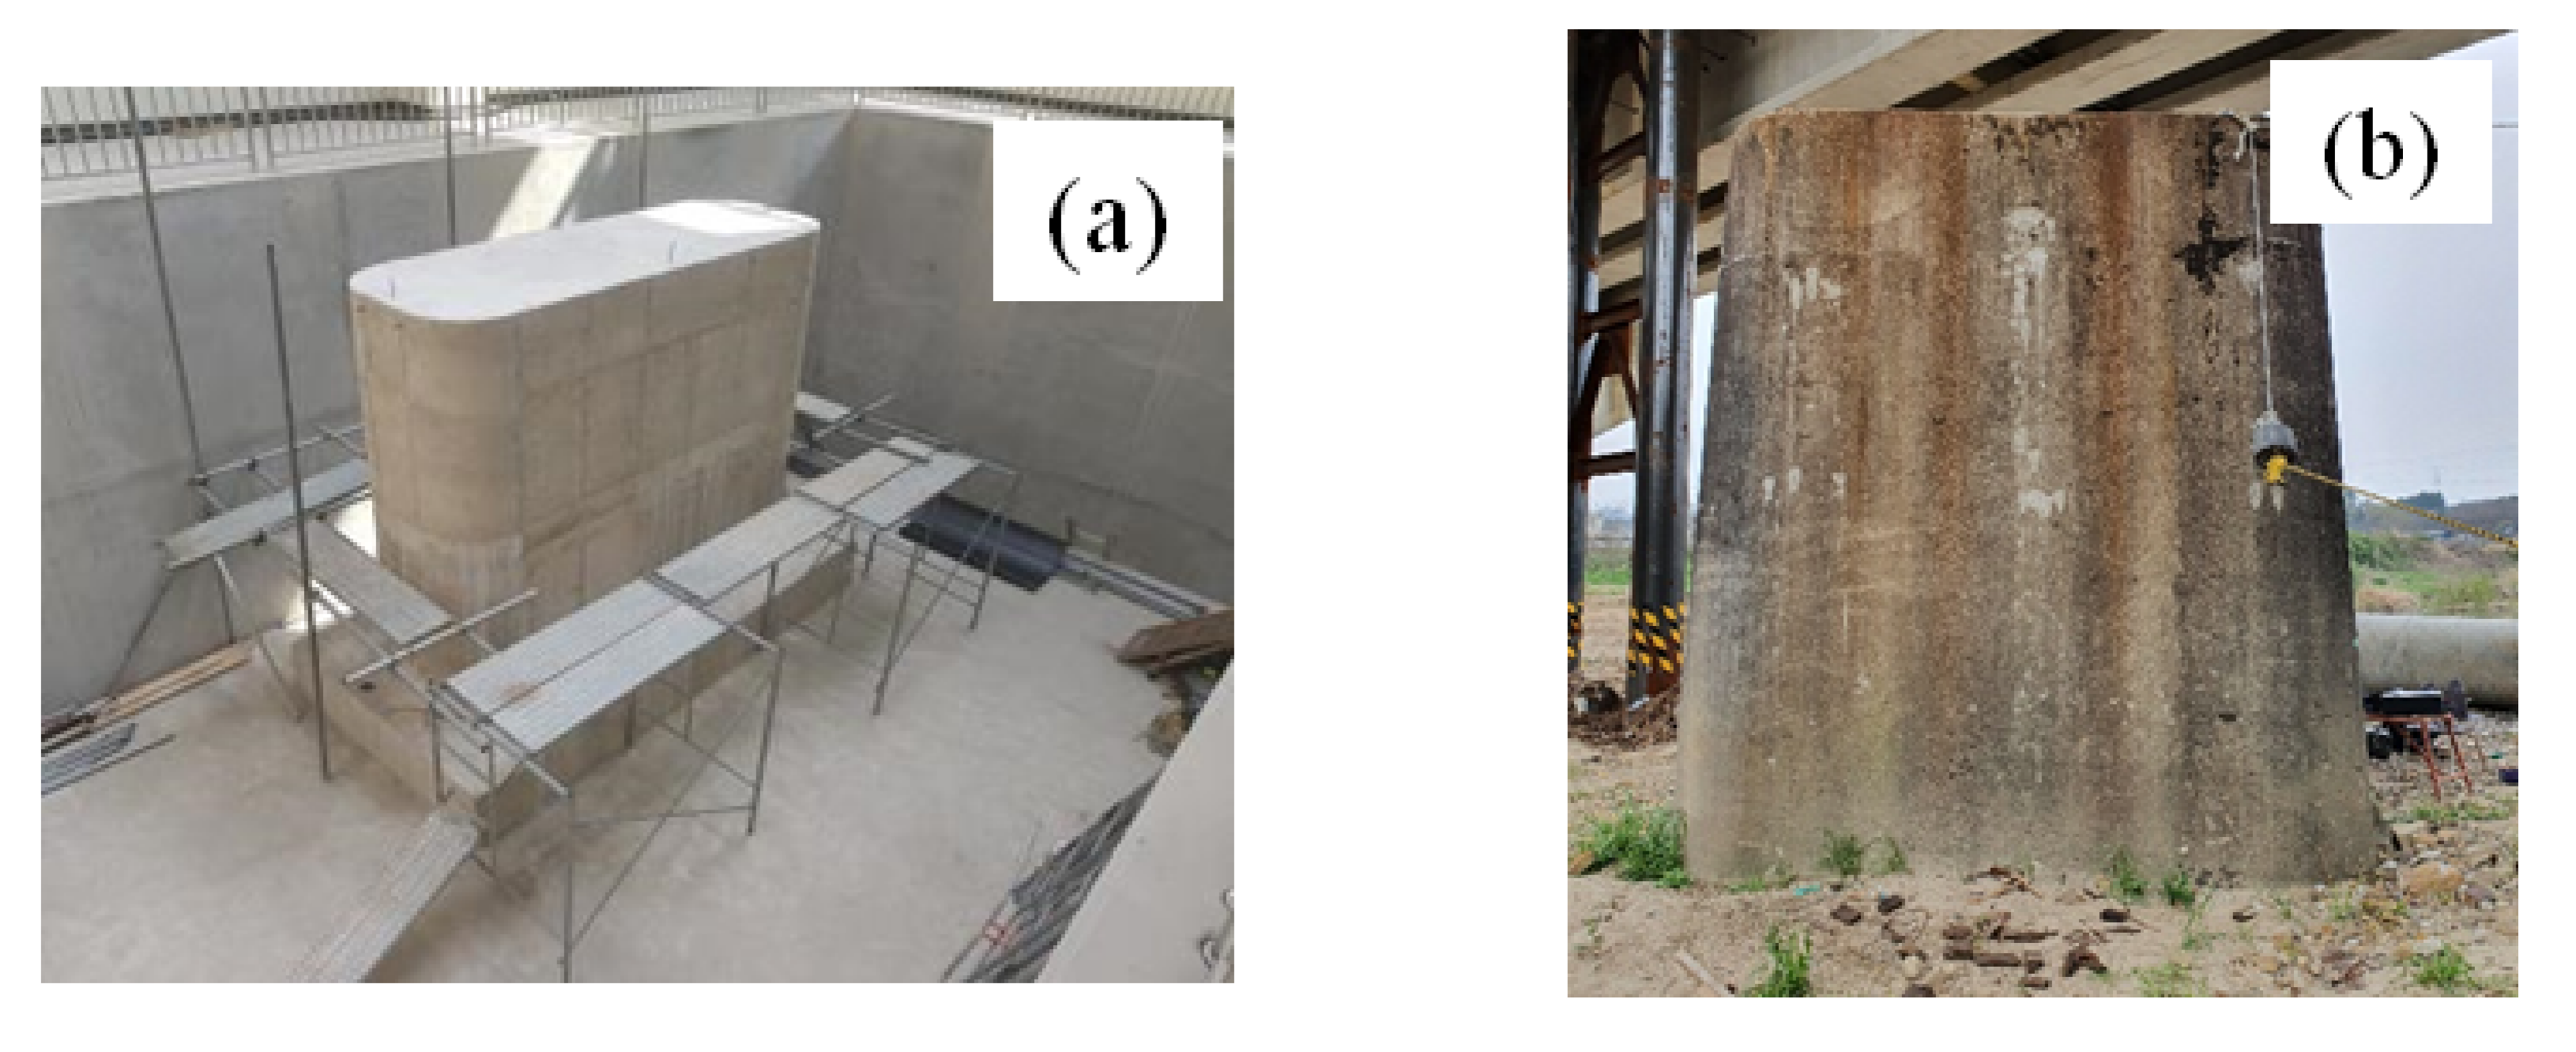
2.1. Specifications of the Full-Scale Model Pier and the Cheongnyangcheon Bridge Pier

The full-scale model pier used the spread foundation type to evaluate the aged foundations. The pier foundation slab’s dimensions were 5150 mm × 2420 mm × 50 mm (length × width × height), and the pier, which had a height of 4500 mm, was fabricated by repeating concrete pouring and curing with a height of 1500 mm for three times. The length and width of the pier were 4150 mm and 1420 mm, respectively.
The target pier of the field test was a shallow foundation type and an unreinforced concrete structure. The length and width of the top of the pier were 3900 and 1350 mm, respectively, and those of the bottom of the pier were 4680 and 2130 mm. The total length of the pier was 7800 mm; 3000 mm of the pier’s length was embedded under the ground.
Figure 1 illustrates schematic view of the pier and Figure 2 shows the target pier for the impact load test.

2.2. Non-Destructive Impact Vibration Test Method

The impact vibration test method can be used to evaluate the stability of the piers. The stability was evaluated based on the natural frequency that was derived when an impact was applied to the top of the pier in the pier length direction with a weight of approximately 0.3 kN. The impact vibration test method was proposed by Nishimura [20], who proposed a simple formula for the natural frequency of a sound pier by using the pier height, the girder weight, and the earth covering based on the natural frequency results of the piers that were derived through a series of tests.
Eight accelerometers were used to evaluate the stability of the pier through the impact load test, and a weight of 0.3 kN was used to apply an impact load. Figure 3 presents the measuring equipment and the weight that were used in the experiment. In the full-scale pier model test, the surcharge load slowly increased from 0 to 250 kN by 25 kN (a total of 11 loads) to analyze the influence of the surcharge load. Here, the surcharge load simulated the weight of the girder.
The field test was conducted for cases with or without a girder on the pier (Figure 4). In addition, the impact load test was conducted by simulating scour on one side of the ground that was adjacent to the pier to analyze the effect of the scour on the pier (Figure 5). The bridge pier in lab tests simulated the embedded in bedrock condition, and bridge pier in-situ condition simulated the embedded in weathered soil. The weather soil’s SPT N value ranged 6–8. The full-scale model pier simulated a shallow foundation embedded weathered rock, in addition, therefore, the tests were performed without scour case.
Figure 6 illustrates the test cases according to the impact direction. The accelerometers were attached to points 50 cm away from the top of the pier, a point 50 cm away from the bottom of the pier, and the center of the pier. Two accelerometers were attached to three points (a total of six accelerometers) to measure the acceleration in the bridge axis and pier length directions. Two accelerometers were attached to the outer surface of the pier to measure the acceleration in the pier length direction. An impact was applied to three points. The full-scale pier model test was repeated 33 times while considering the surcharge load, and the field test was repeated nine times. Table 1 summarizes the test cases.

3. Results

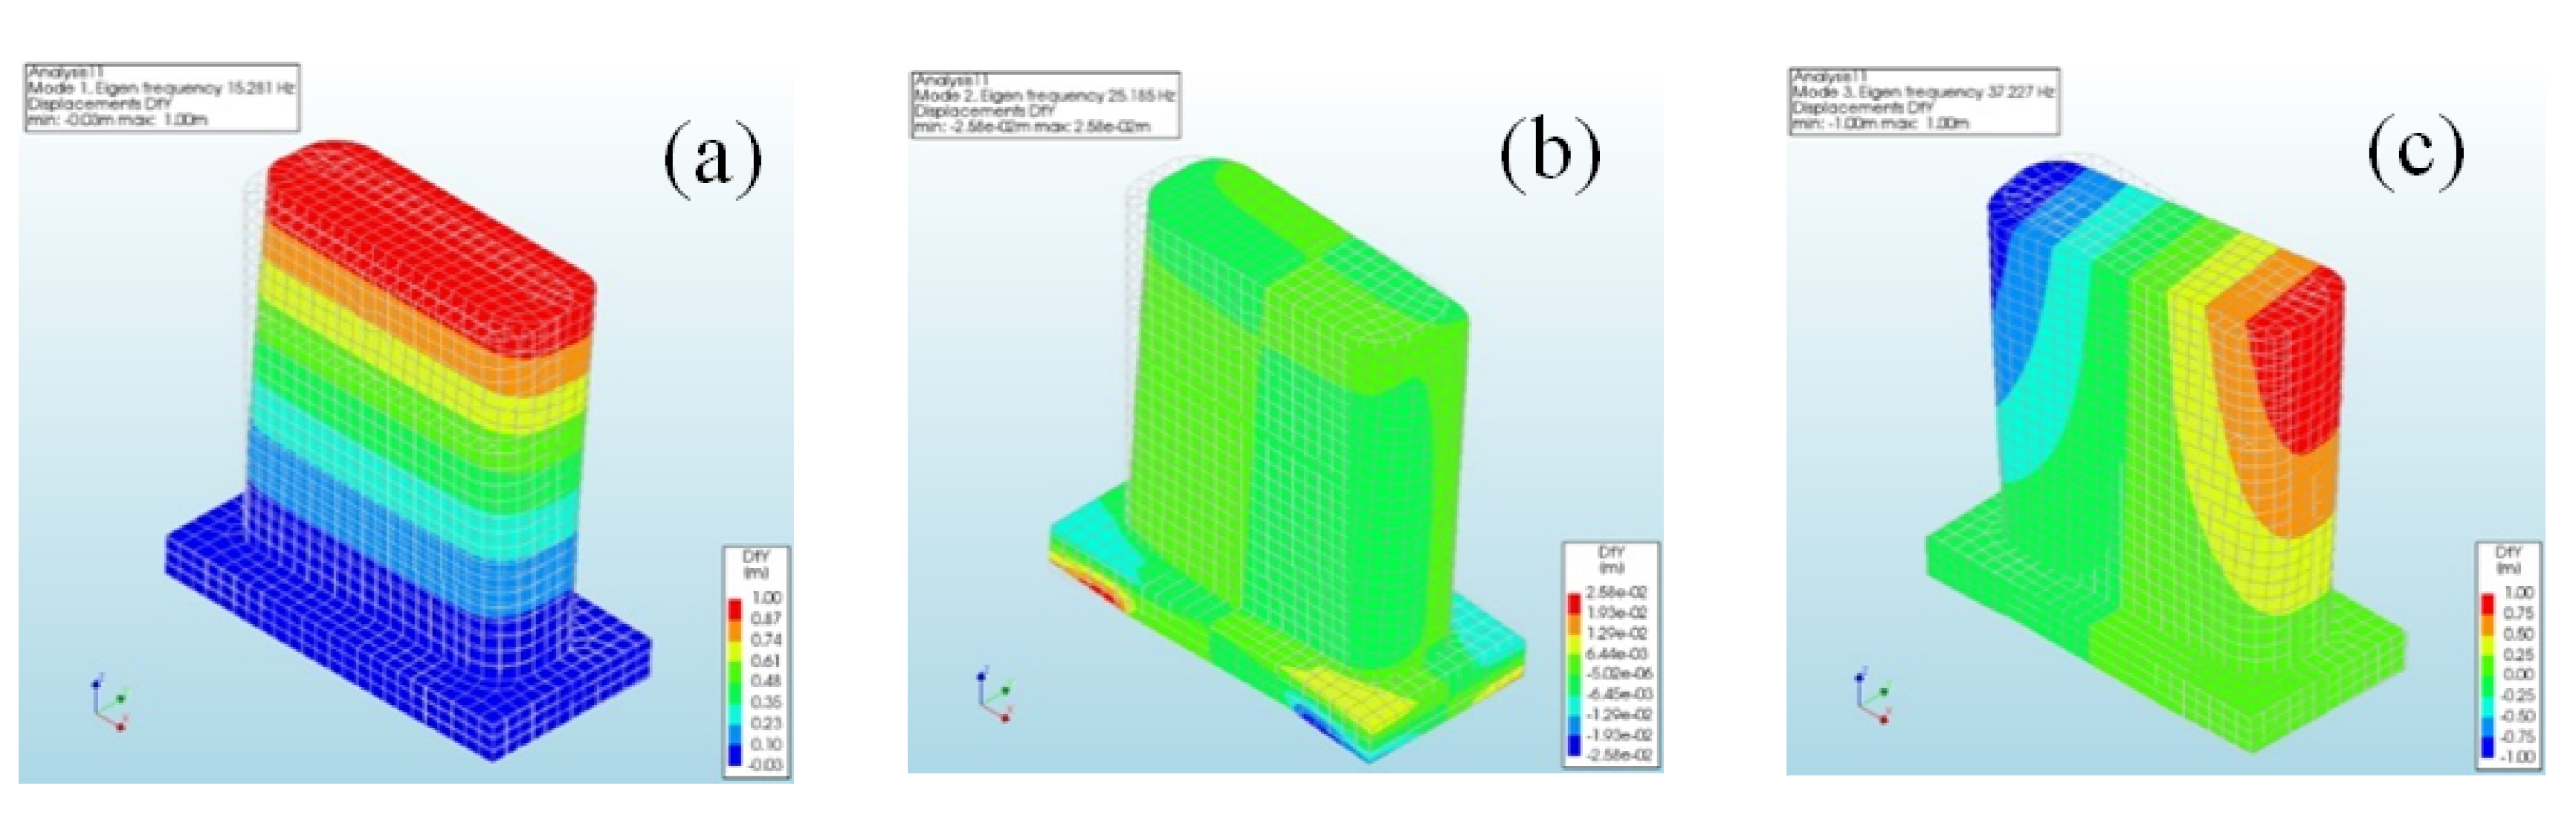
3.1. Mode Number Analysis for the Analysis of the Test Results

Prior to the full-scale pier model test and the field test, the eigenvalue of the pier was analyzed using Diana [28], which is a finite element software program, to analyze the behavior of the pier according to the impact direction. The finite element analysis only analyzed the mode number according to the direction of the impact load. Therefore, in order to reduce the variables in numerical analysis, the boundary condition between the pier bottom and the ground was set as a fixed condition. The size of the pier that was used for the analysis was the same as the full-scale pier. It was possible to analyze the behavior of the pier that corresponded to the first, second, and third modes according to the eigenvalue as shown in Figure 7. The pier exhibited displacement in the bridge axis direction in the first mode and in the pier length direction in the second mode. In the third mode, the torsional behavior of the pier was observed. According to the mode number analysis, the natural frequency corresponding to the second mode was caused by the impact in the pier length direction. In addition, the natural frequencies corresponding to the first and third modes were caused by the impact in the bridge axis direction. By analyzing the eigenvalue of the pier, the impact directions to derive the mode numbers of the full-scale model pier and the field pier could be selected. Based on this result, it was possible to determine the applicable impact load direction in the test, and full scale pier tests was establishment of the impact load test method to implement the pier behavior in the 1st–3rd modes.

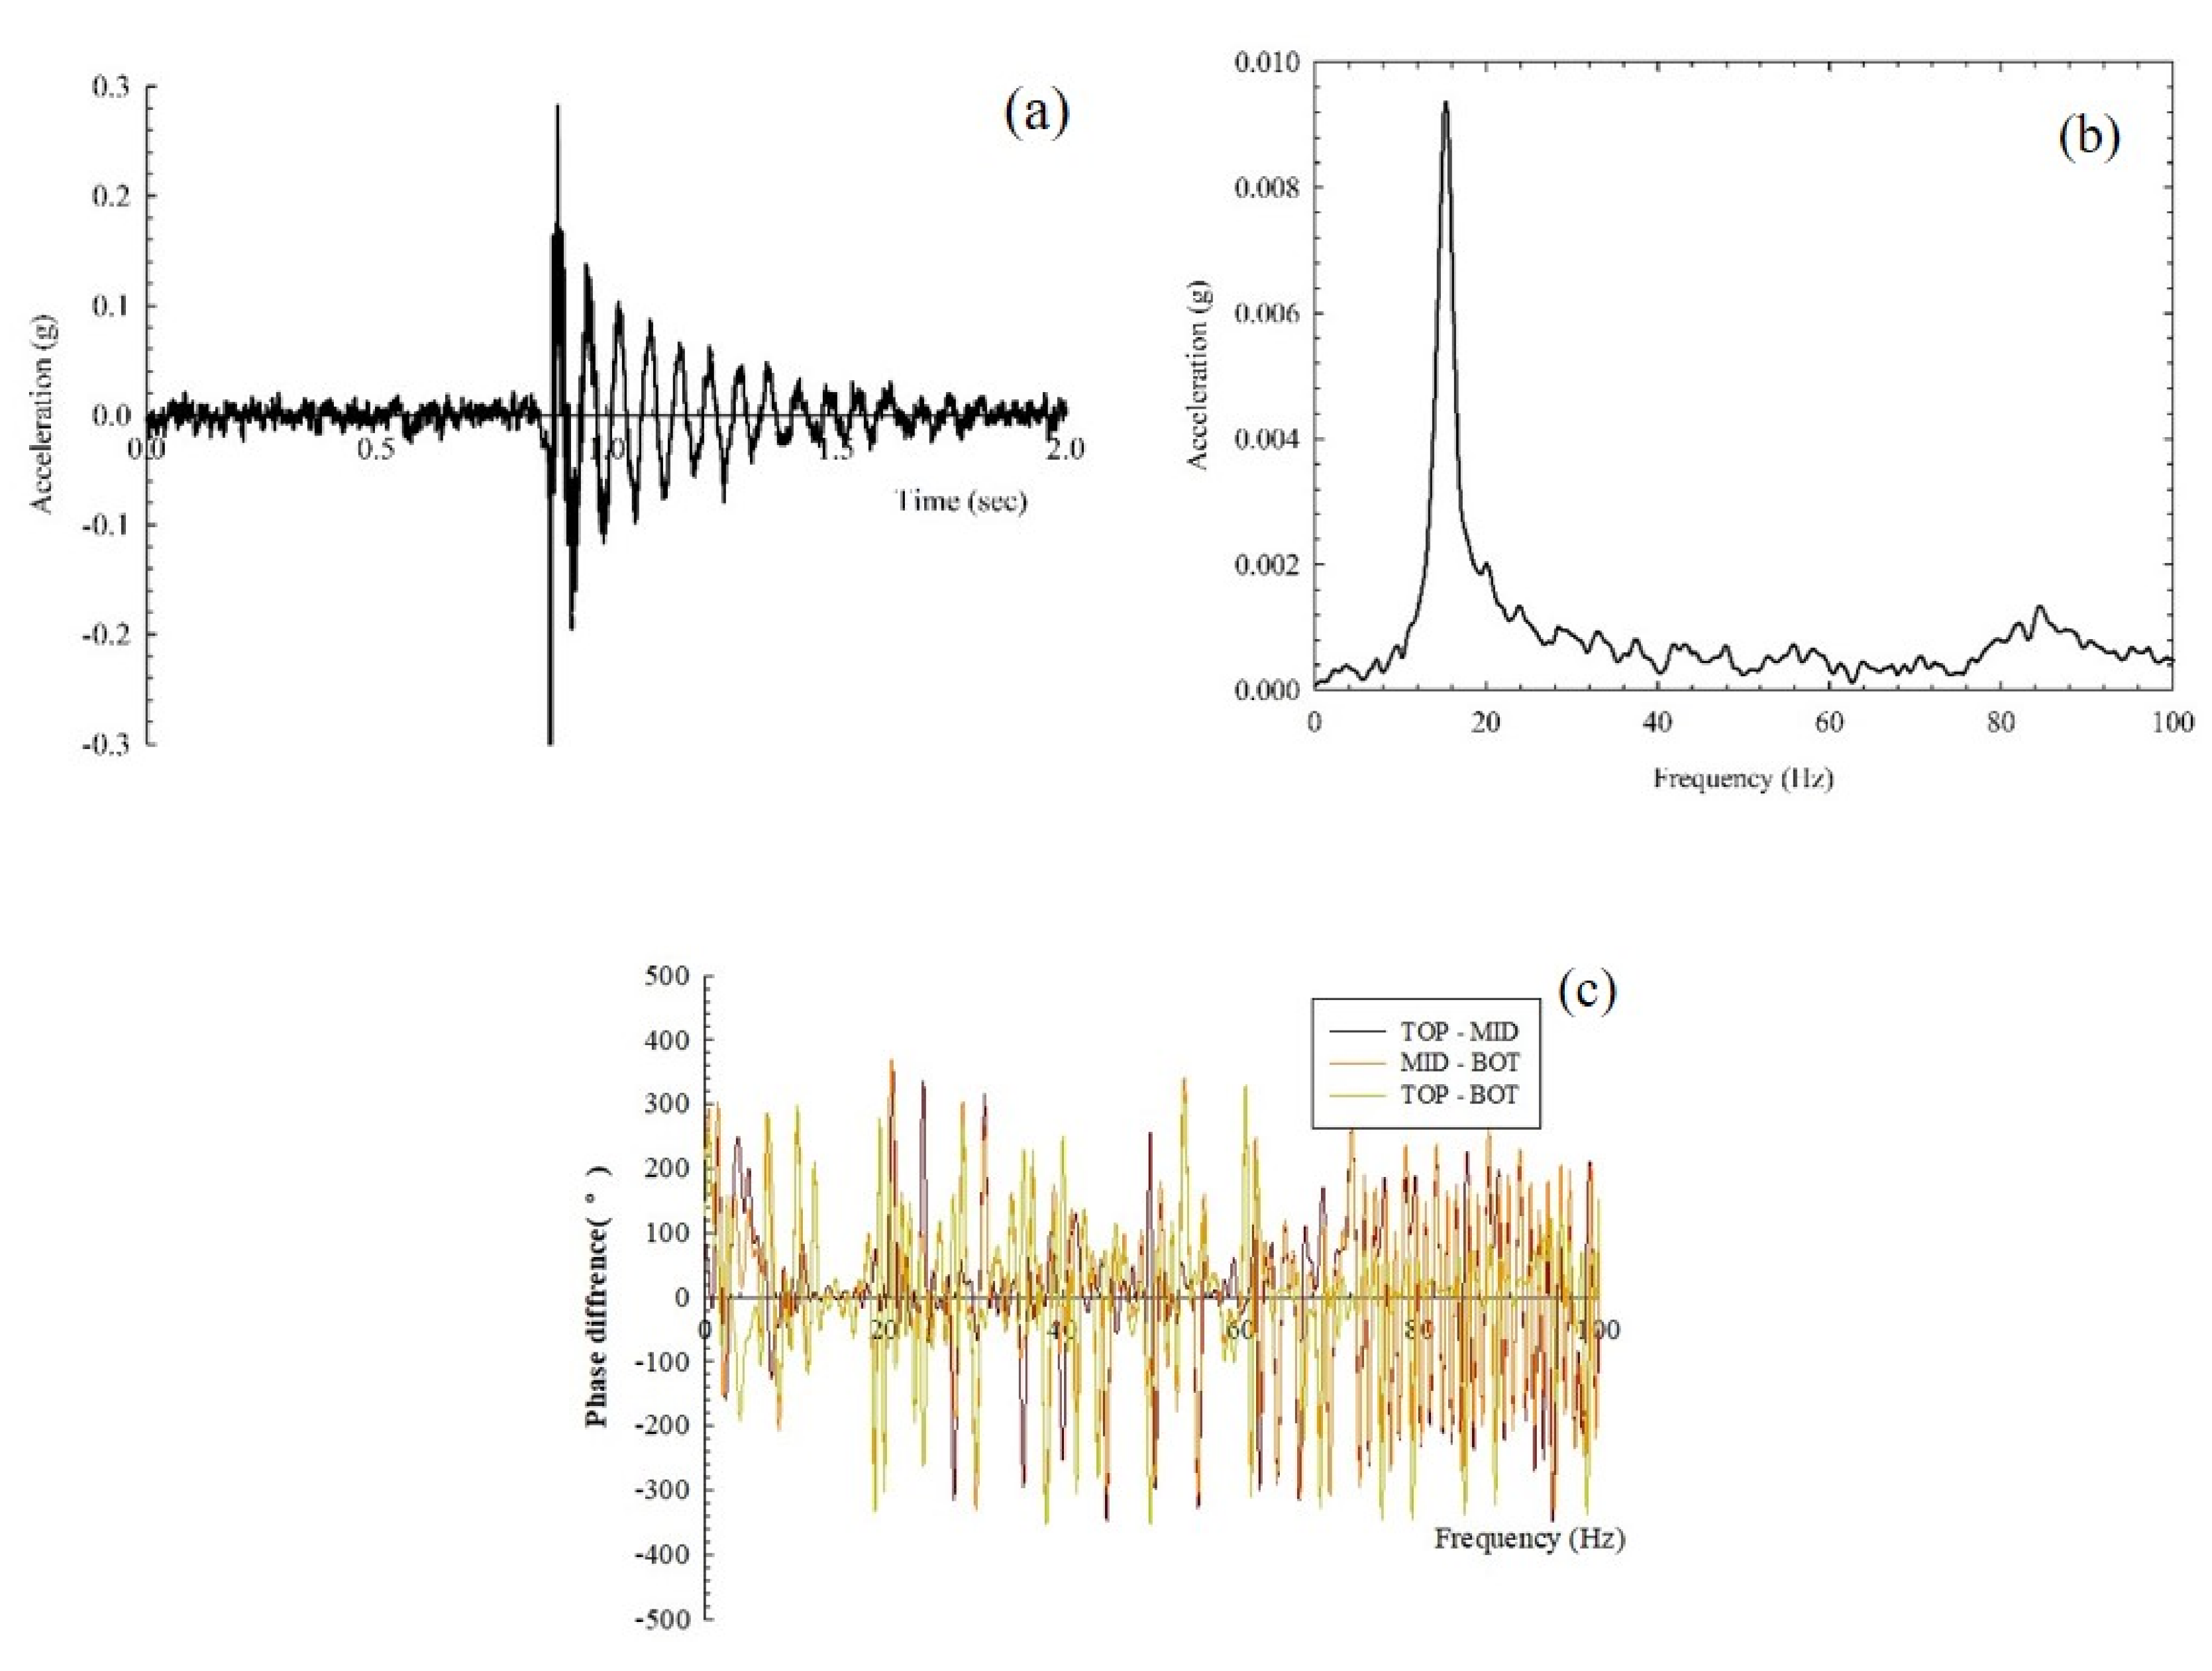
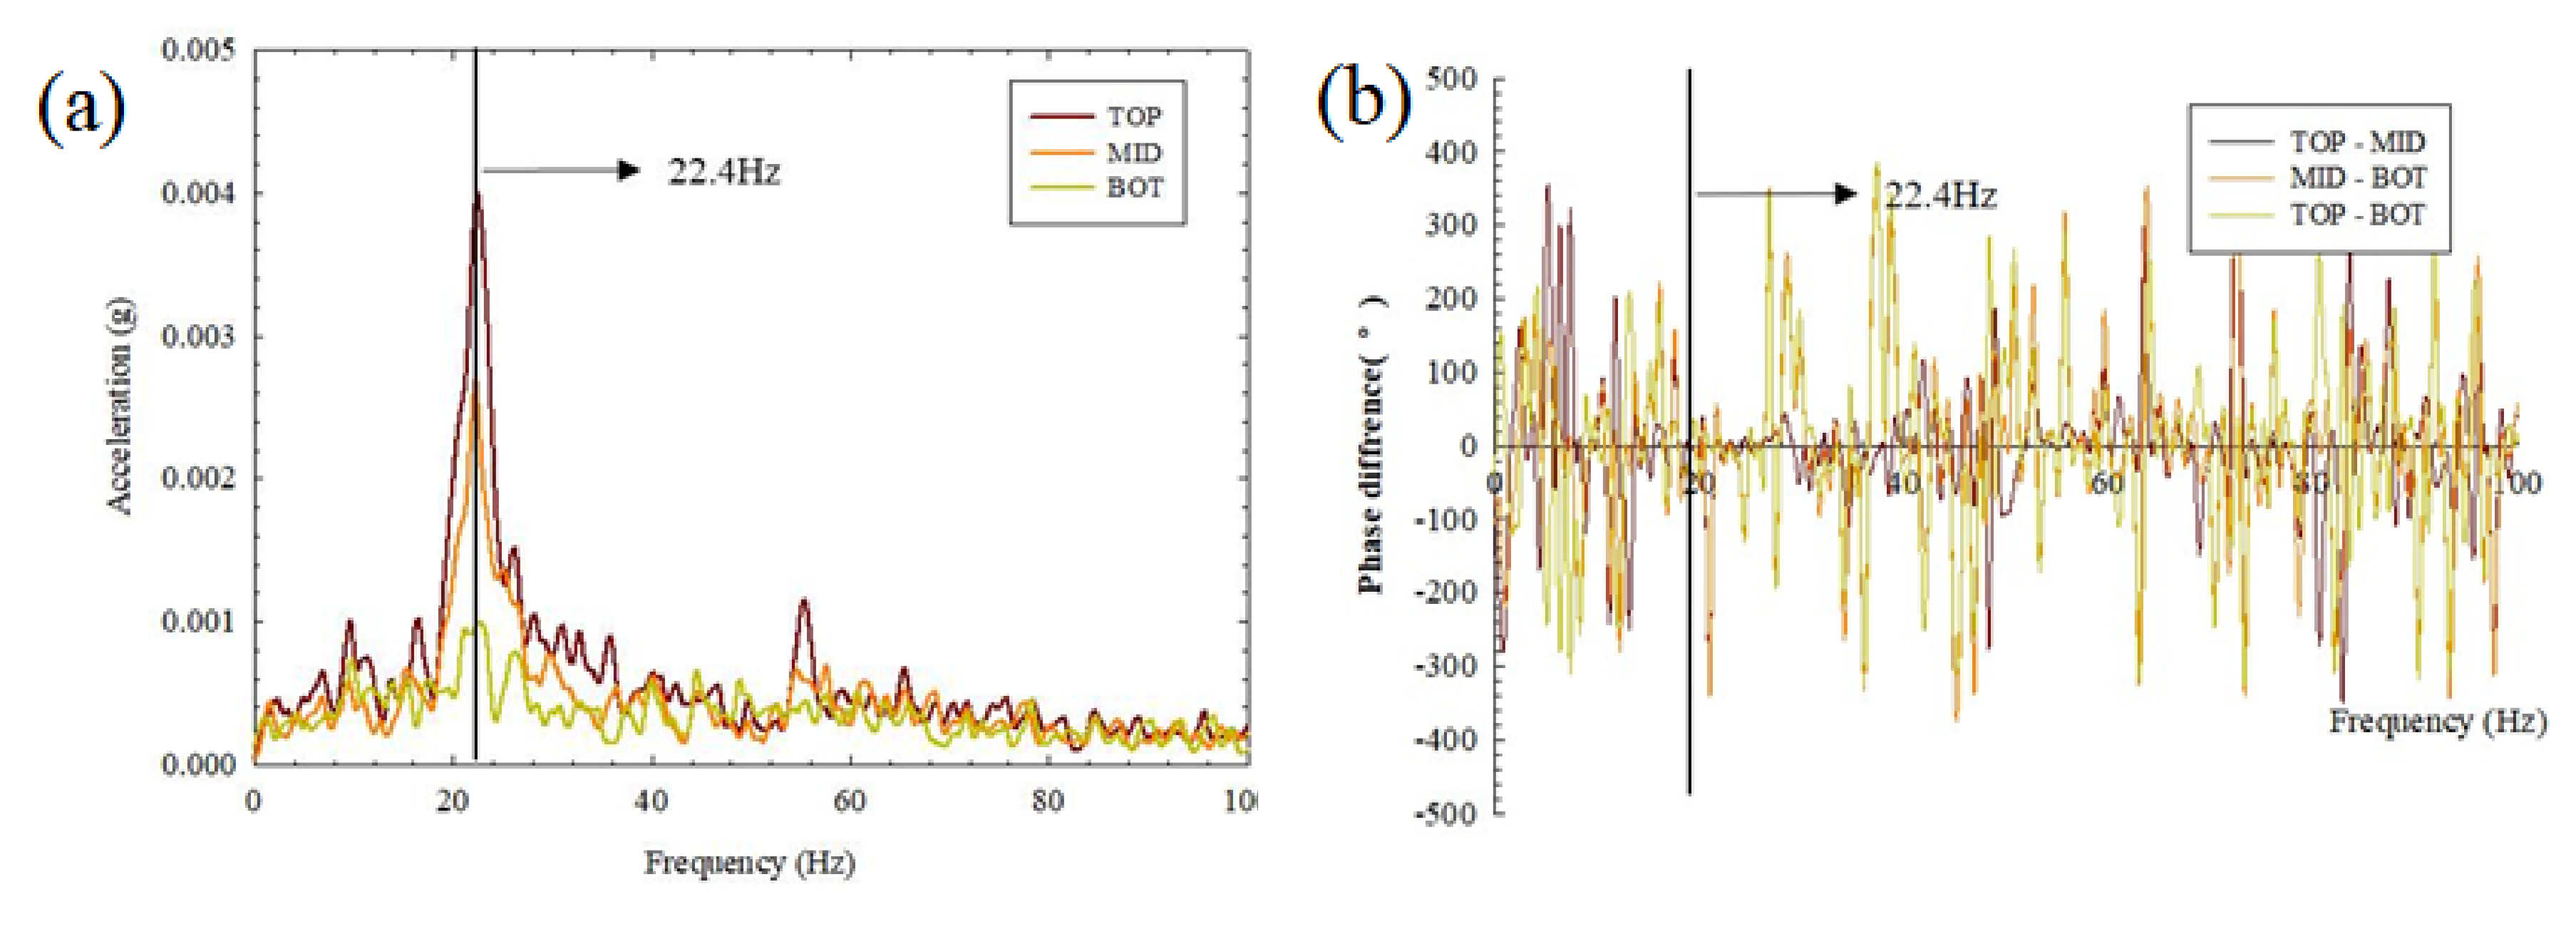
3.2. Experimental Analysis Method

Figure 8a shows the acceleration values that were measured in the experiment. They are the measurement results of the impact in the bridge axis direction when the surcharge load was 0 kN. In the case of the impact vibration test, it is possible to determine the natural frequency and vibration mode by analyzing the spectrum of the repetitive waveform that was obtained from multiple recorded waveforms. For the spectrum analysis, it is desirable to use the FFT technique, which is capable of dividing the signals by the frequency. The natural frequency of the pier can be derived from the frequency domain using the FFT technique as shown in Figure 8b. In addition, the phase of the measured position can be represented as shown in Figure 8c. Based on this, the phase difference between the measuring instruments can be obtained, and the overall behavior of the pier can be analyzed. For example, in the case of the first mode and the second mode, the natural frequency occurs when the phase of the attached measuring instrument is in the same direction, so when the phase difference is 0°, it can be determined as the natural frequency of the first and second mode. In addition, in the case of the third mode, the natural frequency of the pier can be derived when the phase difference occurs 180° because it has torsional behavior.

3.3. Full-Scale Pier Test Results

Through a series of tests, the mode number of the pier was analyzed, and the natural frequency of the pier in each mode was derived. Figure 9a shows the natural frequency of the pier in case-2 where an impact was applied to the top of the pier in the bridge axis direction. The natural frequency was determined to be approximately 15.14 Hz. In addition, the phase was obtained for each height by using the measured values to analyze the behavior of the pier. Figure 9b shows the phase difference results that were obtained by using the phase for each position. It was determined that all of the phase differences where the natural frequency points occurred had a tendency to converge to 0°. This is because all the measuring instruments that were attached to each height were deformed in the same direction. In other words, the behavior of the pier occurred in the same direction. The behavior had a tendency to be similar to the first mode of the pier eigenvalue analysis.
Figure 10a shows the results in case-1 where the natural frequency for each height was derived by applying an impact to the top of the pier in the pier length direction. The natural frequency of the pier was determined to be approximately 22.4 Hz, which is approximately 7 Hz higher in comparison to case-2 (bridge axis direction). This is because the stiffness of the pier was higher in the pier length direction than in the bridge axis direction. This confirms that the difference in the stiffness affected the natural frequency. To examine the behavior of the pier in the pier length direction, the phase difference was analyzed as shown in Figure 10b. In this instance, the phase difference converged to 0° when the natural frequency occurred along with the behavior in the first mode mentioned above. This appears to be similar to the behavior in the second mode of the pier eigenvalue analysis.
Figure 11a shows the natural frequency results in case-3 where the acceleration was measured by applying an impact to the upper outer point of the pier. Two clear natural frequencies were observed, and they were 15.14 and 54.19 Hz. The phase difference results in Figure 11b show that the phase difference converged to 0° at 15.14 Hz. This indicates that the first mode occurred, as the behavior and the natural frequency were the same as those of the first mode. Figure 11b, however, shows that the phase difference was 180° at 54.19 Hz. These results demonstrated that the outer part of the pier behaved in opposite directions; thus, indicating torsional behavior. This behavior was similar to the third mode, and it appeared that applying an impact to the outer point of the pier in the bridge axis direction led to the first mode and the third mode, which was the torsional behavior of the pier. Table 2 summarizes the natural frequency of the pier by the mode number according to the surcharge load.

3.4. Field Pier Test Results

The conditions in the field pier test were mainly divided into three cases: (1) the pier with a girder, (2) the pier without a girder (removed), and (3) the 1 m deep scour on the ground that is adjacent to the pier. The natural frequency of the field pier was analyzed in the same way as the analysis method of the full-scale pier model test. Figure 10 shows the first mode natural frequency under the three field conditions. The natural frequencies under the field conditions were 21, 13, and 9.5 Hz, respectively, as demonstrated in Figure 12a–c. In the first mode, the natural frequency had the most sensitive change according to the field conditions (surcharge load and scour). This indicates that there are limitations in accurately evaluating the stability of the pier using the first mode natural frequency, which is affected by all of the variables.
Figure 13 shows the natural frequency of the second mode for each field condition. The natural frequencies under the field conditions were determined to be 20, 20, and 14 Hz, respectively, as displayed in Figure 13a–c. In the second mode, the natural frequency was identical regardless of the presence of a girder, unlike the first mode. This was similar to the result that the natural frequency of the second mode was not affected by the surcharge load in the full-scale pier model test. Due to the occurrence of scour, the natural frequency was reduced by approximately 6 Hz. Therefore, it is determined that the second mode natural frequency can be used as an indicator that can predict the condition of the ground that is adjacent to the pier without being affected by the surcharge load.
Figure 14 shows the third mode natural frequency for each field condition when the torsional behavior of the pier occurred. The accelerometers were attached to the left and right of the top of the pier. The side that simulated scour was named left and the side that did not simulate scour was named right. There was no significant difference in the third mode natural frequency depending on the field conditions as in the first and second modes. Figure 14a shows the natural frequencies in the torsional behavior (third mode) before removing the girder. It was observed that very similar natural frequencies occur on both sides. In Figure 14b, however, a difference of approximately 2.5 Hz occurred between the natural frequencies that are measured on both sides after the girder removal. This is because the fixed end effect of the upper girder disappeared with the girder removal; thus, restraining the torsional behavior. Figure 14c shows the natural frequency results for the torsional behavior (third mode) when a 1 m deep scour was simulated on one side of the pier. The natural frequency values were determined to be similar to those in Figure 14b, but the acceleration of the side with a 1 m deep scour exhibited a sharp reduction in the amplitude. This indicates that it is possible to predict the location and degree of the scour. Table 3 summarizes the natural frequency results for each mode number of the pier according to the presence of scour. It was confirmed that the presence of scour decreases the natural [29,30,31].

4. Discussion

4.1. Analysis of the Influence of the Surcharge Load through the Full-Scale Pier Test

Figure 15 presents the normalized natural frequency results of the full-scale pier for each mode number according to the surcharge load. As described above, the surcharge load was increased from 0 to 250 kN by 25 kN, and normalization was performed by assuming that the natural frequency that occurred for a surcharge load of 0 kN was 1. In the case of the first mode, the natural frequency showed a tendency to slowly decrease from 1 at 0 kN to 0.55 at 250 kN as the surcharge load increased. In the case of the second and third modes, however, the natural frequency was determined to be 1 or higher regardless of the surcharge load. Hence, the natural frequency of the structural system decreased with increasing mass, therefore the first mode of natural frequency increased eliminating the girder. The natural frequencies of the second and third mode are not significantly affected by the mass because the transverse direction is still stiffer than the longitudinal direction. For these modes, when the surcharge load was 200 kN or higher, it was not possible to calculate the natural frequency because clear signals could not be obtained. These results indicate that the mode number that was most affected by the surcharge load was the first mode.

4.2. Analyzing the Influence of the Scour through the Field Pier Test

Figure 16 shows the normalized natural frequency results for each mode number according to the presence of a scour. Step 0 represents the test results with a girder and step 1 represents the test results after the girder removal. Step 2 represents the test results when the 1 m deep scour was simulated on one side of the ground that is adjacent to the pier. In the case of step 1, the natural frequency of the first mode decreased, but those of the second and third modes were similar. This is in agreement with the result of the full-scale model pier test that the second mode was not affected by the surcharge load. In the case of step 2, the natural frequencies of the first and second modes decreased, but the third mode remained similar. These findings indicate that the mode number that is most affected by the structural condition of the pier and the ground condition is the first mode. If the stability of a pier is evaluated using the first mode, it will be difficult to identify accurate problems. Therefore, it is reasonable to determine the boundary state of the ground that is adjacent to the pier using the second mode, which is affected by the scour in the ground, even though it is not affected by the surcharge load. In addition, the third mode is considered to be an effective method for determining the scour direction in the ground as described above in relation to Figure 12.

5. Conclusions

In this study, the dynamic response analysis was performed on a shallow foundation used as a railroad pier through non-destructive tests. The full-scale model was conducted by constructing a full-scale model pier, and the effect of scouring was performed through the field pier test. Natural frequencies and phase differences were calculated by measuring the acceleration, and the modal number of piers was analyzed. The results of the study are summarized as follows.
  • Using the numerical analysis, the eigenvalue and mode number of the pier were derived according to the direction of impact. Based on this, the test method for the piers that can derive the first, second, and third modes was established through the full-scale model pier test and the field pier test.
  • Through the full-scale model pier, the natural frequencies of the first, second, and third modes were derived when the surcharge load on the pier increased. It was determined that the natural frequency of the first mode decreased as the surcharge load increased, and the second and third modes were not significantly affected by the surcharge load.
  • Through the field pier test, scour was simulated on the ground that was adjacent to the side of the pier to measure the natural frequency when the scour occurred. Due to the influence of the scour, the first mode exhibited the largest decrease in the natural frequency, followed by the second and third modes. In the case of the third mode, the amplitude of the acceleration was significantly small on the side that simulated the scour even though the natural frequency change was the smallest. This indicates that the direction of the scour can be determined through the third mode.
  • The results of the full-scale model pier test and the field pier test showed that the mode number that is most affected by the surcharge load and the scour is the first mode. If the stability of a pier is evaluated with the first mode, there are limitations in identifying accurate problems. Therefore, it is reasonable to determine the boundary state of the ground that is adjacent to the pier by using the second mode, which is not affected by the surcharge load.
  • These research results have a limitation for applying to other types of bridge piers and can be applicable to the deteriorated bridge with a shallow foundation and a plate girder. For further study, additional field tests and analysis will be performed and an indicator will be suggested for applying other type foundations, such as pile foundation.

Author Contributions

M.L. organized the paperwork, made a test plan, performed the impact load test; M.Y. and H.-S.J. helped the data analysis; K.H.K. performs numerical analysis; I.-W.L. supported making a test plan; all authors contributed to the writing of the paper. All authors have read and agreed to the published version of the manuscript.

Funding

This research was supported by a grant from R&D Program (PK2002A4) of the Korea Railroad Research Institute, Republic of Korea.

Conflicts of Interest

The authors declare no conflict of interest.

References

  1. Shirole, A.M.; Holt, R.C. Planning for a comprehensive bridge safety assurance program. Transp. Res. Rec. 1991, 1290, 137–142. [Google Scholar]
  2. Smith, D.W. Bridges failures. Proc. Inst. Civ. Eng. 1976, 60, 367–382. [Google Scholar] [CrossRef]
  3. Ng, S.K.; Razak, R.A. Bridge hydraulic problems in Malaysia. In Proceedings of the 4th International Seminar on Bidges and Aqueducts 2000, Mumbai, India, 7–9 February 1998. [Google Scholar]
  4. Lopardo, R.A. Some Aspects of the Argentine Experience on Local Scour; No. 19; Briaud, J.L., Ed.; ISSMGE Technical Committee-33 on Scour of Foundations: Melbourne, VIC, Australia, 2000; pp. 210–218. [Google Scholar]
  5. Arneson, L.A.; Zevenbergen, L.W.; Lagasse, P.F.; Clopper, P.E. Hydraulic Engineering Circular No. 18: Evaluating Scour at Bridges; US Department of Transportation: Washington, DC, USA, 2012.
  6. Lagasse, P.F.; Schall, J.D.; Richardson, E.V. Hydraulic Engineering Circular No. 20: Stream Stability at Highway Structures; Rep. No. FHWANHI-01; US Department of Transportation: Washington, DC, USA, 2001; Volume 2.
  7. Lagasse, P.F.; Byars, M.S.; Zevenbergen, L.W.; Clopper, P.E. Hydraulic Engineering Circular 23: Bridge Scour and Stream Instability Countermeasures: Experience. Selection and Design Guidance; FHWA HI-97-030; US Department of Transportation: Washington, DC, USA, 1997.
  8. Briaud, J.L.; Chen, H.C.; Kwak, K.W.; Han, S.W.; Ting, F.C.K. Multiflood and multilayer method for scour rate prediction at bridge piers. J. Geotech. Geoenviron. Eng. 2001, 127, 114–125. [Google Scholar] [CrossRef]
  9. Annandale, G.W.; Wittler, R.J.; Ruff, J.F.; Lewis, T.M. Prototype validation of erodibility index for scour in fractured rock media. In Water Resources Engineering ’98; ASCE: Reston, VA, USA, 1998; pp. 1096–1101. [Google Scholar]
  10. Breusers, H.N.C. Conformity and time scale in two-dimensional local scour. In Hydraulic Engineering Reports; Hydraulic Research Laboratory: Poona, India, 1966. [Google Scholar]
  11. Zampieri, P.; Zanini, M.A.; Faleschini, F.; Hofer, L.; Pellegrino, C. Failure analysis of masonry arch bridges subject to local pier scour. Eng. Fail. Anal. 2017, 79, 371–384. [Google Scholar] [CrossRef]
  12. Scozzese, F.; Ragni, L.; Tubaldi, E.; Gara, F. Modal properties variation and collapse assessment of masonry arch bridges under scour action. Eng. Struct. 2019, 199, 109665. [Google Scholar] [CrossRef]
  13. Cooley, J.W.; Tukey, J.W. An algorithm for the machine calculation of complex Fourier series. Math. Comput. 1965, 19, 297–301. [Google Scholar] [CrossRef]
  14. Prendergast, L.J.; Gavin, K. A review of bridge scour monitoring techniques. J. Rock Mech. Geotech. Eng. 2014, 6, 138–149. [Google Scholar] [CrossRef]
  15. Zhang, R.R.; King, R.; Olson, L.; Xu, Y.L. Dynamic response of the Trinity River Relief Bridge to controlled pile damage: Modeling and experimental data analysis comparing Fourier and Hilbert-Huang techniques. J. Sound Vib. 2005, 285, 1049–1070. [Google Scholar] [CrossRef]
  16. Chen, C.C.; Wu, W.H.; Shih, F.; Wang, S.W. Scour evaluation for foundation of a cable-stayed bridge based on ambient vibration measurements of superstructure. NDT E Int. 2014, 66, 16–27. [Google Scholar] [CrossRef]
  17. Dackermann, U.; Yu, Y.; Niederleithinger, E.; Li, J.; Wiggenhauser, H. Condition assessment of foundation piles and utility poles based on guided wave propagation using a network of tactile transducers and support vector machines. Sensors 2017, 17, 2938. [Google Scholar] [CrossRef] [Green Version]
  18. Maroni, A.; Tubaldi, E.; Ferguson, N.; Tarantino, A.; McDonald, H.; Zonta, D. Electromagnetic sensors for underwater scour monitoring. Sensors 2020, 20, 4096. [Google Scholar] [CrossRef] [PubMed]
  19. Sanayei, M.; Maser, K.R. Bridge foundation stiffness identification using static field measurements. In Proceedings of the 1999 Structures Congress, New Orleans, LA, USA, 18–21 April 1999; ASCE: Reston, VA, USA, 1999; pp. 320–323. [Google Scholar]
  20. Nishimura, A. A study on the Integrity Assessment of Railway Bridge Foundations. RTRI Rep. 1989, 3, 41–49. (In Japanese) [Google Scholar]
  21. Haya, H.; Sawada, R.; Nishimura, A.; Koda, M. Comparison of impact vibration test with microtremor measurement for spread foundation piers. RTRI Q. Rep. 1995, 36, 71–77. [Google Scholar]
  22. Samizo, M.; Watanabe, S.; Fuchiwaki, A.; Sugiyama, T. Evaluation of the structural integrity of bridge pier foundations using microtremors in flood conditions. Q. Rep. RTRI 2007, 48, 153–157. [Google Scholar] [CrossRef] [Green Version]
  23. Keyaki, T.; Yuasa, T.; Naito, N.; Watanabe, S. Soundness evaluation method of the ground around the Pier foundation against scouring by microtremor measurements at both sides of the bridge piers. Geotech. J. 2018, 13, 319–327. (In Japanese) [Google Scholar] [CrossRef]
  24. Samizo, M.; Watanabe, S.; Fuchiwaki, A.; Sugiyama, T.; Okada, K. Proposal of an algorithm for estimating the natural frequency of railway bridge piers under flood conditions. Proc. Jpn. Soc. Civ. Eng. F 2010, 66, 524–535. (In Japanese) [Google Scholar] [CrossRef] [Green Version]
  25. Abe, K.; Nozue, M. Monitoring method of soundness of railway bridge piers across a river. Railw. Res. Rep. RTRI 2016, 30, 29–34. (In Japanese) [Google Scholar]
  26. Masahiro, S. Diagnostic technology of railway bridge substructure using vibration. Acoust. Soc. Jpn. 2013, 69, 133–138. (In Japanese) [Google Scholar]
  27. Japan’s Ministry of Land, Infrastructure and Transport. Railway technical research institute, standard for maintenance and management of railway structures, etc. In Explanation (Structures), Foundations Anti-Earth Pressure Structures; Maruzen: Tokyo, Japan, 2007. (In Japanese) [Google Scholar]
  28. DIANA FEA. Finite Element Analysis User’s Manual—Release 10.2; DIANA FEA: Delft, The Netherlands, 2017. [Google Scholar]
  29. Prendergast, L.J.; Hester, D.; Gavin, K.; O’Sullivan, J.J. An investigation of the changes in the natural frequency of a pile affected by scour. J. Sound Vib. 2013, 332, 6685–6702. [Google Scholar] [CrossRef]
  30. Prendergast, L.J.; Gavin, K.; Doherty, P. An investigation into the effect of scour on the natural frequency of an offshore wind turbine. Ocean. Eng. 2015, 101, 1–11. [Google Scholar] [CrossRef] [Green Version]
  31. Ju, S.H. Determination of scoured bridge natural frequencies with soil-structure interaction. Soil Dyn. Earth Eng. 2013, 55, 247–254. [Google Scholar] [CrossRef]
Figure 1. Schematic view of the pier: (a) full-scale model pier and (b) field bridge pier.
Applsci 10 06741 g001
Figure 2. Target pier for the impact load test. (a) Full-scale model pier and (b) field bridge pier.
Applsci 10 06741 g002
Figure 3. Equipment used in the experiment. (a) Data logger and (b) weight.
Applsci 10 06741 g003
Figure 4. Pier of field experiment (a) With girder on the pier and (b) without girder on the pier.
Applsci 10 06741 g004
Figure 5. Simulated ground scour (scour depth = 1000 mm).
Applsci 10 06741 g005
Figure 6. Conceptual diagram for the impact and measurement directions.
Applsci 10 06741 g006
Figure 7. Mode number analysis. (a) First mode; (b) second mode, and (c) third mode.
Applsci 10 06741 g007
Figure 8. Natural frequency analysis method. (a) Representative signal; (b) representative natural frequency; and (c) representative phase.
Applsci 10 06741 g008
Figure 9. Results of the impact vibration load test in the bridge axis direction. (a) Natural frequency of the first mode and (b) phase difference of the first mode.
Applsci 10 06741 g009
Figure 10. Results of the impact vibration load test in the pier length direction. (a) Natural frequency of the second mode and (b) phase difference of the second mode.
Applsci 10 06741 g010
Figure 11. Results of the impact vibration load test in the bridge axis direction (outside). (a) Natural frequency of the third mode and (b) phase difference of the third mode.
Applsci 10 06741 g011
Figure 12. First mode natural frequency for each field condition. (a) With a girder; (b) Without a girder; and (c) 1 m deep scour on the ground adjacent to the pier.
Applsci 10 06741 g012
Figure 13. Second mode natural frequency for each field condition. (a) With a girder; (b) without a girder; and (c) 1 m deep scour on the ground adjacent to the pier.
Applsci 10 06741 g013aApplsci 10 06741 g013b
Figure 14. Third mode natural frequency for each field condition. (a) With a girder; (b) without a girder; and (c) 1 m deep scour on the ground adjacent to the pier.
Applsci 10 06741 g014aApplsci 10 06741 g014b
Figure 15. Normalized natural frequency according to the surcharge load (first, second, and third modes).
Applsci 10 06741 g015
Figure 16. Normalized natural frequency according to the presence of the scour (first, second, and third modes).
Applsci 10 06741 g016
Table 1. Test cases.
ClassificationImpact DirectionSurcharge LoadScourImpact Location
Full-scale pier model testCase-1Pier length direction0–250 kN (increase by 25 kN)N/ATop of the pier
Case-2Bridge axis direction
Case-3Bridge axis direction (outside)
Field testCase-1Pier length directionN/A1-m depth
Case-2Bridge axis direction
Case-3Bridge axis direction (outside)
Table 2. Natural frequency results of the full-scale model pier according to the surcharge load.
Surcharge Load (kN)First Mode (Hz)Second Mode (Hz)Third Mode (Hz)
022.4015.1454.19
2523.4014.6555.66
5024.4013.6756.12
7522.9512.7056.61
10022.4012.2057.12
12523.9011.2354.20
15024.4010.7455.18
17523.5010.2555.66
200N/A9.766N/A
225N/A9.765N/A
250N/A8.3N/A
Table 3. Natural frequency results of the field pier according to the presence of a scour.
Test ConditionBridge Axis Direction (Hz)
(First Mode)
Pier Length Direction (Hz)
(Second Mode)
Torsion (Hz)
(Third Mode)
Left
(with Scour)
Right
(without Scour)
With a girder21206363
Without a girder132060.563
Without a girder and simulated 1 m deep scour9.5146062.5

