Abstract
The hybrid system of wave energy converters (WECs) using coastal structures is an attractive issue in terms of a decrease in construction costs and an improvement of the ability to capture wave energy. Most studies on the utilization of reflected waves from structures, which is one of the hybrid systems, are limited to mathematical analysis based on linear theories. Therefore, this paper presents fundamental experimental results in the presence of a reflection wall simplified as a coastal structure behind a bottom-hinged flap-type WEC under unidirectional regular waves. The behavioral characteristics and the power generation efficiency ke of the flap were investigated, focusing on wave steepness, initial water depth, and distance from the reflection wall. The results show that the condition of the initial water depth being smaller than the flap height is more effective in terms of avoiding unstable rotating of the flap. The maximum ke appeared slightly far from the node position of the standing waves because the flap shape and the power take-off (PTO) damping induce the phase difference between the reciprocating behavior of the flap and the period of the standing wave. The results imply that the optimum position of a WEC is dependent on WEC shape, PTO damping, and installation water depth.
1. Introduction
The world’s total CO2 emissions have presently reached an all-time high. According to the World Energy Outlook (WEO) 2019 report published by the International Energy Agency (IEA [1]) on 13 November 2019, if countries around the world maintain their current energy policies, the energy demand is expected to increase by 1.3% each year until 2040. To meet the need for reducing CO2 emissions and energy services, it is necessary to accelerate investments in cleaner and more efficient energy technologies (consider issues such as climate change and fossil fuel depletion). The US Energy Information Administration (EIA) has predicted that by 2050, renewable energy will account for approximately 28% of the total global energy consumption, and approximately 49% of the total electricity production [2]. In particular, it has been announced that wind power generation is expected to account for 20% of the power generation capacity by 2021, and solar power generation is expected to grow significantly, accounting for more than 43% of the power generation capacity by 2050.
Among the various resources of renewable energy, wave energy is not the most widely used but has extremely high potential in comparison with solar energy and wind power. Wave energy not only has greater power than other renewable energy sources but is also reliable. The energy densities of wind energy and solar energy per unit area are 0.4–0.6 and 0.1–0.2 kW/m2 respectively, whereas that of wave energy is 2–3 kW/m2 [3]. Additionally, wave energy has a wide range of applications as a renewable energy resource. It is known that the total amount of theoretical wave energy that can be generated is approximately 3.7 TW [4]. In Japan particularly, which is surrounded by seas, an average of 36 GW of electric power can be obtained from wave energy [5]; 36 GW is a value that accounts for approximately 12% of Japan’s total power generation capacity, based on the 2016 standard. When the annual residential electricity use per capita is 7480 kWh [6], the value of 36 GW amounts to 4800 times as much. In the case of wind and solar power generation equipment, it is possible to generate electricity only for approximately 20–30% of the time in a day, whereas wave energy converters (WECs) have almost no time restrictions, and can generate electricity for up to 90% of the time in a day [7]. Therefore, at night when the electricity consumption is low, it is possible to store the generated power and use secondary energy resources that can be stored and transported in combination with a hydrogen production device. Approximately 37% of the world’s population lives within 90 km of a coast. As a result, mutual understanding of resource supply and demand is possible, enabling the installation of WECs in multiple locations [3]. From an environmental point of view, the negative impact of the wave energy recovery device on the environment is the lowest, thereby generating low environmental load [8].
WECs can be classified into onshore, nearshore, and offshore structures, depending on the installation locations [9]. Onshore devices are typically located in coastal regions as oscillating water column (OWC) types accompanying turbine-generators [10,11,12,13,14,15,16,17]. Nearshore devices are generally installed at a water depth of 10–25 m several hundred meters away from the coast [18,19,20], and offshore WECs are installed in the open sea with a depth of more than 40 m as floating types and submerged sea-bed fixed types [21,22,23]. WECs are can also be classified into attenuators (e.g., Pelamis [23]), point absorbers (e.g., PowerBuoy [22]), and terminators (e.g., Wave Dragon in Denmark [24]) depending on the size and direction of the device with respect to the waves [3]. Furthermore, WECs can be classified by the working principle into pressure differential devices (e.g., OWC devices and Limpet [14]), floating structures (e.g., Pelamis and PowerBuoy), overtopping devices (e.g., sea-wave slot-cone generator (SSG) in Norway, [25]), and impact devices (e.g., Oyster in Scotland [18]). Impact devices are structures generally installed perpendicular to the wavefront (Terminator type) and composed of a sea-bed fixed flap. As these devices can directly absorb wave energy, the most considerable mean annual absorbed wave energy (kW) and the annual absorbed energy per characteristic surface area (MWh/m2) are obtainable in comparison with other types of WECs [26].
Wave power generation technologies in Japan have been developed by a pioneer, Yoshio Masudam, who was the father of modern wave energy technology in the 1940s [27], and Mighty Whale floating OWC, which succeeded it in the full-scale test in the 1990s [28]. In contrast, except for the Muroran Institute Technology, which developed the Pendulor device [29], and Gyrodynamics Co Ltd., which developed the gyroscopic WEC [30], the leading position has been lost in recent decades [9]. In comparison with the United States and Europe, the wave power in Japan is not so great. However, the availability of wave power is high owing to its proximity to the sea, when suitable WECs match the Japanese marine environment. In Japan, caissons, breakwaters, and seawalls have been constructed near and on the shore not only to protect coastal areas from typhoons, high waves, and coastal erosions, but also to maintain calmness around harbors. These coastal structures play a vital role in reducing the wave energy flowing into the coast by dissipating the incoming wave energy and reflecting it back to the open sea. When these structures are harnessed by themselves and the hydrodynamics around the structures, lower cost and higher power generation efficiency are expected.
The hybrid system of WECs using the coastal structure is an ongoing project worldwide including already developed devices with real scale or prototype tests, occasionally named “new green harbor breakwater” [31], e.g., an OWC integrated into a caisson [10,32,33,34,35], and an overtopping device (OTD) integrated into a breakwater [25,36,37,38]. In contrast, there is less attention being paid to a hybrid system of WECs as an independent structure of WECs installed outside of structures rather than inside. Sarkar et al. [39] mathematically analyzed the power performance of an oscillating wave surge convertor (OWSC) in the presence of an infinite vertical wall presuming a straight coast behind the OWSC. They demonstrated that the wave energy capturing performance was 0 when the flap was positioned at the anti-node of the standing wave formed by the vertical wall and was at its maximum at the node. They also indicated that the capturing performance of the wave energy could be up to four times larger than when there was no vertical wall behind the open sea. Additionally, the power performance of the OWSC with breakwater behind it was more than double the efficiency of the capturing wave energy when the width of the breakwater was twice that of the OWSC. Thus, it was clarified that it is optimal to have a width of 1.5 times that of the OWSC when considering economic efficiency [40]. An OWSC is a terminator type WEC installed perpendicularly to the wave front and is thereby expected to have not only a wave power generation function but also an effect on the attenuating wave energy coming from the open sea. The seabed-fixed OWSC, which can absorb a large amount of wave energy from the ocean and the coastal structures, is appropriate from the viewpoint of the improvement of power generation efficiency in Japan where wave energy is relatively small. Furthermore, it is also possible to reduce the installation and maintenance costs by using breakwaters as bases for the power take-off (PTO) systems corresponding to the secondary conversion stage of the energy conversion [3]. Here, the secondary conversion stage is a stage in which the motion converted in the primary conversion stage is used to operate a generator with a turbine or a motor to convert it into electric energy. The primary conversion stage is a stage in which the oscillatory motion of the waves is converted into useful motion, such as air- and water-flow, and a mechanical system can use that for power generation.
The study on power generation characteristics when there is a structure behind WECs is substantially limited apart from the studies of a mathematical analysis based on linear theories [39,40]. Since the hydrodynamic nonlinearity around WECs owing to the shape of WECs, a reflecting wall, and the effect of a PTO damping is predicted, it is necessary to evaluate the effects of non-linearity and consistency with linear theory by hydraulic experiments. Therefore, this study focuses on the effects of the installation positions of WECs on the behavioral characteristics of WECs and other hydraulic characteristics, which result in WECs being unstable before the improvement of wave power generation efficiency by utilizing coastal structures.
This study examines the behavioral characteristics of a bottom-hinged flap-type WEC with a vertical wall behind it, as an additional facility for breakwaters, via laboratory experiments in unidirectional regular waves. The flap has the shape of an inverted triangular prism with an empty interior, which is similar to the hull intending to increase the restoring force to return to the original position by buoyancy. For evaluating power performance according to the WEC behavior, the PTO system adopts a rotary generator with a simple gear system that generates power in directions adhering to the rotational direction of the flap. Details of the WEC and the PTO system are presented in Section 2. The experimental analysis method is described in Section 3. Section 4 presents the results of the behavioral characteristics and the power generation performance under each condition, such as initial water depth, distance from the reflection wall, and wave steepness. Moreover, the effects of the flap motion on the power generation efficiency are discussed. Finally, the summary of the experimental results is presented in Section 4.
2. Materials and Methods
A bottom-hinged flap-type WEC can be considered as a part of a breakwater, thereby reducing the costs of installation and maintenance. The wave energy converter system is mainly composed of a WEC (a flap) and a PTO system (a rack gear, shafts, one-way rotating gears (cam clutch), and an electric generator). A flap is fixed to the bottom of a wave tank by a hinge and rotates back and forth, similar to a pendulum, due to the incident and reflected waves. The rack gear fixed to the upper part of the flap reciprocates back and forth with the flap movement and rotates a shaft connected to the rack gear in both directions, clockwise (shoreward) and counterclockwise (seaward). Two rotary generators were installed to operate in different rotational directions of a flap by using cam clutches coupled to a shaft. The WEC harnesses incident waves from the sea and reflected waves that are induced by the breakwaters behind a flap.
2.1. Experimental Description
Laboratory experiments were conducted in a two-dimensional wave tank (length: 30 m, width: 0.7 m, depth: 0.9 m). A piston-type wave generator system was installed at one end of the water tank. As the hydraulic experiment using a wave generation system can generate the desired waves to simulate the ocean conditions, it can provide a lot of information about the designed WEC before the prototype experiments [41,42]. Figure 1 illustrates a schematic diagram of the laboratory experiment. A reflection wall assuming a breakwater was set up 20 m away from the wave generator. Electric capacitive type water level gauges W1–W7 (KENEK, CHT 6-43-SQ) were installed at five positions between the wave generator and the flap and at two positions between the flap and the reflected wall to measure the water level variations.
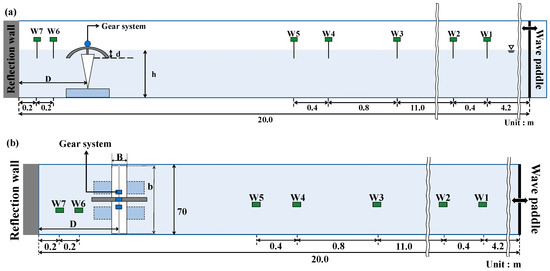
Figure 1.
Schematic sketch of the experimental setup: (a) side view, (b) plan view. W1–W7 denote the water level gauges; h is the water depth; D indicates the distance between the flap and reflection wall; d is the submergence depth of the flap; and B and b are the width and length of the upper part of an inverted triangular prism, respectively.
The experimental conditions are presented in Table 1. A total of 328 cases of experiments were performed with 7 different incident wave heights Hin (0.02 m interval), 5 wave periods T (0.4 s interval), 5 initial water depths h (= 0.0475 m, ± 0.035 m, ± 0.05 m), and 2 different distances D (= 1.09 m, 1.45 m) from the reflection wall. Some cases (22 cases) showing unstable wave generating were excluded in this study owing to the limitations of wave generators. The installed position of the flap D was changed to examine the effects of the distance from the reflected wall on the characteristics of the flap behavior and power generation performance. In particular, this study focused on the effects of the node and anti-node positions at which maximum and minimum wave energy capturing performances were expected. Therefore, unidirectional regular waves were generated to form idealized standing waves in front of a reflected wall. D was set for including the node (D/L = 0.25) and anti-node (D/L = 0.5) positions of standing waves. D/L indicates the distance from the reflection wall D and the wavelength L ratio. For D = 1.09 m, D/L ranged from 0.1667 to 0.4463, and for D = 1.45 m, D/L ranged from 0.2217 to 0.5937. It is noted that D/L was confined in this study by varying wave periods and still water depths under the condition of the fixed flap position. Different water depths and wave heights were adopted to investigate the influences of still water depth and wave steepness on flap behaviors.

Table 1.
Experimental conditions.
As depicted in Figure 2, the flap was designed in the shape of an inverted triangular prism with a height of 0.40 m (height of the triangle), length of 0.68 m (distance between the triangular faces), and width of 0.15 m (length of one side of the triangle). The flap was composed of 1 cm thick acrylic plates in the body, 0.04 m thick triangular acrylic blocks at both ends, and two stainless steel bearings at the bottom that acted as hinges. Channels made of steel (length: 0.50 m, width: 0.125 m) were installed at the bottom to connect to the flap, and the position of the channel was fixed with a weight. The hinge of the flap and the channel were coupled using a hinge pin so that the pendulum could rotate around the hinge. As the flap was a floating body in the shape of an inverted triangular prism with an empty interior, it had the characteristic of restoring itself to its original position even when inclined by waves.
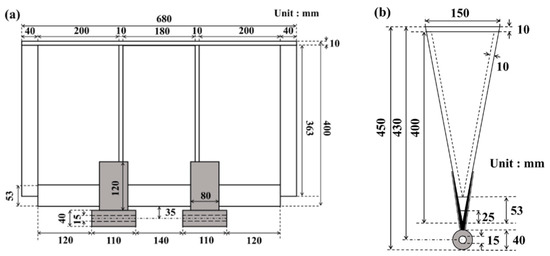
Figure 2.
Flap design with an inverted triangular prism shape: (a) front view and (b) side view.
A rack gear was attached to the upper part of the flap to operate a gear system connected to the rotary generators with the reciprocating motion of the flap. In a previous study by Morimoto and Mizutani [43], it was not possible to evaluate the power generation efficiency in high wave height conditions because a rack gear with the shape of a straight rod attached to a flap was separated from the gearbox. Therefore, a curved, round rack gear, as depicted in Figure 3, was designed in this study so that the rack gear was hardly separated even in high waves.
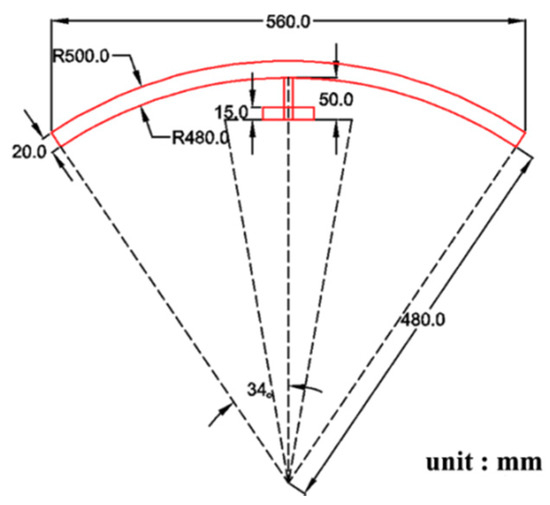
Figure 3.
Curved, round rack gear attached to the upper part of the flap.
The round rack gear was manufactured by pasting a flexible rack gear (DR1-2000) made of plastic on top of an aluminum-based arch structure (central angle: 68°, thickness: 0.02 m). To minimize the energy loss due to friction between the gears, in this study, a simplified PTO system that generated electricity in one direction by applying two rotary generators with a simple gear structure was adopted. Specifically, as depicted in Figure 4, it consisted of a shaft, gears 1–3, and a cam clutch.
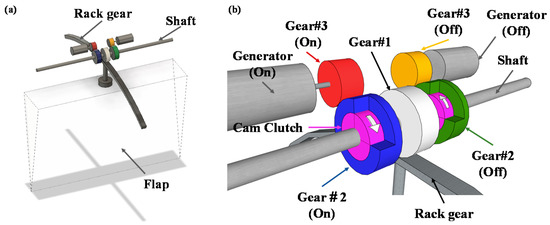
Figure 4.
Simplified power take-off system with the flap: (a) full view and (b) detailed view.
Gear 1 is fixed to the shaft and meshes with the rack gear, which is fixed to the upper part of the flap. When the flap reciprocates owing to the waves, the meshing of gear 1 with the rack gear shaft is rotated with the shaft. On the shaft, two cam clutches that rotate in only one direction are fixed. Each cam clutch rotates according to a ratchet mechanism when the direction of the white arrow (shown in Figure 4b) and that of the shaft rotation match. However, when the rotary shaft rotates in a direction opposite to the direction of the arrow, the cam clutch shifts to idling. The cam clutches are installed so that the effective rotation is in the opposite direction. Gear 2 is sandwiched and fixed to the outside of each cam clutch. When the cam clutch rotates, gear 2 rotates, and the meshing of gear 3 with gear 2 also rotates simultaneously. Gear 3 is connected to a rotary generator, and the generator operates when gear 3 rotates. The detailed specifications of the gear units are presented in Table 2.
Table 2.
Specification of respective parts in PTO system.
When the flap rotates shoreward, gear 1 and the shaft rotate in the clockwise direction, as illustrated in Figure 4a. Additionally, gear 2 (on), depicted in Figure 4a in blue, rotates in the clockwise direction and gear 3 rotates in the counterclockwise direction. Finally, gear 3 activates one of the generators. When the flap rotates seaward, gear 2 (off) depicted in green, rotates in the counterclockwise direction, and gear 3 rotates in the clockwise direction. Thereafter, another generator is activated. As for the opposite directions, as described above, gear 2 does not rotate due to the idle rotation. Each generator is then inactivated.
The cam clutch has the effect of not only rotating only in one direction but also reducing the effect of the starting torque of the rotary generator. The rotary generator generally exhibits the most considerable torque during activation from a stationary state. If two generators are installed without cam clutches, the damping effects of the PTO system increase two-fold, thereby making it difficult for the flap to rotate. In contrast, by making the cam clutch contribute to the idle rotation in a direction opposite to the effective rotating direction, the damping effects on the motion of a flap by two generators can be reduced to that of one in the effective rotation direction.
A brushless direct current (BLDC) geared motor developed by Nakatsu MFG Co. Ltd. in Sayama City, Japan (NS-37SGJ-25-24J36SBLA1), which can control the rotation speed as a generator, was utilized as a rotary generator (hereafter, referred to BLDC generator). It can be used as a generator by removing the drive circuit inside the motor, thereby limiting the reverse flow of the current. The BLDC generator is composed of a BLDC generator and a gear head. General direct current generators have a brush that plays the role of passing current from a commutator rotating inside the generator to an external circuit. As the brush brings the commutator in contact with the switch, it is prone to wear due to friction and needs to be replaced regularly, thereby generating high maintenance costs. In contrast, the BLDC generator has the advantage of low maintenance cost and high power generation efficiency because there is no brush inside the generator, causing less friction. Additionally, BLDC generators can retain uniform torque over a wide speed range in comparison to alternating current (AC) generators, which induce torque loss when the rotation speed increases. The gear head can decelerate or accelerate the rotation speed by combining gears with different numbers of teeth. When two gears mesh with each other, the ratio of the rotation angle to angular velocity is the reciprocal of the ratio of the number of teeth. For example, when a gear with a large number of teeth (90) and a gear with a small number of teeth (20) mesh with each other, the angular velocity of the smaller gear is 4.5 times that of the larger gear (e.g., the larger gear rotates 240° when the smaller gear rotates 3 times). However, the torque of the larger gear with low rotational speed becomes 4.5 times that of the smaller gear, making the rotation of the WEC difficult. The gear head can increase the amount of power generation by accelerating the rotational speed inside the generator with relatively low rotations outside the generator. If the force that rotates the generator increases, the optimum rotational speed should be controlled based on the marine environments.
Generators can be classified into single-phase and multi-phase generators. As the number of phases increases, power losses can be reduced. However, the required electrical equipment and construction costs increase significantly. Three-phase generators that can supply power most comfortably while minimizing power losses are commonly used not only in daily life but also in power plants. Therefore, a three-phase BLDC generator was used in this study. Although the current waveform of a three-phase BLDC generator has a regular change in the polarity of the (+) and (−) poles, such as the AC in an AC generator, electricity rectifies the three-phase AC into DC. Consequently, the voltage increases by times. In this experiment, the voltage produced by the generator was rectified using a three-phase bridge rectifier (TOSHIBA, 30L6P45), and the rectified voltage was measured using a data logger. As the allowable measurement range of the data logger was within ± 10 V, the output voltage from the generator was reduced to within 10 V by using a voltage divider circuit. Figure 5 illustrates schematic diagrams of the voltage divider circuit. Vin is the voltage converted to DC by the rectifier, and Vout is the voltage measured by the data logger.
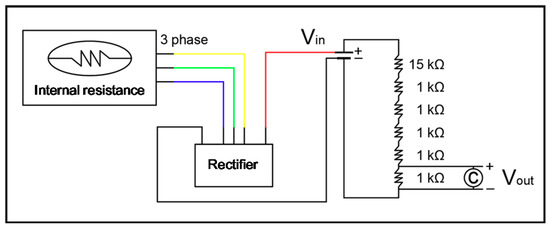
Figure 5.
Schematic of a voltage divider circuit.
To reduce the voltage of Vin, one resistor of 15 kΩ and five resistors of 1 kΩ (total resistance of 20 kΩ) were connected in series on the breadboard. C is a condenser. Vin was calculated using Equation (1) as follows:
A gyro sensor (wit-motion, BWT61CL) that could measure the rotation angle of the flap in real-time was introduced to examine the behavior pattern of the pendulum. It was attached to the upper part of the flap together with the round rack gear. The measured data could be obtained wirelessly via Bluetooth. Additionally, the gyro sensor was sealed with a freezer bag so that it would not come in direct contact with the water. To investigate the behavioral characteristics of the flap, the rotation angle θx of the flap was measured. The experiments were composed of two parts: investigating the natural oscillation period of the flap, and determining the power generation efficiency, depending on the hydraulic conditions. In the former experiment, a time series of the rotation angles of the flap was measured when the flap was tilted in one direction in still water and then released. The experiments were conducted six times each on both sides (12 times in total).
2.2. Reflection Coefficient
The reflection coefficient kr was calculated according to the method proposed by Lin and Huang [44] based on four wave gages (W2–W5 in Figure 1) installed on the offshore side of the flap in Figure 1. Lin and Huang [44] extended the method of Mansard and Funke [45] to separate the free and bound waves of the incident and reflected waves based on four or more water level fluctuation data under the regular wave conditions. Lin and Huang’s method separates the first and nth harmonics of the free and bound waves of the incident and reflected waves using each water level fluctuation datum. Then, the reflection coefficient kr was calculated by Equation (2), based on each amplitude of the separated incident and reflected waves.
where a is the amplitude and superscripts 1 and n are the first and nth harmonic waves, respectively. The first subscripts i and r denote the incident and reflected waves, and the second subscripts b and f denote the bound (locked mode) and free (free mode) waves, respectively. The separation method and process are specifically described in Lin and Huang (2004). As the decomposed incident wave heights tend to be overestimated under the relatively long period wave conditions, the results of kr, only when the decomposed incident wave height is within ± 0.02 m of the targeted input wave height, are discussed in this paper.
2.3. Estimation of Power Generation Efficiency
The voltage Vout measured from the voltage divider circuit was converted to Vin, as depicted in Figure 5, and the converted voltage is regarded as the output voltage obtained from the rotary generator (BLDC motor). The generated power Pwec_on (shore direction) and Pwec_off (offshore direction) were calculated from the relationship, Pwec_on/off = Vin/R2, using the resistance R (=V0/(Isatll–Iidle)) based on the motor specifications, as presented in Table 3.
Table 3.
Specifications of the brushless direct current (BLDC) motor.
The total generated power Pwec_both was determined by the summation of Pwec_on and Pwec_off. As Pwec_both changed with time owing to periodic wave motions, the average value PWEC for one wave period was calculated using Equation (3). The averaged value for each wave period was calculated for 15 wave periods of 100 s after the wave generation, and then the upper and lower 20% of PWEC were excluded to minimize the effects of temporal fluctuations. Consequently, PWEC was obtained by averaging the remaining six averaged values.
The depth-integrated and time-averaged wave energy power Pwave was calculated by Equation (4) through applying the linear wave theory.
where ρ is the water density, g is the gravitational acceleration, Hi is the incident wave height, Bw is the distance between the triangular faces of the flap, T is the incident wave period, L is the wavelength, and h is the water depth.
The power generation efficiency ke was calculated using Equation (5) by dividing Pwec by Pwave.
3. Results and Discussions
3.1. Natural Frequency of the Flap
Figure 6 depicts the results of the free fluctuation test for the flap. When the flap was tilted to the onshore side, θx was negative (0° in the still water state). The natural frequency was calculated using the θx data (up to 2 s after the release) within a range that was not affected by the turbulence around the flap after it returned to its original position. From the figure, it is clear that the natural period Tf for the flap to return to its original position is 2 s (0.5 Hz), regardless of the initial tilted angle (≈35–55°). The flap hardly shook after returning to its original position.
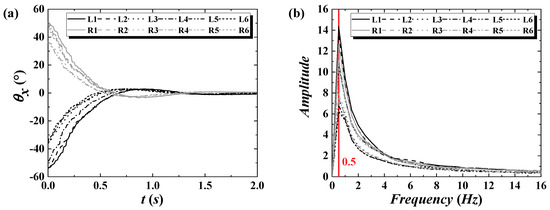
Figure 6.
Results of free fluctuation tests of the flap for (a) the time variation of the rotation angle θx measured by the gyro sensor and (b) the natural frequency. L1–6 and R1–6 denote the cases of the flap initially tilted to the onshore (left side) and offshore sides (right side), respectively.
3.2. Behavioral Characteristics of the Flap
The behavioral characteristics of the flap, according to the experimental conditions, can be classified into five patterns, as illustrated in Figure 7. The solid gray line in the figure denotes the rotation angle θx of the flap, and the brown and light blue dotted lines denote the output voltages of Von and Voff.
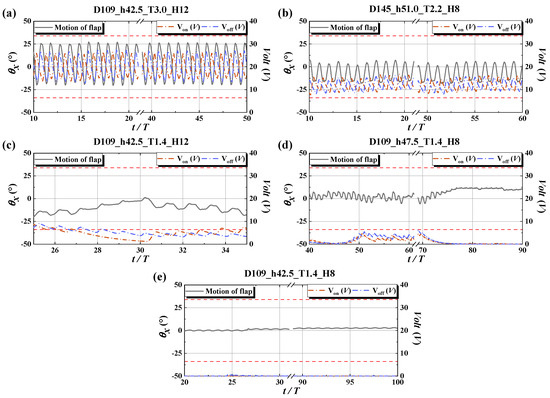
Figure 7.
Behavioral characteristics of the flap for (a) pattern A (stable), (b) pattern B (fluctuation), (c) pattern C (unstable), (d) pattern D (loss), and (e) pattern E (Pwec = 0). Capitals of each subtitle indicate experimental conditions; e.g., D109_h42.5_T3.0_H12 denotes the distance from the reflection wall D (=1.09 m), water depth h (=0.425 m), wave period T (=3.0 s), and wave height Hi (=0.12 m).
Each pattern is defined as follows:
- Pattern A (stable, 108 cases): the flap rotated stably with incident waves.
- Pattern B (fluctuation, 66 cases): the flap behavior changed with time.
- Pattern C (unstable, 40 cases): the behavior of the flap changed randomly during the experiment.
- Pattern D (loss, 65 cases): the flap did not return to its original position after moving several times so that the flap lost its restoring force and remained stationary in the water.
- Pattern E (PWEC = 0, 49 cases): the flap did not move during experiments.
It can be confirmed that in all patterns, Von and Voff increased and decreased with the rotational direction of θx. Voff becomes maximum when θx is maximum, whereas Von becomes maximum when θx is minimum.
Pattern A depicts the behavior of the flap rotating periodically with a constant angle, as illustrated in Figure 7a. In contrast, θx in pattern B fluctuates owing to the long period component contained in the main period component (see Figure 7b). The long period fluctuation in pattern B is a particular phenomenon induced by the closed experimental region in which an undoubtedly long period, such as resonance, occurs. This pattern can be generated by the interactions of the incident waves, the reflected waves from the reflecting wall, and the extra waves generated by the behavior of the flap. Pattern B also includes the cases in which the rotation angle θx gradually increases or decreases over time. In pattern C, the rotation of the flap becomes irregular over time, as depicted in Figure 7c, and in some cases, the rotation of the flap is halted for a while. In pattern D, as depicted in Figure 7d, the flap does not rotate after it has tilted into the water and remains stationary. In pattern E, the pendulum does not rotate from the beginning. As a result, the output voltages Von and Voff were 0 for the whole experimental time, as depicted in Figure 7e. Hereafter, patterns A and B are valid, and patterns C, D, and E are invalid, in terms of generating electricity.
The influences of the distance from the reflection wall and the wavelength ratio D/L, wave steepness Hi/L, initial water depth h, and wave energy power Pwave on the behavioral characteristics of the flap were investigated. Figure 8a,b depicts the tendency of the behavior of the flap depending on D/L and Hi/L, and D/L and Pwave, respectively. The results in Figure 8 include all experimental cases of different initial water depth. Hi/L was calculated from the generated wave height Hi and the wavelength L of the linear wave theory for respective experimental conditions. As depicted in Figure 8a, Hi/L for patterns D and E increased linearly when D/L increased, and the rapid increase of Hi/L was confirmed in the range of 0.4 < D/L < 0.5. In particular, pattern D was predominant at D/L ≈ 0.55. Additionally, as depicted in Figure 8b, in the designed WEC system, a Pwave > 11 W is required in the range of D/L < 0.4, and a Pwave of 16 W is required in the range of 0.4 < D/L < 0.45 for comfortably generating electricity. In the range of 0.58 < D/L, electricity can be produced at Pwave > 4 W. From Figure 8, it is suggested that the flap installation position should avoid the range of 0.45 < D/L < 0.58. On the other hand, pattern C was observed randomly near the boundaries of patterns A and B and patterns D and E and in the area of A and B. Hi/L and Pwave for pattern C are similar to or larger than those of patterns D and E; thus, the tendency of pattern C occurring is considered to be affected by other factors rather than Hi/L and Pwave, such as the initial water depth.
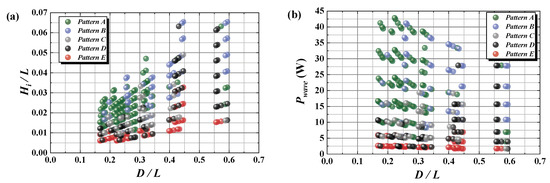
Figure 8.
Tendency for the respective patterns depending on (a) D/L and Hi/L, and (b) D/L and Pwave.
The effect of the initial water depth h on the behavior of the flap was examined. The initial water depth h was nondimensionalized by the height of the flap hf. Figure 9 depicts the patterns of the flap depending on h/hf and Pwave. The results in the range of 0.45 < D/L < 0.58, in which the invalid pattern was dominant, were excluded in Figure 9 because the effect of D/L on the flap behavior was dominant rather than h. From Figure 9a, which depicts patterns C, D, and E, the behavior of the flap tends to become an invalid pattern despite a relatively large Pwave in the water depth equal to and greater than the height of the flap (h/hf ≥ 1). In particular, the Pwave to become pattern E at h/hf ≥ 1 is larger than the Pwave at h/hf < 1. Similarly, it is confirmed in Figure 9b, which depicts patterns A and B, that more wave power is required to generate electricity normally at h/hf ≥ 1. Focusing on pattern C at h/hf < 1, even with a Pwave that is smaller than pattern E, pattern C can be observed at h/hf = 0.89 and 0.93 where the initial water depth is less than the height of the flap. For example, Pwave = 1.74 W for h = 0.93 (D/L = 0.5870 in Figure 8b) and Pwave = 4.67 W for h = 0.89 (D/L = 0.4328 in Figure 8b). Though pattern C is the invalid pattern as well, the flap is rotated irregularly for pattern C, differently from patterns D and E, which are halted without motion. Therefore, this implies that if the initial water depth is smaller than the height of the flap (h/hf < 1), the flap can easily rotate even with a relatively small Pwave.
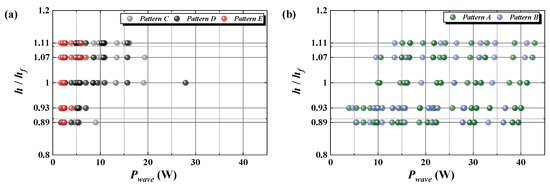
Figure 9.
Effects of h and Pwave on the behavior of the flap: (a) patterns C (unstable), D (loss), and E (Pwec = 0); (b) patterns A (stable) and B (fluctuation). The results in the range of 0.45 < D/L < 0.58 were excluded.
On the other hand, focusing on pattern C occurred for Pwave > 10 W, which coexisted with patterns A and B, as shown in Figure 8b and Figure 9b; the relevant results can be found at h/hf ≥ 1 in Figure 9a. This implies that the possibility of the behavior of a flap being unstable increases given the condition of h/hf ≥ 1 for relatively small Pwave. These tendencies suggest that it is more effective to install the flap in the condition of h/hf < 1 in terms of avoiding the invalid pattern.
The position of D/L = 0.5 is well known as the anti-node of the standing waves formed by the incident and reflected waves. Near this position, as pointed out by Sarkar et al., (2015), most of the water particles move up and down. Consequently, the external force available to rotate the flap is significantly small. Figure 10 illustrates a screenshot of a movie taken from the side of the wave flume for the case of D/L = 0.4463 in pattern E. From the figure, it can be confirmed that the anti-node of a standing wave is formed on the offshore side with respect to the flap. The formation of this anti-node of the standing wave near the flap can also be confirmed for the case of D/L = 0.56 and 0.43 in pattern D, as depicted in Figure 11 and Figure 12. The anti-node is formed on the left side (shore) for the neutral position of the flap, at D/L = 0.56 (see Figure 11), and on the right side (offshore) for the neutral position of the pendulum at D/L = 0.43 (see Figure 12). Moreover, in pattern D, the flap tends to be tilted to the left side (onshore) with the loss of the restoring force when the anti-node is on the right side (offshore) of the flap. When the anti-node is on the left side (onshore) of the flap, the flap is tilted to the right side (offshore) and halted. The position of the anti-node exhibits effects that are analogous to pattern D on patterns A and B as well. For example, the center of the rotation position of the flap is inclined leftward when the position of the anti-node is on the right side of the flap; the center of the rotation position is tilted rightward when the position of the anti-node is on the left side of the flap.
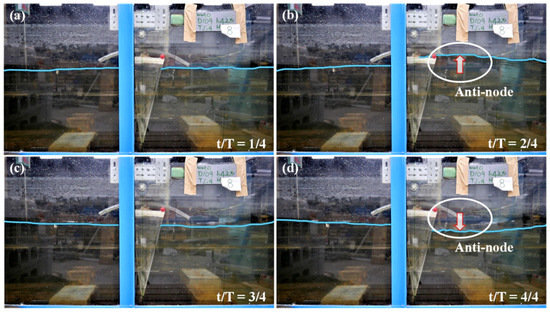
Figure 10.
Screenshots for pattern E for the case of D = 1.09 m, h = 0.425 m, T = 1.4 s, and Hi = 0.08 m at (a) t/T = 1/4, (b) t/T = 2/4, (c) t/T = 3/4, and (d) t/T = 4/4. D/L was 0.4463.
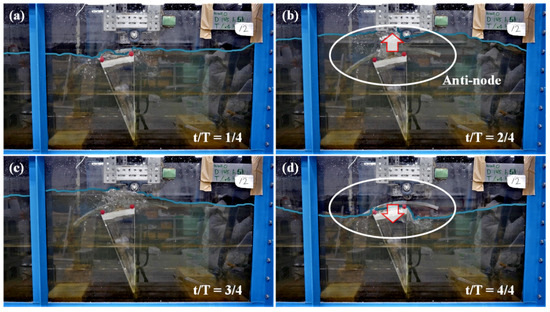
Figure 11.
Screenshots for pattern D for the case of D = 1.45 m, h = 0.51 m, T = 1.4 s, and Hi = 0.12 m at (a) t/T = 1/4, (b) t/T = 2/4, (c) t/T = 3/4, and (d) t/T = 4/4. D/L was 0.56. The blue solid line denotes the water surface.
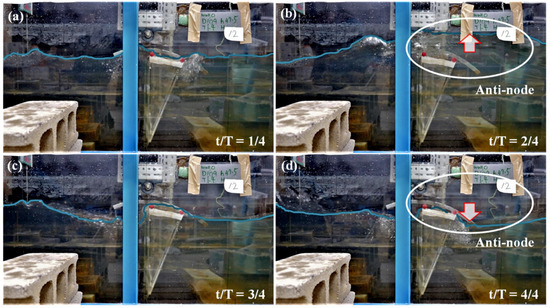
Figure 12.
Screenshots for pattern D for the case of D = 1.09 m, h = 0.475 m, T = 1.4 s, and Hi = 0.12 m at (a) t/T = 1/4, (b) t/T = 2/4, (c) t/T = 3/4, and (d) t/T = 4/4. D/L was 0.4306. The blue solid line denotes the water surface.
Figure 13 illustrates the relationship between D/L and the reflection coefficient kr from the flap. The results of patterns B and C were excluded because the reflection coefficients of patterns B and C have variability depending on the reference time. From the figure, it can be confirmed that kr increases as D/L approaches 0.5, whereas kr decreases rapidly when D/L > 0.5. The differences in kr at the same position (e.g., D/L ≈ 0.22 for pattern A or D/L ≈ 0.56 for pattern D) are the effect of Hi/L; there is a tendency that kr increases as Hi/L increases.
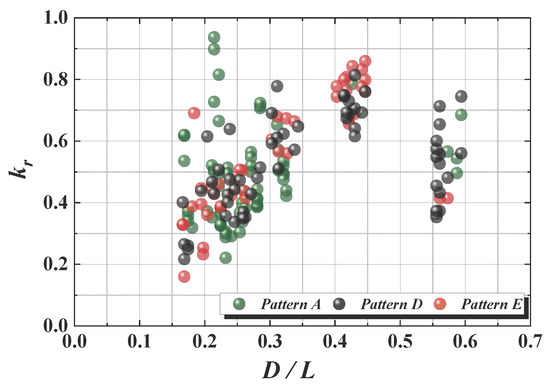
Figure 13.
Relationship between D/L and kr in patterns A, D, and E.
3.3. Power Generation Characteristics
The power generated in patterns B and C varies significantly depending on the reference time used during the generated power calculation. Hence, it is not easy to evaluate the generated power accurately. Therefore, the characteristics of the generated power are discussed for pattern A only.
Figure 14 and Figure 15 depict the relationships between power generation efficiency ke and D/L, and ke and Hi/L depending on T/Tf and h/hf, respectively. T/Tf denotes the ratio of the wave period T and the natural period of the flap Tf, and h/hf is the ratio of the initial water depth h and the flap height hf.
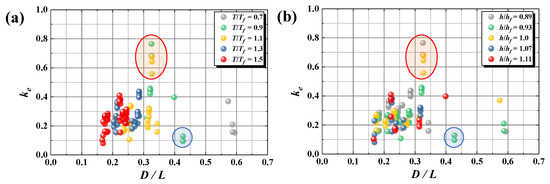
Figure 14.
Relationship between ke and D/L depending on (a) T/Tf, and (b) h/hf. Open red and blue circles denote the range of high and low ke, respectively, owing to the effects of D/L.
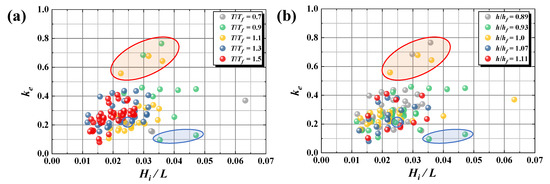
Figure 15.
Relationship between ke and Hi/L depending on (a) T/Tf, and (b) h/hf.
As depicted in Figure 14a, the maximum ke (=0.77) was obtained at D/L ≈ 0.32, which was the case for T/Tf = 0.9 and 1.1 close to the natural period of the flap. However, confirming the results for T/Tf = 0.9 and 1.1 at D/L ≈ 0.25 and 0.43, ke exhibited a low value (ke < 0.20) in comparison with other results. Therefore, it is considered that ke is affected more by the installation position than by the natural period of the flap. Focusing on the relationship between D/L and ke, it is theoretically well known that the maximum ke is obtained at the position of the node of the standing wave formed by the reflecting wall (D/L = 0.25), when the flap is extremely thin and the behavior of the flap does not affect the standing waves [39]. In contrast, the flap adopted in this experiment was the shape of an inverted triangular prism with a wide upper part, thereby overtopping or overflowing on the top of the flap occurs when incident waves propagate over the flap. This phenomenon leads to the loss of incident wave energy, and a slight phase delay is likely to occur in the rotation of the flap when the wave force acting on the flap is not enough to rotate owing to the energy loss; i.e., the flap rotates later than the propagation of the waves. Hence, a phase discrepancy can occur between the motion of the flap and the standing waves. Furthermore, not only the shape of the flap but also the damping of the PTO system contributes to the phase discrepancy. As a result, the position where the motion of the flap was maximized by synchronizing the direction of rotation of the flap and the motion direction of the water particles in the standing waves was considered to be D/L ≈ 0.32 in this study. The phase difference between the rotation of the flap and the standing wave is dependent on the ratio of the initial water depth and the flap height h/hf, as depicted in Figure 14b. For example, the maximum ke appears at the position of D/L ≈ 0.32, at the same (h/hf = 1.0) or lower water depths (h/hf = 0.89) as the flap height, and at the position of D/L ≈ 0.22 at a greater water depth (h/hf = 1.07, 1.11) than the flap height. Focusing on the relationship between ke and Hi/L depicted in Figure 15, it can be confirmed that ke increases with Hi/L. However, ke is small at Hi/L ≥ 0.04, as D/L is close to 0.5. The results indicate that ke is more dependent on the installation position of the flap than the wave steepness. Moreover, as depicted in Figure 8a, the tendency that the behavior of the flap becomes unstable as Hi/L becomes larger is considered to be an influential factor.
3.4. Reflection Characteristics
Figure 16 depicts the relationship between Hi/L and kr (in front of the flap) for patterns E and A. For pattern E, kr increases as h/hf decreases and Hi/L increases. It is analogous to the general reflection tendency of a vertical wall because the flap does not rotate at all in pattern E. Consequently, the flap becomes the vertical wall in front of the reflection wall. In pattern A, kr tends to increase as Hi/L increases similar to pattern E.
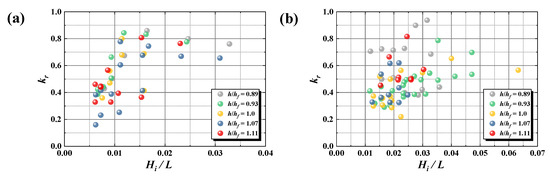
Figure 16.
Relationship between Hi/L and kr for (a) pattern E and (b) pattern A.
Figure 17 depicts the relationship between ke and kr for patterns A. In contrast, it is difficult to determine the correlation between ke and kr, as depicted in Figure 17. In general, a large rotation angle of the flap is accompanied by high ke so that less reflected waves are generated due to a large portion of the incident waves getting captured in the flap in terms of the conservation of wave energy. However, the case of high ke with low kr or vice versa is regarded as the flap tending to be tilted to one side, depending on the installation position (e.g., shore side for 0.25 < D/L < 0.5; offshore for 0.5 < D/L). The tilted flap to one side causes a different energy dissipation mechanism of the incident and reflected waves from the reflection wall for rotating the pendulum. As a result, kr is not proportional to ke, as depicted in Figure 17. The mechanism of energy dissipation depending on the motion of the flap and the relationship between ke and kr should be evaluated in further studies.
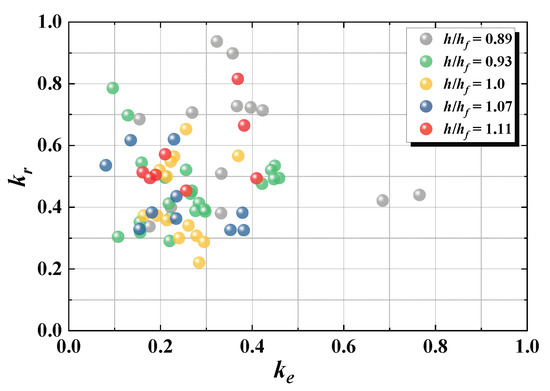
Figure 17.
Relationship between ke and kr for pattern A.
3.5. Effects of T/Tf and h/hf on PWEC
The proposed WEC system can generate power in the range ke = 0.2–0.4, regardless of Hi/L, excluding the case of ke > 0.5 (surrounded by a red circle in Figure 14) and the case of D/L ≈ 0.43 (surrounded by a blue circle in Figure 14) near the positions of the anti-node of the standing waves. This relationship can be clearly observed in Figure 18, which depicts the relationship between Pwave and PWEC. Figure 18 indicates that the larger the value of Pwave, the greater the value of PWEC produced. The linear approximation line (black dotted line in Figure 18), excluding the data surrounded by the red and blue circles, denotes a relationship of y = 0.2935x, which indicates that power can be produced at a ratio of approximately 0.3 to wave power in this system. Focusing on T/Tf in Figure 18a, no particular relationship is observed between T/Tf and PWEC, which is analogous to the results in Section 3.3, whereas the case for T/Tf = 0.9 except for the results surrounded by blue circles tending to exceed the approximation line. As illustrated in Figure 14a, the results are attributed to the location of the flap, for which T/Tf = 0.9 is mainly in the range of 0.31 < D/L < 0.43, where the maximum ke appears (D/L ≈ 0.32). On the other hand, focusing on the other cases positioned above the approximation line for T/Tf = 1.1, 1.3, and 1.5, most cases correspond to the cases at h/hf ≤ 1.0 in Figure 18b. The influence of h/hf on PWEC, as depicted in Figure 18b, is largely classified by whether the water depth is larger than the flap height (h/hf > 1.0) or not (h/hf ≤ 1.0). The correlation of PWEC according to h/hf increasing or decreasing was not observed, distinctly. Most cases larger than the approximation line in Figure 18b are observed at h/hf ≤ 1.0 in the whole range of Pwave. Focusing on the cases at h/hf > 1.0, PWEC is less than the approximation line in the range of Pwave < 20 W, while PWEC in the range of Pwave > 20 W exceeds the approximation line, occasionally. It implies that the effects of h/hf on PWEC become smaller under the relatively large Pwave conditions although the condition of h/hf > 1.0 tends to become the invalid pattern of the flap and decrease PWEC in a relatively small Pwave. However, most cases of h/hf > 1.0 in Figure 18b are confined by the cases of T/Tf = 1.3 and 1.5 in Figure 18a. This was because only pattern A was analyzed for ke and PWEC in this study. The results of pattern B, which is a valid pattern to generate electricity normally as well, are not included. To more clearly identify the capability of the power generation under the condition of h/hf > 1.0, the emergence ratio of each pattern depending on h/hf and T/Tf was investigated.
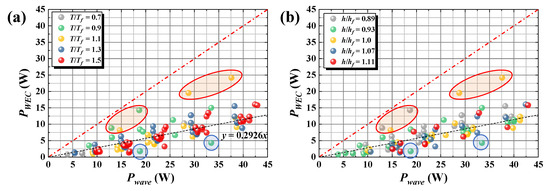
Figure 18.
Relationship between Pwave and PWEC depending on (a) T/Tf, and (b) h/hf. Open red and blue circles denote the ranges of high and low ke.
Table 4 presents the number of emergences of each pattern for h/hf and T/Tf. For instance, “4 (6.1)” in the row of pattern A for the T/Tf = 0.7 column indicates that the number of pattern As that emerged was four under the condition of T/Tf = 0.7 and the percentage of the occurred number (=4) of pattern A over the total number (=66) of experiments for T/Tf = 0.7 was 6.1%. On the other hand, “2 (50.0)” in the row of pattern A for the h/hf = 0.93 column denotes that two cases among the total number of pattern As emerging under the condition of T/Tf = 0.7 were observed for h/hf = 0.93, and the percentage is 50%.
Table 4.
The number of the emergence of each pattern for h/hf and T/Tf. The values in parentheses “()” of No. columns represent the percentages of the number of emerged cases for each h/hf over the total number of experiments for T/Tf in each pattern. The value in parentheses “()” of Total No. columns denotes a percentage of the number of occurrences of each pattern from the total number of experiments for each T/Tf.
In each T/Tf, the proportions of the valid pattern (patterns A and B) that accomplish power generation are 66.0% at T/Tf = 1.5 (0.17 < D/L < 0.24), 58.2% at T/Tf = 1.3 (0.19 < D/L < 0.29), 58.7% at T/Tf = 1.1 (0.24 < D/L < 0.34), 49.2% at T/Tf = 0.9 (0.30 < D/L < 0.43), and 33.4% at T/Tf = 0.7 (0.42 < D/L < 0.59). Excluding the case of T/Tf = 0.7 where the pendulum is located near D/L = 0.5, it can be confirmed that power can be generated in more than half of the cases, regardless of h/hf and Hi/L for the respective values of T/Tf. Additionally, because the ratio of the number of cases at h/hf ≥ 1.07, where the water depth was greater than that of the flap, to the number of cases for overall patterns A and B, was 29.5% at T/Tf = 1.5, 25.6% at T/Tf = 1.3, 32.4% at T/Tf = 1.1, and 27.3% at T/Tf = 0.9; it is obvious that T/Tf does not have a significant effect on power generation under the condition of h/hf ≥ 1.07. Therefore, when considering pattern B, which is not included in the analysis, it is noticed that power can be generated at all wave periods except T/Tf = 0.7, regardless of the flap installation depth. However, because it is difficult to specify the output power in pattern B as described above, further study is necessary under the condition that the long period component due to multiple reflections is not included. Although the effect of h/hf on patterns A and B is not significantly noticeable, the ratio of the number of cases at h/hf ≥ 1.0 for the respective values of T/Tf to the total number of cases of patterns C and D is extremely high, i.e., 76.9% at T/Tf = 1.5, 73.7% at T/Tf = 1.3, 70.0% at T/Tf = 1.1, and 73.9% at T/Tf = 0.7. As depicted in Figure 9a, the behavior of the flap tends to be unstable as the water depth increases. Therefore, as depicted in Figure 8b, when the flap is installed at h/hf ≥ 1.0 greater than the flap height, the condition of wave power in the installation area should be considered to avoid instability of the flap. In other words, it is better to avoid a submerged type of flap in the area of relatively low wave energy.
3.6. Behavior Characteristics of the Flap
The averaged power generation efficiency of the proposed WEC has a ke ≈ 0.3 for pattern A as shown in Figure 18 and the highest ke appeared at D/L ≈ 0.32. As discussed above, the position of D/L ≈ 0.32 is regarded as the position where the motion of the flap is maximized with a less phase discrepancy between the motion of the flap and the standing waves. In this section, the effects of the behavior characteristics of the flap on ke are examined.
Figure 19 illustrates screenshots of the behavior of the flap over t/T for the case of the highest ke at D/L ≈ 0.32. The flap rotates to the right (offshore) at t/T = 1/8 by the reflected waves from the reflection wall, and the flap is tilted to the rightmost side at t/T = 5/8. Then, the flap rotates to the left side (shore side) again by the incident wave from the right side and is tilted to the leftmost side at t/T = 9/8 (=1/8) after t/T = 8/8. It is confirmed that the flap rotates without any delay during one wave period. Other cases of D/L ≈ 0.32 also demonstrate a tendency to rotate smoothly without stay when rotating in the opposite direction after being most inclined.
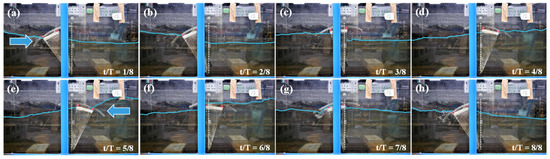
Figure 19.
Screenshots of the flap motions for the case of D = 1.09 m, h = 0.425 m, T = 1.8 s, and Hi = 0.12 m at (a) t/T = 1/8 to (h) 8/8. D/L is 0.3253 and ke = 0.76. The blue arrow denotes the wave direction acting on the flap, and the white dotted line indicates the rotational neutral axis of the flap. The blue solid line denotes the water surface.
Figure 20 and Figure 21 depict screenshots of the flap motion over t/T for the cases of D/L ≈ 0.25. In Figure 20, it can be confirmed that the rotation of the flap is small between t/T = 1/8, 2/8, and t/T = 7/8, 8/8. Similarly, a slight rotation was observed during t/T = 4/8–6/8 in Figure 21, with the flap appearing to be stationary for a moment. These phenomena to be halted for a while on either side (shore side in Figure 20 or offshore side in Figure 21) are known as the latching of WEC and the latching effect has an impact on ke. Pattern D in this study is a kind of latching effect, and it becomes a stationary state without any rotating owing to the dominant latching effect at a certain point in time. In the wave energy recovery system used in this study, it is considered that the cycle of the incident, and reflected waves contributing to the flap motion and the cycle of the rotation behavior of the flap including the damping of PTO system, are synchronized at the position of D/L ≈ 0.32. Hence, there is no temporal stationary phenomenon during rotation at D/L ≈ 0.32 and it results in the smooth rotation of the rotary generator in both directions. Therefore, ke increases at D/L ≈ 0.32. However, in other cases, it was regarded that was is a phase difference up to the force for operating the generator between the behavior of the flap and the waves near the flap so that the flap momentarily stopped. Consequently, the generator was stopped temporally during the latching phenomenon and it leads to decreased ke.
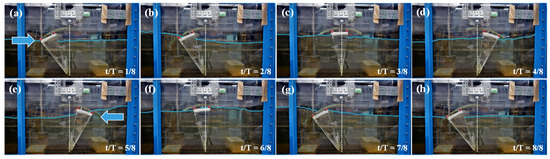
Figure 20.
Screenshots of the flap motions for the case of D = 1.45 m, h = 0.425 m, T = 2.6 s, and Hi = 0.12 m at (a) t/T = 1/8 to (h) 8/8. D/L is 0.2852 and ke = 0.44. The blue arrow denotes the wave direction acting on the flap, and the white dotted line indicates the rotational neutral axis of the flap. The blue solid line denotes the water surface.
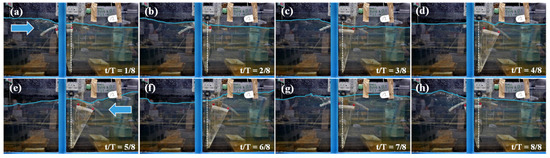
Figure 21.
Screenshots of the flap motions for the case of D = 1.09 m, h = 0.525 m, T = 2.2 s, and Hi = 0.12 m at (a) t/T = 1/8 to (h) 8/8. D/L is 0.2355 and ke = 0.18. The blue arrow denotes the wave direction acting on the flap, and the white dotted line indicates the rotational neutral axis of the flap. The blue solid line denotes the water surface.
Furthermore, the rotational center of the pendulum is inclined to the shore side in Figure 19 and Figure 20, and the offshore side in Figure 21. The leaning phenomenon of the flap depends on D/L and h/hf and affects the reflection coefficient kr at the front of the flap. kr is also influenced by the characteristics of the flap with the wide upper part inducing overflow and overtopping when waves pass above the flap, as depicted in Figure 19 (t/T = 7/8) and Figure 21 (t/T = 5/8). However, as these phenomena and the energy loss induced by the tilted pendulum occur irregularly for each condition, it is considered that there is no clear correlation between ke and kr in Figure 17.
4. Conclusions
In this study, a hydraulic model experiment was conducted to investigate the behavior and power generation characteristics of a bottom-hinged flap-type WEC with an inversed triangular prism shape and a rotary generator in the presence of a reflection wall, assuming breakwaters behind the WEC in unidirectional regular waves. The behavior of the flap depending on the water depth h, wave steepness Hi/L, and distance from the reflecting wall D can be classified into patterns A and B that can generate power stably, pattern C that is unstable but that can generate power, and patterns D and E that cannot generate power. The effect of the position from the reflection wall is dominant on the flap pattern, and the flap tends to be unstable as the ratio of the wavelength and the distance from the reflection wall to the flap, i.e., D/L, approaches 0.5, which is the anti-node position of the standing wave. Moreover, when the water depth is greater than the flap height, the flap tends to be unstable. Therefore, the installation location of the bottom-hinged WEC with a reflection wall should avoid the condition D/L ≈ 0.5, and if the wave power of the installation location is relatively small, it is suggested that the flap height should be greater than the water depth for stable power generation. As a result of the power generation characteristics in pattern A that can generate power stably, it was demonstrated that the wave power capturing ability of the wave power generation system used in the experiment is 30%, and the maximum power generation efficiency ke is 0.77 at D/L ≈ 0.32. Theoretically, it is well known that the maximum ke can be obtained at D/L = 0.25, which is the node of the standing wave formed by the reflection wall. However, the position of D/L at which the maximum ke appears can be changed by the effects of the flap shape on the flow fields around the flap and the resistance of the PTO system on the phase difference between the reciprocating behavior of the flap and the period of the standing wave. Based on the relationship between ke and the characteristics of the flap motion, the flap tends to be temporary latching on the offshore or shore side during the pitching motion, and the rotational center of the flap is tilted to one side depending on D/L and h. These phenomena contribute to the reduction of the wave power capturing ability such that it is considered that the maximum ke appears at D/L ≈ 0.32, where there is no latching effect and there is a lesser tendency of tilting of the rotational center of the flap. As the effects of the damping PTO system and the flap shape on the flap motion during rotation were not clarified in this study, further research is required to consider these types of effects on power generation performance.
Author Contributions
Conceptualization, Y.-H.C. and N.M.; Methodology, T.N.; Formal Analysis, Y.-H.C.; Investigation, K.-H.L.; Writing—original draft preparation, K.-H.L. and Y.-H.C.; Writing—review and editing K.-H.L. and Y.-H.C. All authors have read and agreed to the final manuscript.
Funding
The publication of this article was funded by the research support project of Catholic Kwandong University.
Conflicts of Interest
The authors declare no conflict of interest.
References
- IEA. World Energy Outlook 2019: Executive Summary 2019. Available online: https://webstore.iea.org/world-energy-outlook-2019 (accessed on 15 January 2020).
- EIA. International Energy Outlook; EIA: Washington, DC, USA, 2019. [Google Scholar]
- López, I.; Andreu, J.; Ceballos, S.; De Alegría, I.M.; Kortabarria, I. Review of wave energy technologies and the necessary power-equipment. Renew. Sustain. Energy Rev. 2013, 27, 413–434. [Google Scholar] [CrossRef]
- Mørk, G.; Barstow, S.; Kabuth, A.; Pontes, M. Assessing the global wave energy potential. In Proceedings of the 29th International Conference on Ocean, Offshore and Arctic Engineering, Shanghai, China, 6–11 June 2010; Volume 3, pp. 447–454. [Google Scholar]
- Takahashi, S.; Adachi, T. A study on wave power around Japan and its utilization. Coast. Eng. Proc. JSCE 1989, 3, 874–878. [Google Scholar] [CrossRef][Green Version]
- CIA. World Factbook. Available online: https://www.cia.gov/library/publications/the-world-factbook/geos/ja.html (accessed on 15 January 2020).
- Pelc, R.; Fujita, R.M. Renewable energy from the ocean. Mar. Policy 2002, 26, 471–479. [Google Scholar] [CrossRef]
- Drew, B.; Plummer, A.; Sahinkaya, M. A review of wave energy converter technology. Proc. Inst. Mech. Eng. A 2009, 223, 887–902. [Google Scholar] [CrossRef]
- Greaves, D.; Iglesias, G. Wave and Tidal Energy; John Wiley & Sons Ltd.: Hoboken, NJ, USA, 2018. [Google Scholar]
- Ibarra-Berastegi, G.; Sáenz, J.; Ulazia, A.; Serras, P.; Esnaola, G.; Garcia-Soto, C. Electricity production, capacity factor, and plant efficiency index at the Mutriku wave farm (2014–2016). Ocean Eng. 2018, 147, 20–29. [Google Scholar] [CrossRef]
- Boccotti, P. On a new wave energy absorber. Ocean. Eng. 2003, 30, 1191–1200. [Google Scholar] [CrossRef]
- Boccotti, P. Caisson breakwaters embodying an OWC with a small opening—Part I: Theory. Ocean. Eng. 2007, 34, 806–819. [Google Scholar] [CrossRef]
- Boccotti, P.; Filianoti, P.; Fiamma, V.; Arena, F. Caisson breakwaters embodying an OWC with a small opening—Part II: A small-scale field experiment. Ocean. Eng. 2007, 34, 820–841. [Google Scholar] [CrossRef]
- Folley, M.; Curran, R.; Whittaker, T. Comparison of LIMPET contra-rotating wells turbine with theoretical and model test predictions. Ocean. Eng. 2006, 33, 1056–1069. [Google Scholar] [CrossRef]
- Bruschi, D.; Fernandes, J.C.S.; Falcão, A.; Bergmann, C.P. Analysis of the degradation in the Wells turbine blades of the Pico oscillating-water-column wave energy plant. Renew. Sustain. Energy Rev. 2019, 115, 109368. [Google Scholar] [CrossRef]
- Falcão, A. The shoreline OWC wave power plant at the Azores. In Proceedings of the 4th European Wave Energy Conference, Aalborg, Denmark, 4–6 December 2000; Danish Technological Institute: Taastrup, Denmark, 2000; pp. 44–48. [Google Scholar]
- Falcão, A.; Sarmento, A.J.; Gato, L.; Brito-Melo, A. The Pico OWC wave power plant: Its lifetime from conception to closure 1986–2018. Appl. Ocean. Res. 2020, 98, 102104. [Google Scholar] [CrossRef]
- Whittaker, T.; Collier, D.; Folley, M.; Osterried, M.; Henry, A.; Crowley, M. The development of Oyster—A shallow water surging wave energy converter. In Proceedings of the 7th European Wave and Tidal Energy Conference, Porto, Portugal, 11–13 September 2007; pp. 11–14. [Google Scholar]
- Mäki, T.; Mucha, T.; Vuorinen, M. WaveRoller—One of the leading technologies for wave energy conversion. In Proceedings of the 5th International Conference on Ocean Energy, Halifax, NS, Canada, 4–6 November 2014; ICOE: El Centro, CA, USA, 2014. [Google Scholar]
- Marquis, L.; Kramer, M.; Kringelum, J.; Chozas, J.; Helstrup, N. Introduction of Wavestar Wave Energy Converters at the Danish offshore wind power plant Horns Rev 2. In Proceedings of the 4th International Conference on Ocean Energy, Dublin, Ireland, 17–19 October 2012; ICOE: El Centro, CA, USA, 2012. [Google Scholar]
- Weber, J.; Mouwen, F.; Parish, A.; Robertson, D. Wavebob—Research & development network and tolls in the context of systems engineering. In Proceedings of the 8th European Wave and Tidal Energy Conference, Uppsala, Sweden, 7–10 September 2009; pp. 416–420. [Google Scholar]
- Chozas, J.; Soerensen, H. State of the art of wave energy in Spain. In Proceedings of the 2009 IEEE Electrical Power & Energy Conference (EPEC), Montreal, QC, Canada, 22–23 October 2009; pp. 1–6. [Google Scholar]
- Retzler, C. Measurements of the slow drift dynamics of a model Pelamis wave energy converter. Renew. Energy 2006, 31, 257–269. [Google Scholar] [CrossRef]
- Kofoed, J. Wave Overtopping of Marine Structures: Utilization of Wave Energy. Ph.D. Thesis, Aalborg University, Aalborg, Denmark, 2002. [Google Scholar]
- Vicinanza, D.; Margheritini, L.; Kofoed, J.P.; Buccino, M. The SSG wave energy converter: Performance, status and recent developments. Energies 2012, 5, 193–226. [Google Scholar] [CrossRef]
- Babarit, A.; Hals, J.; Muliawan, M.; Kurniawan, A.; Moan, T.; Krokstad, J. Numerical benchmarking study of a selection of wave energy converters. Renew. Energy 2012, 41, 44–63. [Google Scholar] [CrossRef]
- Falcão, A. Wave energy utilization: A review of the technologies. Renew. Sustain. Energy Rev. 2010, 14, 899–918. [Google Scholar] [CrossRef]
- Washio, Y.; Osawa, Y.; Nagata, F.; Fujii, F.; Furuyama, H.; Fujita, T. The offshore floating type wave power device ‘Mighty Whale’: Open sea tests. In Proceedings of the 10th International Offshore and Polar Engineering Conference (ISOPE), Seattle, WA, USA, 28 May–2 June 2000. [Google Scholar]
- Watabe, T.; Yokouchi, H.; Kondo, H.; Inoya, M.; Kudo, M. Installation of the new Pendulor for the 2nd stage sea test. In Proceedings of the 9th International Offshore and Polar Engineering Conference (ISOPE), Brest, France, 30 May–4 June 1999. [Google Scholar]
- Kanki, H.; Arii, S.; Furusawa, T.; Otoyo, T. Development of advanced wave power generation system by applying gyroscopic moment. In Proceedings of the 8th European Wave and Tidal energy Conference (EWTEC), Uppsala, Sweden, 7–10 September 2009. [Google Scholar]
- Vicinanza, D.; Di Lauro, E.; Contestabile, P.; Gisonni, C.; Lara, J.L.; Losada, I.J. Review of Innovative Harbor Breakwaters for Wave-Energy Conversion. J. Waterw. Port Coast. Ocean Eng. 2019, 145, 03119001. [Google Scholar] [CrossRef]
- Takahashi, S.; Nakada, H.; Ohneda, H.; Shikamori, M. Wave power conversion by a prototype wave power extracting caisson in Sakata port. In Proceedings of the 23rd International Conference on Coastal Engineering, Venice, Italy, 4–9 October 1992; pp. 3440–3453. [Google Scholar]
- Raju, V.S.; Neelamani, S. Concrete caisson for a 150KW wave energy pilot plant: Design, construction, and installation aspects. In Proceedings of the 2nd International Offshore and Polar Engineering Conference, San Francisco, CA, USA, 14–19 June 1992; pp. 584–591. [Google Scholar]
- Schoolderman, J.; Reedijk, B.; Vrijling, H.; Molenaar, W.; Oever, E.T.; Zijlema, M. Generating electricity at a breakwater in a moderate wave climate. Coast. Eng. Proc. 2011, 1, 63. [Google Scholar] [CrossRef]
- Kim, J.S.; Nam, B.W.; Kim, K.H.; Park, S.; Shin, S.H.; Hong, K. A numerical study on hydrodynamic performance of an inclined OWC wave energy converter with nonlinear turbine–chamber interaction based on 3D potential flow. J. Mar. Sci. Eng. 2020, 8, 176. [Google Scholar] [CrossRef]
- Vicinanza, D.; Contestabile, P.; Nørgaard, J.Q.H.; Andersen, T.L. Innovative rubble mound breakwaters for overtopping wave energy conversion. Coast. Eng. 2014, 88, 154–170. [Google Scholar] [CrossRef]
- Kralli, V.E.; Theodossiou, N.; Karambas, T. Optimal design of overtopping breakwater for energy conversion (OBREC) systems using the harmony search algorithm. Front. Energy Res. 2019, 7, 80. [Google Scholar] [CrossRef]
- Iuppa, C.; Cavallaro, L.; Musumeci, R.E.; Vicinanza, D.; Foti, E. Empirical overtopping volume statistics at an OBREC. Coast. Eng. 2019, 152, 103524. [Google Scholar] [CrossRef]
- Sarkar, D.; Renzi, E.; Dias, F. Effect of a straight coast on the hydrodynamics and performance of the Oscillating Wave Surge Converter. Ocean Eng. 2015, 105, 25–32. [Google Scholar] [CrossRef]
- Sarkar, D.; Dias, F. Performance enhancement of the oscillating wave surge converter by a breakwater. J. Ocean Wind Energy 2015, 2, 73–80. [Google Scholar] [CrossRef]
- Liu, Y.; Cavalier, G.; Pastor, J.; Viera, R.J.; Guillory, C.; Judice, K.; Guiberteau, K.; Kozman, T.A. Design and construction of a wave generation system to model ocean conditions in the Gulf of Mexico. Int. J. Energy Technol. 2012, 4, 1–7. [Google Scholar]
- Liu, Y.; Pastor, J.; Viera, R.J. Establishment of a wave energy and technology lab to promote the experimental study of ocean and wave energy, IMECE2013-62968. In Proceedings of the ASME 2013 International Mechanical Engineering Congress & Exposition, San Diego, CA, USA, 15–21 November 2013; pp. 13–21. [Google Scholar]
- Morimoto, Y.; Mizutani, N. Development of wave energy conversion system using bottom-hinged pendulum and evaluation of its performance. J. Jpn. Soc. Civ. Eng. Ser. B3 Ocean. Eng. 2013, 69, 132–137. [Google Scholar] [CrossRef]
- Lin, C.Y.; Huang, C.J. Decomposition of incident and reflected higher harmonic waves using four wave gauges. Coast. Eng. 2004, 51, 395–406. [Google Scholar] [CrossRef]
- Mansard, E.; Funke, E. The measurement of incident and reflected spectra using a least squares method. Coast. Eng. Proc. 1980, 1, 154–172. [Google Scholar]
© 2020 by the authors. Licensee MDPI, Basel, Switzerland. This article is an open access article distributed under the terms and conditions of the Creative Commons Attribution (CC BY) license (http://creativecommons.org/licenses/by/4.0/).