Abstract
Vehicle-to-everything (V2X) communication has been widely studied in recent years for the rapid development of the vehicular traffic. In this paper, a V2X communication system integrating the probabilistic shaping (PS) bitloading multi-input-multi-output (MIMO) visible light communication (VLC) and the millimeter wave radar is proposed. The PS bitloading algorithm utilizes the full spectrum resource of the LED headlights, and the MIMO configuration enhances the performance of the VLC system. Furthermore, the linear and nonlinear interpolation method makes it possible to calculate the SNR at every point from the SNR measured at several discrete calibration points. The SNR table enables the radar to guide the VLC according to the distance, achieving the highest achievable information rate (AIR) at every point. The system supports the V2X communication beyond 1.1 Gb/s up to 5 m. This is the first VLC based V2X sensing and communication system, and the AIR in the system is 1.8484 Gb/s. As far as we know, it is the highest data rate reported in the LED headlight based VLC system.
1. Introduction
As the mobility and vehicular transportation has developed rapidly, the vehicle-to-everything (V2X) communication has been widely developed. The V2X communication covers majorly four fields including infotainment, traffic efficiency, traffic safety, and cooperative driving [1], which requires high data rate, low latency, high reliability, and a large amount of connection devices [2]. Currently, the V2X access technologies are mainly concentrated on the radio frequency technologies including the cellular network [3] and Wi-Fi [4].
The application of V2X enables the information exchange between vehicles, the environment equipment, and pedestrians [5]. Hence, vehicles can receive the real-time information on the traffic status such as speed limitation, traffic flows, personnel flow on the road, etc. Furthermore, V2X may provide better quality of modern traffic services. Many issues including specific safety warnings, temporary route guidance and navigation, smart transportation management, and remote diagnostics of vehicles will be covered [6].
Currently, the most common safety sensors in vehicles are camera and radars [7]. Typically, for the transmission of real-time high-resolution raw images at 15 frames per second, a throughput higher than 700 Mbit/s is required, as suggested for the traffic safety services [8]. In addition, the radar data detecting the target and velocity costs up to 100 Mbit/s [8]. Therefore, up to 800 Mbit/s of data rate is required for the real-time vehicle safety based on camera and radar. The wireless communication technology that supports such data rate enables the safety information exchange between vehicles and the other things.
Though 5G is to be one of the solutions of V2X [9], which is expected to support the data rate of 20 Gbit/s, the operating millimeter wavelength brings a significant signal attenuation in certain scenarios [10], hence the expected data rate can be hardly achieved in practice. As a newly developed wireless communication technology, the visible light communication (VLC) based V2X communication technology, utilizing the original LED car headlights, meets the basic requirements of the V2X communication with the additional advantages of large capacity and high security [11]. The highest data rate of the VLC based V2X communication system reported by now is 1.25 Gb/s [12].
However, the current VLC based V2X systems are all under the open loop control. There is no feedback in the communication process. In the practical scene of V2X communications, the distance between the transmitter and the receiver might change constantly. The light intensity changes with the distance, causing the variety of the communication quality. Therefore, the data rate should be flexible under the channel conditions to achieve the data rate at every point as high as possible.
This paper proposed the V2X communication method based on the integration of probabilistic shaping (PS) bitloading multi-input-multi-output (MIMO) VLC and radar, which is the first sensing and communication system based on VLC. The system supports the data rate beyond 1.1 Gb/s with the distance up to 5 m, and the highest data rate of 1.8484 Gb/s, which is the highest data rate in VLC base V2X communication systems as far as we know.
2. Principles
The V2X communication system based on MIMO VLC and radar includes two phases: training and testing as shown in Figure 1. In the training phase, the radar determines the calibration points where the VLC system estimates the SNR. The discrete SNR points are then interpolated to form a continuous SNR table. Due to the propagation of light, the interpolation should divide into linear and nonlinear parts based on a certain boundary of distance . With the distance less then , the SNR provided by the light intensity is high enough to support the high data rate communication, which is the linear area. With the distance more than , the SNR is not enough to support the highest data rate. The SNR is limited by the light intensity, which is nonlinear. Then, the interpolated SNR table can thus guide the test phase, in which the PS bitloading VLC system takes the SNR from the SNR table directly according to the distance acquired by the radar. With radar and PS bitloading VLC integration, a dynamic high data rate V2X communication can be achieved. In this section, the details of the principles are described.
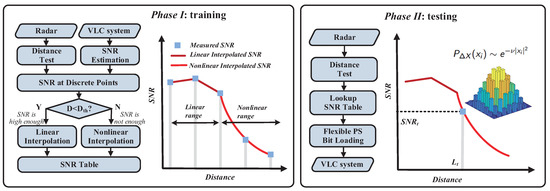
Figure 1.
The process of the VLC-Radar fusion V2X communication.
In the training phase, the radar and the VLC work simultaneously to generate the signal-to-noise ratio (SNR) table. A quadrature phase shift keying (QPSK) signal is modulated with discrete multitone (DMT) modulation to estimate the SNR for each subcarrier [13]. The SNR is estimated by calculation the error vector magnitude (EVM) of the receiving signal as
Ref. [14], and the is derived by
Ref. [14], where T denotes the total number of the received symbols, N denotes the number of unique symbols, denote the in-phase (I) and quadrature (Q) components of the t-th symbol and denote I and Q components of the standard constellation of the t-th symbol [14]. The SNR is estimated at several discrete calibration points guided by the radar, covering the supporting communication distance range.
To get a continuous SNR table which is available for every point within the range, an interpolation algorithm combining linear and nonlinear methods is proposed according to the light field distribution.The light field intensity of an LED is described with the illuminance, which is where denotes the center intensity of the light, denotes the angle, and denotes the Lamberitian order with denotes the half power angle of the LED. Thus, the illuminance at the point is
where L denotes the distance between the point and the transmitting LED, and denotes the incident angle. The equation shows that the illuminance of a Lambertian LED is inversely proportional to the second square of the distance. Though the LED headlights include the lenses that concentrate the light, the illuminance of the headlights follows the similar trend as described for the fixed and . Furthermore, the SNR of VLC signals is proportional to the light intensity within the linear working range. Hence, the SNR is inversely proportional to the second square of the distance between the transmitting LED and the receiver.
The light intensity satisfies the SNR requirement of the VLC in the near field, which means the quality of the communication is directly related to the conditions of the LED and the light path. Therefore, the SNR is linear correlated with the distance, and the SNR table can be derived with linear interpolation. However, in the far field, the SNR is not enough to maintain the VLC with the highest data rate, resulting in a nonlinear decrease achievable information rate (AIR) with the distance increases. Therefore, the SNR and the AIR should be nonlinear correlated with the distance, and the SNR table should be interpolated with a nonlinear function. With such a distance slicing interpolation method, the SNR table is ready for all the points within the supporting distance range.
In the testing phase, a PS bitloading DMT signal is generated with the SNR from the SNR table according to the distance information from the radar to achieve the flexible data rate. At the transmitting side, the entropy of the transmitting signal is calculated with the Shannon Limit as
Then, a Maxwell–Boltzmann distribution approaching the source entropy is determined for the generation of the PS signal. The form of the distribution is
Ref. [15], in which denotes the constellation coordinate of the i-th symbol in the complex plane, and v is adjusted to match the entropy. The original data stream is processed with constant composition distribution matching (CCDM) [16], forward-error correction (FEC) coding [17], and loaded to each subcarrier by quadrature amplitude modulation (QAM) mapping according to the matched distribution. Finally, the signal is DMT modulated to be transmitted in the VLC system.
At the receiving side, the generalized mutual information (GMI) and the normalized generalized mutual information (NGMI) are calculated to evaluate the performance of the communication. GMI is calculated as
where denotes the i-th bit of the k-th symbol [18]. In addition, the NGMI is calculated as
where is the constellation entropy, and m is the most bits that each symbol carries. When the calculated NGMI exceeds the rate of an ideal binary FEC code, an error-free communication is guaranteed [18]. Therefore, when the NGMI condition is satisfied, the AIR that deducts the expenses of FEC code can be calculated as
where is the overall bandwidth.
3. Results
3.1. The Experimental Setup
Figure 2 shows the experimental setup of the PS bitloading VLC radar fusion system. In the training phase, the SNR table has not been obtained at first. The 4-QAM training signal is DMT modulated and then sent to the AWG. The two identical analog signals that output from the AWG are equalized by the hardware equalizers (EQU), amplified by the electric amplifiers (EA) and coupled with the DC voltage by the bias tees. Two LED headlights are driven by the biased signal and emit the light. The power of the LED headlights is approximately 2.5 W each. A millimeter wave radar working on the band of 76 to 81 GHz is set at the same position with the headlights to measure the distance between the transmitter and the receiver. The receiver, which is located on the same track with the transmitter, consists of the lenses and an optical filter filtering the yellow fluorescent light. The remaining blue light is converted to the electrical signal by a photo diode (PD) array. The two headlights and the PD array form the MIMO VLC system. The PD array outputs two separate signals, which are amplified by EAs and attenuated by two adjustable attenuators (ATT). An oscilloscope (OSC) is used as the analog-to-digital converter acquiring the received signal. The maximum distance supported by the track is 5 m. The list of the experimental equipment is shown in Table 1. Therefore, the calibration points at 1 m, 2 m, 3 m, 4 m, and 5 m are selected evenly within the distance range as the distance between two adjacent points is 1 m. The received signal is processed to estimate the SNR of all the 250 subcarriers at the calibration points referencing the distance measured by the radar. The SNR at these points is recorded and then interpolated to generated the SNR table.
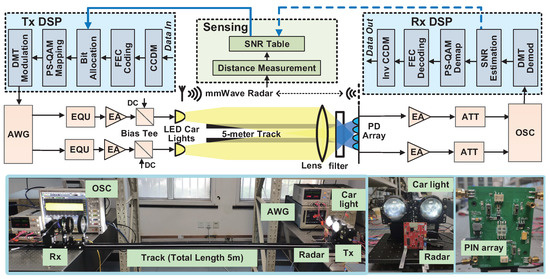
Figure 2.
The experimental setup.

Table 1.
The experimental equipment.
In the testing phase, the distance between the transmitter and the receiver is firstly measured by the radar. An estimated SNR can be looked up from the SNR table according to the distance. Then, the data sequence to be transmitted is processed by the 256-QAM PS bitloading modulation process with the estimated SNR. The is 0.82, and the error-free threshold of NGMI is 0.92. At the receiver side, the received signal is demodulated to verify the AIR. The modulation parameters are listed in Table 2.
Table 2.
The modulation parameters.
3.2. Experimental Results
Figure 3 shows the S21 transfer response with only one headlight being lighted, which is measured by a network analyzer when the distance between the transmitter and the receiver is 1 m. The S21 transfer response indicates the insertion loss when the signal transfer from the port 1, which is the transmitter here, to the port 2, which is the receiver. In other words, the S21 transfer response is the frequency response of the whole system, which shows the attenuation of each frequency component. It is obvious that the frequency response of the LED headlights is particularly uneven. There are lots of peaks and valleys in the response along the frequency. The frequency response affects the SNR of each subcarrier. PS bitloading is an algorithm which can approach the Shannon limit, which means it can reach the ceil of the spectrum efficiency limited by the SNR. Therefore, PS bitloading is very worthy of application in the headlight based VLC, which may achieve the best data rate individually in all the subcarriers. The figure also shows the difference of the frequency response between the two headlights. In addition, the equalized bandwidths of the LED headlights are not the same. In this experiment, the overall bandwidth is selected by averaging the −10 dB bandwidth of two headlights at 350 MHz. Figure 4 shows the spectrum of transmitted signal and the received signal. The difference of the frequency response between the two headlights shows in the spectrum as well.
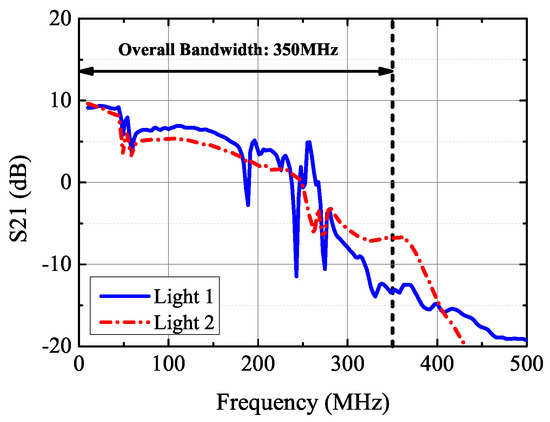
Figure 3.
The measured S21 transfer response from each light to the receiver at 1 m.
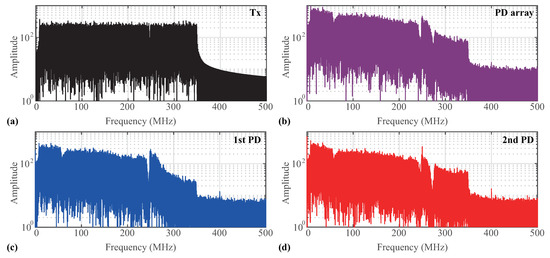
Figure 4.
The spectrum of (a) the transmitted signal, (b) the received signal after MRC algorithm, (c) the received signal with only light 1 on, and (d) the received signal with only light 2 on.
The maximal ratio combining (MRC) technology is diversity receiving technology whose purpose is to improve the received signal at the receiver side. When signals that pass through different paths are collected by multiple receivers, MRC can be used to weight and summarize the signals on each receiving path, and the paths with good signals are assigned the highest weight to achieve signal improvement at the receiving end. With the PD array and the MRC technology, the subcarriers that work well with only one headlight are kept and the other ones that work well with both headlights are enhanced.
To illustrate the gain from one single PD to the PD array, Figure 5 compares the AIR performance when the distance is 1 m under different peak-to-peak voltage (Vpp) and LED bias current. With only one PD, the maximum AIR at 1 m is about 1.7 Gb/s. At the same point, with a PD array and the MRC technology, the maximum AIR increases 0.12 Gb/s to 1.82 Gb/s due to the noise reduction, which is a 7% gain. Figure 5 also illustrates how the AIR changes with the different working points of the LEDs. The overall performance of the VLC system depends on the characteristic of the electronic elements, such as the hardware equalizer, the Vpp of the modulated signal, and the bias current of the LED. According to the actual setup of the system, the optimal selection of the electrical parameters is obtained through the experiment [11,19]. In this system, when the Vpp of the modulated signal is lower then 0.7 V or the LED bias current is lower than 170 mA, the AIR increases almost linearly. This indicates the linear working range of the LED. The SNR determines the performance of VLC, and the SNR increases with the light emitting power. When the voltage or current exceeds the point, the power response of the LEDs will not be linear to the power input anymore. Such nonlinear distortion causes a huge loss in the performance of the VLC system. As shown in the subfigures in Figure 5a,b, the width of the PS becomes narrower at the nonlinear points. In the following experiments, the operating point is selected as Vpp at 0.7 V and bias current at 170 mA.
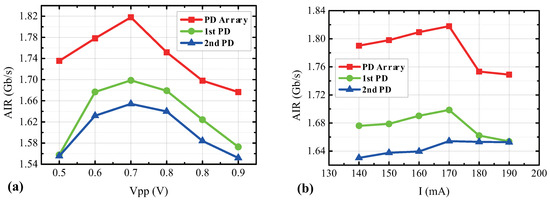
Figure 5.
Comparison of the AIR with the PD array and single PD at 1 m under (a) different Vpp with 170 mA bias current, and (b) LED bias current with 0.7 Vpp.
The next step is estimating the SNR at each calibration point to generate the entire SNR table. The measured SNR at the discrete calibration points is shown in Figure 6a. The y-axis is the distance that includes five discrete points. The z-axis shows the SNR in dB, which can be calculated as . The VLC signal is coupled to a DC voltage by the bias tee which blocks the DC component in the VLC signal, hence the VLC signal coupling is not a simple low-pass system but a band-pass system. Furthermore, VLC is a direct modulation direct detection (DMDD) system. The characteristic of PD brings signal-to-signal beating interference (SSBI) noise, which is distributed in the low frequency spectrum with the shape of an inverted triangle. Therefore, there exists higher noise in the low frequency of VLC than the high frequency, which causes the decrease of SNR. The SNR in the subcarriers indexing from 40 to 160 is large, indicating a good frequency response of the VLC system. The corresponding frequency range is approximately 50 MHz to 220 MHz. The rest subcarriers with the frequency above 250 MHz are limited by the bandwidth of the LED. Figure 6a shows a significant drop of the SNR from 3 m to 4 m due to the low SNR in the high frequency subcarriers.
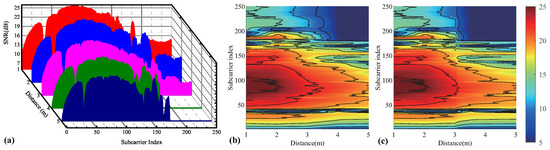
Figure 6.
The measured SNR (a) at the calibration points and the SNR table interpolated with a (b) linear method and a (c) partially nonlinear method.
Interpolating the SNR at the calibration points, the SNR table is finished. However, the SNR does not decrease linearly as the distance increases. In the near field, the light intensity is high enough to support the communication, thus the SNR changes linearly with the distance changes. However, in the far field, the light intensity is not enough to support the communication in the highest data rate. As the intensity decreases nonlinearly, the SNR decreases nonlinearly as well. The great decrease of SNR between 3 m to 4 m indicates that the light intensity is not enough for the communication beyond the distance of 3 m. Therefore, the interpolation method should alter from the linear one to the nonlinear one beyond 3 m. Figure 6b shows the interpolated SNR table with all linear methods, while Figure 6c shows the one with nonlinear interpolation between 3 m to 5 m. The performance of these two SNR tables is evaluated in the testing phase.
In the testing phase, the SNR tables are then tested at both the calibration points and the other points. Figure 7a–e shows the receiving GMI and the source entropy at the calibration points. The unevenness in the frequency response of the LED headlights is reflected on both the GMI and the source entropy. The noise level of LEDs in the low frequency part is higher than the higher frequency part. Therefore, the GMI is very low at the first subcarrier, and increases in the following subcarriers. The highest GMI appears at the 50th to the 130th subcarrier, which approximately indicates the spectrum from 70 MHz to 180 MHz corresponding to the flat response part in Figure 3. When the distance goes larger than 3 m, the higher frequency part of the response decreases dramatically, causing the decrease in the bandwidth from 350 MHz to 250 MHz. Figure 7f shows the actual received PS bitloading constellation. Each constellation includes the data in all the subcarriers.
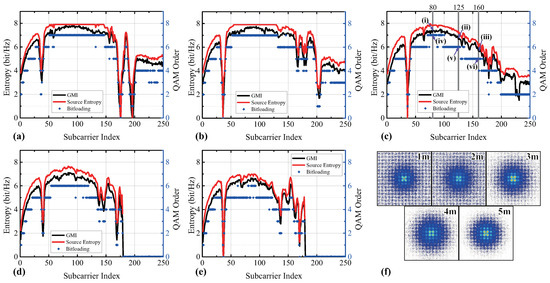
Figure 7.
GMI, source entropy (SE) and the achievable bitloading order of the 250 subcarriers at the calibration point (a) 1 m, (b) 2 m, (c) 3 m, (d) 4 m, (e) 5 m; and (f) the overall received PS bitloading constellation at a distance from 1 m to 5 m.
The blue dots in Figure 7a–e show the modulation order that the classical bitloading algorithm can achieve under the same SNR conditions with a 7% FEC limit. Though classical bitloading can fill the uneven frequency response with different orders of modulation, the information entropy of uniform distributed constellations is restricted to the integers according to the modulation order which must be integers. Therefore, the entropy in each subcarrier is much lower than the one with PS bitloading. With the help of the probabilistic distribution, PS bitloading has much higher spectrum efficiency than the classical one.
Figure 8 shows the PS distribution and the constellation of classical bitloading in the 80th, the 125th, and the 160th subcarrier at a distance of 3 m, as noted in Figure 7c. The center frequency of the 80th subcarrier is 112 MHz, and the SNR is 22.3 dB, which supports the QAM order up to 7. All the constellation points of the classical bitloading signal, as shown in Figure 8iv, are of equal probability. With PS, such SNR can support a GMI up to 7.33 bit/Hz for its unequal probability in the constellation points. The probabilistic distribution in the 80th subcarrier is illustrated in Figure 8i. Similarly, the SNR in the 125th subcarrier, of which the frequency is 175 MHz, is 20.0 dB. The QAM order supported in this subcarrier is up to 6, while the supported GMI is up to 6.66 bit/Hz as shown in Figure 8ii,v. In addition, Figure 8iii,vi shows the PS distribution and the QAM constellation of the 160th subcarrier located in the frequency of 224 MHz. The supported QAM order in this subcarrier is up to 5 due to the SNR of 16.7 dB, and the GMI is up to 5.68 bit/Hz. The comparison of the average information entropy in each subcarrier between the PS bitloading and the classical bitloading is shown in Table 3.
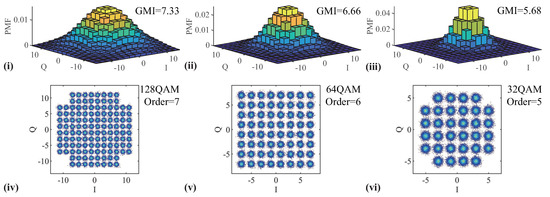
Figure 8.
The distribution of PS constellations in the highlight subcarriers in Figure 7c with different GMI: (i) 7.13 bit/Hz, (ii) 6.66 bit/Hz, (iii) 5.68 bit/Hz, and the bitloading modulation in the same subcarriers with different QAM order (iv) 7 bit/Hz, (v) 6 bit/Hz, (vi) 5 bit/Hz.
Table 3.
The information entropy in each subcarrier of PS bitloading and classical bitloading.
The spectrum efficiency of classical bitloading is discrete in each subcarrier, which causes a gap between the spectrum efficiency of the modulation and the Shannon limit. In comparison, the PS bitloading fulfills the modulation with continuous spectrum efficiency. The GMI of PS bitloading signals approaches the Shannon limit as much as possible. Therefore, the average spectrum efficiency of PS bitloading is higher than the classical bitloading. Table 3 shows that the average GMI of PS bitloading can be 0.917 bit/Hz higher than the classical bitloading in the experiment.
The testing results at all the points are shown in Figure 9, where all the points are tested with the NGMI strictly greater than 0.92. The highest AIR in this system is 1.8484 Gb/s at the distance of 2 m, which is the highest rate in LED headlight based VLC system as far as we know. The quality of the imaging of the two headlights at the receiving plane determines the SNR. Due to the close distance, the space between the two lights is slightly bigger than the space between the PDs at the point of 1 m. Therefore, the highest AIR appears at the point of 2 m. Table 4 shows the AIR at each calibration points.
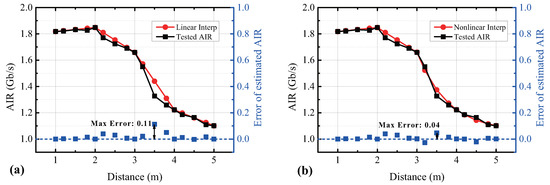
Figure 9.
The AIR at each point. (a) The AIR is interpolated with a linear function. (b) The AIR is interpolated with a linear function between 1 m and 3 m, and a nonlinear function between 3 m and 5 m.
Table 4.
The AIR at each calibration point.
Figure 9 also shows the error between the tested AIR and the estimated AIR interpolated from the measured points. Within the range of 1 m to 3 m, the AIR increases and decreases linearly. However, the AIR decreases rapidly when the distance is larger than 3 m. The linear interpolation brings a relative huge error at the point of 3.5 m. With nonlinear interpolation, the maximum error of AIR decreases from 0.11 Gb/s to 0.04 Gb/s, which is a decrease of 63.6%.
4. Discussion
Based on the results, the VLC fused with radar performs a flexible data rate V2X communication, reaching the AIR of 1.8484 Gb/s at the point of 2 m distance. This is the highest data rate of a LED headlight based VLC system as far as we know. At the distance of 5 m, an AIR beyond 1.1 Gb/s is also achieved. With the PS bitloading algorithm, the severe uneven frequency response of the LED headlights can be fully used. Comparing with the classical bitloading algorithm, the PS bitloading changes the discrete modulation order in each subcarrier to the continuous source entropy. Thus, the utilization of the spectrum resources is more efficient.
In addition, the MIMO system consists of two headlights and the PD array provides the power diversity gain at the transmitting side, and the larger receiving area as well as the noise reduction at the receiving side. The light intensity is increased by the multiple transmitting headlights, bringing higher SNR as well as AIR. The PD array with MRC technology not only increases the maximum AIR, but also simplifies the adjusting of the optical receiving path.
Finally, the combination of linear and nonlinear interpolation methods of the SNR makes the radar able to precisely guide the source entropy of the PS VLC, achieving the highest data rate at every point with no additional SNR estimation. A SNR table can be calculated after the SNR is estimated at several discrete calibration points. Within the near field, the SNR is described as a linear function of the distance, while, in the far field, the SNR is a nonlinear function of the distance. Such SNR table shows an exact match with the experimental result, and the error of the estimated AIR is 63.6% less than the one of the AIR estimated with the SNR table that is entirely linear interpolated. This is the first sensing and communication system in VLC.
Author Contributions
Conceptualization, N.C.; Data curation, J.J.; Formal analysis, J.J.; Investigation, J.J.; Methodology, J.J. and P.Z.; Resources, Y.Z.; Software, P.Z.; Supervision, N.C.; Validation, F.H.; Visualization, J.J.; Writing–original draft, J.J.; Writing–review and editing, N.C. All authors have read and agreed to the published version of the manuscript.
Funding
This work was partially funded by the National Key Research and Development Program of China (2017YFB0403603), and the NSFC project (No.61925104).
Conflicts of Interest
The authors declare no conflict of interest.
References
- MacHardy, Z.; Khan, A.; Obana, K.; Iwashina, S. V2X Access Technologies: Regulation, Research, and Remaining Challenges. IEEE Commun. Surv. Tutor. 2018, 20, 1858–1877. [Google Scholar] [CrossRef]
- Boban, M.; Manolakis, K.; Ibrahim, M.; Bazzi, S.; Xu, W. Design aspects for 5G V2X physical layer. In Proceedings of the 2016 IEEE Conference on Standards for Communications and Networking (CSCN), Berlin, Germany, 31 October–2 November 2016; pp. 1–7. [Google Scholar]
- Seo, H.; Lee, K.; Yasukawa, S.; Peng, Y.; Sartori, P. LTE evolution for vehicle-to-everything services. IEEE Commun. Mag. 2016, 54, 22–28. [Google Scholar] [CrossRef]
- Morgan, Y.L. Notes on DSRC WAVE Standards Suite: Its Architecture, Design, and Characteristics. IEEE Commun. Surv. Tutor. 2010, 12, 504–518. [Google Scholar] [CrossRef]
- Kiela, K.; Barzdenas, V.; Jurgo, M.; Macaitis, V.; Rafanavicius, J.; Vasjanov, A.; Kladovscikov, L.; Navickas, R. Review of V2X–IoT Standards and Frameworks for ITS Applications. Appl. Sci. 2020, 10, 4314. [Google Scholar] [CrossRef]
- Baldessari, R.; Bödekker, B.; Deegener, M.; Festag, A.; Franz, W.; Kellum, C.C.; Kosch, T.; Kovacs, A.; Lenardi, M.; Menig, C.; et al. Car-2-Car Communication Consortium-Manifesto; Technical Report; Braunschweig, Germany, November 2007. Available online: https://elib.dlr.de/48380/ (accessed on 22 September 2020).
- Fleming, B. New Automotive Electronics Technologies [Automotive Electronics]. IEEE Veh. Technol. Mag. 2012, 7, 4–12. [Google Scholar] [CrossRef]
- Choi, J.; Va, V.; Gonzalez-Prelcic, N.; Daniels, R.; Bhat, C.R.; Heath, R.W. Millimeter-Wave Vehicular Communication to Support Massive Automotive Sensing. IEEE Commun. Mag. 2016, 54, 160–167. [Google Scholar] [CrossRef]
- Domínguez, J.M.L.; Sanguino, T.J.M. Review on V2X, I2X, and P2X Communications and Their Applications: A Comprehensive Analysis over Time. Sensors 2019, 19, 2756. [Google Scholar] [CrossRef] [PubMed]
- Abrol, A.; Jha, R.K. Power Optimization in 5G Networks: A Step Towards GrEEn Communication. IEEE Access 2016, 4, 1355–1374. [Google Scholar] [CrossRef]
- Chi, N.; Zhou, Y.; Liang, S.; Wang, F.; Li, J.; Wang, Y. Enabling Technologies for High-Speed Visible Light Communication Employing CAP Modulation. J. Light. Technol. 2018, 36, 510–518. [Google Scholar] [CrossRef]
- Wang, C.; Li, G.; Hu, F.; Zhao, Y.; Jia, J.; Zhou, P.; Lu, Q.; Chen, J.; Li, Z.; Chi, N. Visible light communication for Vehicle to Everything beyond 1 Gb/s based on a LED car headlight and a 2 × 2 PIN array. Chin. Opt. Lett. 2020, 18, 110602. [Google Scholar] [CrossRef]
- Zhou, Y.; Zhu, X.; Hu, F.; Shi, J.; Wang, F.; Zou, P.; Liu, J.; Jiang, F.; Chi, N. Common-anode LED on a Si substrate for beyond 15Gbit/s underwater visible light communication. Photonics Res. 2019, 7, 1019–1029. [Google Scholar] [CrossRef]
- Shafik, R.A.; Rahman, M.S.; Islam, A.R. On the Extended Relationships Among EVM, BER and SNR as Performance Metrics. In Proceedings of the 2006 International Conference on Electrical and Computer Engineering, Dhaka, Bangladesh, 19–21 December 2006; pp. 408–411. [Google Scholar]
- Kschischang, F.R.; Pasupathy, S. Optimal nonuniform signaling for Gaussian channels. IEEE Trans. Inf. Theory 1993, 39, 913–929. [Google Scholar] [CrossRef]
- Schulte, P.; Böcherer, G. Constant Composition Distribution Matching. IEEE Trans. Inf. Theory 2016, 62, 430–434. [Google Scholar] [CrossRef]
- Böcherer, G.; Steiner, F.; Schulte, P. Bandwidth Efficient and Rate-Matched Low-Density Parity-Check Coded Modulation. IEEE Trans. Commun. 2015, 63, 4651–4665. [Google Scholar] [CrossRef]
- Cho, J.; Schmalen, L.; Winzer, P.J. Normalized Generalized Mutual Information as a Forward Error Correction Threshold for Probabilistically Shaped QAM. In Proceedings of the 2017 European Conference on Optical Communication (ECOC), Gothenburg, Sweden, 17–21 September 2017; pp. 1–3. [Google Scholar]
- Huang, X.; Wang, Z.; Shi, J.; Wang, Y.; Chi, N. 16 Gbit/s phosphorescent white LED based VLC transmission using a cascaded pre-equalization circuit and a differential outputs PIN receiver. Opt. Express 2015, 23, 22034. [Google Scholar] [CrossRef] [PubMed]
© 2020 by the authors. Licensee MDPI, Basel, Switzerland. This article is an open access article distributed under the terms and conditions of the Creative Commons Attribution (CC BY) license (http://creativecommons.org/licenses/by/4.0/).