Assessing Significant Factors Affecting Risky Riding Behaviors of Motorcyclists


Abstract
1. Introduction
2. Study Methodology
3. Data Collection
4. Results and Discussion
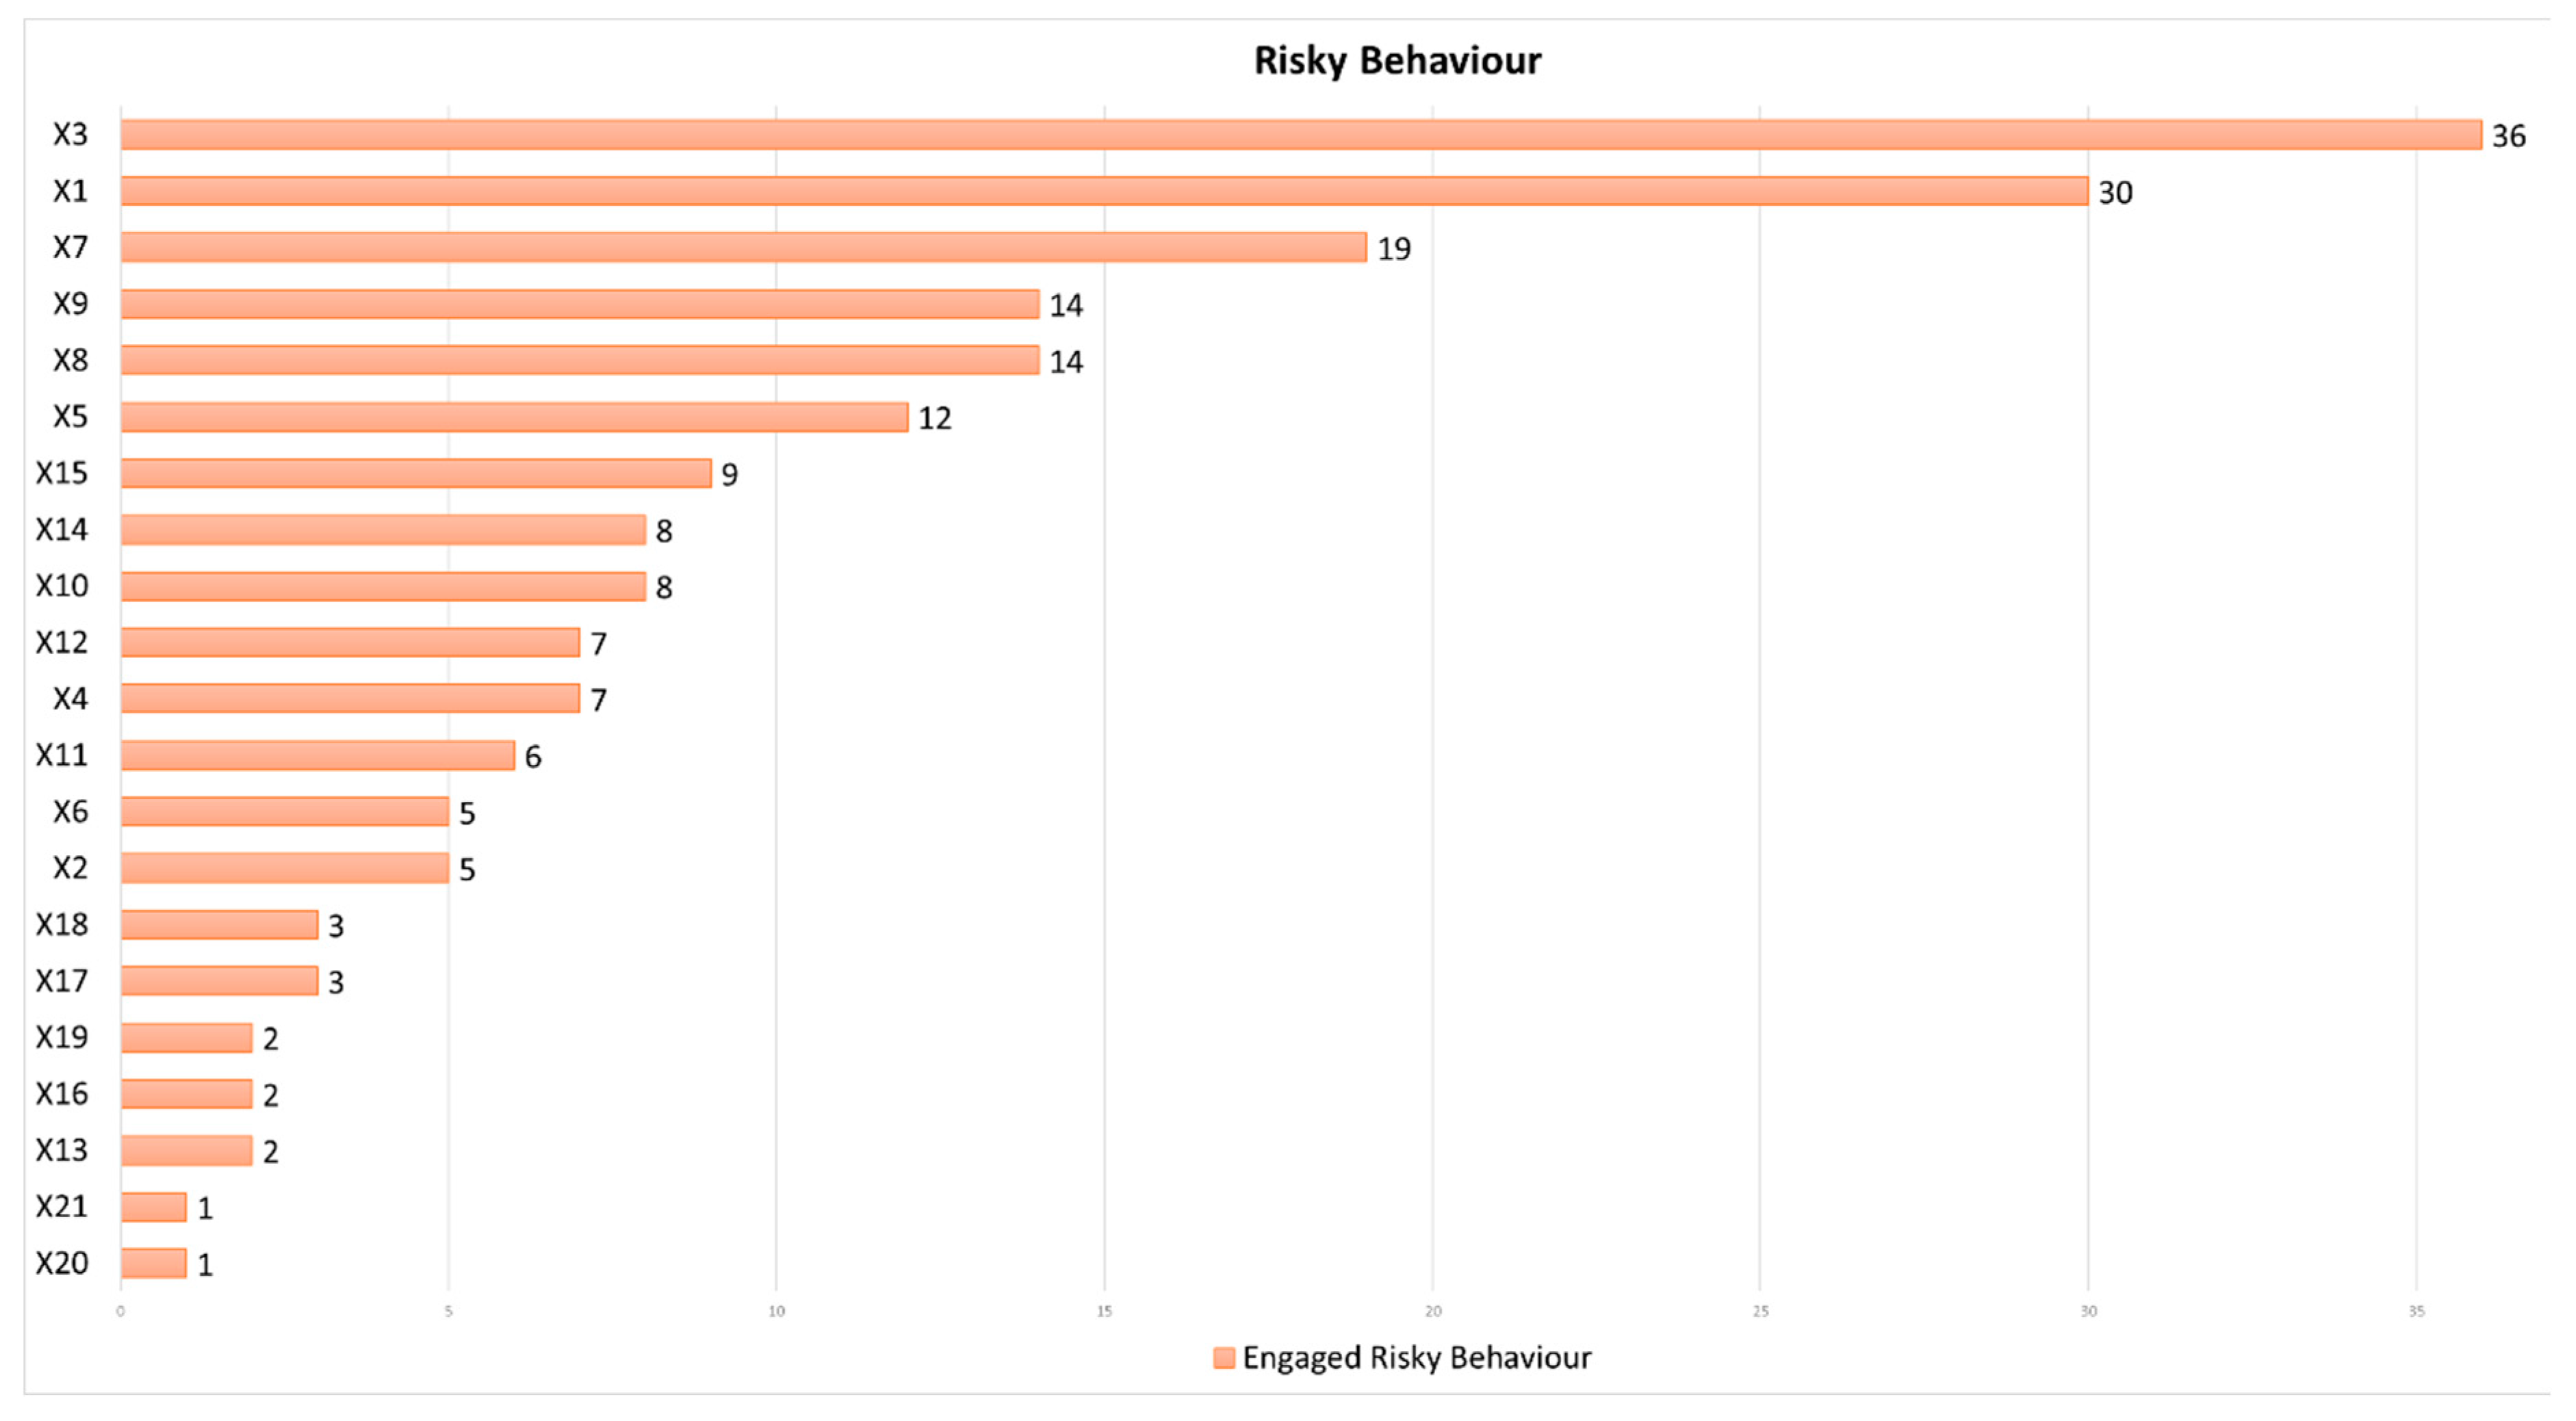
4.1. Descriptive Statistics
4.2. Reliability Test
4.3. Principal Component Analysis (PCA)
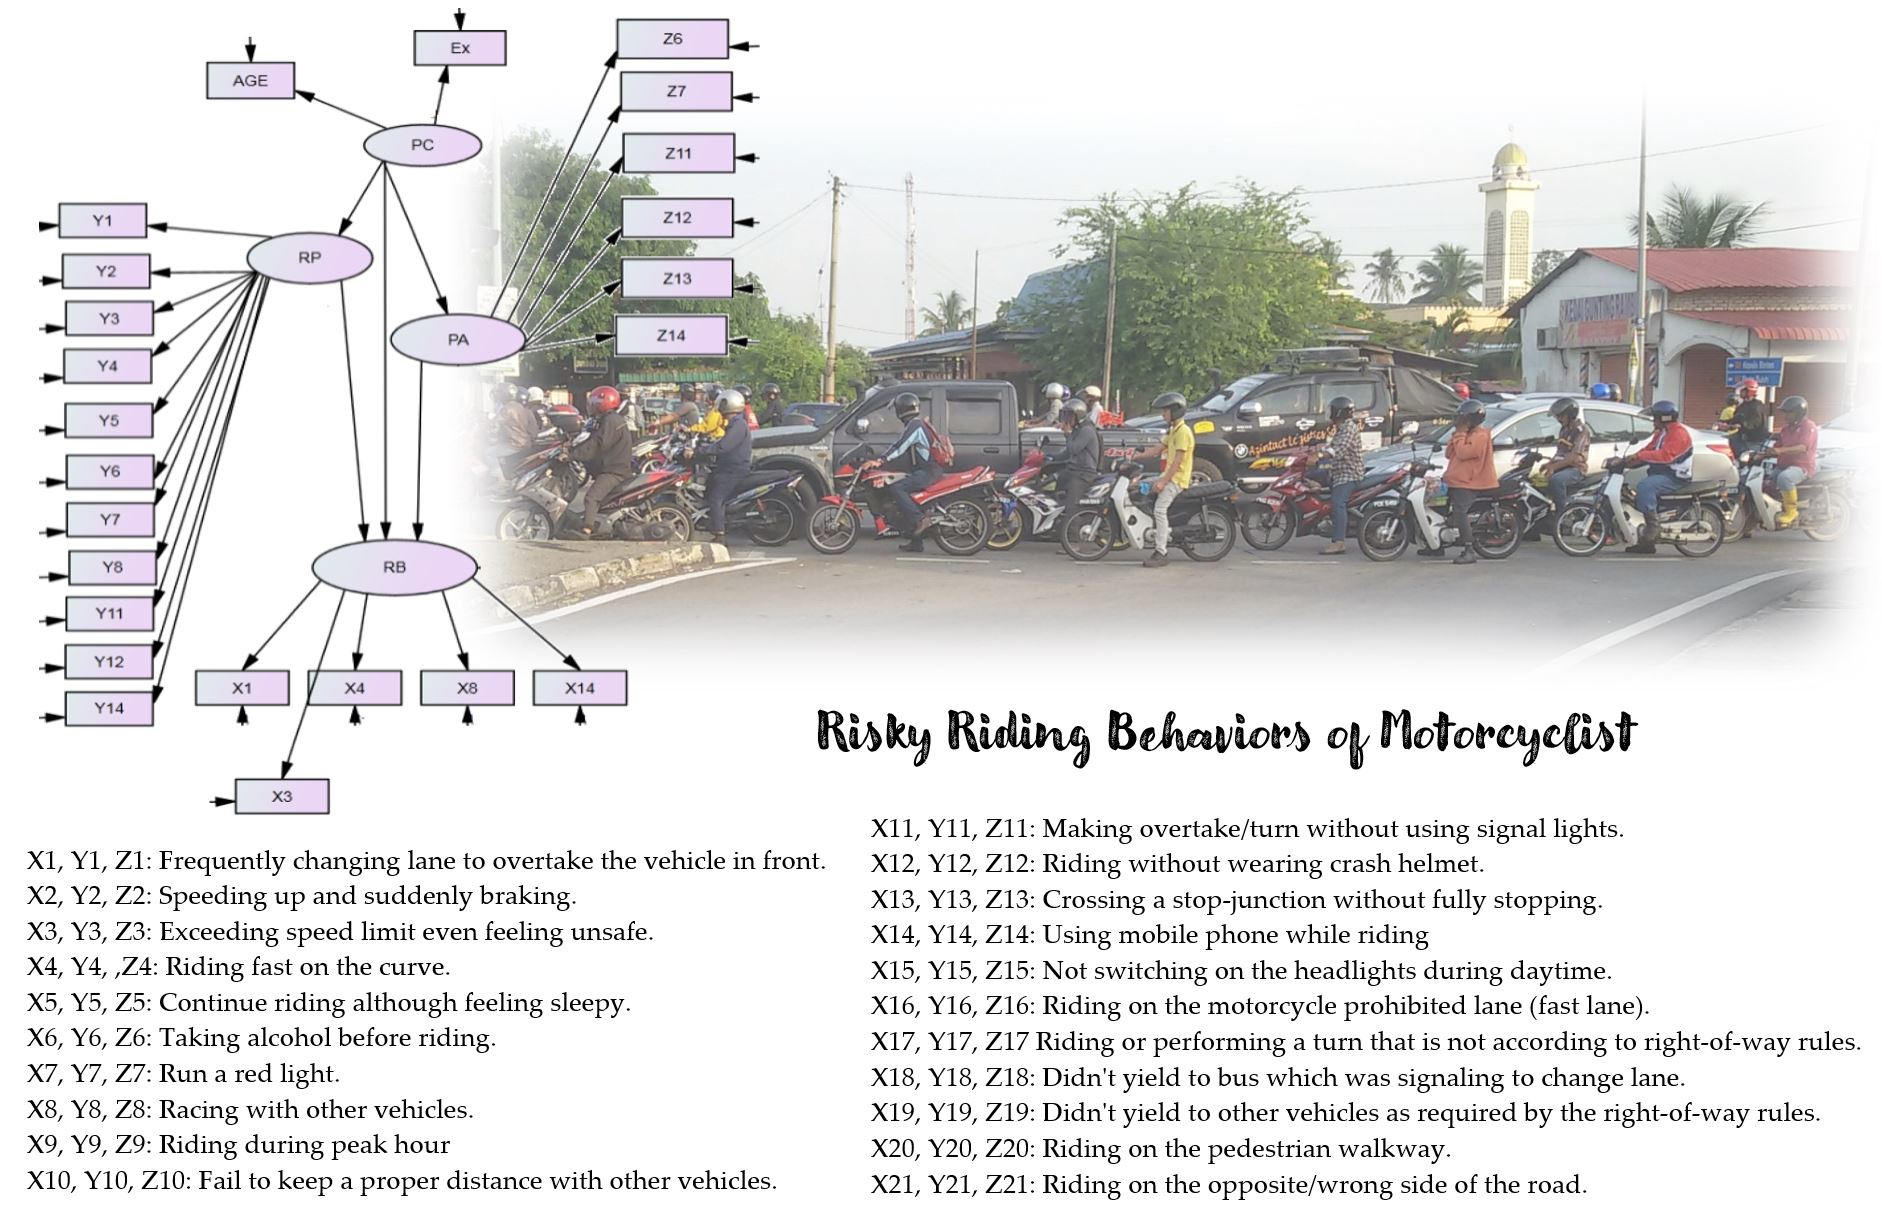
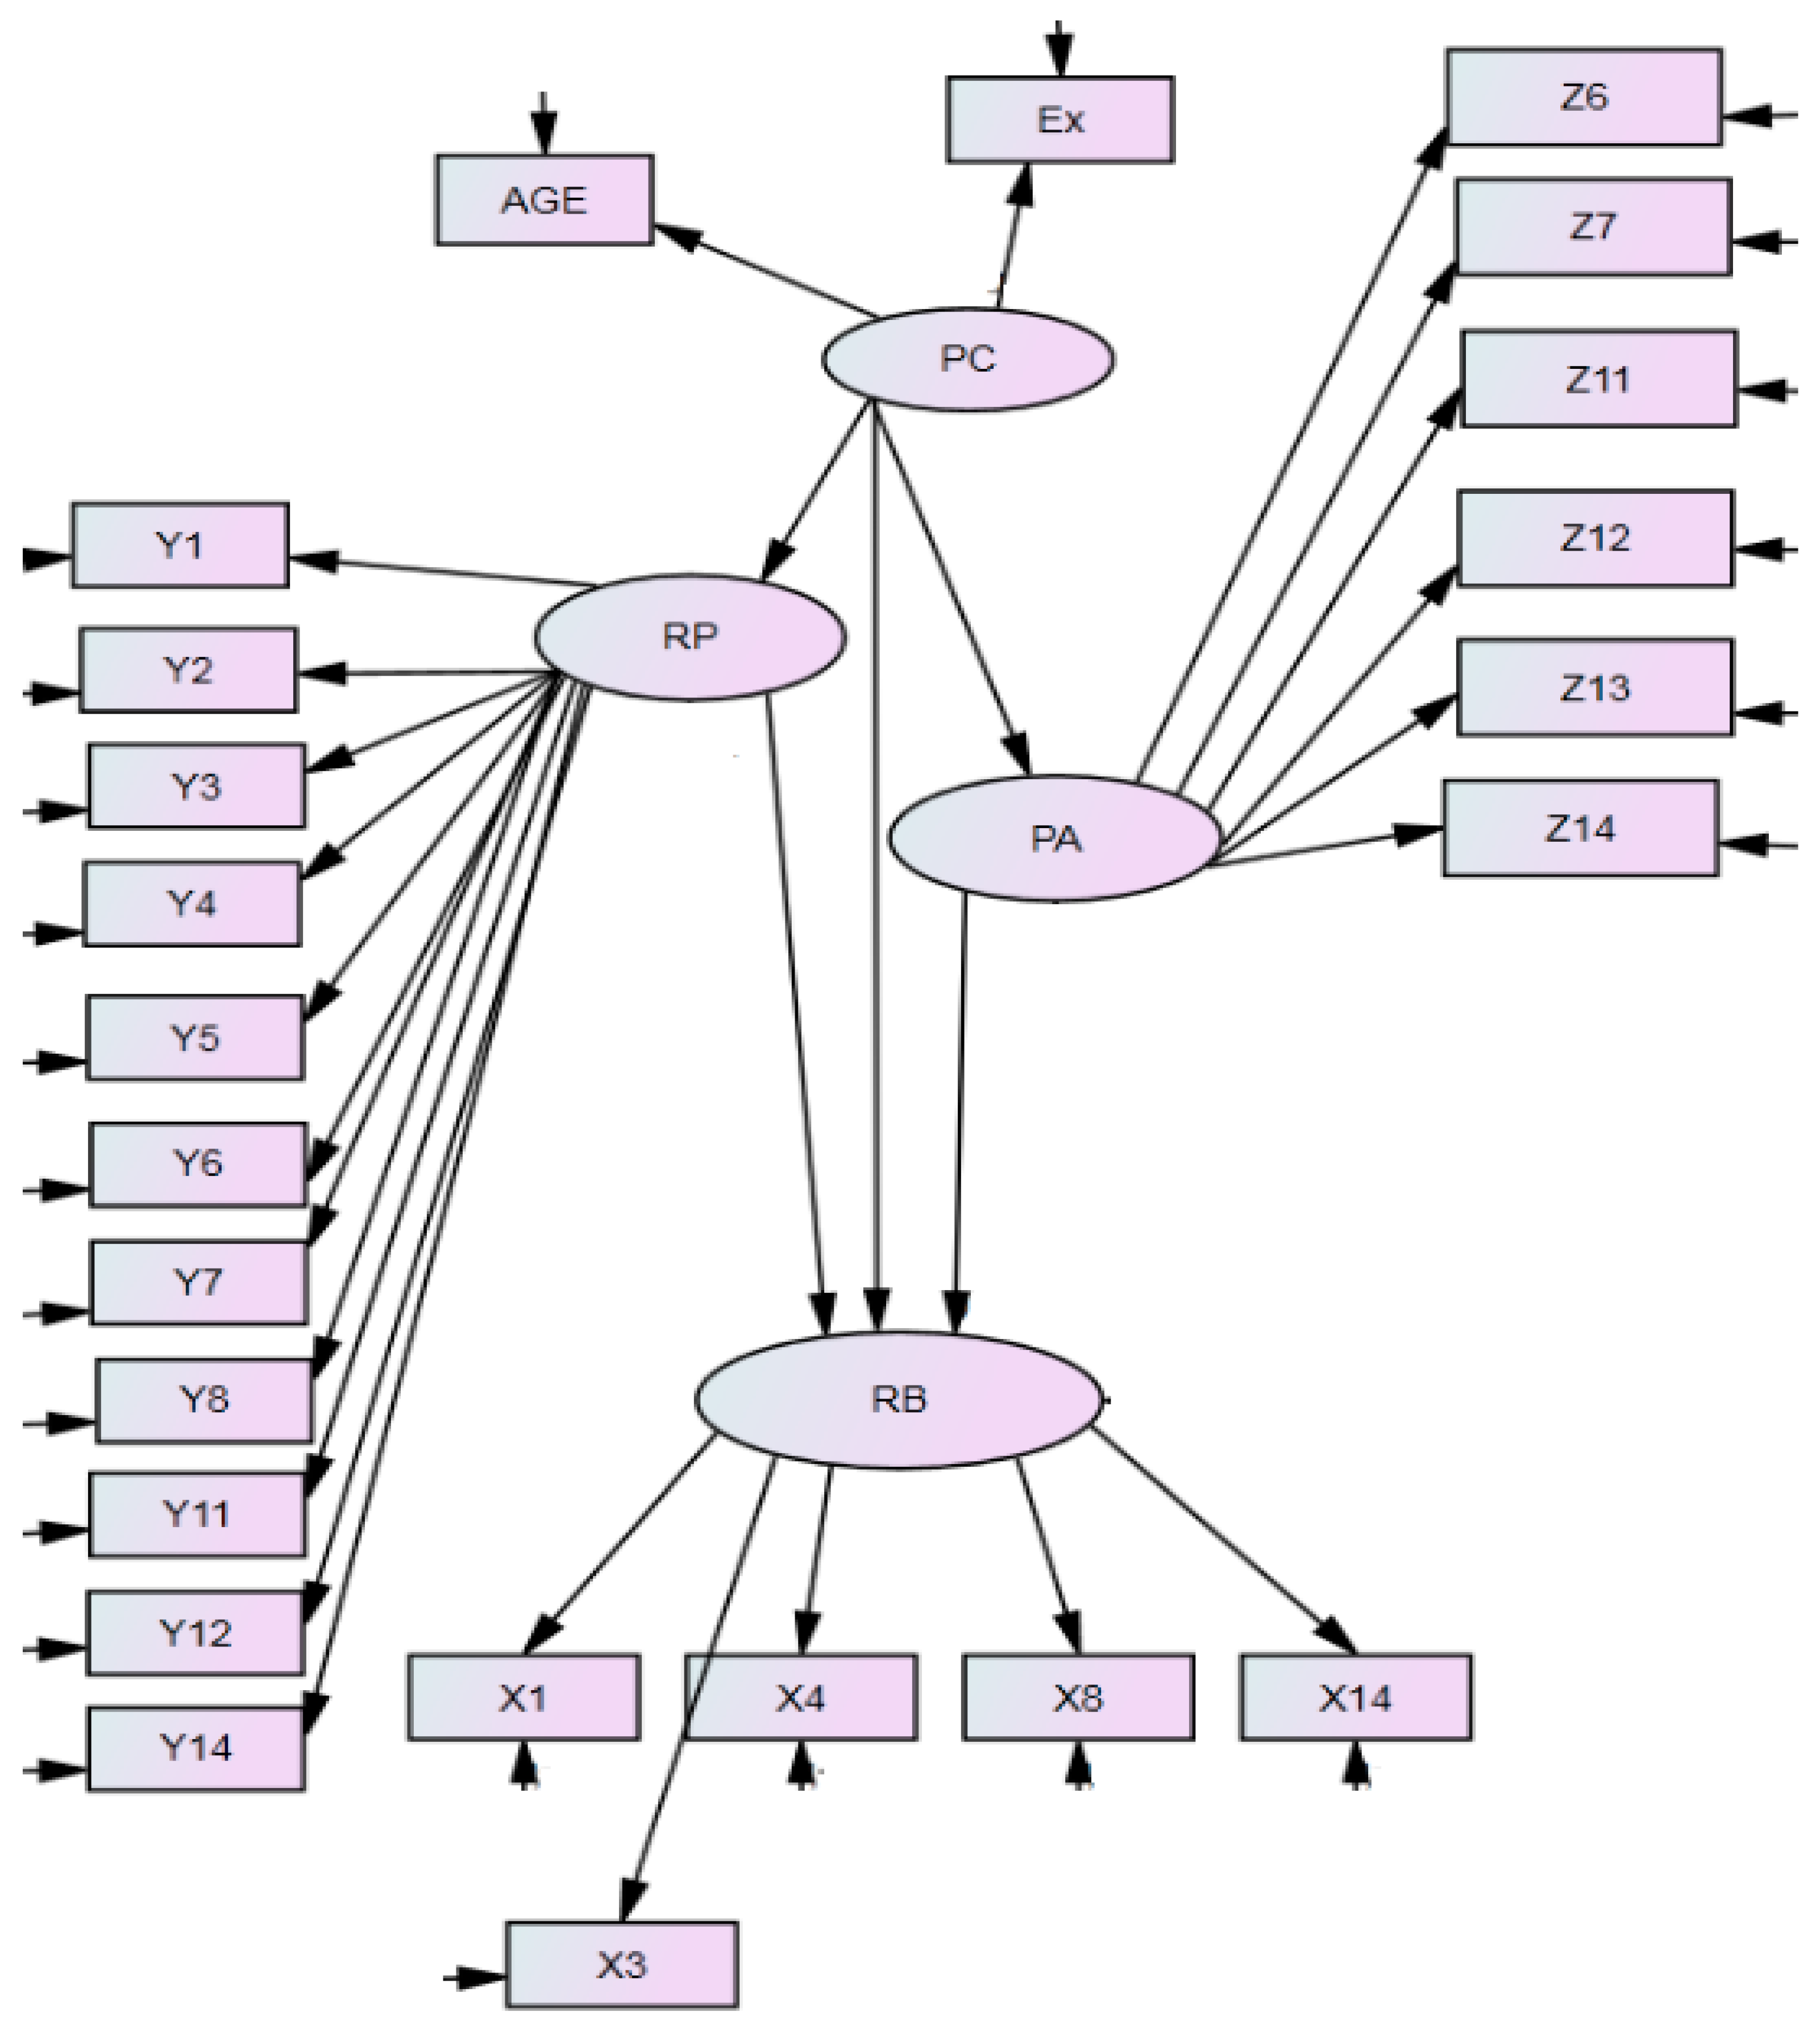
4.4. Structural Equation Modeling (SEM)
5. Conclusions
- Larger sample size is required to ensure the accuracy of the results obtained. The greater the amount of data obtained, the more accurate the analysis process will be.
- The gender of the respondents should be controlled so that both genders of respondents have a balanced number.
- As the results indicate that risk perception has a low positive relationship with risky riding behavior (estimate coefficient = 0.036), which was not expected, this study could be further improved through the collection of an increased number of samples, which should provide a more consistent finding.
- Further investigations to improve the findings can be done by developing an SEM model which includes the riders’ perspectives of positive or negative outcomes along with the factors that induce or hinder this.
Author Contributions
Funding
Acknowledgments
Conflicts of Interest
References
- Loo, P.Y.; Hung, W.T.; Lo, H.K.; Wong, S.C. Road safety strategies: A comparative framework and case studies. Transp. Rev. 2005, 25, 613–639. [Google Scholar] [CrossRef]
- Elliott, M.A. Predicting motorcyclists’ intentions to speed: Effects of selected cognition from the theory of planned behaviour, self-identity and social identity. Accid. Anal. Prev. 2010, 42, 718–725. [Google Scholar] [CrossRef] [PubMed]
- Karim, M.R.; Abdullah, S.; Marjan, J. Road safety audit—Issues and challenges from the Malaysian experience. J. East. Asia Soc. Transp. Stud. 2003, 5, 2526–2537. [Google Scholar]
- Radin, U.R.S.; Mackay, G.M.; Hills, B.L. Preliminary analysis of motorcycle accidents: Short-term impacts of the running headlights campaign and regulation in Malaysia. J. Traffic Med. 1995, 23, 17–28. [Google Scholar]
- Abdul Manan, M.M.; Varhely, A. Motorcycle fatalities in Malaysia. IATSS Res. 2012, 36, 30–39. [Google Scholar] [CrossRef]
- Hung-Jung, C.; Yuh-Ting, W. Modeling and simulation of motorcycle traffic flow. In Proceedings of the IEEE International Conference on Systems, Man and Cybernetics, The Hague, Netherlands, 10–13 October 2004; pp. 6262–6267. [Google Scholar]
- Wedegama, D. Analysing self-reported risky behaviours of motorcyclists in Bali using Structural Equation Modelling. J. East. Asia Soc. Transp. Stud. 2015, 11, 2015–2027. [Google Scholar]
- Moss, A.C.; Albery, I.P. A dual-process model of the alcohol-behavior link for social drinking. Psychol. Bull. 2009, 135, 516–530. [Google Scholar] [CrossRef] [PubMed]
- Sultan, Z.; Ngadiman, N.I.; Kadir, F.D.A.; Roslan, N.F.; Moeinaddini, M. Factor analysis of motorcycle crashes in Malaysia. J. Malays. Inst. Plan. 2016, 14, 135–146. [Google Scholar] [CrossRef]
- McCartt, A.T.; Mayhew, D.R.; Braitman, K.A.; Ferguson, S.A.; Simpson, H.M. Effects of age and experience on young driver crashes. Traffic Inj. Prev. 2009, 10, 209–219. [Google Scholar] [CrossRef]
- Bulmer, M. Questionnaires, Sage Benchmarks in Social Science Research Methods; Sage Publications: London, UK, 2004; p. 354. [Google Scholar]
- Scott-Parker, B.; Watson, B.; King, M.J. Understanding the psychosocial factors influencing the risky behaviour of young drivers. Transp. Res. Part F Traffic Psychol. Behav. 2009, 12, 470–482. [Google Scholar] [CrossRef]
- Nancy, R.; Pivik, K. Age and gender differences in risky driving: The roles of positive affect and risk perception. Accid. Anal. Prev. 2011, 43, 923–993. [Google Scholar]
- Carlson, N.R. Psychology: The Science of Behavior; Pearson: Toronto, ON, Canada, 2009. [Google Scholar]
- Hassan, H.M.; Abdel-Aty, M.A. Exploring the safety implications of young drivers’ behavior, attitudes and perceptions. Accid. Anal. Prev. 2013, 50, 361–370. [Google Scholar] [CrossRef] [PubMed]
- Loo, L.Y.L.; Corcoran, J.; Mateo-Babiano, D.; Zahnow, R. Transport mode choice in South East Asia: Investigating the relationship between transport users’s perception and travel behaviour in Johor Bahru, Malaysia. J. Transp. Geogr. 2015, 46, 99–111. [Google Scholar] [CrossRef]
- Shaw, P.J.A. Multivariate Statistics for the Environmental Sciences; Hodder Education: London, UK, 2003. [Google Scholar]
- Fyhri, A.; Backer-Grøndahl, A. Personality and risk perception in transport. Accid. Anal. Prev. 2012, 49, 470–475. [Google Scholar] [CrossRef] [PubMed]
- Hooper, D.; Coughlan, J.; Mullen, M. Structural equation modelling: Guidelines for determining model fit. Electron. J. Bus. Res. Methods 2008, 6, 53–60. [Google Scholar]
- Steg and Brussel, Accidents, aberrant behaviours, and speeding of young moped riders. Transp. Res. Part F 2009, 12, 503–511. [CrossRef]
- Brewer, N.T.; Weinstein, N.D.; Cuite, C.L.; Herrington, J.E. Risk perceptions and their relation to risk behavior. Ann. Behav. Med. 2004, 27, 125–130. [Google Scholar] [CrossRef]
- Ulleberg, P.; Rundmo, T. Personality, attitudes and risk perception as predictors of risky driving behaviour among young drivers. Saf. Sci. 2003, 41, 427–443. [Google Scholar] [CrossRef]
- Romero, D.L.; De Barros, D.M.; Belizario, G.O.; Serafim, A.D.P. Personality traits and risky behavior among motorcyclists: An exploratory study. PLoS ONE 2019, 14, e0225949. [Google Scholar] [CrossRef]
- Zamani-Alavijeh, F.; Niknami, S.; Bazargan, M.; Mohammadi, F.; Montazeri, A.; Ahmadi, F.; Ghofranipour, F. Accident-related risk behaviors associated with motivations for motorcycle use in Iran: A Country with very high traffic deaths. Traffic Inj. Prev. 2009, 10, 237–242. [Google Scholar] [CrossRef]
- Schermelleh-Engel, K.; Moosbrugger, H. Evaluating the fit of structural equation models: Tests of significance and descriptive goodnessof-fit measures. Methods Psychol. Res. Online 2003, 8, 23–74. [Google Scholar]
- Lai, S.F. The accident risk measuring model for urban arterials. In Proceedings of the 3rd International Conference on Road Safety and Simulation, Indianapolis, IN, USA, 14–16 September 2011. [Google Scholar]
- Wedagama, D.M.P. Local motorcyclists’ intentions towards traffic violations and speeding. J. East. Asia Soc. Transp. Stud. 2017, 12, 1871–1883. [Google Scholar]
- Chakrabarty, N.; Gupta, K.; Bhatnagar, A. A survey on awareness of traffic safety among drivers in Delhi, India. Stand. Int. J. Trans. Ind. Financ. Bus. Manag. 2013, 1, 106–111. [Google Scholar] [CrossRef]


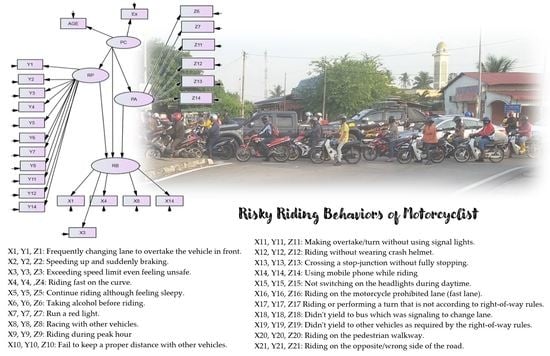
| No. | Behavior Measures | Variable Code | ||
|---|---|---|---|---|
| Risky Behavior | Risk Perception | Positive Affect | ||
| 1 | Frequently changing lane to overtake the vehicle in front. | X1 | Y1 | Z1 |
| 2 | Speeding up and suddenly braking. | X2 | Y2 | Z2 |
| 3 | Exceeding speed limit even when feeling unsafe. | X3 | Y3 | Z3 |
| 4 | Riding fast on the curve. | X4 | Y4 | Z4 |
| 5 | Continue riding although feeling sleepy. | X5 | Y5 | Z5 |
| 6 | Taking alcohol before riding. | X6 | Y6 | Z6 |
| 7 | Run a red light. | X7 | Y7 | Z7 |
| 8 | Racing with other vehicles. | X8 | Y8 | Z8 |
| 9 | Riding during peak hour. | X9 | Y9 | Z9 |
| 10 | Fail to keep a proper distance with other vehicles. | X10 | Y10 | Z10 |
| 11 | Overtaking/turning without using signal lights. | X11 | Y11 | Z11 |
| 12 | Riding without wearing crash helmet. | X12 | Y12 | Z12 |
| 13 | Crossing a stop-junction without fully stopping. | X13 | Y13 | Z13 |
| 14 | Using mobile phone while riding. | X14 | Y14 | Z14 |
| 15 | Not switching on the headlights during daytime. | X15 | Y15 | Z15 |
| 16 | Riding on the motorcycle prohibited lane (fast lane). | X16 | Y16 | Z16 |
| 17 | Riding or performing a turn that is not according to right-of-way rules in order to save time. | X17 | Y17 | Z17 |
| 18 | Not yielding to busses that are signaling to change lane. | X18 | Y18 | Y18 |
| 19 | Not yielding to other vehicles as required by the right-of-way rules. | X19 | Y19 | Y19 |
| 20 | Riding on the pedestrian walkway. | X20 | Y20 | Z20 |
| 21 | Riding on the opposite/wrong side of the road. | X21 | Y21 | Z21 |
| Risky Behavior | Risk Perception | Positive Affect | ||||
|---|---|---|---|---|---|---|
| Mean | S.D. | Mean | S.D. | Mean | S.D. | |
| Frequently changing lane to overtake the vehicle in front. | 2.941 | 1.214 | 3.618 | 1.136 | 2.642 | 1.238 |
| Speeding up and suddenly braking. | 2.142 | 0.928 | 3.936 | 1.166 | 1.941 | 1.035 |
| Exceeding speed limit even feeling unsafe. | 2.074 | 1.131 | 3.873 | 1.241 | 2.069 | 1.134 |
| Riding fast on the curve. | 1.995 | 0.97 | 4.059 | 1.202 | 2.069 | 1.181 |
| Continue riding although feeling sleepy. | 2.049 | 1.122 | 4.019 | 1.267 | 1.706 | 0.826 |
| Taking alcohol before riding. | 1.211 | 0.587 | 4.201 | 1.314 | 1.348 | 0.75 |
| Run a red light. | 2.020 | 1.096 | 3.897 | 1.253 | 1.921 | 1.024 |
| Racing with other vehicles. | 1.500 | 0.874 | 4.054 | 1.245 | 1.735 | 1.036 |
| Riding during peak hour. | 3.216 | 1.245 | 3.015 | 1.129 | 2.265 | 1.14 |
| Fail to keep a proper distance with other vehicles. | 2.206 | 1.016 | 3.603 | 1.151 | 2.01 | 0.915 |
| Overtaking/turning without using signal lights. | 1.887 | 0.968 | 3.775 | 1.207 | 1.814 | 0.965 |
| Riding without wearing crash helmet. | 1.608 | 0.933 | 4.123 | 1.236 | 1.73 | 1.046 |
| Crossing a stop-junction without fully stopping. | 2.191 | 1.109 | 3.632 | 1.156 | 2.138 | 1.128 |
| Using mobile phone while riding. | 1.549 | 0.872 | 4.088 | 1.233 | 1.721 | 1.029 |
| Not switching on the headlights during daytime. | 1.931 | 1.345 | 2.936 | 1.368 | 2.240 | 1.230 |
| Latent Variables | Cronbach’s Alpha |
|---|---|
| Risky Behaviors (X) | 0.833 |
| Risk Perception (Y) | 0.945 |
| Positive Affect (Z) | 0.889 |
| Latent Variable | Observed Variable | Variable Code | Loading Factor | Variance Explained | Cronbach’s Alpha |
|---|---|---|---|---|---|
| Risk Perception | Frequently changing lane to overtake the vehicle in front. | Y1 | 0.577 | 60.13% | 0.945 |
| Speeding up and suddenly braking. | Y2 | ||||
| Exceeding speed limit even feeling unsafe. | Y3 | 0.79 | |||
| Riding fast on the curve. | Y4 | ||||
| Continue riding although feeling sleepy. | Y5 | 0.829 | |||
| Taking alcohol before riding. | Y6 | ||||
| Run a red light. | Y7 | 0.864 | |||
| Racing with other vehicles. | Y8 | ||||
| Overtaking/turning without using signal lights. | Y11 | 0.869 | |||
| Riding without wearing crash helmet. | Y12 | ||||
| Using mobile phone while riding. | Y14 | 0.900 | |||
| Positive Affect | Taking alcohol before riding. | Z6 | 0.574 | 41.40% | 0.889 |
| Run a red light. | Z7 | 0.509 | |||
| Overtaking/turning without using signal lights. | Z11 | 0.698 | |||
| Riding without wearing crash helmet. | Z12 | 0.781 | |||
| Crossing a stop-junction without fully stopping. | Z13 | 0.693 | |||
| Using mobile phone while riding. | Z14 | 0.654 | |||
| Risky Behavior | Frequently changing lane to overtake the vehicle in front. | X1 | 0.580 | 31.49% | 0.833 |
| Exceeding speed limit even feeling unsafe. | X3 | 0.653 | |||
| Riding fast on the curve. | X4 | 0.669 | |||
| Racing with other vehicles. | X8 | 0.651 | |||
| Using mobile phone while riding. | X14 | 0.556 |
| Measures of Fit | Developed Model | Acceptable Fit Values | |
|---|---|---|---|
| Model Chi-squared | χ2 | 941.2 | - |
| Degrees of Freedom | df | 229 | - |
| Probability Value | p-value | 0 | <0.05 |
| Model Chi-squared/Degrees of Freedom | χ2/df | 4.11 | <5 |
| Root Mean Square Error of Approximation | RMSEA | 0.074 | <0.08 |
| Normed Fit Index | NFI | 0.595 | 0 < NFI < 1, closer to 1 is better |
| Comparative Fit Index | CFI | 0.646 | 0 < CFI < 1, closer to 1 is better |
| Goodness of Fit Index | GFI | 0.926 | 0.90 ≤ GFI ≤ 0.95 |
| Adjusted Goodness of Fit Index | AGFI | 0.852 | 0.85 ≤ GFI ≤ 0.90 |
| Parsimony-adjusted NFI | PNFI | 0.590 | >0.5 |
| Path | Estimate | p-Values |
|---|---|---|
| Risky Behavior ← Age | −0.037 | 0.754 |
| Risk Perception ← Riding Experience | 0.012 | 0.871 |
| Positive Affect ← Riding Experience | −0.032 | 0.709 |
| Risky Behavior ← Risk perception | 0.035 | 0.767 |
| Risky Behavior ← Positive Affect | 1.016 | *** |
| Y1 ← Risk perception | 0.728 | *** |
| Y2 ← Risk perception | 0.893 | *** |
| Y3 ← Risk perception | 1.009 | *** |
| Y4 ← Risk perception | 1.000 | *** |
| Y5 ← Risk perception | 1.062 | *** |
| Y6 ← Risk perception | 1.111 | *** |
| Y7 ← Risk perception | 0.978 | *** |
| Y8 ← Risk perception | 1.023 | *** |
| Y11 ← Risk perception | 0.921 | *** |
| Y12 ← Risk perception | 0.984 | *** |
| Y14 ← Risk perception | 0.990 | *** |
| Z6 ← Positive Affect | 0.347 | *** |
| Z7 ← Positive Affect | 0.581 | *** |
| Z11 ← Positive Affect | 0.629 | *** |
| Z12 ← Positive Affect | 0.620 | *** |
| Z13 ← Positive Affect | 0.715 | *** |
| Z14 ← Positive Affect | 0.625 | *** |
| X1 ← Risky Behavior | 0.456 | *** |
| X3 ← Risky Behavior | 0.434 | *** |
| X4 ← Risky Behavior | 0.406 | *** |
| X8 ← Risky Behavior | 0.347 | *** |
| X14 ← Risky Behavior | 0.297 | *** |
© 2020 by the authors. Licensee MDPI, Basel, Switzerland. This article is an open access article distributed under the terms and conditions of the Creative Commons Attribution (CC BY) license (http://creativecommons.org/licenses/by/4.0/).
Share and Cite
Goh, W.C.; Leong, L.V.; Cheah, R.J.X. Assessing Significant Factors Affecting Risky Riding Behaviors of Motorcyclists. Appl. Sci. 2020, 10, 6608. https://doi.org/10.3390/app10186608
Goh WC, Leong LV, Cheah RJX. Assessing Significant Factors Affecting Risky Riding Behaviors of Motorcyclists. Applied Sciences. 2020; 10(18):6608. https://doi.org/10.3390/app10186608
Chicago/Turabian StyleGoh, Wins Cott, Lee Vien Leong, and Richard Jun Xian Cheah. 2020. "Assessing Significant Factors Affecting Risky Riding Behaviors of Motorcyclists" Applied Sciences 10, no. 18: 6608. https://doi.org/10.3390/app10186608
APA StyleGoh, W. C., Leong, L. V., & Cheah, R. J. X. (2020). Assessing Significant Factors Affecting Risky Riding Behaviors of Motorcyclists. Applied Sciences, 10(18), 6608. https://doi.org/10.3390/app10186608