Review

Recent Advances in Optical Detection of Aminoglycosides

1
College of Management and Economics, School of Pharmaceutical Science and Technology, Tianjin University, Tianjin 300072, China
2
College of Food Science and Engineering, Northwest A&F University, Yangling 712100, China
3
Department of Pharmaceutical Analysis at School of Pharmacy, Fudan University, Shanghai 201199, China
*
Authors to whom correspondence should be addressed.
Appl. Sci. 2020, 10(18), 6579; https://doi.org/10.3390/app10186579
Submission received: 17 August 2020 / Revised: 14 September 2020 / Accepted: 17 September 2020 / Published: 21 September 2020
(This article belongs to the Section Chemical and Molecular Sciences)

Abstract

:
Aminoglycosides (AGs) are broad-spectrum antibiotics used in both human infection and animal medicine. The overuse of AGs causes undesirable residues in food, leading to serious health problems due to food chain accumulation. In recent years, various methods have been developed to determine AGs in food. Among these methods, fluorescent (FL), colorimetric and chemiluminescent (CL) optical methods possess advantages such as their simple instrumentation, low cost, simple operation, feasibility of realizing visualization, and smartphone imaging. This mini-review summarizes optical assays for the detection of AGs in food developed in recent years. The detection principles for different categories are discussed. Then, the amplification techniques for the ultrasensitive detection of AGs are introduced. We also discuss multiplex methods for the simultaneous detection of AGs. Finally, the challenges and future prospects are discussed in the Conclusions and Perspectives section.

Graphical Abstract

1. Introduction

Aminoglycosides (AGs), in their structure, contain two or more amino sugars connected with an aminocyclitol through glycosidic bonds. They are broad-spectrum antibiotics. AGs can affect several steps in bacterial ribosome cycling, including inhibiting the formation of 70S initiating complex, selectively binding to the target protein on the 30S subunit, inducing the mismatch of codons, and so on [1].

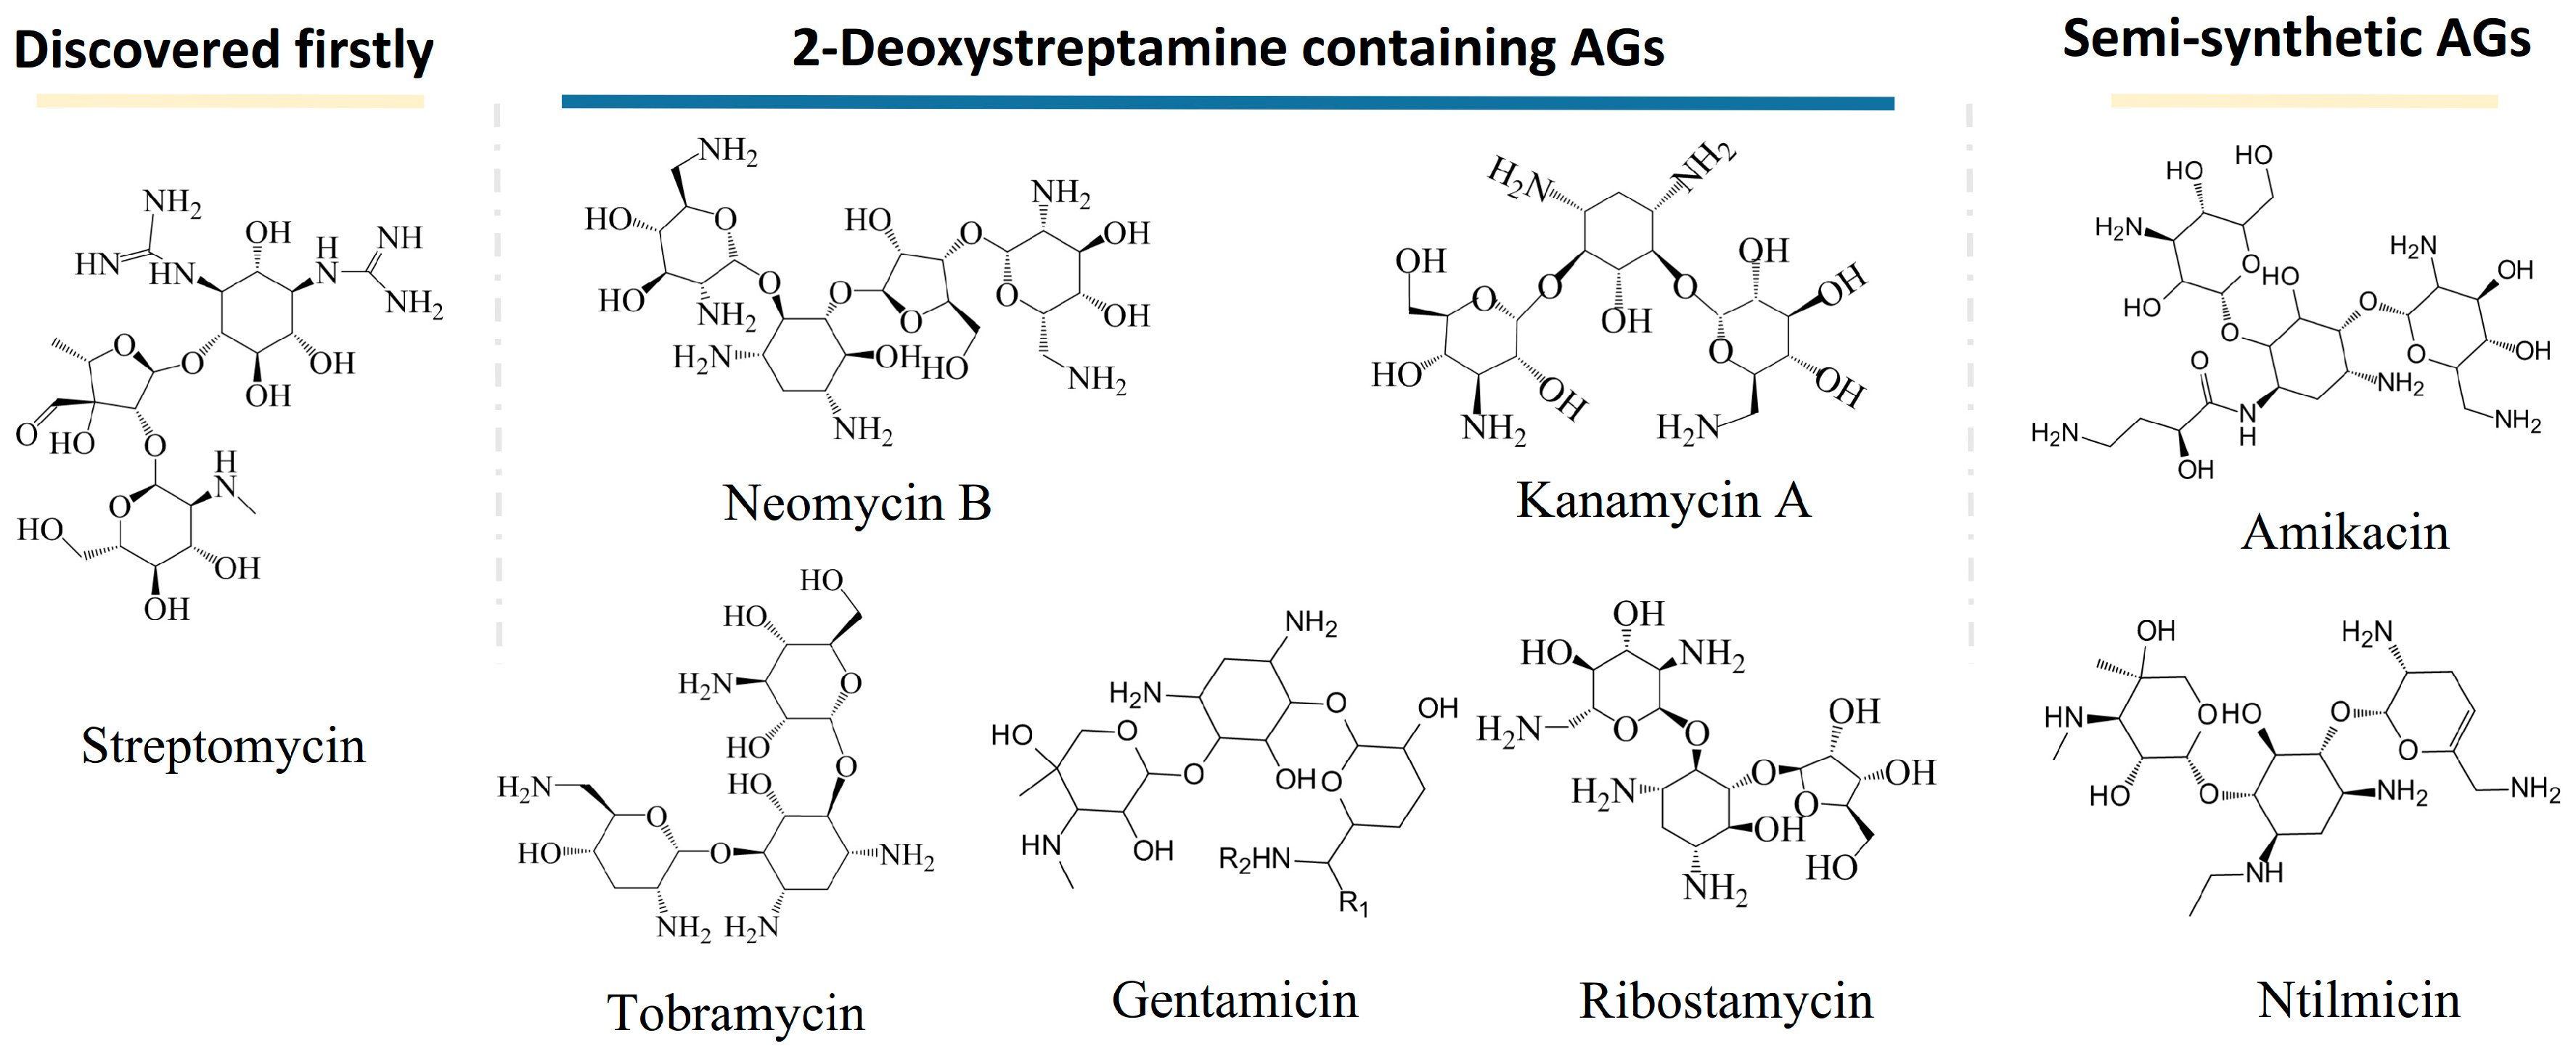
1.1. The History of Aminoglycosides

The history of AGs can be traced back to the discovery of streptomycin in the 1940s. Schaz and Waksman separated streptomycin from natural products successfully. Streptomycin is effective for the treatment of infections caused by most Gram-negative bacteria but is ineffective for Pseudomonas. The discovery of streptomycin inspired the world to screen antibiotics from natural products, and various AGs were discovered afterward. AGs that have a name with the suffix -mycin refer to those that are derived from Streptomyces genus, while those that have a name with the suffix -micin refer to those that are derived from Micromonospora. Neomycins, kanamycins, gentamicins, tobramycin, and ribostamycins are typical aminoglycosides containing 2-deoxystreptamine. They are produced from Streptomyces fradiae, Streptomyces kanamyceticus, Micromonospora purpurea, Streptomyces tenebrarius, and Streptomyces ribosidifcus, respectively [2]. Moreover, amikacin and netilmicin are presentive semi-synthetic aminoglycosides. Figure 1 shows the structures of typical AGs.

1.2. The Danger of Aminoglycosides

Because of their low price, good stability, and effective antibacterial activity, AGs have been used clinically in the treatment of Gram-negative bacteria, Monas and Staphylococcus infections, and tuberculosis [3]. In the treatment of animal disease, AGs are used to treat bovine mastitis, enteritis, metritis, peritonitis, sepsis, etc. In addition to being used as therapeutic drugs, AGs are also used for promoting the growth of animals [4], which inevitably causes the release of residues into the environment and undesirable residues in food. AGs have serious side effects including ototoxicity, toxicity to kidneys, damage of the vestibular nerve, muscle paralysis, etc. [5]. In severe cases, they can cause shock or even death. A small amount of antibiotics residue in food can induce antibiotic resistance cases, which will be a big problem in the future. Therefore, many countries and regions have set a maximum residue limit (MRL) for AG residues in animal products (Table 1). The simple and rapid detection of AGs with high sensitivity and selectivity is important for the routine detection of AGs.

1.3. Conventional Detection Methods

Since most of the AGs lack a chromophore and fluorophore, the detection of AGs is a big challenge. Traditional methods for the detection of AGs are based on microbial assays. Although these microbial assays are relatively cheap, the determination is time-consuming and the sensitivity and specificity are poor. Alternatively, high-performance liquid chromatography (HPLC), gas chromatography (GC), capillary electrophoresis (CE), etc., have been applied to the detection of AGs [6,7], among which HPLC is the most commonly used analysis method. Since AGs have no chromophore, HPLC coupled with all-purpose detection systems such as evaporative light-scattering detection (ELSD), pulsed amperometric detector (PAD), and mass spectrometry (MS) should be used [8]. Although these novel detection systems make the detection of AGs possible, their price is high and there are no conventional detectors equipped. By using ordinal UV absorption or fluorescent (FL) detectors, pre-column derivation and post-column derivation have been employed for the detection of AGs. The amino group contained in AGs can react with FL derivatization reagents, including o-phthalaldehyde, 1,2-naphthoquinone-4-sulfonate, dansyl chloride, 1-fluoro-2,4-dinitrobenzene, to form stable fluorescent derivatives of AGs. However, the pre-column derivation introduces new compounds such as derivation reagents and byproducts in the detection system, which may interfere with the analysis of target AGs. The incomplete derivation reaction may cause the loss of target AGs. Post-column derivation suffers from complex instrumentation because of the requirement for post-column reactors and additional pumps. Due to the complex instrumentation, time-consuming detection and sample preparation processes, these chromatographic methods are difficult to be applied to the point of care test (POCT) for AGs.

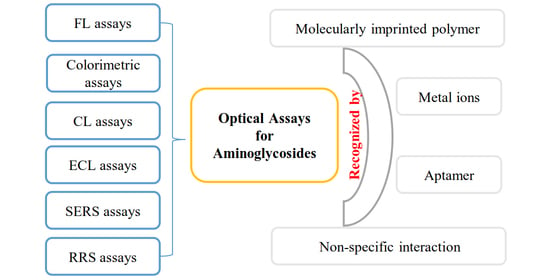
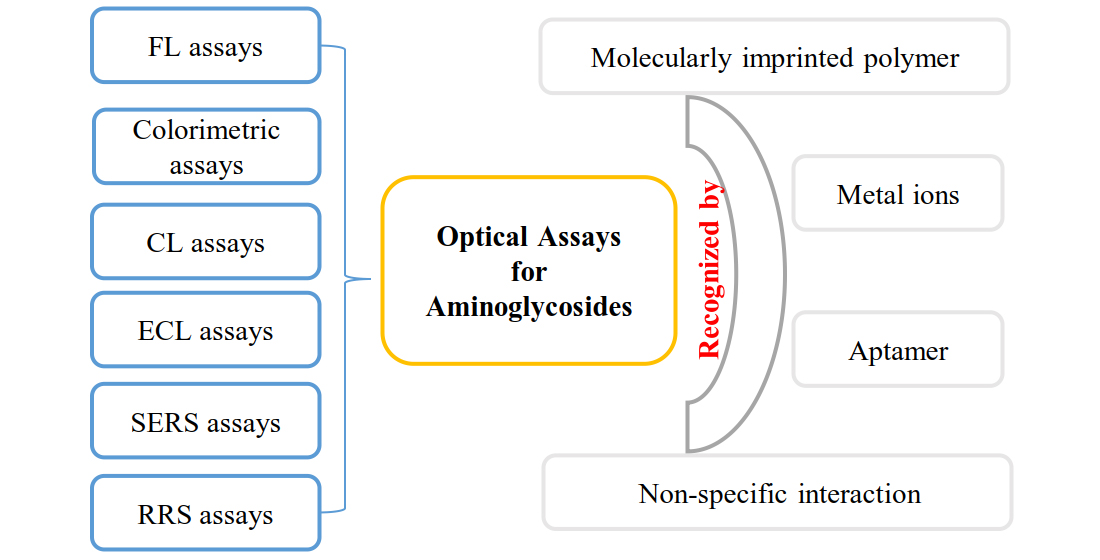
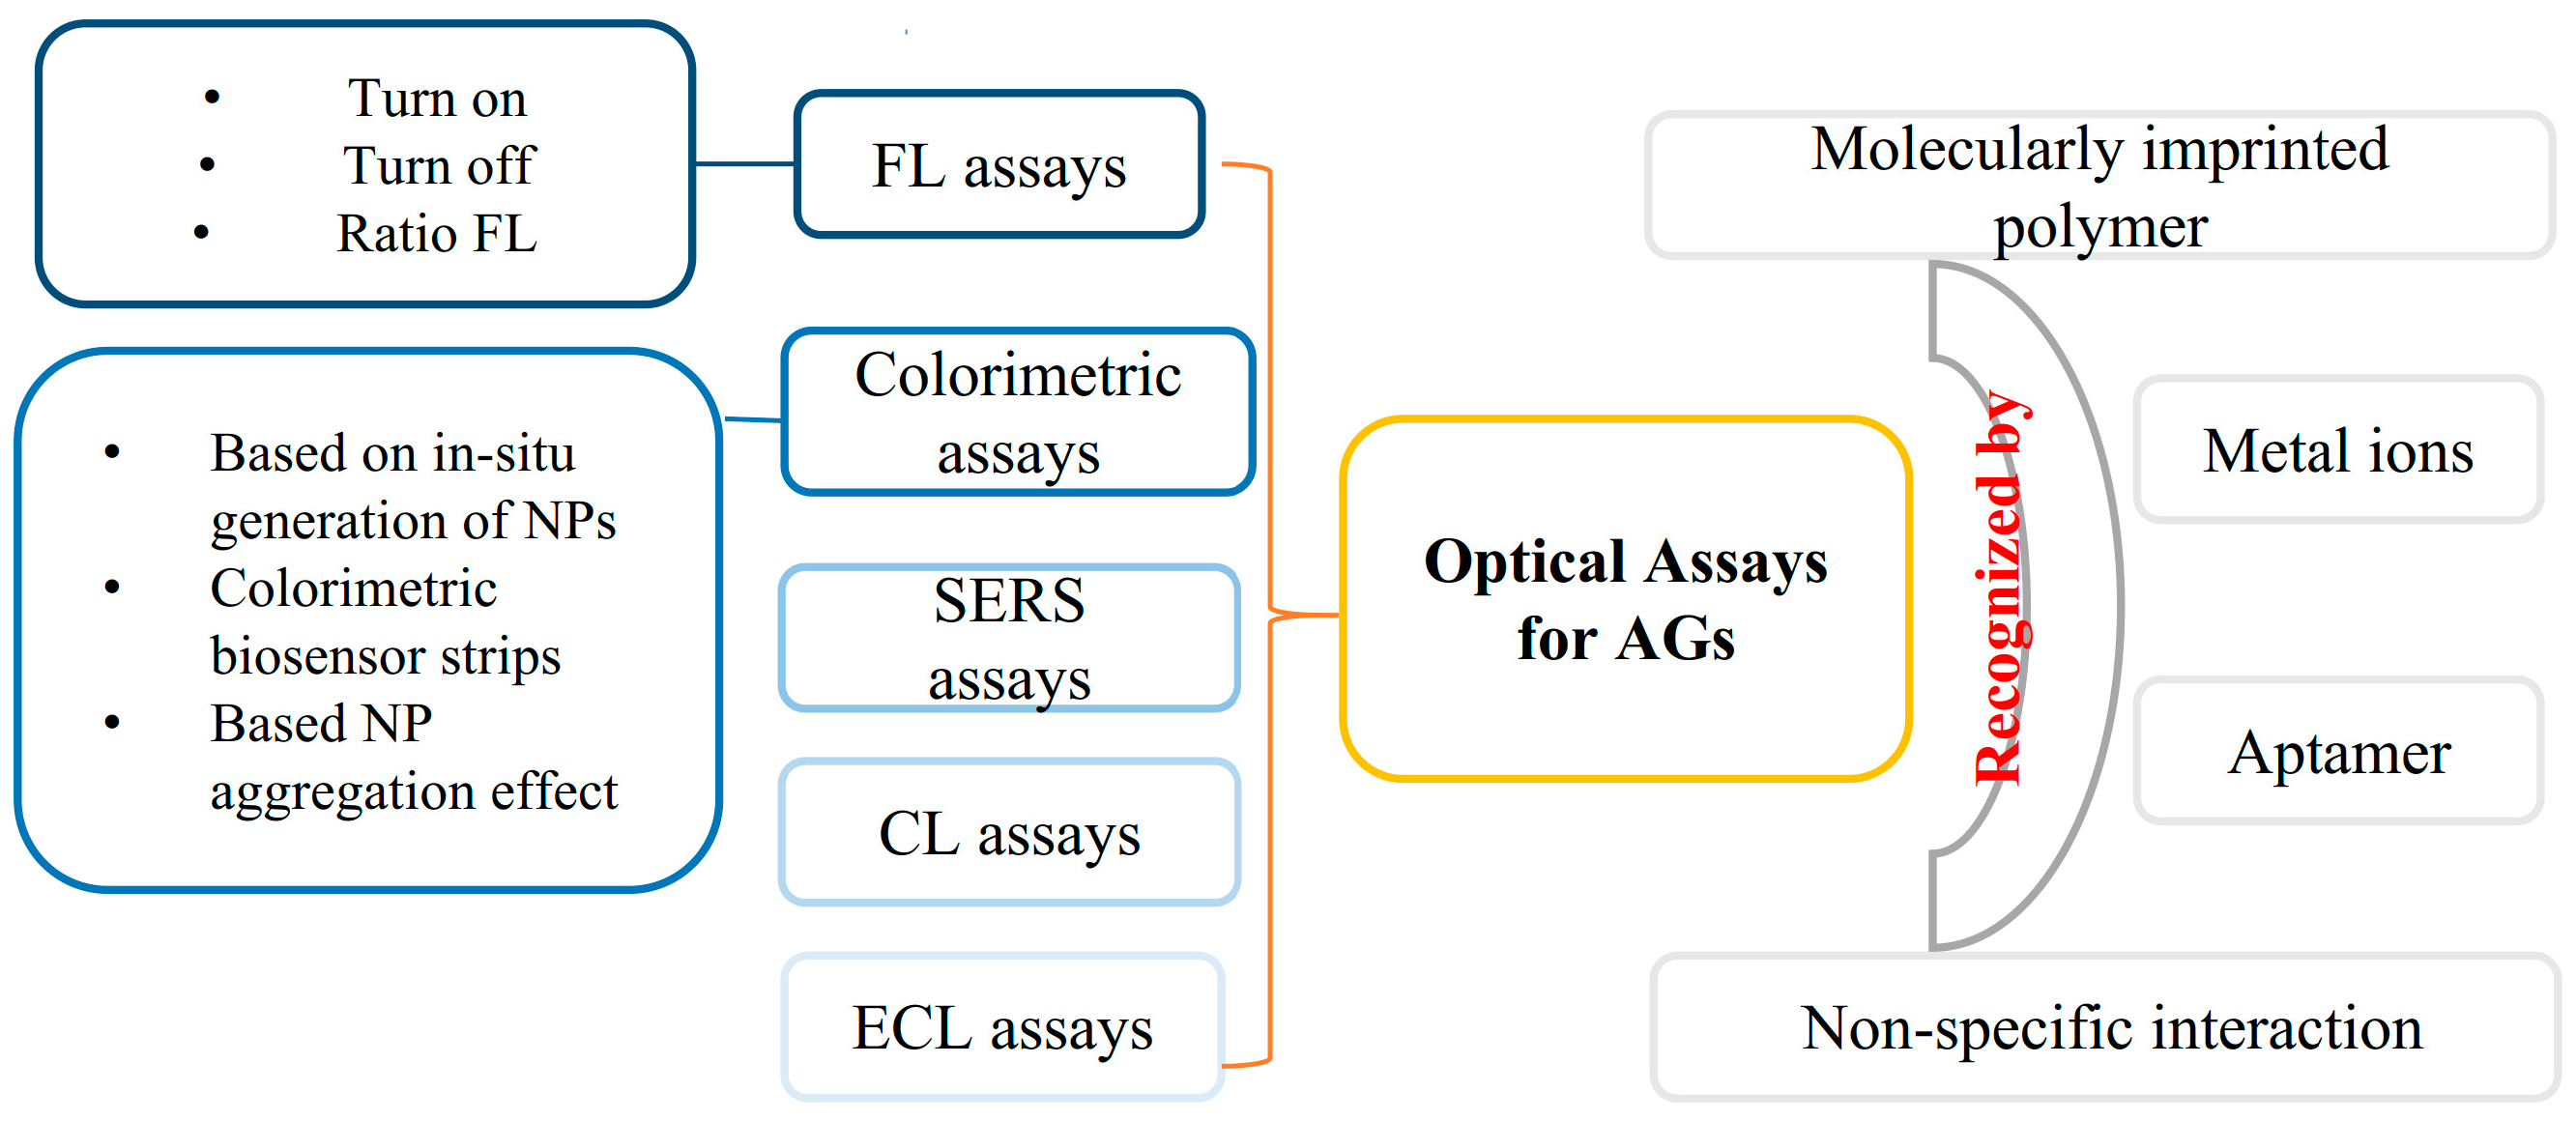
1.4. Recent Advances in Optical Detection of Aminoglycosides

In recent years, many optical assays including turn-on FL, turn-off FL, ratio FL, colorimetric and chemiluminescence (CL) assays, etc., have been established for the determination of AGs (Figure 2). Compared with other analytical methods, optical analysis methods such as FL, CL, colorimetry, etc., have the advantages of their simple instrumentation, easy operation, easily realized mobile phone imaging and visualization [9,10,11]. Some of the proposed methods can give responses to the presence of target AG within 30 min which are convenient for POCTs for AGs. These optical methods (or sensors) are established for the determination of AGs based on the recognition by antibodies, aptamers, metal ions, and imprinted polymers [12,13,14,15]. Antibodies are commonly used in the development of enzyme-linked immunosorbent assay (ELISA) kits for the detection of AGs. In recent years, the aptamer has become a powerful recognition element used in AG detection. Aptamers are single-stranded DNA or RNA selected by an in vitro systemic evolution of ligands by the exponential enrichment (SELEX) technique. Aptamers have a high affinity to their targets. Compared with antibodies, aptamers have many advantages, including a short in vitro synthesis process, good stability, easy modification, and long shelf life. In recent years, lots of aptamer-based assays have been developed for the determination of AGs. According to our literature research, about 70% of optical detection methods have employed aptamers as recognition elements for the detection of AGs.
In addition, various nanomaterials, including metal nanoparticles (NPs) [16], metal nanoclusters (NCs) [17], carbon dots (CDs) [18], quantum dots (QDs) [19], etc., have been employed to construct optical assays for AGs. Metal NPs such as Au NPs, Ag NPs, Pt NPs, etc., have a characteristic surface plasmon resonance (SPR) absorption peak located in the visible region. The SPR absorption wavelength is affected by the size, shape, and dispersed state of metal NPs. FL-emitting nanomaterials such as QDs and CDs have size-dependent FL properties. Their FL emission wavelength is affected by their size and their FL intensity may be affected by their surface state. Based on the unique property of these nanomaterials, various simple and convenient optical sensing methods have been developed for the detection of AGs. To improve detection sensitivity, several signal amplification techniques have been successfully applied to the design of sensitive methods for AGs. These amplification techniques include target recycle-assisted signal amplification, hybridization chain reaction (HCR), rolling circle amplification (RCA), etc. [20,21,22].

2. Fluorescent Assays

FL is one of the photoluminescence phenomena. Certain molecules, particularly with a chromophore and a rigid structure, can absorb ultraviolet-visible light and be brought into an excitation state. The fluorescence occurs when the excited molecules lose energy through the transition from the lowest vibration level of the first excited electronic state to the ground electronic state. Compounds containing aromatic groups, conjugated double bonds, or aliphatic and alicyclic carbonyl structures commonly have FL emission properties. This rigid structure is in favor of FL emission. FL analysis is a powerful quantitative method that can be employed to quantify strong FL molecules in non-fluorescent mediates and is employed as a detection strategy in HPLC and CE. Unfortunately, most of the aminoglycosides lack a chromophore or fluorophore. Only a few AGs were reported to have native FL or weak FL. For example, apramycin has been reported to have native fluorescence emission located at 388 nm with a maximum excitation wavelength at 335 nm [23]. To achieve the fast detection of AGs, both organic FL molecules and FL-emitting nanomaterials such as QDs, CDs, and metal NCs have been employed in the development of FL sensing methods in which antibodies, aptamers, molecular imprinting polymers (MIPs), and metal ions are employed as recognition elements. These FL methods include turn-off, turn-on, and ratio FL analysis methods. Table A1 (Appendix A) summarizes their assay performance, including the limit of detection, linear range, specificity, recovery, and detection time.

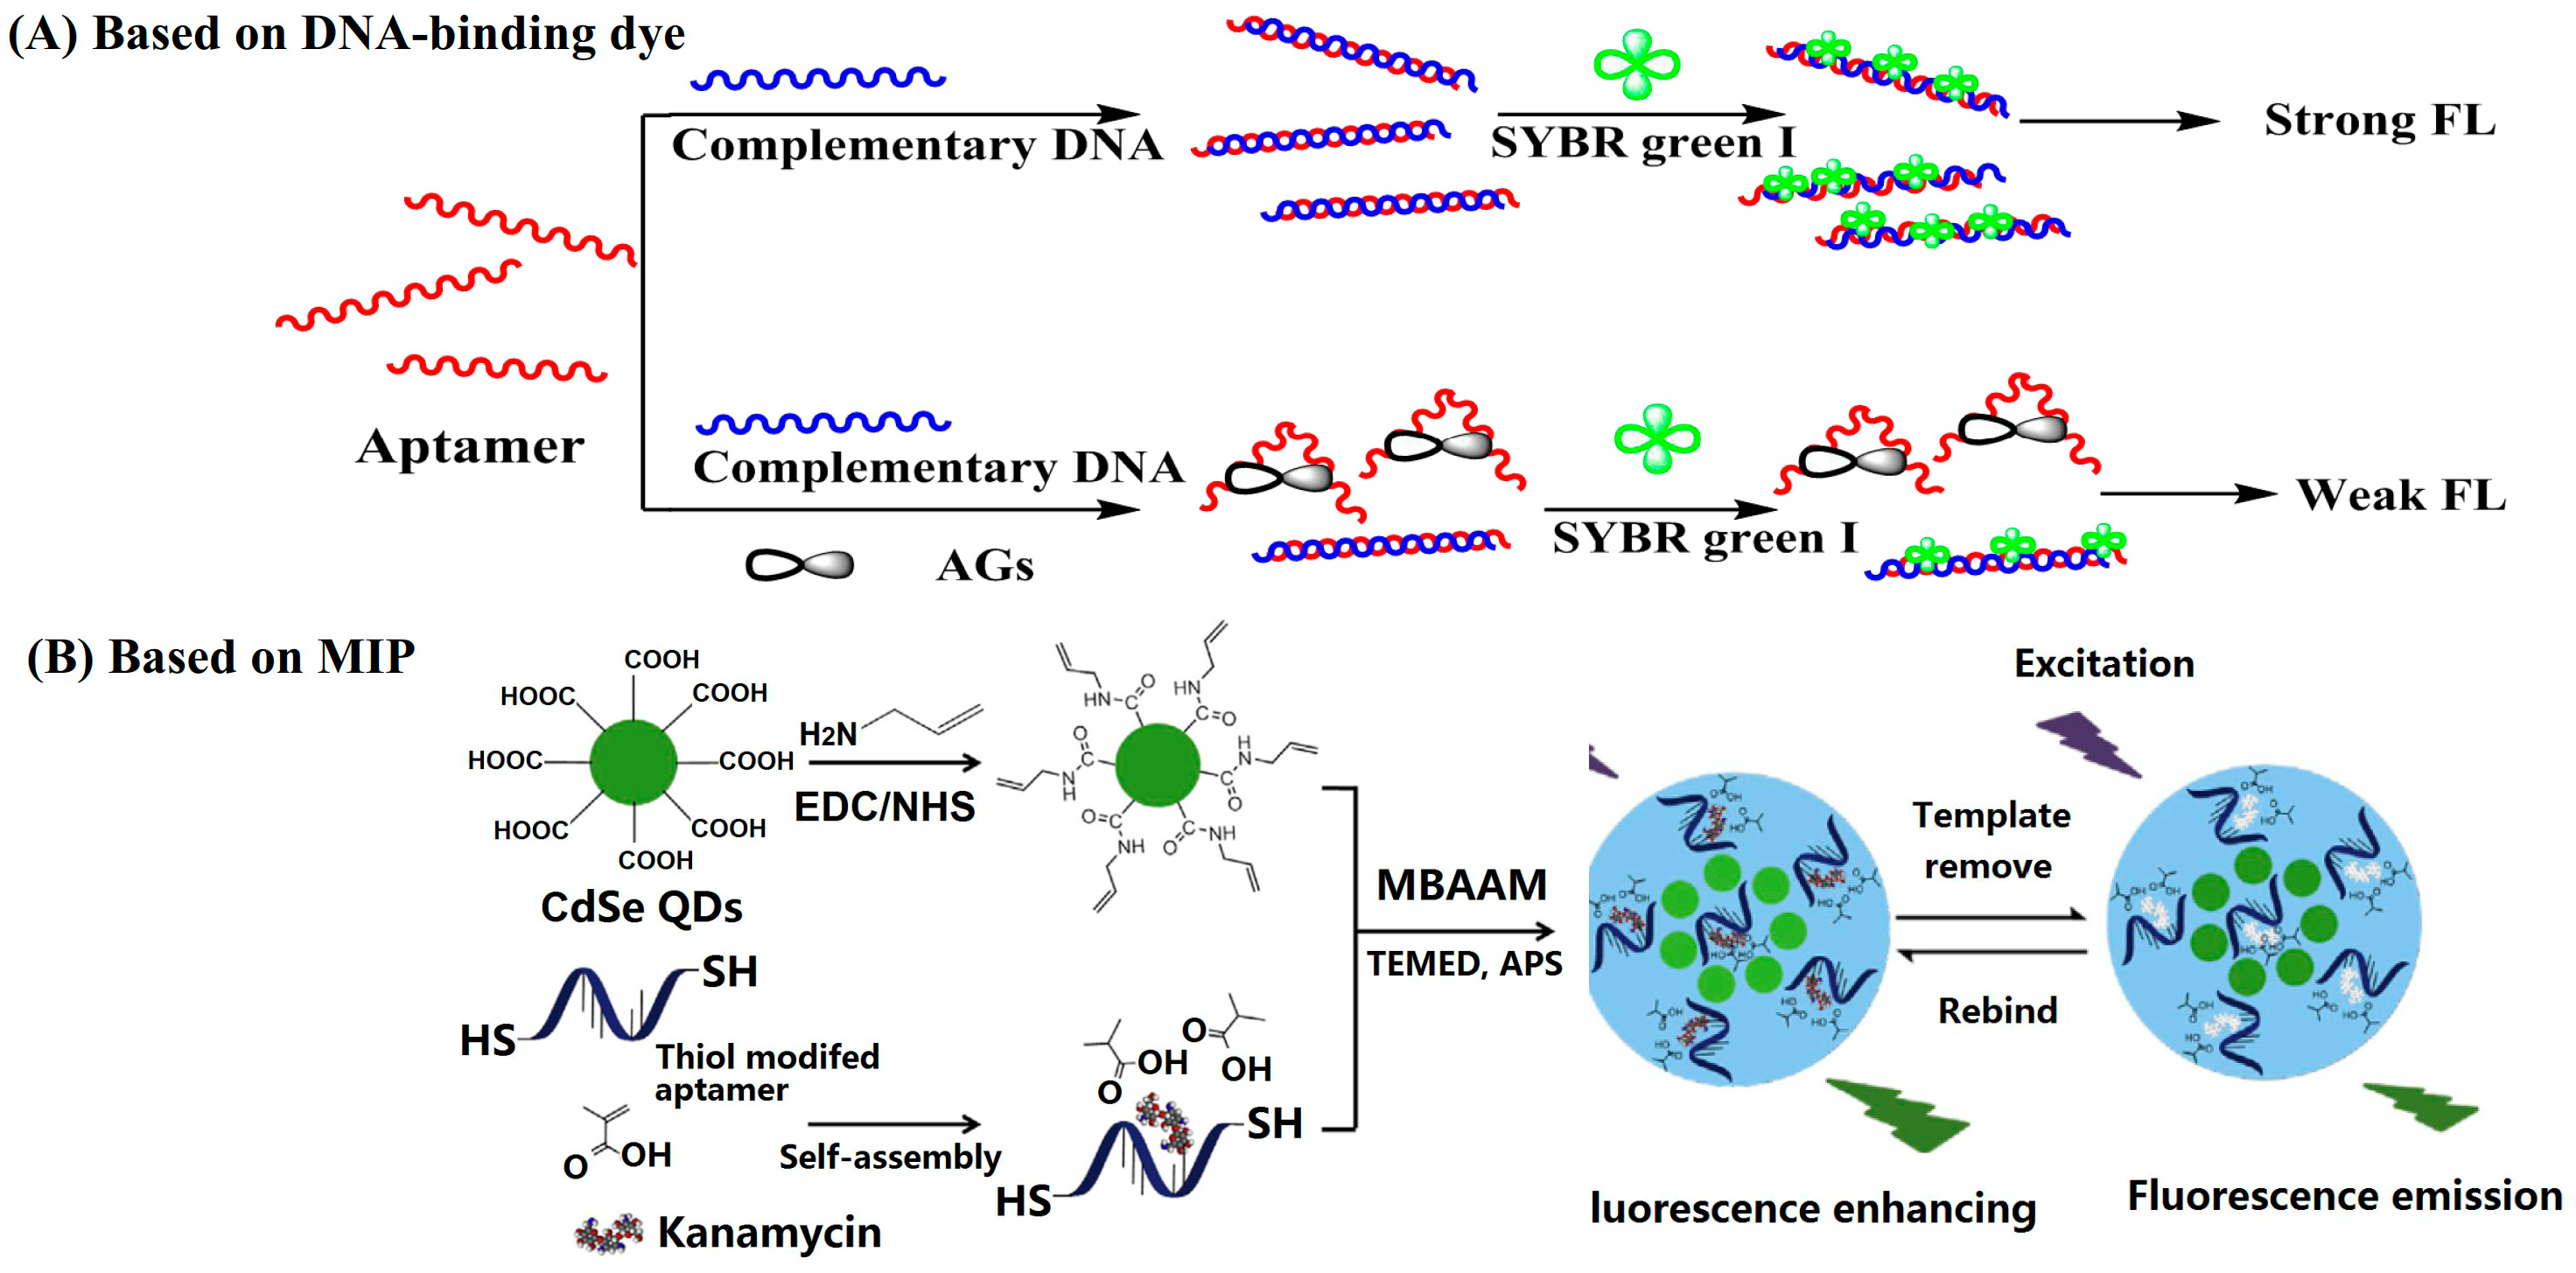
2.1. Turn-Off Fluorescent Analysis Strategies

The turn-off sensing strategy means the presence of a target analyte induces a decrease in FL intensity. The FL signals are inversely proportional to the centration of the target analyte.
DNA-binding dyes including double-strand DNA (dsDNA)-binding dyes (such as Synergy Brands, Inc. (SYBR) Green I) and G-quadruplex structure-binding dyes (such as Thioflavin T) have been employed to construct turn-off FL sensing methods for AGs [24,25,26]. It has been reported that anti-kanamycin–aptamers can form intermolecular G-quadruplex structures [27,28]. Thus, G-quadruplex structure-sensitive dyes such as Thioflavin T, crystal violet, thiazole orange, N-methyl mesoporphyrin IX, etc., have been tested to develop FL sensing methods for kanamycin. Among them, Thioflavin T has the best performance and responds to the anti-kanamycin–aptamer specifically. The binding of kanamycin to the anti-kanamycin–aptamer disturbs the G-quadruplex structure, resulting in a decreased FL signal at 492 nm. For the detection of kanamycin, it took only 20 min and the limit of detection (LOD) was 0.3 nM [25]. SYBR Green I is a dsDNA-inserting FL molecule, which emits obvious FL in the presence of dsDNA. The hybridization of an aptamer with its complementary DNA forms a double-stranded helix. The binding of target aminoglycosides to aptamers transforms the hybrid dsDNA into single-strand DNA (ssDNA), causing a decrease in the FL signal (Figure 3A). Based on this sensing scheme, Yu’s group constructed a smartphone-based aptasensor for the point-of-care testing of streptomycin. A Touch Color application installed in a smartphone was employed to read the RGB values of the images, and the G value was used to quantify the streptomycin concentrations The POCT method was used to detect streptomycin in milk and the detection limit was 94 nM [26].
Almost all of the MIP-based sensing methods are turn-off mode FL sensors. MIPs are polymers processed using molecularly imprinted techniques that leave cavities in the polymer matrix and have an affinity for the template molecules. For the FL sensing of AGs, FL-emitting nanomaterials such as QDs [29,30,31] and FL-emitting metal-organic framework (MOF) NPs [32] have been employed as supports to construct MIPs. Typically, He and Du’s group fabricated a MIP-coated europium metal-organic framework by using 4-vinylpyridine as the main monomer, ethylene glycol dimethacrylate as the cross-linking monomer, and lincomycin as the template. The europium metal-organic framework has a long, persistent FL and the MIP layer provides specific binding sites for lincomycin. The adsorption of lincomycin into the cavities leads to a decrease in the FL intensity of the europium metal-organic framework. The LOD for lincomycin was calculated to be 16.2 nM [32]. In addition, dual recognition MIPs have been constructed for highly specific sensing of AGs [29,30]. For example, a dual-recognition MIP was constructed for the highly specific sensing of kanamycin by using CdSe QDs as supports, methacrylic acid, and thiol-modified aptamers as functional monomers. Through a thiol-ene click reaction, the aptamer was fixed into the polymer matrix. The prepared MIP had dual recognition functions from both aptamer and imprinted cavities, which improved the recognition ability of MIP toward kanamycin. The imprinting factor of the prepared MIPs was 3.51 for kanamycin. CdSe QDs have strong FL emissions around 530 nm; the binding of kanamycin to the MIP caused a decrease in the FL signal (Figure 3B). The MIP-based FL sensing platform showed a linear range from 85.7 nM to 17.16 µM for the detection of kanamycin, and the LOD was 1.1 nM [29].
In addition to these sensing methods, Topcu’s group established a whole-cell-based bioassay for the detection of antibiotics based on the inhibitory effect of antibiotics on the growth of sensitive bacteria. They employed green fluorescent protein (GFP)-expressing Escherichia coli cells as the recognition agent. The incubation of antibiotics with the GFP-expressing Escherichia coli caused the inhibition of viable cells and a subsequent decrease in fluorescent intensity. The whole-cell based FL assay was successfully applied to the detection of ampicillin, benzylpenicillin, gentamicin, neomycin, and tetracycline, respectively; however, it failed for the determination of bacitracin A, lincomycin, spiramycin, and sulfadiazine, probably due to the permeability barriers of the bacterial membrane. The proposed FL method could detect antibiotics in milk and appeared promising for use in milk quality monitoring [33].

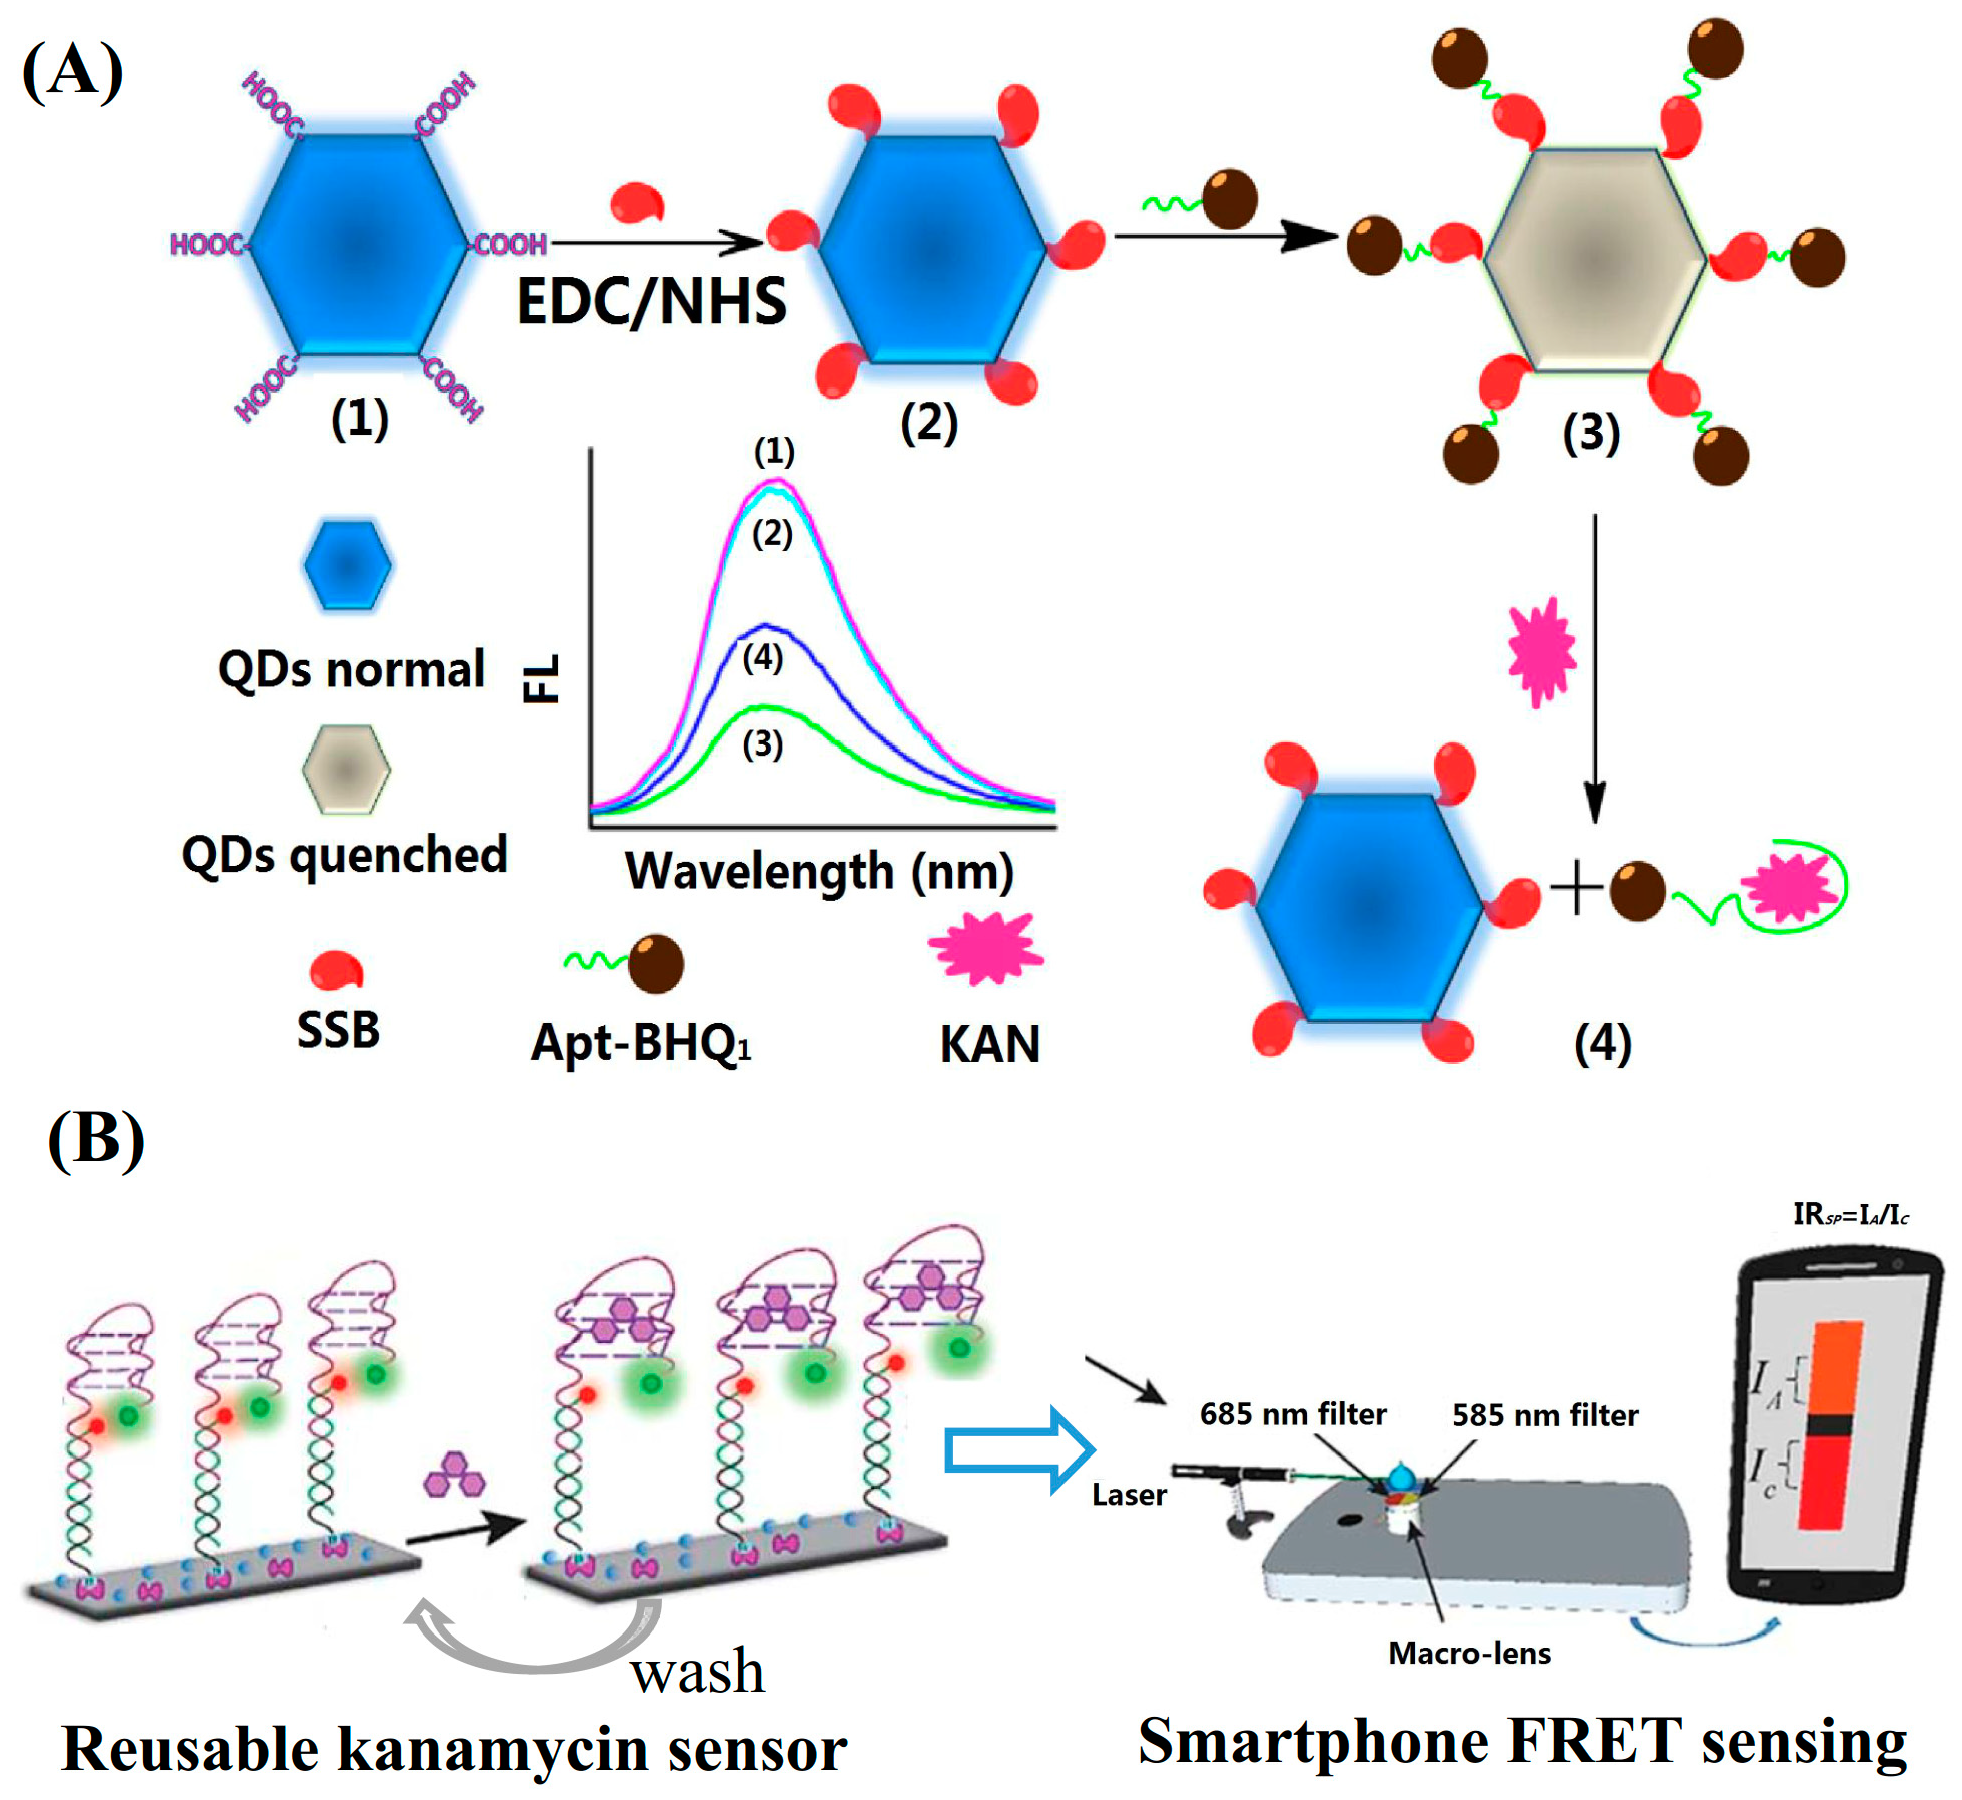
2.2. Turn-On Fluorescent Analysis Strategies

The turn-on FL analysis strategy means the FL signal is enhanced in the presence of a target analyte. The FL signals are proportional to the concentration of the target analyte. Compared with turn-off FL analysis methods, the turn-on FL methods have a lower background.
Mesoporous silica NPs loaded with organic dye were prepared and applied to the turn-on FL sensing of kanamycin. The NH2-modified complementary DNA was conjugated on the surface of Rhodamine B, filling mesoporous silica nanoparticles. The hybridization of the kanamycin aptamer with the complementary DNA increased the steric hindrance and inhibited the release of Rhodamine B from the mesoporous silica nanoparticles. The binding of kanamycin to the aptamer dissociated the aptamer from the complementary DNA and triggered the release of Rhodamine B to the solution, causing the increase in FL intensity. The LOD for kanamycin was 7.5 nM [34]. In addition, the kanamycin–aptamer was employed as a template for the preparation of Ag NCs, which had weak FL intensity initially. In the presence of kanamycin, the Ag NCs exhibited an enhanced FL intensity due to the formation of a hairpin structure and following the closeness of G and C bases contained in the aptamer template to the silver nanoclusters. The enhanced FL ratio was employed for the detection of kanamycin, which showed a linear range of 0.075–8.0 µM with a LOD of 36 nM [35]. Despite the fact that these are strategies for turn-on FL sensing, the background of these methods is also very high because of the native FL emission of dye-loaded silica NPs and Ag NCs.
Fluorescence resonance energy transfer (FRET) has been employed to establish an FL sensing platform for AGs. In a FRET process, the energy of the donor molecules is transferred to the acceptor molecules. When FRET occurs, the FL intensity of acceptor molecules enhances, and at the same time, the FL intensity of the donor molecules decreases. The distance and the spectral overlap between the donor and the acceptor are two main factors affecting the FRET efficiency. Dabcyl and Black Hole Quencher (BHQ) are the most commonly used quenchers. The approach of quencher to fluorophore can cause the FRET between the fluorophore and the quencher, resulting in significant FL quenching. Zhang and Sun’s group designed a simple FL biosensor for kanamycin based on the signal transduction principle of FRET between the fluorophore carboxyfluorescein (FAM) and quencher Dabcyl. The kanamycin-aptamer was labeled with FAM and its complementary DNA was labeled with Dabcyl. The hybridization of complementary DNA with the aptamer brought the proximity of FAM and Dabcyl, leading to FL quenching, while the binding of kanamycin to the aptamer dissociated the complementary DNA from the aptamer, causing the departure of FAM from Dabcyl and subsequent FL recovery. They found that the complementary DNA, with a length of seven bases, showed the best performance in the sensing of kanamycin. The FRET-based sensing method showed a linear range from 100 nM to 600 nM for kanamycin in milk samples, and the LOD was 13.52 nM [36].
Nanomaterials such as Au NCs, Ag NCs, CDs, QDs, etc., have unique FL properties. These nanomaterials emit intense FL. Compared with traditional FL molecules, these nanomaterials have advantages such as size-dependent FL, good photostability, long FL lifetime, etc. FL-emitting nanomaterials have been employed in FRET assays to replace organic FL molecules. For example, Fan’s group synthesized graphene oxide quantum dots (GQDs) with a bottom-up method using citrate as the starting material. The GQDs with carboxyl groups on the surface were conjugated with single-stranded DNA-binding protein (SSB) through an EDC/NHS reaction. An FL sensing platform composed of SSB-modified GQDs and BHQ-labelled aptamers was constructed (Figure 4A). The binding of the BHQ-aptamer to the SSB-modified GQDs enabled the proximity of the quencher BHQ to the FL-emitter GQDs causing the FL quenching. The binding of kanamycin to the aptamer changed the aptamer structure into a folding state. Thus, the addition of kanamycin caused the aptamer to lose its binding ability to the SSB and led to the subsequent FL recovery. The GQDs-based FL sensing platform showed a linear range of 0.017–154.4 nM for the detection of kanamycin and a LOD of 0.01 nM [37]. Aucélio’s group prepared FL GQDs by using citrate and glutathione as the starting materials. Fe3+ showed a significant FL quenching effect on the GQDs due to the formation of a charge transfer complex with the GQDs. The coordination of Fe3+ with GQDs could be disrupted by neomycin, causing the turn-on of the FL intensity around 430 nm. Thus, the GQD-Fe3+ probe was employed as an FL probe for the sensing of neomycin sulfate. The linearized analytical response covered three orders of magnitude from 10−7 to 10−5 M and the LOD was 74 nM [38].
Furthermore, nanomaterials can act as energy acceptors to construct FRET assays. These nanomaterials include Au NPs, Ag NPs, graphene oxide (GO), carbon nanotubes (CNTs), MoS2 nanosheet, etc. [40,41,42]. Au NP was employed in the establishment of a FRET-based assay for the detection of kanamycin by using Ag NCs and aptamers as the fluorophore and recognition elements, respectively. The well-dispersed Au NPs could quench the FL of Ag NCs efficiently, while the aggregated Au NPs had a weak quenching ability. The adsorption of aptamers on the surface of Au NPs protected the Au NPs from aggregation in a high-concentration of salt solution, leading to an efficient FRET between Au NPs and Ag NCs. The formation of the aptamer–kanamycin complex resulted in the aggregation of Au NPs in the salt solution and subsequent FL recovery. The fluorescence increased linearly with the increase in kanamycin in the 5–50 nM concentration range. The LOD was 1.0 nM [17].

2.3. Ratio Fluorescent Analysis Strategies

The ratio FL analytical method refers to the quantification of the analyte, achieved by determining the relationship between the concentrations of target analyte with the ratio of FL intensities at different wavelengths. Compared with single-wavelength analytical methods, the ratio FL methods have an inherent interior correction, thus showing better reproducibility and reliability. FRET is one of the ways to create a ratio FL analytical platform. For example, Su’s group established a ratio fluorescence method for the detection of bleomycin based on nitrogen-doped graphene quantum dots conjugated with gold nanoclusters (N-GQDs@Au NCs). The N-GQDs@Au NCs conjugate had fluorescent emission peaks located at 440 nm and 580 nm, respectively. Cu2+ quenched the FL of Au NCs at 580 nm, which was attributed to the aggregation-induced quenching mechanism. Bleomycin has a strong binding ability to Cu2+ and thus can make the quenched FL signal recover. The ratio of the FL intensity at 440 nm and 580 was employed for the quantitative detection of bleomycin. Compared with single-wavelength FL measurements, ratio fluorescence methods can provide built-in correction, thus having a stable fluorescence performance and strong anti-interference ability. The ratio fluorescence method showed a linear range for the detection of bleomycin in the range of 0.8–1800 nM and the LOD was 0.27 nM [43]. The Cy3 and Cy5 pair was employed to construct a FRET-based assay for the detection of AGs. Typically, Roy’s group employed Cy3 and Cy5 as a FRET donor and acceptor for the detection of kanamycin (Figure 4B). They used a sandwich-type hybridization reaction to assemble the kanamycin-aptamer on the glass slide surface and constructed a FRET sensing system by labeling the connector probe and kanamycin-aptamer with Cy5 and Cy3, respectively. In the absence of kanamycin, a high FRET efficiency between Cy3 and Cy5 was obtained, while the binding of kanamycin to the aptamer led to a low FRET efficiency. A homemade smartphone setup was used to obtain the ratio FL signal and showed a LOD of 28 nM for kanamycin [39].

2.4. Discussion

Although quantitative analysis can be achieved by using all of the established FL analysis strategies, each method has its advantages and disadvantages. DNA-binding dyes and MIPs are commonly employed for the development of turn-off FL sensing strategies. Both of them give responses to the presence of target AG rapidly and specifically. However, both methods suffer from a high background, which leads to relatively poor sensitivity. Compared with turn-off FL sensing methods, turn-on FL strategies showed a lower background and higher detection sensitivity. The graphene-based FRET aptasensor exhibited the highest sensitivity for the detection of kanamycin (1 pM) [44]. The high sensitivity may be attributed to the efficient quench ability of graphene, which leads to a low background, and a good binding ability of kanamycin to the aptamer. In terms of ratio FL analysis methods, compared with the turn-off FL sensing method, the ratio FL analysis methods exhibit moderate sensitivity, but better reliability because of the in-built correction. However, ratio FL analysis methods commonly need two kinds of FL molecules/nanomaterials, leading to a high experiment cost.

3. Colorimetric Assays

Colorimetric assays include visual colorimetry and photoelectric colorimetry. Both methods are based on the Lambert-Beer law (A = εbc). In terms of visual colorimetry, the color of the detection system changes with the concentration of the target analyte. Qualitative or semi-quantitative detection can be achieved by using naked-eye visual colorimetry. With the development of modern smartphones, the RGB color can be acquired and read by a smartphone. In addition, quantitative detection and higher sensitivity can be realized by photoelectric colorimetry. Colorimetric assays have the advantages of simple operation and instrumentation, and make it easy to realize on-site detection. Table A2 (Appendix A) summarizes the typical colorimetric assays developed for the detection of AGs.

3.1. Colorimetric Reactions Used in AG Detection

Peroxidase-catalyzed chromogenic reactions are commonly used in immunoassays of AGs. Tetramethyl benzidine (TMB), 2,2’-azinobis-(3-ethylbenzthiazoline-6-sulphonate) (ABTS), and o-phenylenediamine (OPD) are chromogenic substrates of peroxidases. The peroxidase-catalyzed redox reaction between these substrates and H2O2 leads to the production of colored products. After adding sulfuric acid to terminate the reaction, the color of TMB, ABTS, and OPD reactions are yellow, green, and orange, with maximum absorption wavelengths at 450, 405, and 492 nm, respectively. Horseradish peroxidase (HRP) is one of the most commonly used peroxidases and is commonly used as a label in competitive ELISAs for the detection of AGs [45]. In addition to HRP, DNAzyme with a G-quadruplex structure and nanoparticles such as Au NPs, Ag NPs, Fe3O4 NPs, Au NCs, etc., has been reported to have peroxidase-like activity [46]. These mimetic peroxidases have been employed for the development of colorimetric assays for AGs [47]. Typically, DNAzyme-catalyzed colorimetric reactions have been coupled with amplification methods to improve the detection sensitivity, which will be discussed in the section Amplification Strategies.
Phenanthroline (Phen) and its derivatives, with bidentate heterocyclic ligands, form metal complexes with stable transition metal ions in lower oxidation states, such as Ru(II), Cu(I), Co(II), and Fe (II). The Fe(II)-Phen complex shows an orange-red color in a pH 7.4 solution. The oxidation of Fe (II) to Fe (III) changes the color of the Fe(II)-Phen complex from orange-red to light yellow. The Fe(II)-Phen reaction can be coupled with a glucose oxidase–glucose reaction, in which glucose reacts with glucose oxidase to produce H2O2. The produced H2O2 oxidizes Fe (II) to Fe (III), leading to the color change of the complex ion [Fe(phen)3]2+ from orange-red to light yellow in pH 7.4 solution [48]. The application of the Fe(II)-Phen reaction will be discussed in the section Amplification Strategies.
Noble metal NPs, including Au NPs, Ag NPs, Pt NPs, etc., possess unique optical properties. For example, spherical Au NPs with a size of 15 nm has a wine-red color, and the characteristic SPR absorption band is located around 520 nm. The larger the Au NPs’ size, the longer the SPR absorption wavelength is. Au NPs have the property of distance-dependent color change. The color of Au NPs changes from red to blue since Au NPs approach each other at a distance shorter than a diameter of one nanoparticle. In other words, the well-dispersed Au NPs have a red color, while the aggregated Au NPs have a blue color [49]. Based on the aggregation-induced color change of Au NPs, various colorimetric assays of aminoglycosides have been developed. The following section discusses colorimetric strategies based on metal NPs.

3.2. Based on In Situ Generation of Nanoparticles

Au NPs have a red color; thus, the in situ generation of Au NPs was employed for the detection of aminoglycosides. Leng’s group established a colorimetric biotics identification method by taking advantage of microwave-assisted synthesis of multicolored gold nanoparticles. They found that different antibiotics resulted in the formation of Au NPs with different sizes and different colors. Thus, the RGB colors of the formed Au NPs were extracted and used to identify biotics with the aid of hierarchical clustering analysis (HCA) and principal component analysis (PCA) methods [13]. In addition, they also reported a colorimetric detection method for lincomycin based on the reaction between AuCl4 and lincomycin under a basic condition. Instead of the formation of Au NPs, the color change during the reaction was attributed to the formation of coordinates between AuO2 and the sulfur group of lincomycin [50].

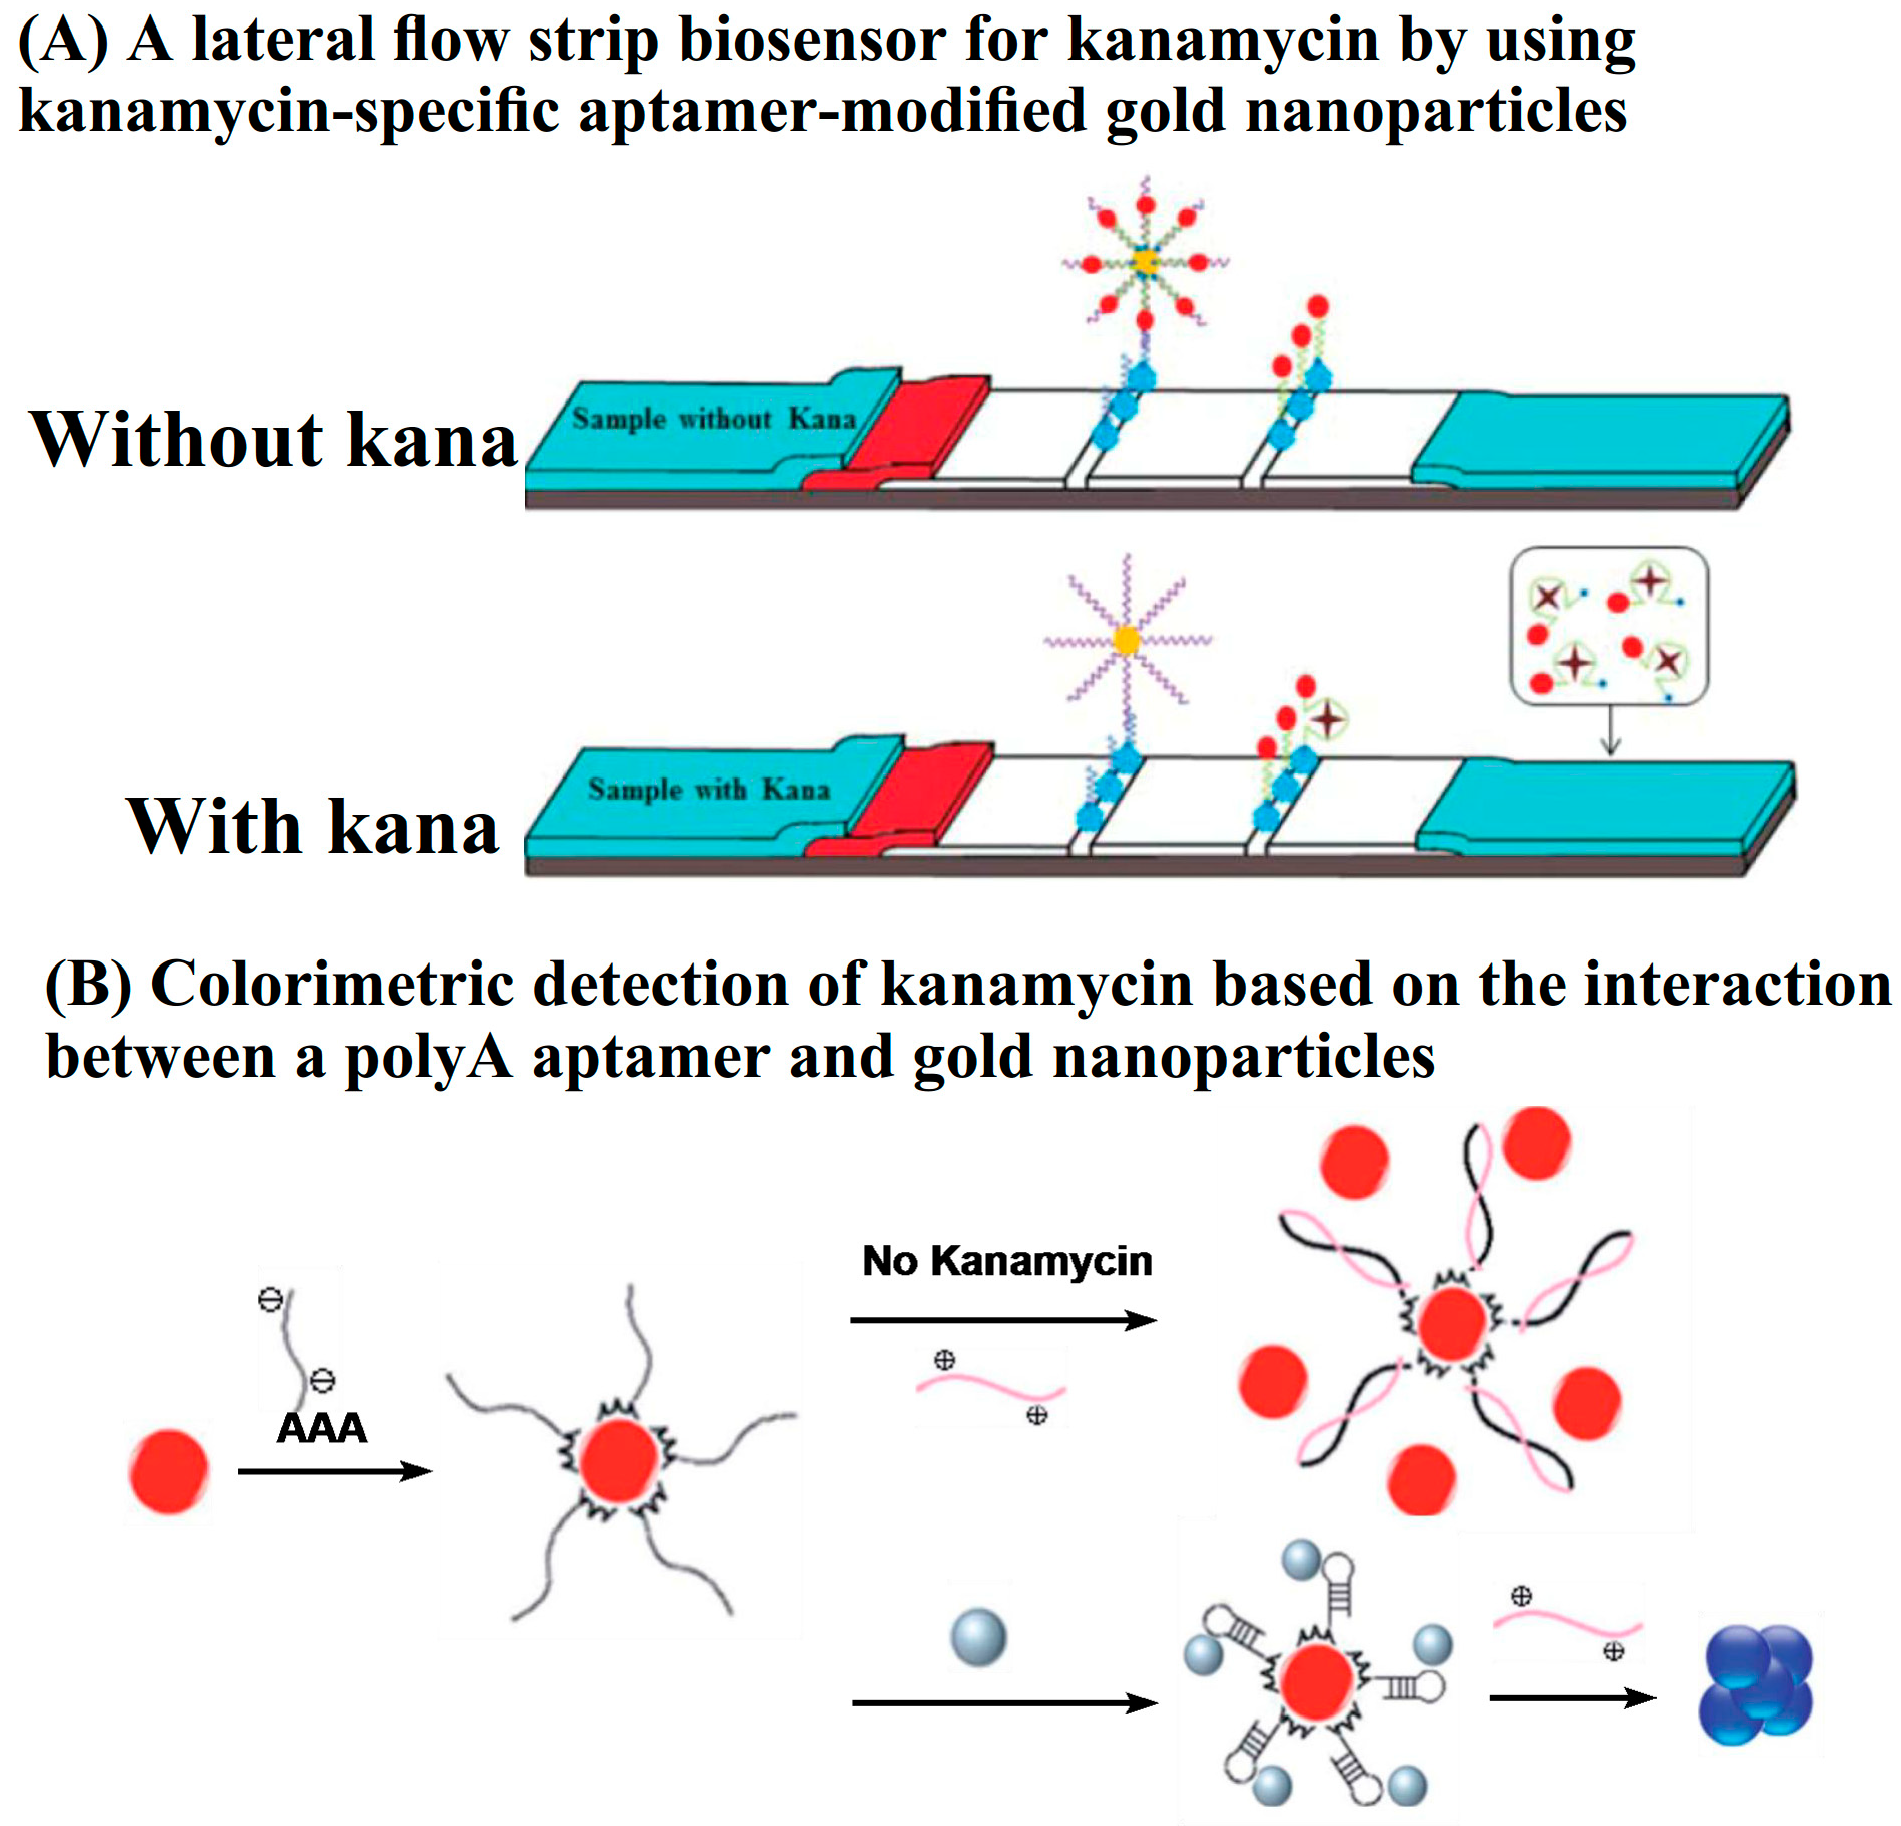
3.3. Colorimetric Biosensor Strips

Lateral flow assays (LFA) are one of the rapid detection technologies and are based on immunochromatography. A typical LFA strip contains four parts, including a sample pad, conjugate pad, detection pad, and adsorbent pad. Au NPs are the most commonly used labels in LFA. Antibodies, as the recognition elements, are immobilized on the surface of Au NPs. The immuno-nanoparticles are prestored in the conjugate pad. Both the test line and the control line are located in the detection pad. For the detection of AGs, a competitive immunoassay is commonly employed. LFA strips for the rapid detection of AGs are commercially available. In recent years, aptamers have been employed in LFA, owing to their short synthesis procedure, easy modification, and good stability. The aptamers are conjugated on the surface of Au NPs, and the complementary strands are immobilized on the test line. In the absence of target AG, the hybridization of aptamers with complementary sequences leads to the accumulation of Au NPs on the test line. In contrast, the presence of AG results in competitive binding, which inhibits the accumulation of Au NPs in the test zone. To achieve higher sensitivity, Zhou’s group employed Ag NPs as signal amplification elements to carry Au NPs (Figure 5A). With the aid of a scanning reader, quantitative detection of kanamycin can be achieved based on the optical density (expressed as peak area) of the test zone. The LOD was 0.0778 nM in buffer solution, while the visual detection limits in food were higher at 50 nM, 100 nM, and 200 nM in honey, milk, and milk powder samples, respectively. The lateral flow strips avoid multiple incubation and washing steps. The detection can be completed within 10 min [51]. In addition to LFAs, Li and Wang’s group prepared a portable colorimetric biosensor strip for the determination of kanamycin by combining aptamer-immobilized electrospun nanofiber membranes with complementary single-stranded DNA-conjugated Au NPs. The competitive binding of kanamycin with the aptamer led to the dissociation of Au NPs and a decrease in the absorbance signal at 510 nm. The proposed colorimetric biosensor strips showed a low detection limit of 2.5 nM [52].

3.4. Based on Target-Induced Aggregation of Metal Nanoparticles

Metal NPs have specific colors. For example, well-dispersed spherical Au NPs (15 nm) have a wine-red color and a characteristic absorption band located around 520 nm. In terms of Ag NPs, the color is light yellow and the characteristic absorption band is around 420 nm. The aggregation of metal NPs leads to a hypochromic shift in the maximum absorption band. Based on the color change of metal NPs, various colorimetric sensors have been developed.
Citrate-capped metal NPs carry a negative charge, while the aminoglycosides have a positive charge under certain conditions. Thus, colorimetric methods for the determination of kanamycin were developed based on the electrostatic interaction between the negatively charged metal NPs and cationic AGs. For example, gentamicin could induce the aggregation of citrate-capped Ag NPs directly. The absorption ratio of 510 nm and 394 nm was employed for the quantitative detection of gentamicin with a LOD of 720 nM [54]. This direct method is simple; however, it suffers from low sensitivity and poor specificity.
In order to improve the specificity, kanamycin–aptamer has been employed. The aptamer, as single-strand DNA, can be adsorbed on the surface of Au NPs and prevent the slat-induced aggregation of Au NPs. The binding of antibiotics to the aptamer causes the dissociation of the aptamer from the Au NPs surface and subsequent aggregation in the salt solution. Thus, the addition of target antibiotics leads to the color of Au NPs changing from red to bluish violet. The employment of aptamers not only improves the detection specificity but also improves the detection sensitivity. The aptamer-based colorimetric sensing strategy has been developed for the detection of kanamycin, tobramycin, and neomycin with LODs of 8.1 nM, 23.1 nM, and 27 nM, respectively, in which the ratio A620/A520 was employed as the parameter for quantitative detection [55,56,57]. In order to improve the performance of the Au NP-based colorimetric aptasensor for the detection of antibiotics, Shayesteh’s group employed a polyA-tailed aptamer and poly(diallyl dimethyl ammonium chloride) (PDDA) to replace the original aptamer and salt, respectively, and constructed a colorimetric assay for the detection of kanamycin (Figure 5B). The polyA at the end of the aptamer as an anchor improved the affinity of the aptamer to the Au NPs surface and prevented the Au NPs from the PDDA-induced aggregation. The binding of kanamycin to the aptamer liberated the polyA-tailed aptamer from the Au NPs surface, causing the aggregation of Au NPs by the PDDA. The colorimetric assay based on PDDA-induced aggregation lowered the LOD to 0.05 nM [53].
AGs have hydroxyl groups and aliphatic amine groups in their structure. Cysteamine-modified Au NPs were employed instead of citrate-capped Au NPs for the development of the colorimetric determination of gentamicin based on the strong affinity of gentamicin to cysteamine through the hydrogen bonding interactions. As a result, gentamicin could directly cause the aggregation of cysteamine-modified Au NPs. The cysteamine-modified Au NPs showed a capability for the detection of gentamicin concentrations as low as 12.45 nM in water [58]. In recent years, various Ag NPs with different capping agents on the surface have been synthesized and employed for the determination of aminoglycosides. Typically, Mandal’s group developed a pH-triggered green synthesis method for the preparation of Ag NPs by using epigallocatechin gallate (EGCG) as both a reducing agent and a capping agent. The EGCG was oxidized by Ag+ and formed quinone moieties on the surface of Ag NPs. The amine group of kanamycin could react with the quinone moieties on the surface of Ag NPs, forming a Schiff base, which caused the aggregation of the Ag NPs and a color change from yellow to reddish pink, accompanying the decrease in the intensity of the SPR band at 415 nm. The LOD for kanamycin was 0.96 µM [59]. Other metal NPs include gallic acid-coated Ag NPs, methyl gallate conjugated Ag NPs, sodium dodecyl sulfate (SDS)-coated Ag NPs, and chlortetracycline-functionalized Ag NPs, chitosan-coated Au NPs, etc. These Ag NPs have been applied to the colorimetric detection of streptomycin [60,61], gentamicin [62], tobramycin [63], and kanamycin [64,65,66].

3.5. Discussion

Colorimetric assays have many advantages such as their low cost, rapidity, and the fact that there is no need for special equipment. In some situations, naked-eye observation can achieve semi-quantitative detection. So, the colorimetric assays are powerful tools for POCTs for AGs. Gallic acid-functionalized Ag NPs and chlortetracycline-functionalized Ag NPs exhibited good sensitivity for the detection of kanamycin (0.12 nM) and streptomycin (0.036 nM). However, other colorimetric assays suffer from poor sensitivity. In addition, a non-specific interaction between the target AG and recognition element immobilized on the surface of metal NPs was employed for the recognition of AGs. A non-specific interaction may induce poor selectivity in the proposed method because there are a large number of interferents contained in the real samples, which may also have non-specific interactions such as hydrogen bond interactions and electrostatic interactions with recognition molecules on the surface of metal NPs. To remove these interferents, sample pretreatment is needed.

4. Other Optical Assays

4.1. Chemiluminescence Assays

Chemiluminescence (CL) is a phenomenon of light radiation accompanied by chemical reactions. The CL analysis method is a widely applied trace analytical method with advantages such as its high sensitivity, wide linear range, simple equipment, and easy operation [67]. The CL of luminol was reported by Albrecht in 1928. Streptomycin was reported having an enhancement effect on the luminol-potassium periodate-Mn2+ CL reaction [68]. Luminol-H2O2 is one of the most investigated CL reactions. Without a catalyst, the CL emission of the luminol-H2O2 reaction is weak. Au NCs have been reported to have catalytic activity in the luminol-H2O2 CL reaction to produce enhanced CL signals [69]. Li’s group employed polyA-containing probe DNA as the template to synthesize Au NCs, which could catalyze the luminol-H2O2 CL reaction to emit light. The kanamycin-aptamer was immobilized on the surface of magnetic beads and then hybridized with the probe DNA-templated Au NCs. The hybridized composites were used for the CL detection of kanamycin. The binding to kanamycin to the aptamer immobilized on the magnetic beads surface resulted in the release of Au NCs in the solution phase. After an external magnetic separation, the released Au NPs contained in the supernatant triggered the luminol-H2O2 to emit light. The CL intensity was employed to quantify the concentration of kanamycin. The label-free CL assay showed a LOD of 0.035 nM for the detection of kanamycin [70]. The G-quadruplex DNAzyme with peroxidase-like properties can also catalyze the luminol-H2O2 CL reaction. In Luo and Wang’s work, beta-cyclodextrins and ionic liquid-functionalized graphene oxide aerogel (beta-CD/IL@GOGA) were employed as three-dimensional supports to assemble aptamers and DNAzyme. The graphene oxide aerogel provided a large surface area. Beta-CD and ionic liquids increased the biocompatibility and stability of the composite. The binding of streptomycin to the aptamer triggered the release of DNAzyme, which catalyzes the luminol-H2O2 CL reaction to emit light. The CL sensor showed a linear range of 1.4 × 10⁻¹² to 2.8 × 10⁻⁹ M and a detection limit of 9.2 × 10⁻¹⁴ M. The CL assay was successfully used for streptomycin detection in cucumber and milk samples [71].

4.2. Electrochemiluminescence

Electrogenerated chemiluminescence (ECL) analysis is a trace analytical technology combining electrochemical technology with chemiluminescence technology. Luminol is one of the ECL substrates and H2O2 can act as a co-reactant in the luminol ECL reaction [72]. Platinum electrodes adsorbed with Ag NPs on the surface showed a significantly enhanced luminol-H2O2 ECL signal compared with the naked platinum electrode. Through the Ag-S or Pt-S bond, the SH-aptamer was immobilized on the electrode surface. The recognition of kanamycin by the aptamer caused an obvious decrease in the ECL signal. The label-free ECL sensing platform displayed a wide linear range from 0.8–170 nM, with a limit of detection of 0.1 nM [73]. Higher sensitivity (0.16 pM) was obtained based on ECL-resonance energy transfer between CDs and Au-GO composite [74].

4.3. Surface-Enhanced Raman Spectroscopy

A significant Raman signal is observed when Raman probes are located between two metal NPs, which are also called hotspots. Metal NPs such as Au NPs and Ag NPs are employed in surface-enhanced Raman spectroscopy (SERS), which is widely applied for the sensing of small molecules, biomolecules, and pollutants [75,76,77]. Both homogeneous and heterogeneous SERS have been developed for the detection of aminoglycosides. Typically, Shi et al. prepared an immunoprobe by conjugating a monoclonal antibody against neomycin and the Raman probe molecule 4-aminothiophenol (PATP) with Au NPs. The immunoprobes were employed in a lateral flow immunoassay strip for the competitive detection of neomycin. The Raman intensity of peak at 1078 cm−1 on the test line was determined and used for the quantitative determination of neomycin. The whole process could be completed within 15 min with a LOD of 0.216 pg mL−1 and good specificity [78]. Homogeneous SERS was developed for the detection of kanamycin in milk samples based on bimetallic Au@Ag NPs. The complementary DNA on the surface of Au@Ag NPs hybridized with kanamycin–aptamer with Raman reporter Cy3 at one end. The Raman intensity of Cy3 decreased with the increase in the kanamycin concentration. A LOD of 1.5 pM for kanamycin was achieved [79]. In the opto-microfluidic systems, metal NPs can absorb the high thermal radiation during the laser excitation, causing a blinking effect in SERS spectra. The nanocomposite of GO and Au NPs was employed to overcome the blinking effect. The thermal generated by laser excitation on the surface of the nanoparticles was transferred and absorbed by the nanocomposites through the GO matrix. Nguyen et al. constructed a GO-based microfluidic system and conjugated an aptamer-based switchable probe with GO. The binding of kanamycin to the aptamer changed the structure of the probe, facilitating the hybridization of complementary DNA and Texas Red-modified Au NPs. The microfluidic-based sensor was reusable, and its limit of detection was 0.75 nM [80].

4.4. Resonance Rayleigh Scattering

Resonance Rayleigh scattering (RRS), determined by using a commonly used fluorescence meter, has been applied to determine biomolecules and inorganic ions [81]. Metal NPs have RRS effects and the resonance scattering peak is correlated with the size of the NPs. A higher signal is obtained with a larger size of NPs. Cu2O nanocubes have been reported to have a good RRS response at 370 nm. Well-dispersed Au NPs can catalyze the Fehling reaction in which Cu2+ is reduced by glucose to form small particles of Cu2O, while the aggregated Au NPs do not have such effects. Based on the recognition of aptamers and the salt-induced aggregation of Au NPs, the in situ generation of the Cu2O strategy was employed for the RRS detection of tobramycin with a LOD of 0.19 nM [82]. RRS energy transfer (RRS-ET) refers to the resonance energy transfer process between the RRS and the acceptor. Jiang’s group established an RRS-ET method for the detection of neomycin. neomycin could induce the formation of blue-black Cu(II)-NEO complexes with a strong absorption peak at 350 nm, which acted as an acceptor to adsorb the scattering light from Cu2O nanocubes. The RRS signal of Cu2O at 370 nm decreased with the increase of neomycin concentration. The detection limit was 0.4 µM [83].

4.5. Discussion

Table A3 (Appendix A) summarizes the assay performance of these optical methods for the detection of AGs. Compared with FL and colorimetric assays, which have been introduced in previous sections, the above methods exhibit a higher sensitivity. Amounts of streptomycin as low as 9.2 fM could be sensitively detected by the DNAzyme-based CL method using aptamers as the recognition elements. Other methods also showed a LOD down to pM levels. Commonly, recognition elements such as aptamers and antibodies are involved in the detection system. Combining the inherent high sensitivity of these methods with the good specific binding ability of the recognition element shows that optical methods have exhibited both good sensitivity and specificity. However, specific detection machines are required. The development of handheld devices will facilitate the development of POCT for AGs by using the above optical methods.

5. Amplification Strategies

Well-designed amplification strategies can improve the detection sensitivity and achieve the detection of trace AGs. Here, some typical amplification strategies are discussed. Table A4 (Appendix A) summarizes the assay performance of these AG assay methods with amplification strategies.

5.1. Nanomaterials as the Signal Amplification Carrier

Nanomaterials have a large surface area and thus have been employed as a carrier to load a large amount of signaling molecules. Miao’s group employed a magnetic separation technique and Au NPs for signal amplification. By taking advantage of Au NPs with a large surface-specific area, a large amount of HRP can be carried on the surface of Au NPs. Thus, the proposed colorimetric method exhibited a LOD for kanamycin as low as 1.7 fM [84]. Liposomes with a large cavity were employed to encapsulate a large amount of signaling molecules. Tang’s group established a signal-on competitive colorimetric immunoassay for the detection of streptomycin, in which an anti-streptomycin antibody-coated microplate and glucose-capsulated liposomes were employed as the immunoreaction carrier and signal-generation tags, respectively. In the absence of target streptomycin, the signal generation tag, coupled with streptomycin–bovine serum albumin (BSA) conjugate, formed an immunocomplex with the anti-streptomycin antibody coated on the microplate. After the rupture of liposomes with Triton X-100, glucose was released and reacted with glucose oxidase to produce H2O2, which oxidized Fe (II) to Fe (III), leading to the color change of the complex ion [Fe(phen)3]2+ from orange-red to light yellow in pH 7.4 solution. In contrast, the addition of target streptomycin caused an orange-red color. Based on the liposome-based amplification strategy, a good linear correlation between the absorbance at 510 nm and the logarithm of the streptomycin concentration was achieved in the dynamic range from 1.7 nM to 34 µM with a LOD of 0.68 nM [85].

5.2. Exonuclease III-Assisted Target Recycling

Target recycling is one of the amplification techniques in which an automatic target binding and release circle are ongoing until the starting materials run out. Target recycling produces more signaling molecules; thus, it can improve the detection sensitivity. Exonuclease (Exo) III has a 3′→5′ exodeoxyribonuclease activity specific to dsDNA. ExoIII can digest the target–aptamer complex, leading to the release of the target into the solution, which initiates the automatic target recycle. Lai and Yu’s group developed a colorimetric homogenous bioassay for the determination of kanamycin based on aptamer biorecognition and ExoIII-assisted target recycling (Figure 6A) [20]. An extended DNAzyme sequence (S1) containing both a DNAzyme sequence and a complementary sequence for kanamycin–aptamer was employed in the bioassay. Interestingly, the DNA hybridization between sequence S1 and kanamycin–aptamer (S2) inhibited the catalytic activity of the peroxidase-mimicking DNAzyme. The specific binding of kanamycin to its aptamer led to the release of single-strand S1 and the subsequent recovery of catalytic activity in the colorimetric TMB reaction. In other words, the aptamer recognition of its target analyte triggered the ‘signal-on’ state of the DNAzye sequence. With the aid of the Exo III-assisted target recycling technique for signal amplification, the homogeneous bioassay achieved the sensitive and selective detection of kanamycin with a LOD of 0.077 nM.

5.3. Hybridization Chain Reaction

The hybridization chain reaction (HCR), as one of the non-enzymatic amplification techniques, requires two hairpin species that are stable in the absence of a single-strand DNA initiator. The single-strand DNA initiator hybridizes with one of the hairpin DNA, leading to the opening of the hairpin structure. This process initiates the hybridization reaction between the two hairpin DNAs and leads to the formation of a long-chained double-helix until the hairpin DNAs are exhausted (Figure 6B). HCR has been employed in colorimetric assays to improve the detection sensitivity of AGs. Ping’s group tried to integrate an Au NP-based colorimetric aptasensor with HCR-assisted amplification to improve the detection sensitivity for kanamycin. The kanamycin–aptamer was contained in a hairpin DNA sequence that had a sticky end to absorb onto the AuNPs surface. The binding of kanamycin to its aptamer exposed parts of the hairpin DNA sequence and triggered a cascade of hybridization chain reactions with the formation of numerous dsDNAs, which have a weak binding ability to the Au NPs’ surface. Thus, the binding caused the salt-induced aggregation of Au NPs. By monitoring the ratio of absorbance at 520 and 630 nm, the LOD for kanamycin was 0.68 μM. Although the amplification method was employed, the sensitivity is poorer than the previous colorimetric assays with amplification techniques. One possible reason may be that the integration of the aptamer in the hairpin DNA sequence may decrease the binding ability of the aptamer to the target kanamycin, thus leading to a decreased detection sensitivity [87].

5.4. Rolling Circle Amplification

Rolling circle amplification (RCA) is an isothermal enzymatic amplification technique in which circular DNA, as a template, hybridizes with primer DNA, triggering the RCA reaction in the presence of polymerase and deoxy-ribonucleoside triphosphate (dNTP). The primer DNA can be prolonged using the circular DNA as a template and can form long-chain single-strand DNA with repeating sequences complementary to the circular DNA (Figure 6C). The RCA product can react or bind with more signaling probes or molecules. The RCA technique was employed to achieve the sensitive detection of the target analyte. Gan and Wu’s group developed a sensitive microfluidic chip-based FL assay for kanamycin by combining the RCA technique with stir bar extraction. SYBR orange, as the ssDNA-binding dye, was employed in the assay and the LOD was 0.51 nM for kanamycin [88].

5.5. Double Amplification Strategies

Recently, some double amplification strategies were developed. Tang’s group combined target-assisted recycling with HCR amplification and developed a turn-on FL assay for kanamycin (Figure 6D) [86]. Au NCs had obvious FL emission. However, the Au NC-functionalized MnO2 nanosheets showed a quenched FL signal due to the quenching effect of MnO2 on the FL of Au NCs. Tang’s group employed Au NC-functionalized MnO2 as the signaling component to construct a turn-on FL analysis method for kanamycin. The addition of kanamycin to the solution triggered the HCR and target-assisted recycling reaction. Therefore, a large amount of alkaline phosphatase (ALP) was captured on the surface of the magnetic beads. The enzymatic hydrolysis of ascorbic acid 2-phosphate by ALP lead to the production of ascorbic acid, which could reduce MnO2, resulting in the release of Au NCs and FL recovery. Under the optimal conditions, kanamycin at concentrations as low as 1.2 pM could be sensitively detected.

5.6. Discussion

The detection sensitivity can be improved significantly by coupling the detection with amplification strategies. The ultrasensitive detection of kanamycin has been realized by using HRP as the label and Au NPs as the signal amplification carriers. Amounts of kanamycin as low as 1.7 aM could be sensitively detected. The proposed method also showed good selectivity and recovery in real sample detection. However, dual-functionalized Au NPs were employed. It is very difficult to ensure that the two kinds of DNA strands are immobilized on the surface of Au NPs uniformly. The inhomogeneous label may induce poor repeatability in the proposed method. We have noticed that enzymes are involved in various amplification strategies such as RCA and Exo III-assisted target recycling. The use of enzymes may increase the experimental cost. In addition, the activity of enzymes is sensitive to the environment and thus may also affect the repeatability of the proposed method. Although HCR shows a moderate signal amplification effect among these amplification strategies, the enzyme is not involved in the HCR technique. The presence of the target can trigger the hybridization of two hairpin DNAs automatically, which leads to amplified signals. By comparing these amplification technologies, we believe that HCR is a simple and convenient signal amplification technique. The careful design of hairpin DNA sequences is important to improve the assay performance, including sensitivity, selectivity, and reproducibility.

6. Multiplex Detection of Antibiotics

Multiplex detection achieves the simultaneous detection of antibiotics in one test. Compared with single component detection, the multiplex detection technique needs fewer samples and has a shorter testing time. Various multiplex detection techniques have been developed based on multiplex labels, spatial resolution, and so on.

6.1. Based on Multiplex Labels

Various nanomaterials such as graphene oxide and MoS2 nanosheets were reported to have an efficient FL quenching effect. These nanomaterials have been employed as quenchers to construct FRET-based biosensing platforms for the detection of antibiotics. For example, Panneerselvam’s group employed metal polydopamine frameworks (MPDAs) as an efficient quencher to construct a FRET-based sensing system for the simultaneous detection of kanamycin and oxytetracycline. The kanamycin–aptamer and oxytetracycline–aptamer were labeled as FAM and carboxytetramethylrhodamine (TAMRA), respectively. The MPDAs showed a strong binding ability to single-strand DNA or free aptamer, while they had a weak interaction with double-stranded DNA and the complex of the aptamer and target molecule. Therefore, quenched FL signals were observed in the absence of the target antibiotics, while the binding of target antibiotics to the aptamer resulted in turn-on FL signals. FL emissions at 525 and 583 nm were monitored for the simultaneous determination of kanamycin and oxytetracycline. In the case of kanamycin, the LOD was 0.3 nM [89]. Two-dimensional MOF Cu-tetrakis(4-carboxyphenyl)porphyrin (TCPP) showed a similar property to MPDAs and has been employed as an efficient quencher to construct a multiplex sensing platform for the simultaneous detection of three kinds of antibiotics. Fluorophore-labeled probes adsorbed on the surface of Cu-TCPP caused the FL quenching. Differing from the former work, Y-shaped hybridized DNA strands were employed to assemble aptamers on the surface of a gold bar, and another gold bar that has immobilized complementary probes was employed to initiate target recycling and the release of the aptamer. The released aptamer hybridized with the adsorbed probes, leading to the full recovery of FL signals. The developed aptasensor was sufficiently sensitive to detect antibiotic residues as low as 1.5, 2.4, and 1 pM for chloramphenicol, oxytetracycline, and kanamycin, respectively [90]. Youn et al. employed GO as an FL quencher and developed a signal-on FL method for the simultaneous detection of sulfadimethoxine, kanamycin, and ampicillin by using Cy3, Cy5, and FAM-labeled aptamers. With the aid of the DNAse I-assisted cyclic enzymatic signal amplification method, the aptasensor detected antibiotics in solution with limits of detection of 6.4, 4.5, and 6.7 nM for sulfadimethoxine, kanamycin, and ampicillin, respectively [91].
Semiconductor quantum dots have unique emission properties such as size-dependent FL emission, a wide excitation spectrum, and a narrow emission spectrum. Therefore, semiconductor QDs have been employed for multiplex sensing platforms. Peng and Ni’s group employed green-emitting QDs and red-emitting QDs as support materials and prepared two kinds of MIP-coated QDs using aminopropyltriethoxysilane (APTES) a functional monomer, tetraethoxysilane (TEOS) as a cross-linker, and antibiotics as the monomers. The two kinds of MIP-coated QDs were used to establish a NAND molecular logic gate for the simultaneous detection of streptomycin sulfate and kanamycin sulfate. The green-emitting QDs responded with streptomycin sulfate, while the red-emitting QDs had a response to kanamycin sulfate. The LOD was 0.22 mM and 0.24 mM for streptomycin sulfate and kanamycin sulfate, respectively [92].

6.2. Based on Spatial Resolution

Zeng’s group developed a simultaneous detection method for kanamycin and streptomycin by using CL imaging. Anti-kanamycin antibodies and anti-streptomycin antibodies were spotted in different areas of a nitrocellulose membrane. A competitive-type CL imaging immunoassay was developed for the simultaneous detection of kanamycin and streptomycin by using the microarray on the nitrocellulose membrane. By using HRP as the label, CL images were recorded by a cooled low-light CCD with a high resolution. For qualitative analysis, the LOD was 0.86 nM for kanamycin and 5.4 nM for streptomycin [93]. In addition, lateral flow assay strips with two test regions were constructed for the simultaneous detection of neomycin and quinolone antibiotics with LODs down to 0.6 pM and 1.5 pM by using SERS [94]. A microchip electrophoresis array combined with aptamer recognition and polymerase chain reaction (PCR) amplification were employed for the simultaneous detection of kanamycin and chloramphenicol [95].

7. Conclusions and Perspectives

This review summarizes various optical assays, including colorimetric, FL, CL, ECL, SERS, and RRS, for the detection of AGs developed in recent years. Colorimetric assays based on HRP, DNAzyme, and metal NPs were constructed for the detection of AGs. Most AGs do not have fluorophores. Derivative reactions have been employed to generate FL AG derivatives, which can be used to quantitatively detect AGs. For the rapid detection of AGs, FL organic molecules such as Cy3, Cy5, FAM, DNA-binding FL dyes, etc., and FL-emitting nanomaterials have been employed to develop FL assays for AGs using antibodies, aptamers, metal ions, and MIPs as recognition elements. Various well-designed amplification techniques including PCR, RCA, HCR, etc., have been developed to improve the detection sensitivity for AGs. FL assays with aptamers as recognition elements performed well in the quantitative detection of AGs, with both good sensitivity and selectivity. However, FL readouts require a fluorophotometer. Alternatively, the results of colorimetric assays can be obtained without a specific instrument. For example, colorimetric results can be obtained through naked eye observation or smartphone images with an RGB color analyzer. Thus, the colorimetric assay should be a good choice in the development of on-site detection methods. Further improvements in the detection efficiency, sensitivity, and selectivity are needed to meet the requirement of the on-site detection of trace AGs in complex matrices.

Author Contributions

The authors contributed equally to the manuscript. All authors have read and agreed to the published version of the manuscript.

Funding

This research received no external funding.

Acknowledgments

We sincerely thank the support from the Collaborative Innovation Center of Chemical Science and Engineering (Tianjin).

Conflicts of Interest

The authors declare no conflict of interest.

Abbreviations

ABTS2,2’-Azinobis-(3-ethylbenzthiazoline-6-sulphonate)
AGsAminoglycosides
Ag NCsSilver nanoclusters
ALPAlkaline phosphatase
Ag NPsSilver nanoparticles
APTESAminopropyltriethoxysilane
Au NCsGold nanoclusters
Au NPsGold nanoparticles
BSABovine serum albumin
CDsCarbon dots
CECapillary electrophoresis
CLChemiluminescent
CNTsCarbon nanotubes
dsDNADouble-strand DNA
dNTPDeoxy-ribonucleoside triphosphate
ECLElectrogenerated chemiluminescence
EGCGEpigallocatechin gallate
ELISAEnzyme-linked immunosorbent assay
ELSDEvaporative light-scattering detection
Exo IIIExonuclease III
FAMCarboxyfluorescein
FLFluorescence
FRETFluorescence resonance energy transfer
GCGas chromatography
GFPFluorescent protein
GOGraphene oxide
GQDsGraphene oxide quantum dots
HCAHierarchical clustering analysis
HCRHybridization chain reaction
HPLCHigh-performance liquid chromatography
HRPHorseradish peroxidase
LODLimit of detection
LFALateral flow assay
MIPsMolecular imprinting polymers
MOFsMetal-organic frameworks
MRLMaximum residue limit
MSMass spectrometry
OPDo-phenylenediamine
PADPulsed amperometric detectors
PATP4-aminothiophenol
PCAPrincipal component analysis
PCRPolymerase chain reaction
PDDAPoly(diallyl dimethyl ammonium chloride)
POCTPoint of care test
QDsQuantum dots
RCARolling circle amplification
RRSResonance Rayleigh scattering
RRS-ETResonance Rayleigh scattering-energy transfer
SDSSodium dodecyl sulfate
SELEXSystemic evolution of ligands by exponential enrichment
SERSSurface-enhanced Raman spectroscopy
SPRSurface plasmon resonance
SSBSingle-stranded DNA-binding protein
ssDNASingle-strand DNA
TAMRACarboxytetramethylrhodamine
TCPPTetrakis(4-carboxyphenyl)porphyrin
TEOSTetraethoxysilane
TMBTetramethyl benzidine

Appendix A

Table A1. Assay performance of typical FL methods for the detection of AGs in food *.
TargetRecognition ElementDetection Mode/PrincipleLinear Range
(nM)
LOD (nM)Time
(min)
** SelectivityReal Sample
(Recovery, %)
Ref
ABC
KanamycinAptamerOFF/based on DNA-binding Dye0.6–20.00.3365-Milk (-)[24]
OFF/based on DNA-binding Dye1–300,0000.320-Milk (94–105)[25]
OFF/evanescent wave aptasensor200–200,0002610×-Milk (91–97)[27]
MIP and aptamerOFF/target-induced FL quenching85.8–17,1601.115–25Milk (88–116)[29]
AptamerON/FERT between CDs and MoS24000–25,0001100-Milk (85–102)[40]
ON/FERT between Ag NCs and Au NPs5–501.030--Milk (90–95)[17]
ON/FERT between FAM and Au NPs0.8–3500.3140-Milk (99–105)[41]
ON/FERT between FAM and CNTs1–500.475-Milk (98–103)[42]
ON/FERT between FAM and graphene0.001–0.0200.00155-Milk (99–103)[44]
ON/FRET between FAM and Dabcyl100–60013.5232Milk (101–109)[36]
ON/FRET between GQDs and BHQ10.017–154.40.0195Milk (97–103)[37]
ON/in situ generation of fluorophore75–80003680×-Milk and honey (92–103)[35]
AptamerRATIO/FRET between Cy3 and Cy50.18–50.18-Milk (-)[38]
StreptomycinAptamerOFF/based on DNA-binding dye100–100,0009424Milk and chicken (94–110)[26]
NeomycinMIPsOFF/target-induced FL quenching3.3–16270.2660-Milk (77–94)[30]
LincomycinMIPsOFF/target induced FL quenching22.5–22516.2120-Egg (96–99)[32]
* See abbreviation list for the abbreviations in the Table. ** Selectivity A, B and C means the interference effect of other AGs, other antibiotics, and other molecules, respectively. ◯: no interference effect; ×: interference effect; -: no data.
Table A2. Assay performance of typical colorimetric assays for the detection of AGs in food *.
TargetRecognition ElementDetection Mechanism
(Quantitative Parameters)
Linear Range
(nM)
LOD
(nM)
Time
(min)
Selectivity **Sample (Recovery, %)Ref
ABC
KanamycinAptamerLateral flow strip biosensor based on Au NPs (Optical density)1–300.077810-Honey, milk and milk powder (-)[51]
AptamerSalt-induced aggregation of Ag NPs (A404-A600)85–10004.520-Milk (100–102)[64]
ECGGTarget-induced aggregation of Ag NPs (ΔA415)960–20,0009601--Milk (-)[59]
ChlortetracyclineTarget-induced aggregation of Ag NPs (A540/400)0.12–0.480.1220---Water (-)[61]
ChitosanTarget-induced aggregation of Au NPs (A650/520)10–40,000810-Milk (100–101)[65]
AHMTTarget-induced aggregation of Au NPs (A650/520)5–100,100–2000410-Water and milk (98–120)[66]
TobramycinAptamerSalt-induced aggregation of Au NPs (A620/520)40–20023.335Milk and egg (93–105)[56]
AptamerSalt-induced aggregation of Au NPs (ΔA520)100–140037.9110---Honey (98–99)[57]
StreptomycinGallic acidTarget-induced aggregation of Ag NPs (A560/A400)0.05–0.650.03620×-Milk (-)[60]
ChlortetracyclineTarget-induced aggregation of Ag NPs (A540/A400)2–11220---Water (-) [61]
GentamicinCysteamineTarget-induced aggregation of Au NPs (A680/A520)12.45–20012.4515--Milk (-)[58]
* See abbreviation list for the abbreviations in the Table. ** Selectivity A, B, and C means the interference effect of other AGs, other antibiotics, and other molecules, respectively. ◯: no interference effect; ×: interference effect; -: no data.
Table A3. Assay performance of other optical methods for the detection of AGs *.
TargetRecognition ElementDetection MechanismLinear Range
(nM)
LOD
(nM)
Time
(min)
Selectivity **Sample (Recovery, %)Ref
ABC
KanamycinAptamerAu NCs-catalyzed luminol CL reaction0.2–4.40.035150Milk (99–105)[70]
AptamerAg NPs-enhanced ECL reaction0.8–1700.160-Milk (96–107)[73]
AptamerSERS0.017–1700.001540-Milk (90–114)[79]
AptamerOpto-microfluidic system combined with SERS1–1000.7580-Milk, orange juice, water (97–103)[80]
StreptomycinAptamerDNAzyme-catalyzed luminol CL reaction0.0014–2.80.000092--Cucumber and milk (97–103)[71]
-Strep–luminol–NaIO4–Mn2+ CL reaction10–17005.16---Milk (87–122)[68]
LincomycinAptamer and MIPsECL-RET between CDs and Au-GO0.005–10.0001610Meat (90–105)[74]
NeomycinAntibodySERS based on LFA1.4–1400.000315Milk (90–106)[78]
TobramycinAptamerRRS-based on Cu2O0.50–170.1926Milk (98–103)[82]
* See abbreviation list for the abbreviations in the Table. ** Selectivity A, B, and C means the interference effect of other AGs, other antibiotics, and other molecules, respectively. ◯: no interference effect; -: no data.
Table A4. Assay performance of the optical detection methods for AGs with amplification strategies *.
TargetPrinciple
/Mode
Amplification MethodLinear Range
(nM)
LOD
(nM)
Time
(min)
Selectivity **Sample (Recovery, %)Ref
ABC
KanamycinHRP-catalyzed TMB reactionAu NPs as amplification carrier1.7 × 10−6–1.7 × 1051.7 × 10−6150-Milk (100–104)[84]
Microfluidic chip combined with label-free FLRCA1.36–17,0000.51160Milk and fish (90–106)[88]
Turn-on FLTarget-assisted recycling and HCR2–50001.2385-Milk (-)[86]
DNAzyme-catalyzed colorimetric reactionExo III-assisted target recycling0.17–17,0000.077125-Milk (91–109)[20]
Spilt G-
Quadruplex DNAzyme catalyzed ABTS colorimetric reaction
Dual nicking enzyme signal amplification50–500,00014.7360Milk (93–105)[21]
Label-free FLTarget recycling and HCR1.7–170,000 0.7765Milk, fish, and pork (90–114)[22]
StreptomycinColorimetric immunoassay based on [Fe(II)-Phen] systemLiposome1.7–34,0000.68130-Milk, honey, muscle and kidney (86–114)[85]
* See abbreviation list for the abbreviations in the Table. ** Selectivity A, B, and C means the interference effect of other AGs, other antibiotics, and other molecules, respectively. ◯: no interference effect; -: no data.

References

  1. Nhung, N.T.; Cuong, N.V.; Thwaites, G.; Carrique-Mas, J. Antimicrobial usage and antimicrobial resistance in animal production in Southeast Asia: A review. Antibiotics 2016, 5, 37. [Google Scholar] [CrossRef] [Green Version]
  2. Armstrong, E.S.; Kostrub, C.F.; Cass, R.T.; Moser, H.E.; Serio, A.W.; Miller, G.H. Aminoglycosides. In Antibiotic Discovery and Development; Dougherty, T.J., Pucci, M.J., Eds.; Springer Science+Business Media: New York, NY, USA, 2012; Volume 1, pp. 229–270. [Google Scholar]
  3. Huth, M.E.; Han, K.H.; Sotoudeh, K.; Hsieh, Y.J.; Effertz, T.; Vu, A.A.; Verhoeven, S.; Hsieh, M.H.; Greenhouse, R.; Cheng, A.G.; et al. Designer aminoglycosides prevent cochlear hair cell loss and hearing loss. J. Clin. Investig. 2015, 125, 583–592. [Google Scholar] [CrossRef] [Green Version]
  4. Farouk, F.; Azzazy, H.M.E.; Niessen, W.M.A. Challenges in the determination of aminoglycoside antibiotics, a review. Anal. Chim. Acta 2015, 890, 21–43. [Google Scholar] [CrossRef]
  5. Mingeot-Leclercq, M.P.; Glupczynski, Y.; Tulkens, P.M. Aminoglycosides: Activity and resistance. Antimicrob. Agents Chemother. 1999, 43, 727–737. [Google Scholar] [CrossRef] [Green Version]
  6. FuJii, Y.; Kaga, T.; Nishimura, K. Simultaneous determination of aminoglycoside residues in livestock and fishery products by phenylboronic acid solid-phase extraction and liquid chromatography-tandem mass spectrometry. Anal. Sci. 2019, 9, 961–966. [Google Scholar] [CrossRef] [PubMed] [Green Version]
  7. Stead, D.A. Current methodologies for the analysis of aminoglycosides. J. Chromatogr. B 2000, 747, 69–93. [Google Scholar] [CrossRef]
  8. Jariwala, F.B.; Hibbs, J.A.; Zhuk, I.; Sukhishvili, S.A.; Attygalle, A.B. Rapid determination of aminoglycosides in pharmaceutical preparations by electrospray ionization mass spectrometry. J. Anal. Sci. Technol. 2020, 11, 2. [Google Scholar] [CrossRef]
  9. Nagatoishi, S.; Nojima, T.; Galezowska, E.; Gluszynska, A.; Juskowiak, B.; Takenaka, S. Fluorescence energy transfer probes based on the guanine quadruplex formation for the fluorometric detection of potassium ion. Anal. Chim. Acta 2007, 581, 125–131. [Google Scholar] [CrossRef] [PubMed]
  10. Fan, A.P.; Cao, Z.J.; Li, H.; Kai, M.; Lu, J.Z. Chemiluminescence platforms in immunoassay and DNA analyses. Anal. Sci. 2009, 25, 587–597. [Google Scholar] [CrossRef] [PubMed] [Green Version]
  11. Xu, Z.; Chen, X.; Kim, H.N.; Yoon, J. Sensors for the optical detection of cyanide ion. Chem. Soc. Rev. 2010, 39, 127–137. [Google Scholar] [CrossRef]
  12. Mehlhorn, A.; Rahimi, P.; Joseph, Y. Aptamer-based biosensors for antibiotic detection: A review. Biosensors 2018, 8, 54. [Google Scholar] [CrossRef] [PubMed] [Green Version]
  13. Shalev, M.; Kandasamy, J.; Skalka, N.; Belakhov, V.; Rosin-Arbesfeld, R.; Baasov, T. Development of generic immunoassay for the detection of a series of aminoglycosides with 6‘-OH group for the treatment of genetic diseases in biological samples. J. Pharm. Biomed. Anal. 2012, 75, 33–40. [Google Scholar] [CrossRef] [PubMed] [Green Version]
  14. Ji, S.L.; Zhang, F.F.; Luo, X.; Yang, B.C.; Jin, G.W.; Yan, J.Y.; Liang, X.M. Synthesis of molecularly imprinted polymer sorbents and application for the determination of aminoglycosides antibiotics in honey. J. Chromatogr. A 2013, 1313, 113–118. [Google Scholar] [CrossRef] [PubMed]
  15. Yola, M.L.; Uzun, L.; Ozaltin, N.; Denizli, A. Development of molecular imprinted nanosensor for determination of tobramycin in pharmaceuticals and foods. Talanta 2013, 120, 318–324. [Google Scholar] [CrossRef] [PubMed]
  16. Leng, Y.; Fu, Y.; Lu, Z.; Sang, Z.; Liu, K.; Du, C.; Ma, L. Sub-10-nm multicolored gold nanoparticles for colorimetric determination of antibiotics via formation of interlocking rings. Microchim. Acta 2019, 186, 318. [Google Scholar] [CrossRef]
  17. Ye, T.; Peng, Y.; Yuan, M.; Cao, H.; Yu, J.; Li, Y.; Xu, F.A. “turn-on” fluorometric assay for kanamycin detection by using silver nanoclusters and surface plasmon enhanced energy transfer. Microchim. Acta 2019, 186, 40. [Google Scholar] [CrossRef]
  18. Lin, X.; Su, J.; Lin, H.; Sun, X.; Liu, B.; Kankala, R.K.; Zhou, S.-F. Luminescent carbon nanodots based aptasensors for rapid detection of kanamycin residue. Talanta 2019, 202, 452–459. [Google Scholar] [CrossRef]
  19. Liu, X.; Na, W.; Liu, Q.; Su, X. A novel label-free fluorescent sensor for highly sensitive detection of bleomycin based on nitrogen-doped graphene quantum dots. Anal. Chim. Acta 2018, 1028, 45–49. [Google Scholar] [CrossRef]
  20. Chen, Z.; Xiong, F.; Yu, A.; Lai, G. Aptamer biorecognition-triggered dnazyme liberation and exo III-assisted target recycling for ultrasensitive homogeneous colorimetric bioassay of kanamycin antibiotic. Chem. Commun. 2019, 55, 3959–3962. [Google Scholar] [CrossRef]
  21. Cui, X.; Li, R.; Liu, X.; Wang, J.; Leng, X.; Song, X.; Pei, Q.; Wang, Y.; Liu, S.; Huang, J. Low-background and visual detection of antibiotic based on target-activated colorimetric split peroxidase dnazyme coupled with dual nicking enzyme signal amplification. Anal. Chim. Acta 2018, 997, 1–8. [Google Scholar] [CrossRef]
  22. Zhang, K.; Cao, J.; Wu, Y.; Hu, F.; Li, T.; Wang, Y.; Gan, N. A fluorometric aptamer method for kanamycin by applying a dual amplification strategy and using double y-shaped DNA probes on a gold bar and onmagnetite nanoparticles. Microchim. Acta 2019, 186, 120. [Google Scholar] [CrossRef] [PubMed]
  23. Mabrouk, M.M.; Noureldin, H.A.M.; Badr, I.H.A.; Saad, A.H.K. Simple spectrofluorimetric methods for determination of veterinary antibiotic drug (apramycin sulfate) in pharmaceutical preparations and milk samples. Spectroc. Acta Part A Mol. Biomol. Spectrosc. 2020, 224, 117395. [Google Scholar] [CrossRef] [PubMed]
  24. Zhu, Y.; Li, W.; Tan, S.; Chen, T. Label-free and simple g-quadruplex-based turn-off fluorescence assay for the detection of kanamycin. Anal. Lett. 2018, 51, 1718–1729. [Google Scholar] [CrossRef]
  25. Ma, L.; Sun, N.; Tu, C.H.; Zhang, Q.; Diao, A.P. Design of an aptamer-based fluorescence displacement biosensor for selective and sensitive detection of kanamycin in aqueous samples. RSC Adv. 2017, 7, 38512–38518. [Google Scholar] [CrossRef] [Green Version]
  26. Lin, B.; Yu, Y.; Cao, Y.; Guo, M.; Zhu, D.; Dai, J.; Zheng, M. Point-of-care testing for streptomycin based on aptamer recognizing and digital image colorimetry by smartphone. Biosens. Bioelectron. 2018, 100, 482–489. [Google Scholar] [CrossRef]
  27. Tang, Y.; Gu, C.; Wang, C.; Song, B.; Zhou, X.; Lou, X.; He, M. Evanescent wave aptasensor for continuous and online aminoglycoside antibiotics detection based on target binding facilitated fluorescence quenching. Biosens. Bioelectron. 2018, 102, 646–651. [Google Scholar] [CrossRef]
  28. Song, K.-M.; Cho, M.; Jo, H.; Min, K.; Jeon, S.H.; Kim, T.; Han, M.S.; Ku, J.K.; Ban, C. Gold nanoparticle-based colorimetric detection of kanamycin using a DNA aptamer. Anal. Biochem. 2011, 415, 175–181. [Google Scholar] [CrossRef]
  29. Geng, Y.; Guo, M.; Tan, J.; Huang, S.; Tang, Y.; Tan, L.; Liang, Y. A fluorescent molecularly imprinted polymer using aptamer as a functional monomer for sensing of kanamycin. Sens. Actuator B Chem. 2018, 268, 47–54. [Google Scholar] [CrossRef]
  30. Wan, Y.-c.; Liu, Y.-j.; Liu, C.; Ma, H.-t.; Yu, H.-f.; Kang, J.-w.; Gao, C.-l.; Wu, Z.-q.; Zheng, D.; Lu, B. Rapid determination of neomycin in biological samples using fluorescent sensor based on quantum dots with doubly selective binding sites. J. Pharm. Biomed. Anal. 2018, 154, 75–84. [Google Scholar] [CrossRef]
  31. Hassanzadeh, J.; Moghadam, B.R.; Sobhani-Nasab, A.; Ahmadi, F.; Rahimi-Nasrabadi, M. Specific fluorometric assay for direct determination of amikacin by molecularly imprinting polymer on high fluorescent g-C3N4 quantum dots. Spectroc. Acta Part A Mol. Biomol. Spectrosc. 2019, 214, 451–458. [Google Scholar] [CrossRef]
  32. Wu, P.; Du, Q.; Sun, Y.; Li, Z.; He, H. Mip-coated Eu(BTC) for the fluorometric determination of lincomycin in eggs. Anal. Methods 2019, 11, 4501–4510. [Google Scholar] [CrossRef]
  33. Karacaglar, N.N.Y.; Topcu, A.; Dudak, F.C.; Boyaci, I.H. Development of a green fluorescence protein (GFP)-based bioassay for detection of antibiotics and its application in milk. J. Food Sci. 2020, 85, 500–509. [Google Scholar] [CrossRef]
  34. Dehghani, S.; Danesh, N.M.; Ramezani, M.; Alibolandi, M.; Lavaee, P.; Nejabat, M.; Abnous, K.; Taghdisi, S.M. A label-free fluorescent aptasensor for detection of kanamycin based on dsDNA-capped mesoporous silica nanoparticles and Rhodamine, B. Anal. Chim. Acta 2018, 1030, 142–147. [Google Scholar] [CrossRef]
  35. Belal, A.S.F.; Ismail, A.; Elnaggar, M.M.; Belal, T.S. Click chemistry inspired copper sulphide nanoparticle-based fluorescence assay of kanamycin using DNA aptamer. Spectroc. Acta Part A Mol. Biomol. Spectrosc. 2018, 205, 48–54. [Google Scholar] [CrossRef]
  36. Ma, X.; Qiao, S.; Sun, H.; Su, R.; Sun, C.; Zhang, M. Development of structure-switching aptamers for kanamycin detection based on fluorescence resonance energy transfer. Front. Chem. 2019, 7, 29. [Google Scholar] [CrossRef]
  37. He, Y.; Wen, X.; Zhang, B.; Fan, Z. Novel aptasensor for the ultrasensitive detection of kanamycin based on graphene oxide quantum-dot-linked single-stranded DNA-binding protein. Sens. Actuator B Chem. 2018, 265, 20–26. [Google Scholar] [CrossRef]
  38. Pinto, I.A.; Toloza, C.A.T.; Almeida, J.M.S.; da Silva, A.R.; Larrude, D.G.; Aucelio, R.Q. Quantification of neomycin in rubella vaccine by off/on metal ion mediated photoluminescence from functionalized graphene quantum dots. Spectroc. Acta Part A Mol. Biomol. Spectrosc. 2019, 220, 117139. [Google Scholar] [CrossRef]
  39. Umrao, S.; Anusha, S.; Jain, V.; Chakraborty, B.; Roy, R. Smartphone-based kanamycin sensing with ratiometric FRET. RSC Adv. 2019, 9, 6143–6151. [Google Scholar] [CrossRef] [Green Version]
  40. Wang, Y.S.; Ma, T.C.; Ma, S.Y.; Liu, Y.J.; Tian, Y.P.; Wang, R.N.; Jiang, Y.B.; Hou, D.J.; Wang, J.L. Fluorometric determination of the antibiotic kanamycin by aptamer-induced FRET quenching and recovery between MoS2 nanosheets and carbon dots. Microchim. Acta 2017, 184, 203–210. [Google Scholar] [CrossRef]
  41. Chen, J.; Li, Z.H.; Ge, J.; Yang, R.; Zhang, L.; Qu, L.B.; Wang, H.Q.; Zhang, L. An aptamer-based signal-on bio-assay for sensitive and selective detection of Kanamycin A by using gold nanoparticles. Talanta 2015, 139, 226–232. [Google Scholar] [CrossRef]
  42. Liao, Q.G.; Wei, B.H.; Luo, L.G. Aptamer based fluorometric determination of kanamycin using double-stranded DNA and carbon nanotubes. Microchim. Acta 2017, 184, 627–632. [Google Scholar] [CrossRef]
  43. Su, D.; Wang, M.; Liu, Q.; Chen, J.; Su, X. Dual-emission ratio fluorescence detection of bleomycin based on nitrogen doped graphene quantum dots@gold nanoclusters assembly. Sens. Actuator B Chem. 2019, 290, 163–169. [Google Scholar] [CrossRef]
  44. Ha, N.-R.; Jung, I.-P.; La, I.-J.; Jung, H.-S.; Yoon, M.-Y. Ultra-sensitive detection of kanamycin for food safety using a reduced graphene oxide-based fluorescent aptasensor. Sci. Rep. 2017, 7, 40305. [Google Scholar] [CrossRef] [Green Version]
  45. Du, B.; Wen, F.; Guo, X.; Zheng, N.; Zhang, Y.; Li, S.; Zhao, S.; Liu, H.; Meng, L.; Xu, Q.; et al. Evaluation of an ELISA-based visualization microarray chip technique for the detection of veterinary antibiotics in milk. Food Control. 2019, 106, 106713. [Google Scholar] [CrossRef]
  46. Gong, L.; Zhao, Z.L.; Lv, Y.F.; Huan, S.Y.; Fu, T.; Zhang, X.B.; Shen, G.L.; Yu, R.Q. DNAzyme-based biosensors and nanodevices. Chem. Commun. 2015, 51, 979–995. [Google Scholar] [CrossRef]
  47. Wang, C.; Chen, D.; Wang, Q.; Tan, R. Kanamycin detection based on the catalytic ability enhancement of gold nanoparticles. Biosens. Bioelectron. 2017, 91, 262–267. [Google Scholar] [CrossRef]
  48. Hu, Q.; Zhou, B.; Dang, P.; Li, L.; Kong, J.; Zhang, X. Facile colorimetric assay of alkaline phosphatase activity using Fe(II)-phenanthroline reporter. Anal. Chim. Acta 2017, 950, 170–177. [Google Scholar] [CrossRef]
  49. Ji, Y.W.; Ren, M.L.; Li, Y.P.; Huang, Z.B.; Shu, M.; Yang, H.W.; Xiong, Y.H.; Xu, Y. Detection of aflatoxin B-1 with immunochromatographic test strips: Enhanced signal sensitivity using gold nanoflowers. Talanta 2015, 142, 206–212. [Google Scholar] [CrossRef]
  50. Leng, Y.; Hu, F.; Ma, C.; Du, C.; Ma, L.; Xu, J.; Lin, Q.; Sang, Z.; Lu, Z. Simple, rapid, sensitive, selective and label-free lincomycin detection by using HAucl4 and NaOH. RSC Adv. 2019, 9, 28248–28252. [Google Scholar] [CrossRef] [Green Version]
  51. Liu, J.; Zeng, J.; Tian, Y.; Zhou, N. An aptamer and functionalized nanoparticle-based strip biosensor for on-site detection of kanamycin in food samples. Analyst 2018, 143, 182–189. [Google Scholar] [CrossRef]
  52. Abedalwafa, M.A.; Tang, Z.; Qiao, Y.; Mei, Q.; Yang, G.; Li, Y.; Wang, L. An aptasensor strip-based colorimetric determination method for kanamycin using cellulose acetate nanofibers decorated DNA-gold nanoparticle bioconjugates. Microchim. Acta 2020, 187, 360. [Google Scholar] [CrossRef]
  53. Shayesteh, O.H.; Khosroshahi, A.G. A polya aptamer-based label-free colorimetric biosensor for the detection of kanamycin in human serum. Anal. Methods 2020, 12, 1858–1867. [Google Scholar] [CrossRef]
  54. Li, L.; Gu, Y.; Chen, Q.; Wu, P.; Li, N.; Chen, R.; He, H. Label-free silver nanoparticles for the determination of gentamicin. J. Nanosci. Nanotechnol. 2018, 18, 4501–4506. [Google Scholar] [CrossRef]
  55. Zhang, C.; Feng, R.; Li, X. Colorimetric sensing for the determination of kanamycin based on gold nanoparticles. J. Anal. Sci. 2018, 34, 372–376. [Google Scholar]
  56. Ma, Q.; Wang, Y.; Jia, J.; Xiang, Y. Colorimetric aptasensors for determination of tobramycin in milk and chicken eggs based on DNA and gold nanoparticles. Food Chem. 2018, 249, 98–103. [Google Scholar] [CrossRef]
  57. Han, X.; Zhang, Y.; Nie, J.; Zhao, S.; Tian, Y.; Zhou, N. Gold nanoparticle based photometric determination of tobramycin by using new specific DNA aptamers. Microchim. Acta 2018, 185, 4. [Google Scholar] [CrossRef]
  58. Gukowsky, J.C.; Tan, C.; Han, Z.; He, L. Cysteamine-modified gold nanoparticles as a colorimetric sensor for the rapid detection of gentamicin. J. Food Sci. 2018, 83, 1631–1638. [Google Scholar] [CrossRef]
  59. Singh, R.K.; Panigrahi, B.; Mishra, S.; Das, B.; Jayabalan, R.; Parhi, P.K.; Mandal, D. pH triggered green synthesized silver nanoparticles toward selective colorimetric detection of kanamycin and hazardous sulfide ions. J. Mol. Liq. 2018, 269, 269–277. [Google Scholar] [CrossRef]
  60. Ghodake, G.; Shinde, S.; Saratale, R.G.; Kadam, A.; Saratale, G.D.; Syed, A.; Marraiki, N.; Elgorban, A.M.; Kim, D.-Y. Silver nanoparticle probe for colorimetric detection of aminoglycoside antibiotics: Picomolar-level sensitivity toward streptomycin in water, serum, and milk samples. J. Sci. Food Agric. 2019, 100, 874. [Google Scholar] [CrossRef]
  61. Saratale, G.D.; Saratale, R.G.; Ghodake, G.; Shinde, S.; Kim, D.-Y.; Alyousef, A.A.; Arshad, M.; Syed, A.; Pant, D.; Shin, H.-S. Chlortetracycline-functionalized silver nanoparticles as a colorimetric probe for aminoglycosides: Ultrasensitive determination of kanamycin and streptomycin. Nanomaterials 2020, 10, 997. [Google Scholar] [CrossRef]
  62. ul Ain, N.; Aslam, Z.; Yousuf, M.; Waseem, W.A.; Bano, S.; Anis, I.; Ahmed, F.; Faizi, S.; Malik, M.I.; Shah, M.R. Green synthesis of methyl gallate conjugated silver nanoparticles: A colorimetric probe for gentamicin. New J. Chem. 2019, 43, 1972–1979. [Google Scholar] [CrossRef]
  63. Rezaei, H.; Rahimpour, E.; Khoubnasabjafari, M.; Jouyban-Gharamaleki, V.; Jouyban, A. A colorimetric nanoprobe based on dynamic aggregation of SDS-capped silver nanoparticles for tobramycin determination in exhaled breath condensate. Microchim. Acta 2020, 187, 186. [Google Scholar] [CrossRef] [PubMed]
  64. Xu, Y.; Han, T.; Li, X.; Sun, L.; Zhang, Y.; Zhang, Y. Colorimetric detection of kanamycin based on analyte-protected silver nanoparticles and aptamer-selective sensing mechanism. Anal. Chim. Acta 2015, 891, 298–303. [Google Scholar] [CrossRef] [PubMed]
  65. Lai, C.; Liu, X.; Qin, L.; Zhang, C.; Zhang, G.; Huang, D.; Cheng, M.; Xu, P.; Yi, H.; Huang, D. Chitosan-wrapped gold nanoparticles for hydrogen-bonding recognition and colorimetric determination of the antibiotic kanamycin. Microchim. Acta 2017, 184, 2097–2105. [Google Scholar] [CrossRef]
  66. Qin, L.; Zeng, G.; Lai, C.; Huang, D.; Zhang, C.; Xua, P.; Hua, T.; Liu, X.; Cheng, M.; Liu, Y.; et al. A visual application of gold nanoparticles: Simple, reliable and sensitive detection of kanamycin based on hydrogen-bonding recognition. Sens. Actuator B Chem. 2017, 243, 946–954. [Google Scholar] [CrossRef]
  67. Gu, Z.F.; Fu, A.C.; Ye, L.; Kuerban, K.; Wang, Y.; Cao, Z.J. Ultrasensitive chemiluminescence biosensor for nuclease and bacterial determination based on hemin-encapsulated mesoporous silica nanoparticles. ACS Sens. 2019, 11, 2922–2929. [Google Scholar] [CrossRef]
  68. Wan, G.H.; Cui, H.; Zheng, H.-S.; Pang, Y.-Q.; Liu, L.-J.; Yu, X.-F. Flow-injection determination of streptomycin residues in milk using the luminol-periodate-Mn2+ chemiluminescence system. Luminescence 2006, 21, 36–42. [Google Scholar] [CrossRef]
  69. Deng, M.; Xu, S.; Chen, F. Enhanced chemiluminescence of the luminol-hydrogen peroxide system by BSA-stabilized Au nanoclusters as a peroxidase mimic and its application. Anal. Methods 2014, 6, 3117–3123. [Google Scholar] [CrossRef]
  70. Yao, Y.; Wang, X.; Duan, W.; Li, F. A label-free, versatile and low-background chemiluminescence aptasensing strategy based on gold nanocluster catalysis combined with the separation of magnetic beads. Analyst 2018, 143, 709–714. [Google Scholar] [CrossRef]
  71. Sun, Y.; Han, R.; Dai, Y.; Zhu, X.; Liu, H.; Gao, D.; Luo, C.; Wang, X.; Wei, Q. Highly selective and sensitive streptomycin chemiluminescence sensor based on aptamer and g-quadruplex DNAzyme modified three-dimensional graphene composite. Sens. Actuator B Chem. 2019, 301, 127122. [Google Scholar] [CrossRef]
  72. Zheng, X.W.; Guo, Z.H.; Zhang, Z.J. Flow-injection electrogenerated chemiluminescence determination of isoniazid using luminol. Anal. Sci. 2001, 17, 1095–1099. [Google Scholar] [CrossRef] [PubMed] [Green Version]
  73. Cheng, S.; Liu, H.; Zhang, H.; Chu, G.; Guo, Y.; Sun, X. Ultrasensitive electrochemiluminescence aptasensor for kanamycin detection based on silver nanoparticle-catalyzed chemiluminescent reaction between luminol and hydrogen peroxide. Sens. Actuator B Chem. 2020, 304, 127367. [Google Scholar] [CrossRef]
  74. Li, S.; Liu, C.; Yin, G.; Zhang, Q.; Luo, J.; Wu, N. Aptamer-molecularly imprinted sensor base on electrogenerated chemiluminescence energy transfer for detection of lincomycin. Biosens. Bioelectron. 2017, 91, 687–691. [Google Scholar] [CrossRef] [PubMed]
  75. Kim, K.; Shin, K.S. Surface-enhanced Raman scattering: A powerful tool for chemical identification. Anal. Sci. 2011, 27, 775–783. [Google Scholar] [CrossRef] [Green Version]
  76. Knauer, M.; Ivleva, N.P.; Niessner, R.; Haisch, C. Optimized surface-enhanced Raman scattering (SERS) colloids for the characterization of microorganisms. Anal. Sci. 2010, 26, 761–766. [Google Scholar] [CrossRef] [PubMed] [Green Version]
  77. Wang, G.Q.; Lim, C.; Chen, L.X.; Chon, H.; Choo, J.; Hong, J.; deMello, A.J. Surface-enhanced Raman scattering in nanoliter droplets: Towards high-sensitivity detection of mercury (II) ions. Anal. Bioanal. Chem. 2009, 394, 1827–1832. [Google Scholar] [CrossRef] [PubMed]
  78. Shi, Q.; Huang, J.; Sun, Y.; Yin, M.; Hu, M.; Hu, X.; Zhang, Z.; Zhang, G. Utilization of a lateral flow colloidal gold immunoassay strip based on surface-enhanced Raman spectroscopy for ultrasensitive detection of antibiotics in milk. Spectroc. Acta Part A Mol. Biomol. Spectrosc. 2018, 197, 107–113. [Google Scholar] [CrossRef]
  79. Jiang, Y.; Sun, D.-W.; Pu, H.; Wei, Q. Ultrasensitive analysis of kanamycin residue in milk by SERS-based aptasensor. Talanta 2019, 197, 151–158. [Google Scholar] [CrossRef]
  80. Nguyen, A.H.; Ma, X.; Park, H.G.; Sim, S.J. Low-blinking SERS substrate for switchable detection of kanamycin. Sens. Actuator B Chem. 2019, 282, 765–773. [Google Scholar] [CrossRef]
  81. Ling, Y.; Fu, X.B.; Li, N.B.; Luo, H.Q. A label-free resonance rayleigh scattering sensor for detection of thrombin based on aptamer recognizing. Anal. Sci. 2018, 34, 881–886. [Google Scholar]
  82. Yan, S.; Lai, X.; Wang, Y.; Ye, N.; Xiang, Y. Label free aptasensor for ultrasensitive detection of tobramycin residue in pasteurized cow’s milk based on resonance scattering spectra and nanogold catalytic amplification. Food Chem. 2019, 295, 36–41. [Google Scholar] [CrossRef] [PubMed]
  83. Ouyang, H.; Liang, A.; Jiang, Z. A simple and selective resonance rayleigh scattering-energy transfer spectral method for determination of trace neomycin sulfate using cu2o particle as probe. Spectroc. Acta Part A Mol. Biomol. Spectrosc. 2018, 190, 268–273. [Google Scholar] [CrossRef] [PubMed]
  84. Xu, Y.; Lu, C.; Sun, Y.; Shao, Y.; Cai, Y.; Zhang, Y.; Miao, J.; Miao, P. A colorimetric aptasensor for the antibiotics oxytetracycline and kanamycin based on the use of magnetic beads and gold nanoparticles. Microchim. Acta 2018, 185, 548. [Google Scholar] [CrossRef] [PubMed]
  85. Ren, R.; Cai, G.; Yu, Z.; Tang, D. Glucose-loaded liposomes for amplified colorimetric immunoassay of streptomycin based on enzyme-induced iron(II) chelation reaction with phenanthroline. Sens. Actuator B Chem. 2018, 265, 174–181. [Google Scholar] [CrossRef]
  86. Zeng, R.; Tang, Y.; Zhang, L.; Luo, Z.; Tang, D. Dual-readout aptasensing of antibiotic residues based on gold nanocluster-functionalized mno2 nanosheets with target-induced etching reaction. J. Mater. Chem. B 2018, 6, 8071–8077. [Google Scholar] [CrossRef]
  87. Xu, C.; Ying, Y.; Ping, J. Colorimetric aggregation assay for kanamycin using gold nanoparticles modified with hairpin DNA probes and hybridization chain reaction-assisted amplification. Microchim. Acta 2019, 186, 448. [Google Scholar] [CrossRef]
  88. He, L.; Shen, Z.; Cao, Y.; Li, T.; Wu, D.; Dong, Y.; Gan, N. A microfluidic chip based ratiometric aptasensor for antibiotic detection in foods using stir bar assisted sorptive extraction and rolling circle amplification. Analyst 2019, 144, 2755–2764. [Google Scholar] [CrossRef]
  89. Ravikumar, A.; Panneerselvam, P. A novel fluorescent sensing platform based on metal-polydopamine frameworks for the dual detection of kanamycin and oxytetracycline. Analyst 2019, 144, 2337–2344. [Google Scholar]
  90. Yang, Q.; Hong, J.; Wu, Y.-X.; Cao, Y.; Wu, D.; Hu, F.; Gan, N. A multicolor fluorescence nanoprobe platform using two-dimensional metal organic framework nanosheets and double stirring bar assisted target replacement for multiple bioanalytical applications. ACS Appl. Mater. Interfaces 2019, 11, 41506–41515. [Google Scholar] [CrossRef]
  91. Youn, H.; Lee, K.; Her, J.; Jeon, J.; Mok, J.; So, J.I.; Shin, S.; Ban, C. Aptasensor for multiplex detection of antibiotics based on fret strategy combined with aptamer/graphene oxide complex. Sci. Rep. 2019, 9, 7659. [Google Scholar] [CrossRef] [Green Version]
  92. Ma, Y.; Jin, X.; Xing, Y.; Ni, G.; Peng, J. Construction of an NAND logic gate based on molecularly imprinted dual-emission quantum dot composites for the detection of antibiotics. Anal. Methods 2019, 11, 2033–2040. [Google Scholar] [CrossRef]
  93. Zeng, K.; Zhang, X.; Wei, D.; Huang, Z.; Cheng, S.; Chen, J. Chemiluminescence imaging immunoassay for multiple aminoglycoside antibiotics in cow milk. Int. J. Food Sci. Technol. 2020, 55, 119–126. [Google Scholar] [CrossRef]
  94. Shi, Q.; Huang, J.; Sun, Y.; Deng, R.; Teng, M.; Li, Q.; Yang, Y.; Hu, X.; Zhang, Z.; Zhang, G. A SERS-based multiple immuno-nanoprobe for ultrasensitive detection of neomycin and quinolone antibiotics via a lateral flow assay. Microchim. Acta 2018, 185, 84. [Google Scholar] [CrossRef] [PubMed]
  95. Zhou, L.; Gan, N.; Hu, F.; Li, T.; Cao, Y.; Wu, D. Microchip electrophoresis array-based aptasensor for multiplex antibiotic detection using functionalized magnetic beads and polymerase chain reaction amplification. Sens. Actuator B Chem. 2018, 263, 568–574. [Google Scholar] [CrossRef]
Figure 1. Structures of typical aminoglycosides (AGs).
Applsci 10 06579 g001
Figure 2. Illustration of optical detection methods for AGs.
Applsci 10 06579 g002
Figure 3. Typical turn-off fluorescent (FL) assays for the detection of AGs (reprinted with permission from [29] Copyright (2018) Elsevier).
Applsci 10 06579 g003
Figure 4. Representative (A) turn-on (reprinted with permission from [37] Copyright (2018) Elsevier) and (B) ratio FL detection for kanamycin based on fluorescence resonance energy transfer (FRET) (reproduced with permission from [39] Copyright (2019) Royal Society of Chemistry).
Applsci 10 06579 g004
Figure 5. Typical colorimetric assays (reprinted with permission from [51] Copyright (2018) Royal Society of Chemistry and [53] Copyright (2020) Royal Society of Chemistry).
Applsci 10 06579 g005
Figure 6. Schematic illustration of amplification strategies to improve the detection sensitivity of AGs (reprinted with permission from [20] Copyright (2019) Royal Society of Chemistry and [86] Copyright (2018) Royal Society of Chemistry).
Applsci 10 06579 g006
Table 1. Maximum residue limits (MRLs) of some AGs in different foods.
Name of AGsAnimalsDetection ObjectMRLs (µg kg−1)
U.S.E.U.ChinaJapan
StreptomycinCattleMuscle/fat/liver500500600600
Milk-200200200
NeomycinCattle/porkMuscle/fat/liver1200/-500500500
Milk1501500500500
ChickenEgg-500500500
KanamycinCattleMuscle/fat-100-40
liver-600-40
Milk-150-400
PorkMuscle-100-
fat-100-100
liver-600-100
ChickenEgg---500
GentamicinCattle/porkMuscle/fat10050100/400100
liver30020020002000
Milk-100200200

