1. Introduction
Human identification is one of the essential elements of forensic practice and investigation. This is optimally achieved through a close collaboration between forensic medicine, anthropology, and the judicial process; this collaboration needs to be materialized in laboratory methods (forensic, anthropological, genetic, craniofacial reconstruction) as well as in investigative methods (crime scene research, reconstitution, fingerprint, identification of personal objects, etc.). Human identification uses anthropological and laboratory methods in order to establish the identity of human remains, one of which is the reconstruction of the facial aspect from the skull.
In forensic practice, the skull helps perform several roles: establishing the subject’s identity, reflecting the age of the subject, indicating sex as well as facial appearances [
1]. Therefore, facial reconstruction depicts individual facial characteristics in order to help identify the person. In the facial reconstruction theory, all faces are unique, and the shape variation of the face is directly related to skeletal structure [
2,
3,
4,
5].
Human identification through facial appearance has preoccupied society for hundreds of years. The earliest example is the work of Alphonse Bertillon (1853–1914), a Parisian anthropologist who developed a system for recording detailed facial characteristics that could later be used for identification. Another pioneer was Mikhail Gerasimov (1907–1970), a Russian academic who carried out research relating to the morphology of the face and skull [
4]. Facial analysis includes three methods: morphological—comparison of facial characteristics in terms of shape and facial type; proportional—comparison of facial characteristics in terms of size and distance between certain skull points; anthropometrical—comparison of measurements of the face and skull [
6].
The anatomical relationship between soft and hard tissue can be established by means of radiological data—X-ray, computer tomography, nuclear magnetic resonance, etc. There are a number of recent publications that provide different imaging modalities for establishing the facial soft tissue thicknesses specific to different populations [
7,
8,
9,
10]. At an international level there is vast literature and research regarding this relationship as well as for the necessary parameters relating to craniofacial reconstruction. Thus, most countries (France, Brazil, Portugal, China, etc.) have conducted and are conducting numerous studies to develop methods for craniofacial reconstruction (based on computer-tomography images, cadavers, ultrasonography, etc.) and to establish the necessary correlations between bone and soft tissue specific to each population [
11,
12,
13,
14,
15].
Facial reconstruction methods use two important facial elements (nose and mouth), which define the aspect of the face and contribute to a higher accuracy of the reconstructed physiognomy. Therefore, in reconstructing these elements, multiple studies which are related to multiple prediction methods, are necessary for correctly establishing the relation between the hard tissue and soft tissue. In this sense, as we mentioned before, a lot of countries are developing their own database with these correlations. One study, which developed such correlations for all populations, was done by Rynn and Wilkinson. The study revealed the relation between hard and soft tissue of the nose; in this sense the authors developed regression formulas based on aperture dimensions and nasal craniometric points [
16].
Despite all these aspects, the Romanian population does not have any data on the relationship between soft and hard tissues in order to allow craniofacial reconstruction, as well as no data relating to the relationship between these tissues for the morphology of the nose. This data will allow, first of all, the alignment at an international standard of the forensic identification process, and secondly will help the development of research in forensics. Another important reason is the fact that Romania is a country with predisposition for disasters with multiple victims (earthquakes, flooding), but not only, situations where the identification process is primordial.
The main objective of this paper is to establish a correlation between the soft and hard tissues regarding the morphology of the nose specific to a Romanian adult population. In this direction, the authors endeavor to identify the maximum nose width (MNW) measured on the soft tissue based on the maximum width of nasal aperture (MNA) measured on the hard tissue.
2. Materials and Methods
The research is based on a retrospective study of 55 computer tomography (CT) images of the skull performed on living people aged 27–89 years (M = 60.95), SD = 16.53), of which 24 were females (43.6%) and 31 males (56.4%). The CT images were studied from the archives of a Neurosurgery Hospital in Iasi, Romania. Only the sex and age of the patients were considered in this research—no other details as to the identity of the person were targeted.
The practical procedures were carried out in accordance with the Declaration of Helsinki and the protocol was approved by the Ethical Committees of Grigore T. Popa Medicine and Pharmacy University and of the Neurosurgery Hospital (no. 9432/12 June 2020).
The inclusion criteria were represented by cases where the CT scans had over 60 slices (thus allowing the creation of 3D surfaces) and the images allowed the analysis and visualization of the whole nose region. Excluded from the present study were the cases where CT images showed fractures of the nasal bones or when the entire region of the nose could not be visualized, and it was not possible to correctly measure the nasal skull points.
The study was worked out at John Moores Liverpool University, Liverpool, United Kingdom for a period of two and a half months.
The resulting dataset consisted of 55 tomographic computer images that were worked on for the parameter maximum width of the nose. Images were processed using the InVesalius 3.0 software, creating separate surfaces (images) for both bone and soft tissue and exporting these images later as 3D images (obj. format). For analysis and reconstruction, the 3D images were imported into 3D Systems Free Form Modelling Plus Software using a Touch haptic feedback device. Freeform is a software with a high intelligence which can be applied in any sciences (medicine, engineering, etc.). Freeform features provide a high-level interface to a lot of representations. The purpose of freeform features is faster and more intuitive modelling with more guarantee for a high-quality design. Comparative with other ways of modelling, in freeform there is a better control over the 3D surface and it is easier to use, especially helping by touch haptic feedback device.
The above-mentioned steps allowed the import of all cases separately into FreeForm, with the skulls positioned in Frankfurt Horizontal Plane (FHP). This involves drawing a plane passing through the upper edge of the external acoustic meatus and the lower edge of the orbital rim, which being viewed from the interior, posterior, and lateral (right/left), must represent a straight line.
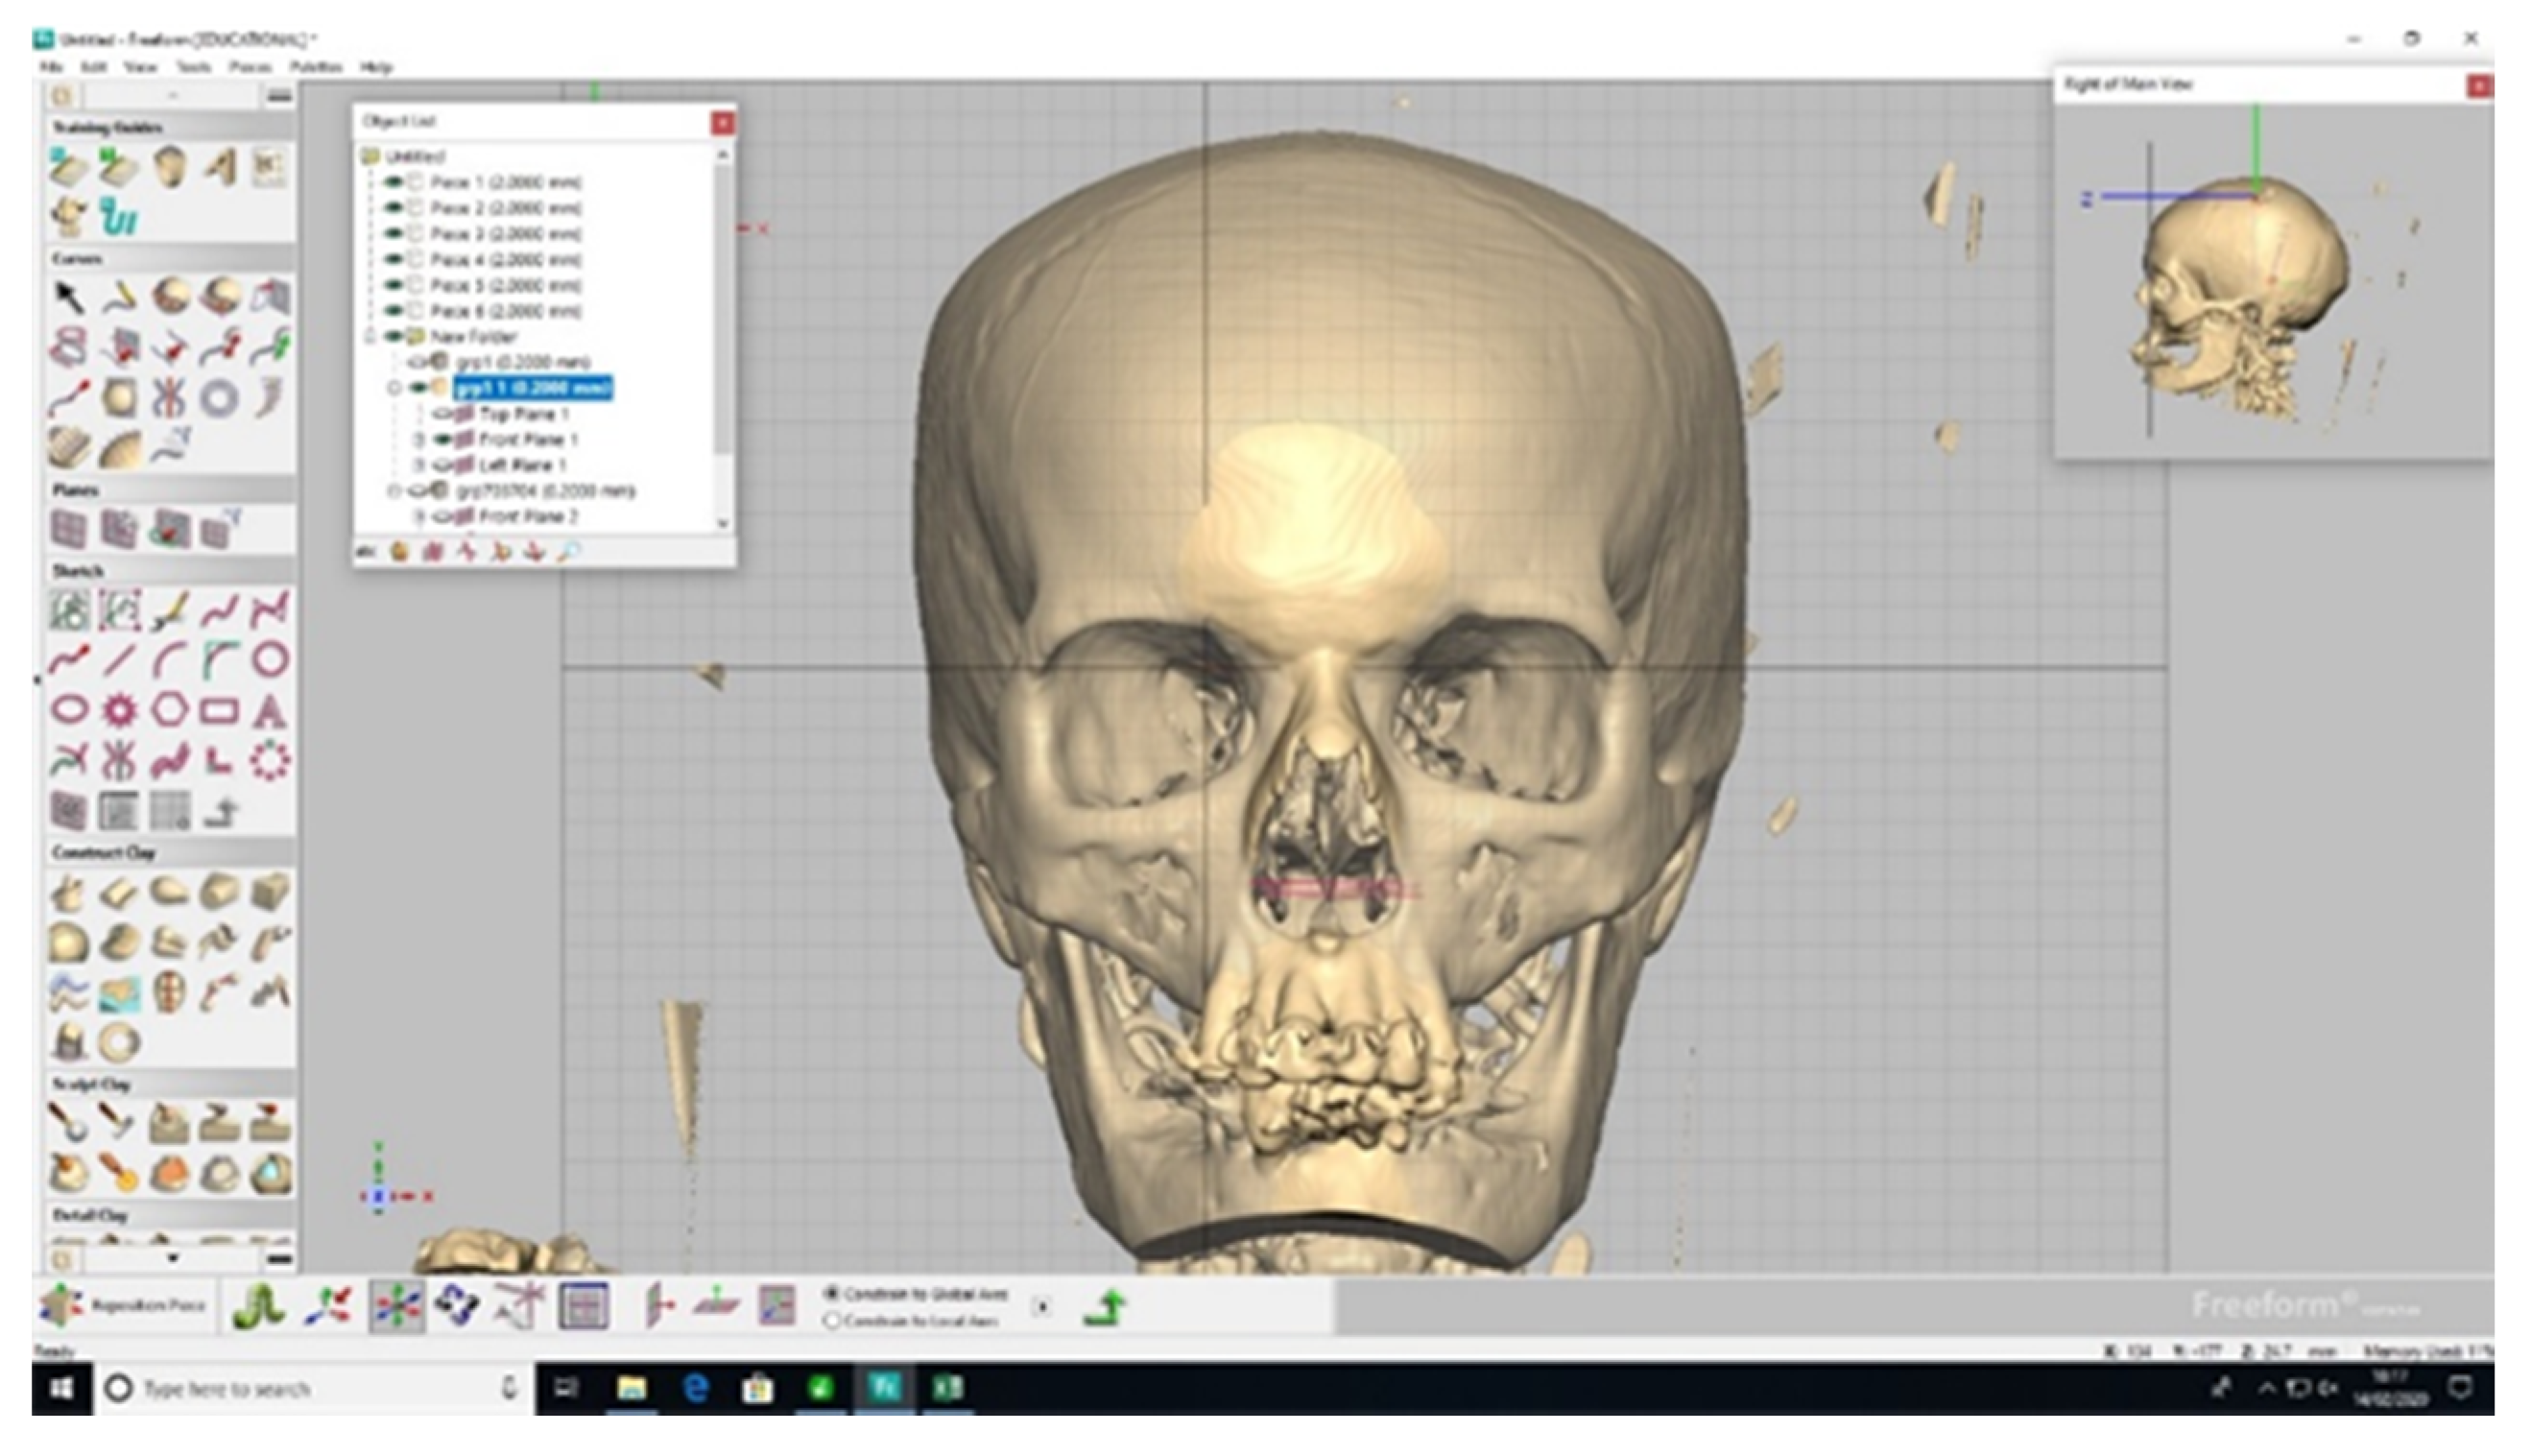
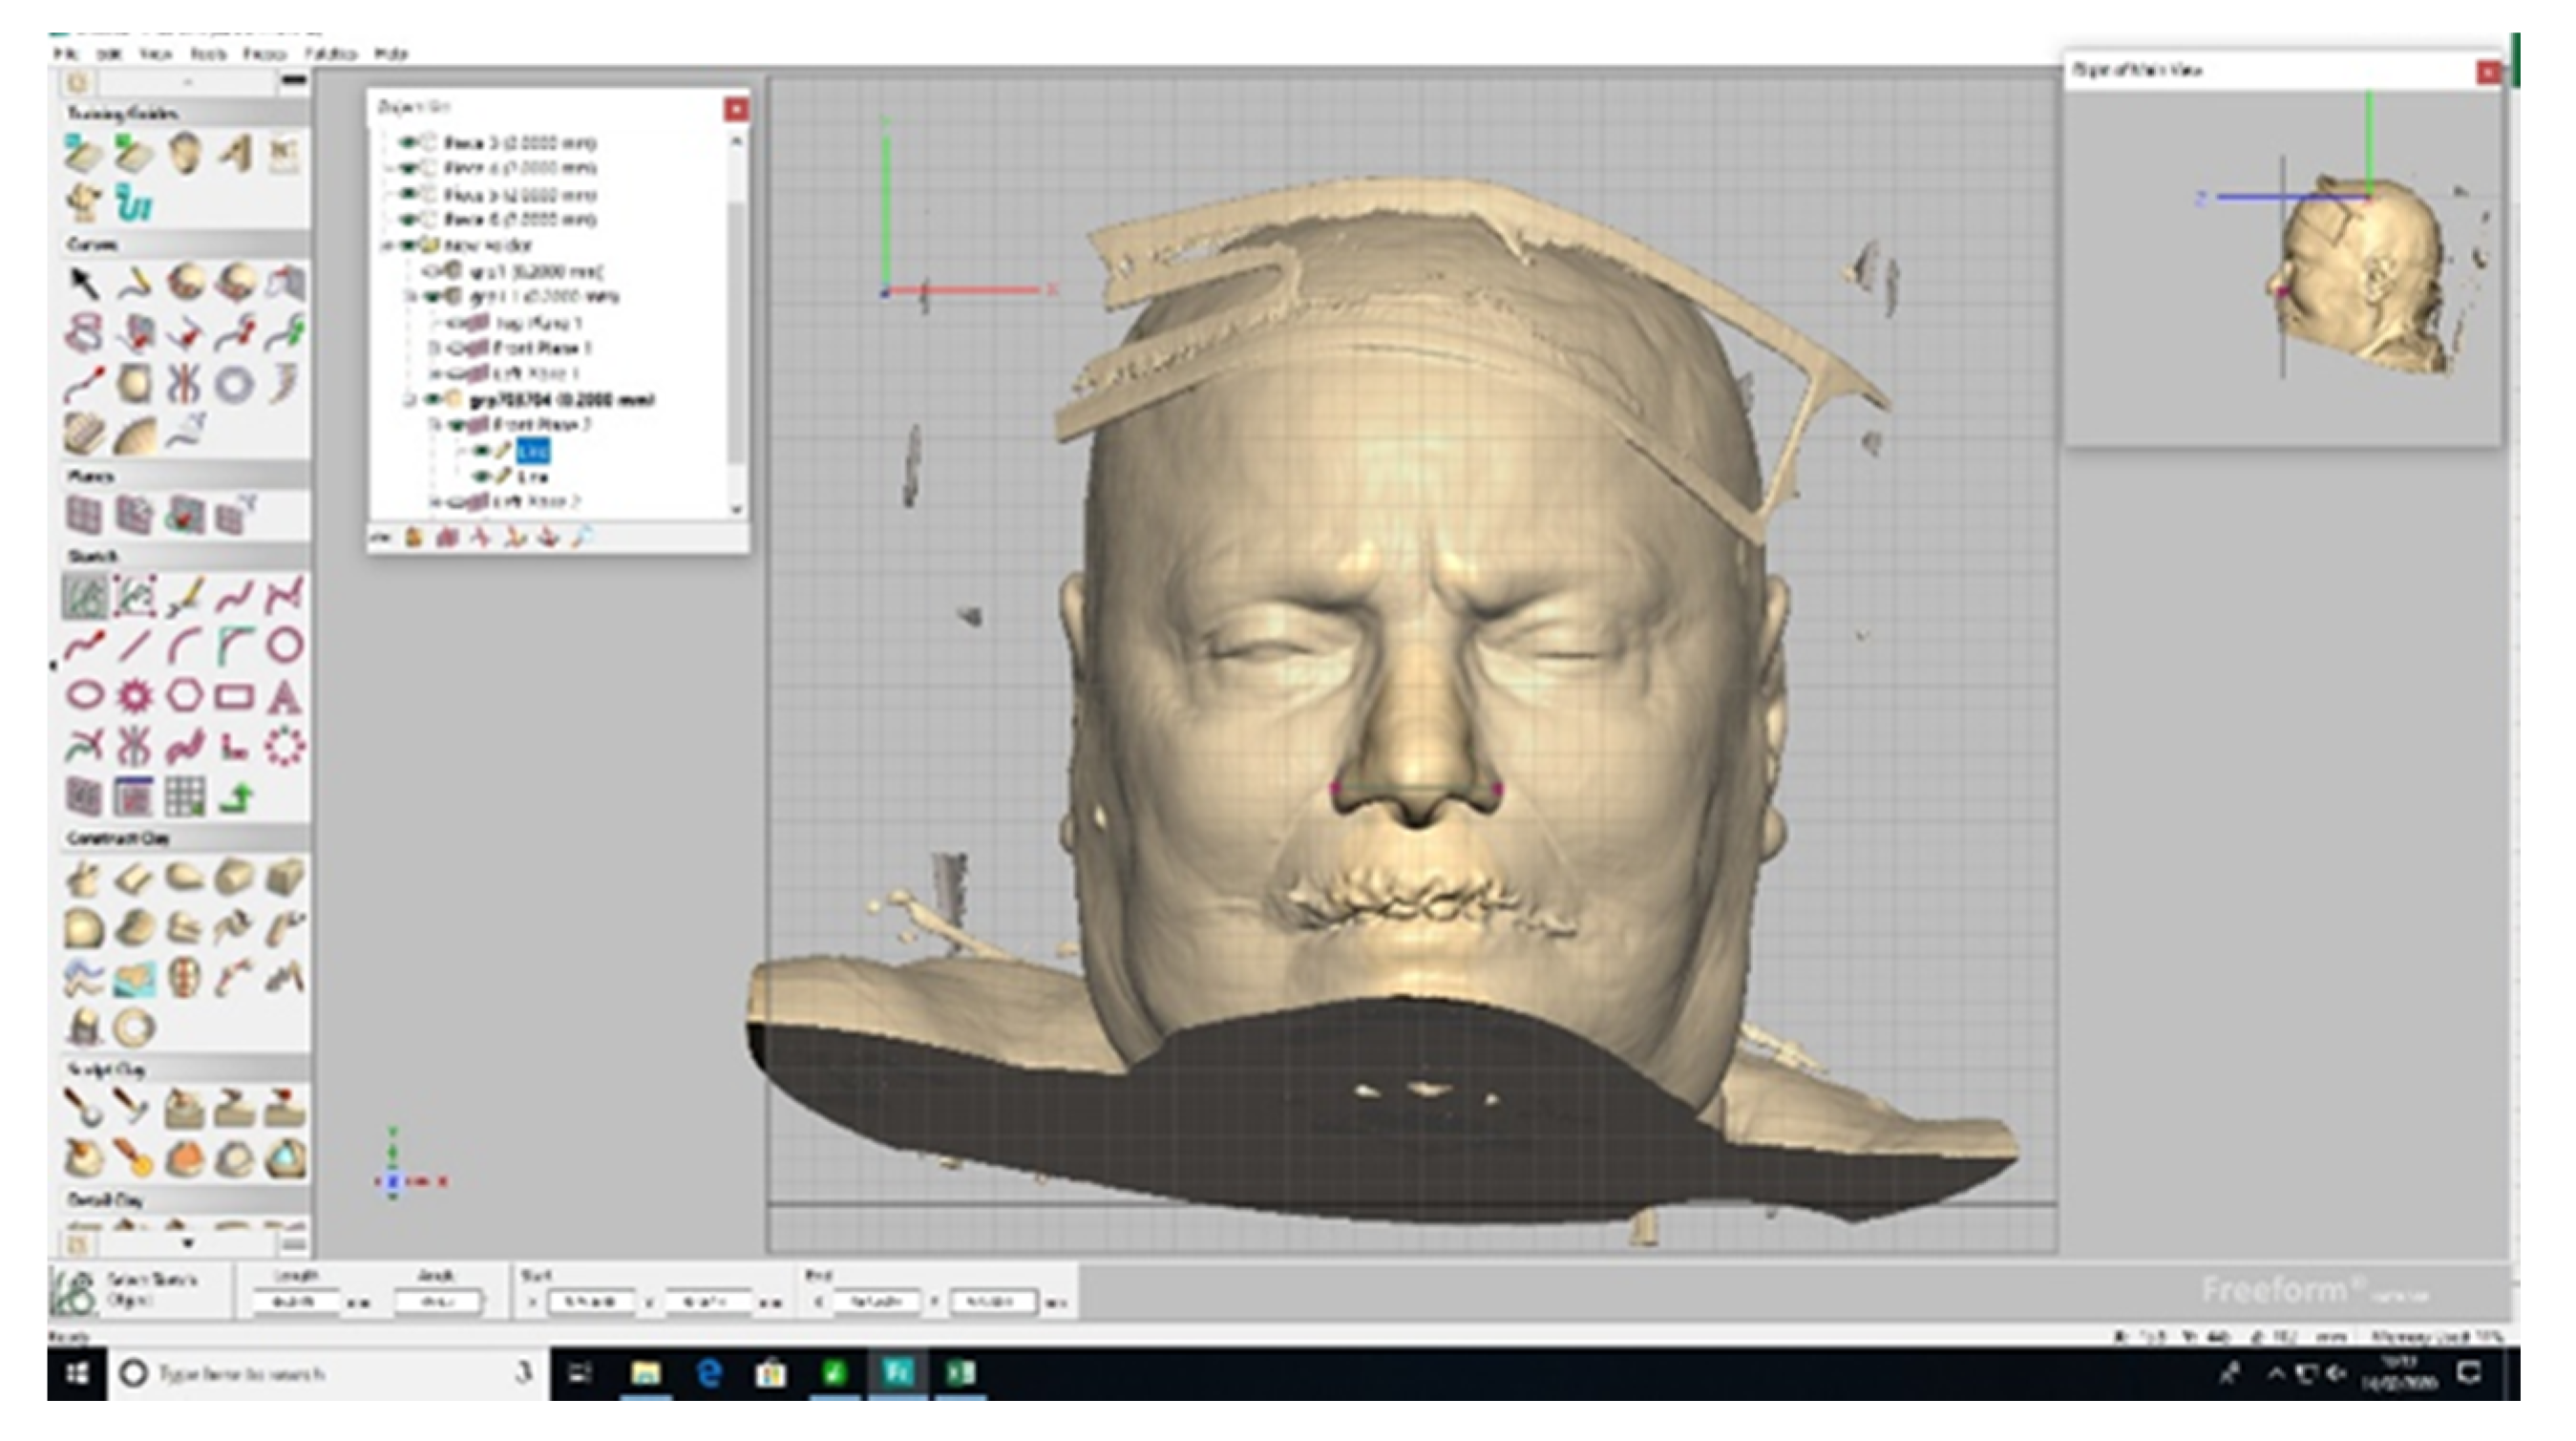
For the researched parameter, the maximum nose width (MNW) measurements were taken both on the skull and soft tissue. The measurements from the skull involved the maximum distance of the nasal aperture, for which the distance between the most lateral points of the aperture was taken into account (
Figure 1). The measurements taken on the soft tissue involved the calculation of the maximum distance of the nasal alae, between the most lateral points of the nasal alae (
Figure 2).
Thus, a series of measurements were made on hard tissue as well as soft tissue. For each parameter, we took two measurements and calculated an average of the two values; each measurement was made twice and rechecked. All the measurements used millimeters (mm) as measurement unit. Additionally, the intra-observer error (TEM) was calculated for a better evaluation of the two measurements which was performed by the same person. The value of TEM obtained following the methodology for TEM calculation is 0.341, which was classified as acceptable and shows that the variation between the two measurements suffers no influence of the systematic error.
The resulting database was analyzed using SPSS 3.0. Several statistical tests were performed in order to analyze the data. Kolmorov–Smirnov test was used to verify the normality of the statistical distribution. An independent samples T-test was performed to analyze sex difference regarding the maximum width of the nose and a repeated measures ANOVA was performed in order to compare the means for the maximum nose width calculated based on different regression formulas. Lastly, Pearson correlation indicated the relation between the variables and simple and multiple linear regression were conducted in order to provide linear regression equations.
3. Results
The Kolmogorov–Smirnov test indicated a normal distribution of variables: maximum width of the nose, maximum width of nasal aperture (p = 0.200).
The maximum width of the nose varies between 30.11 (mm) and 50.18 (mm), and the maximum width of the nasal aperture is between 17.84 and 28.16 (
Table 1). The results are presented separately for male and female participants in
Table 2.
A
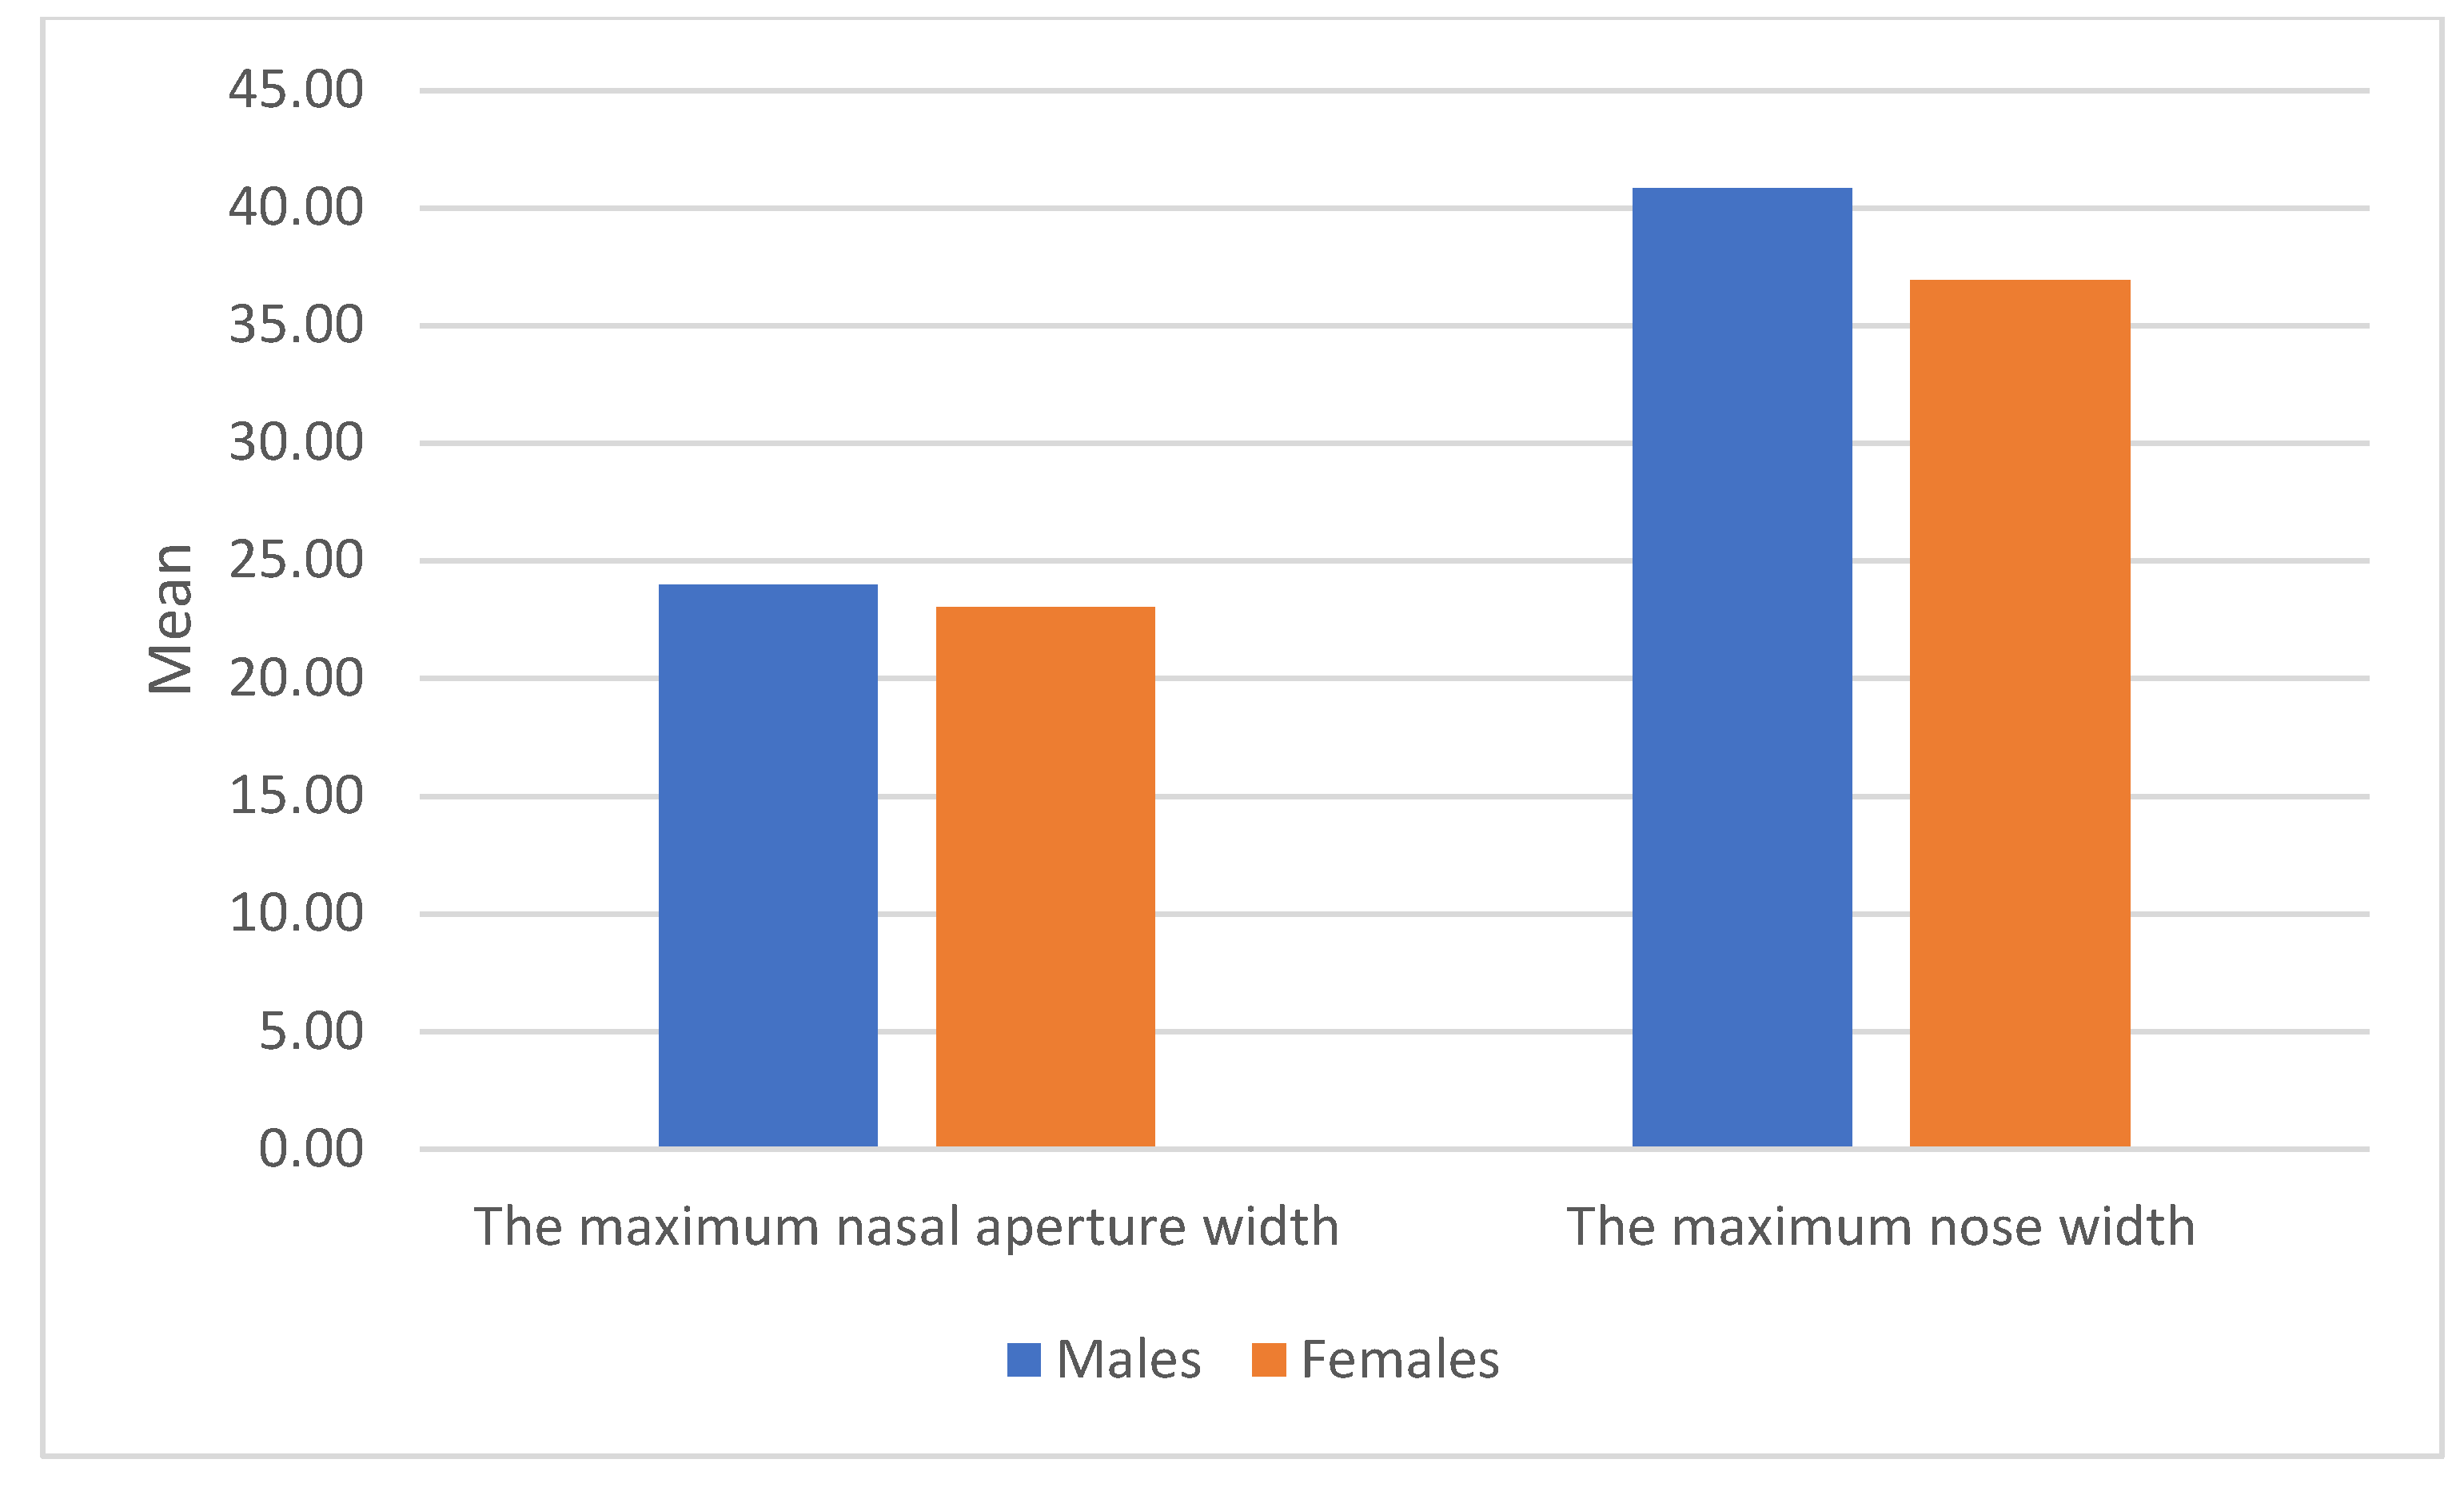
T-test showed significant differences between females and males for the maximum width of the nose (t (53) = −3.76,
p < 0.001). In this respect, the maximum width of the nose for males (M = 40.84, SD = 4.32) is significantly higher than that of females (M = 36.95, SD = 3.02) (
Figure 3).
A
T-test showed that there are no significant differences between males and females for the maximum width of the nasal aperture (t (53) = −1.859,
p = 0.069) (
Figure 3).
3.1. Correlational Analysis
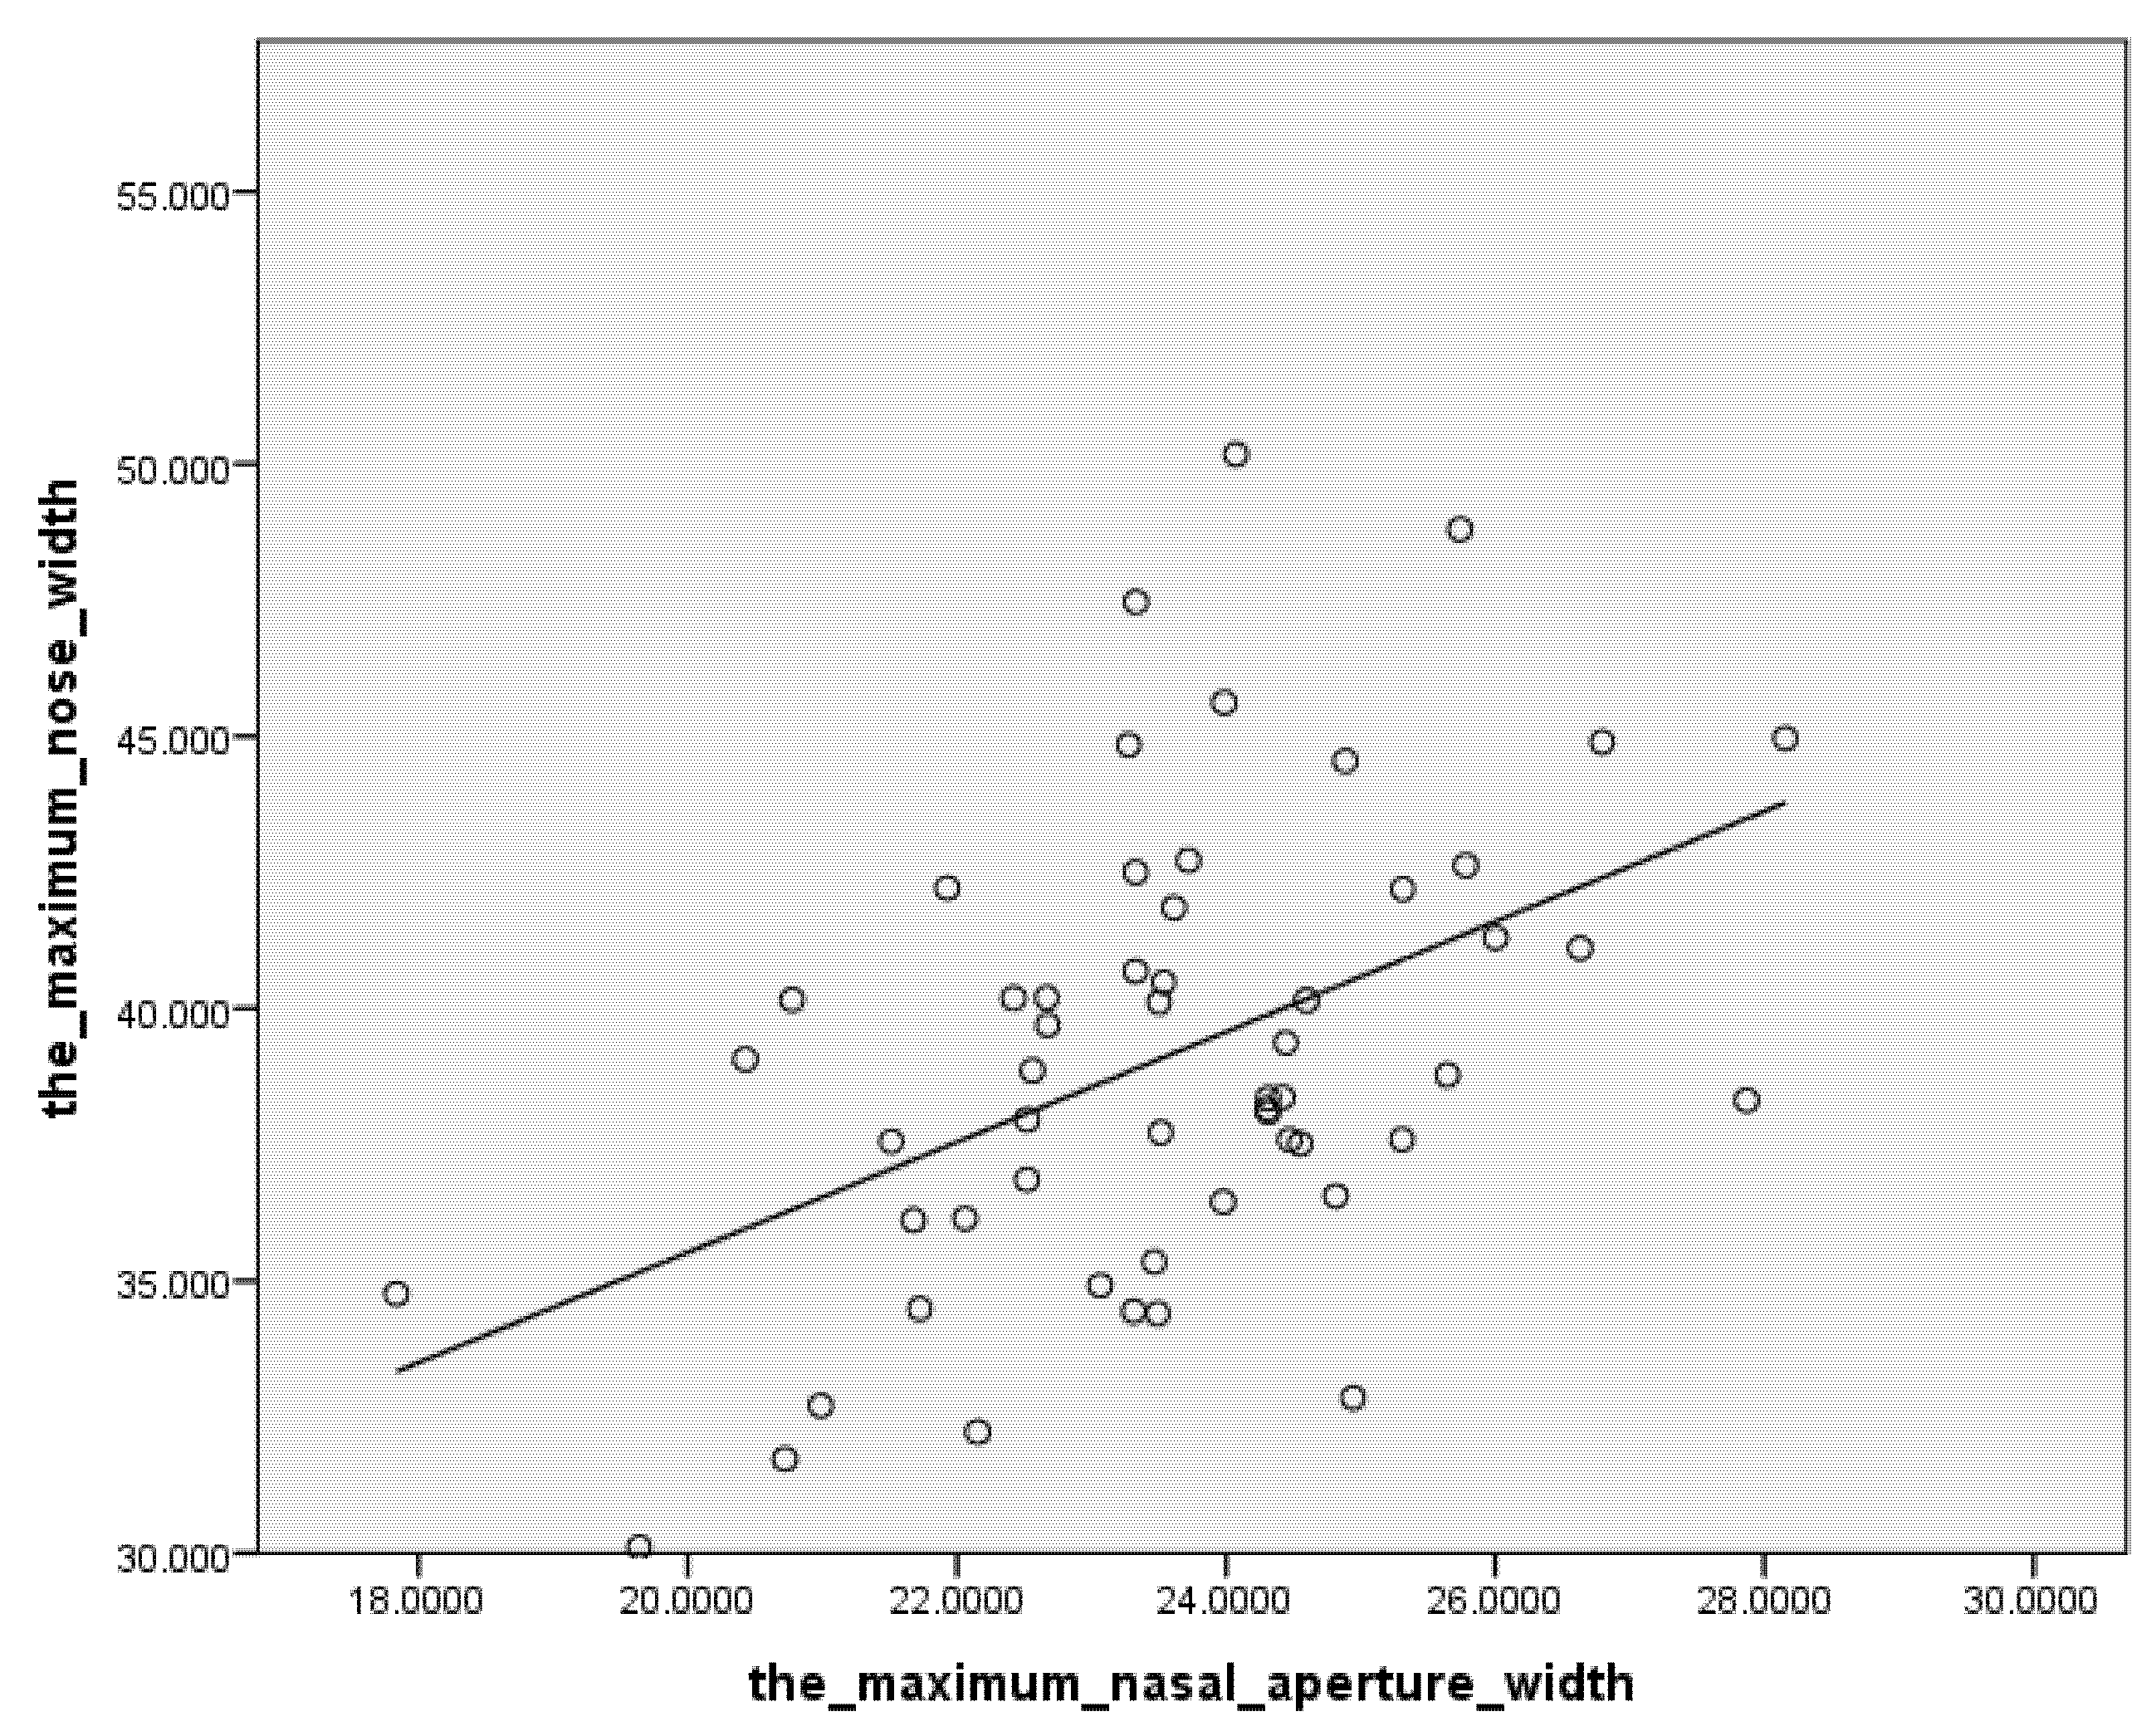
Correlational analysis indicated a significantly moderate link between the maximum width of the nasal aperture and maximum width of the nose. The partial correlation between the maximum width of the nasal aperture and the maximum width of the nose, by controlling the sex of the participants, was carried out. In this respect, the greater the maximum width of the nasal aperture, the greater the maximum width of the nose (
Table 3).
There was no significant link between the age of the participants and the maximum width of the nose (r (53) = 0.101, p = 0.462).
3.2. Regression Analysis
Regression analysis showed that the maximum width of the nasal aperture and sex form a statistically significant regression pattern (F (2, 52) = 13.39,
p < 0.001), which explains a proportion of 34% (R
2 = 0.340) of the variance of the maximum width of the nose. We found that sex predicts 21.1% of the variance of the maximum width of the nose (R2 = 0.211,
p < 0.001) and the maximum width of the nasal aperture brings a significant explanatory addition of 12.9% (R2 change = 0.129,
p = 0.002). (
Table 4). SEE have small values indicating that the observations are closer to the fitted line.
Within the predictive model, the most important predictor of the maximum width of the nose is the maximum width of the nasal aperture (β = 0.371, p = 0. 002), followed by the sex of the participant (β = 0.367, p = 0.003).
The regression analysis showed that the maximum width of the nasal aperture statistically predicts the maximum width of the nose (F (1, 53) = 14.37,
p < 0.001) and explains a proportion of 21.3% (R2 = 0.213) of the variance of the maximum width of the nose (
Table 5).
The regression equation with sex: maximum width of the nose = 18.22 + 0.813* maximum width of the nasal aperture + 3.115*sex, for sex: male is represented by code 1, and female by code 0. (
Table 6).
The simple regression equation (without sex) (
Table 6):
All conditions of simple and multiple linear regression are met. Statistical analysis demonstrates the fact that the regression analysis is correct, with the homoscedasticity being present. Additionally, it can be observed that the errors are normally distributed, which means the regression equation is correct. All these prove that we can rely on both regression equations with precise results (
Figure 4).
3.3. Analysis of the Differences between the Real Values of the Maximum Width of the Nose and the Values Calculated Based on the Regression Formulas
Regarding the repeated measures ANOVA, for applying the test a GLM (general linear model) type was used and it shows that there are no statistically significant differences between the original values for maximum nose width measured on the Romanian population F(3, 162) = 0.394,
p = 0.758) the values resulting from the current formulas (simple—without inclusion of sex; multiple—including the sex) and the values resulting from the regression formula developed by Rynn and Wilkinson (
Table 7).
The
T-test analysis for paired echantions shows that there are no statistically significant differences between the original values for maximum nose width measured on the Romanian population, the values resulting from the current formulas (simple—without inclusion of sex; multiple—including the sex), and the values resulting from the regression formula developed by Rynn and Wilkinson (
Table 7).
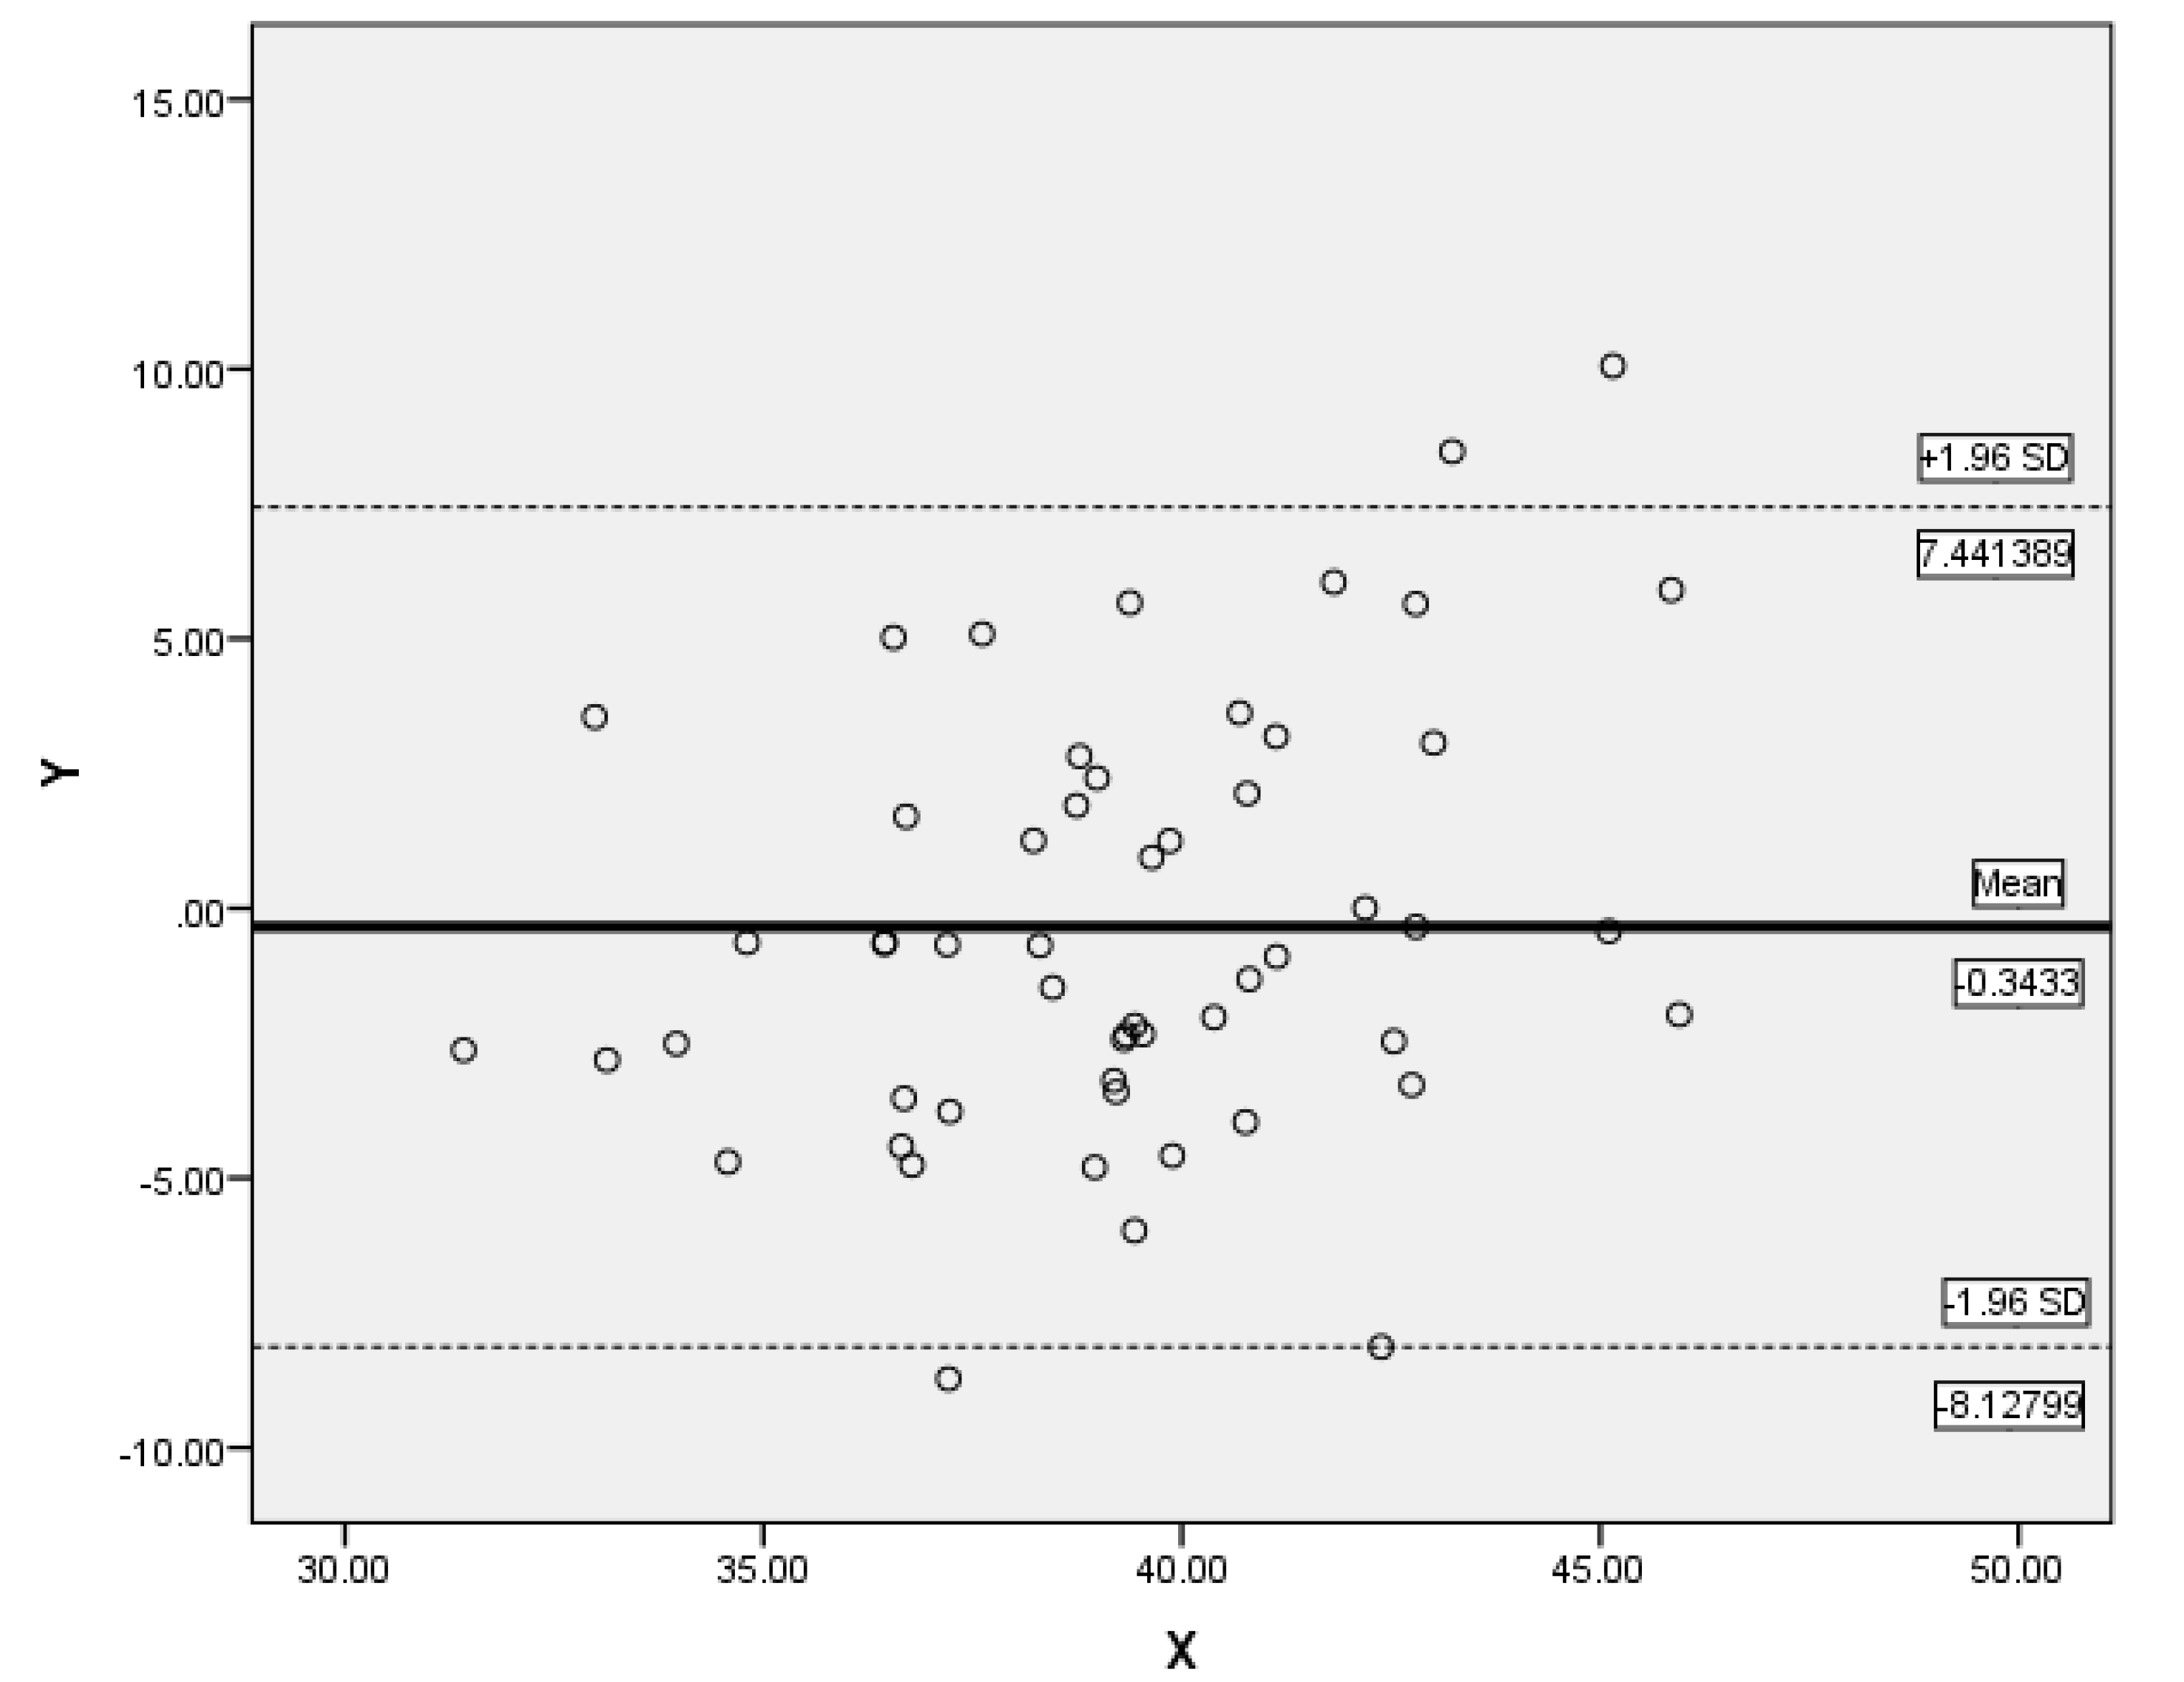
For another line of evidence of the differences between the original values and values resulting from the regression formula developed by Rynn and Wilkinson, the Altman–Bland plot analysis was performed, which shows that there are no significant differences between the two values and that there are not many extreme cases, which shows that the regression is adequate (
Figure 5).
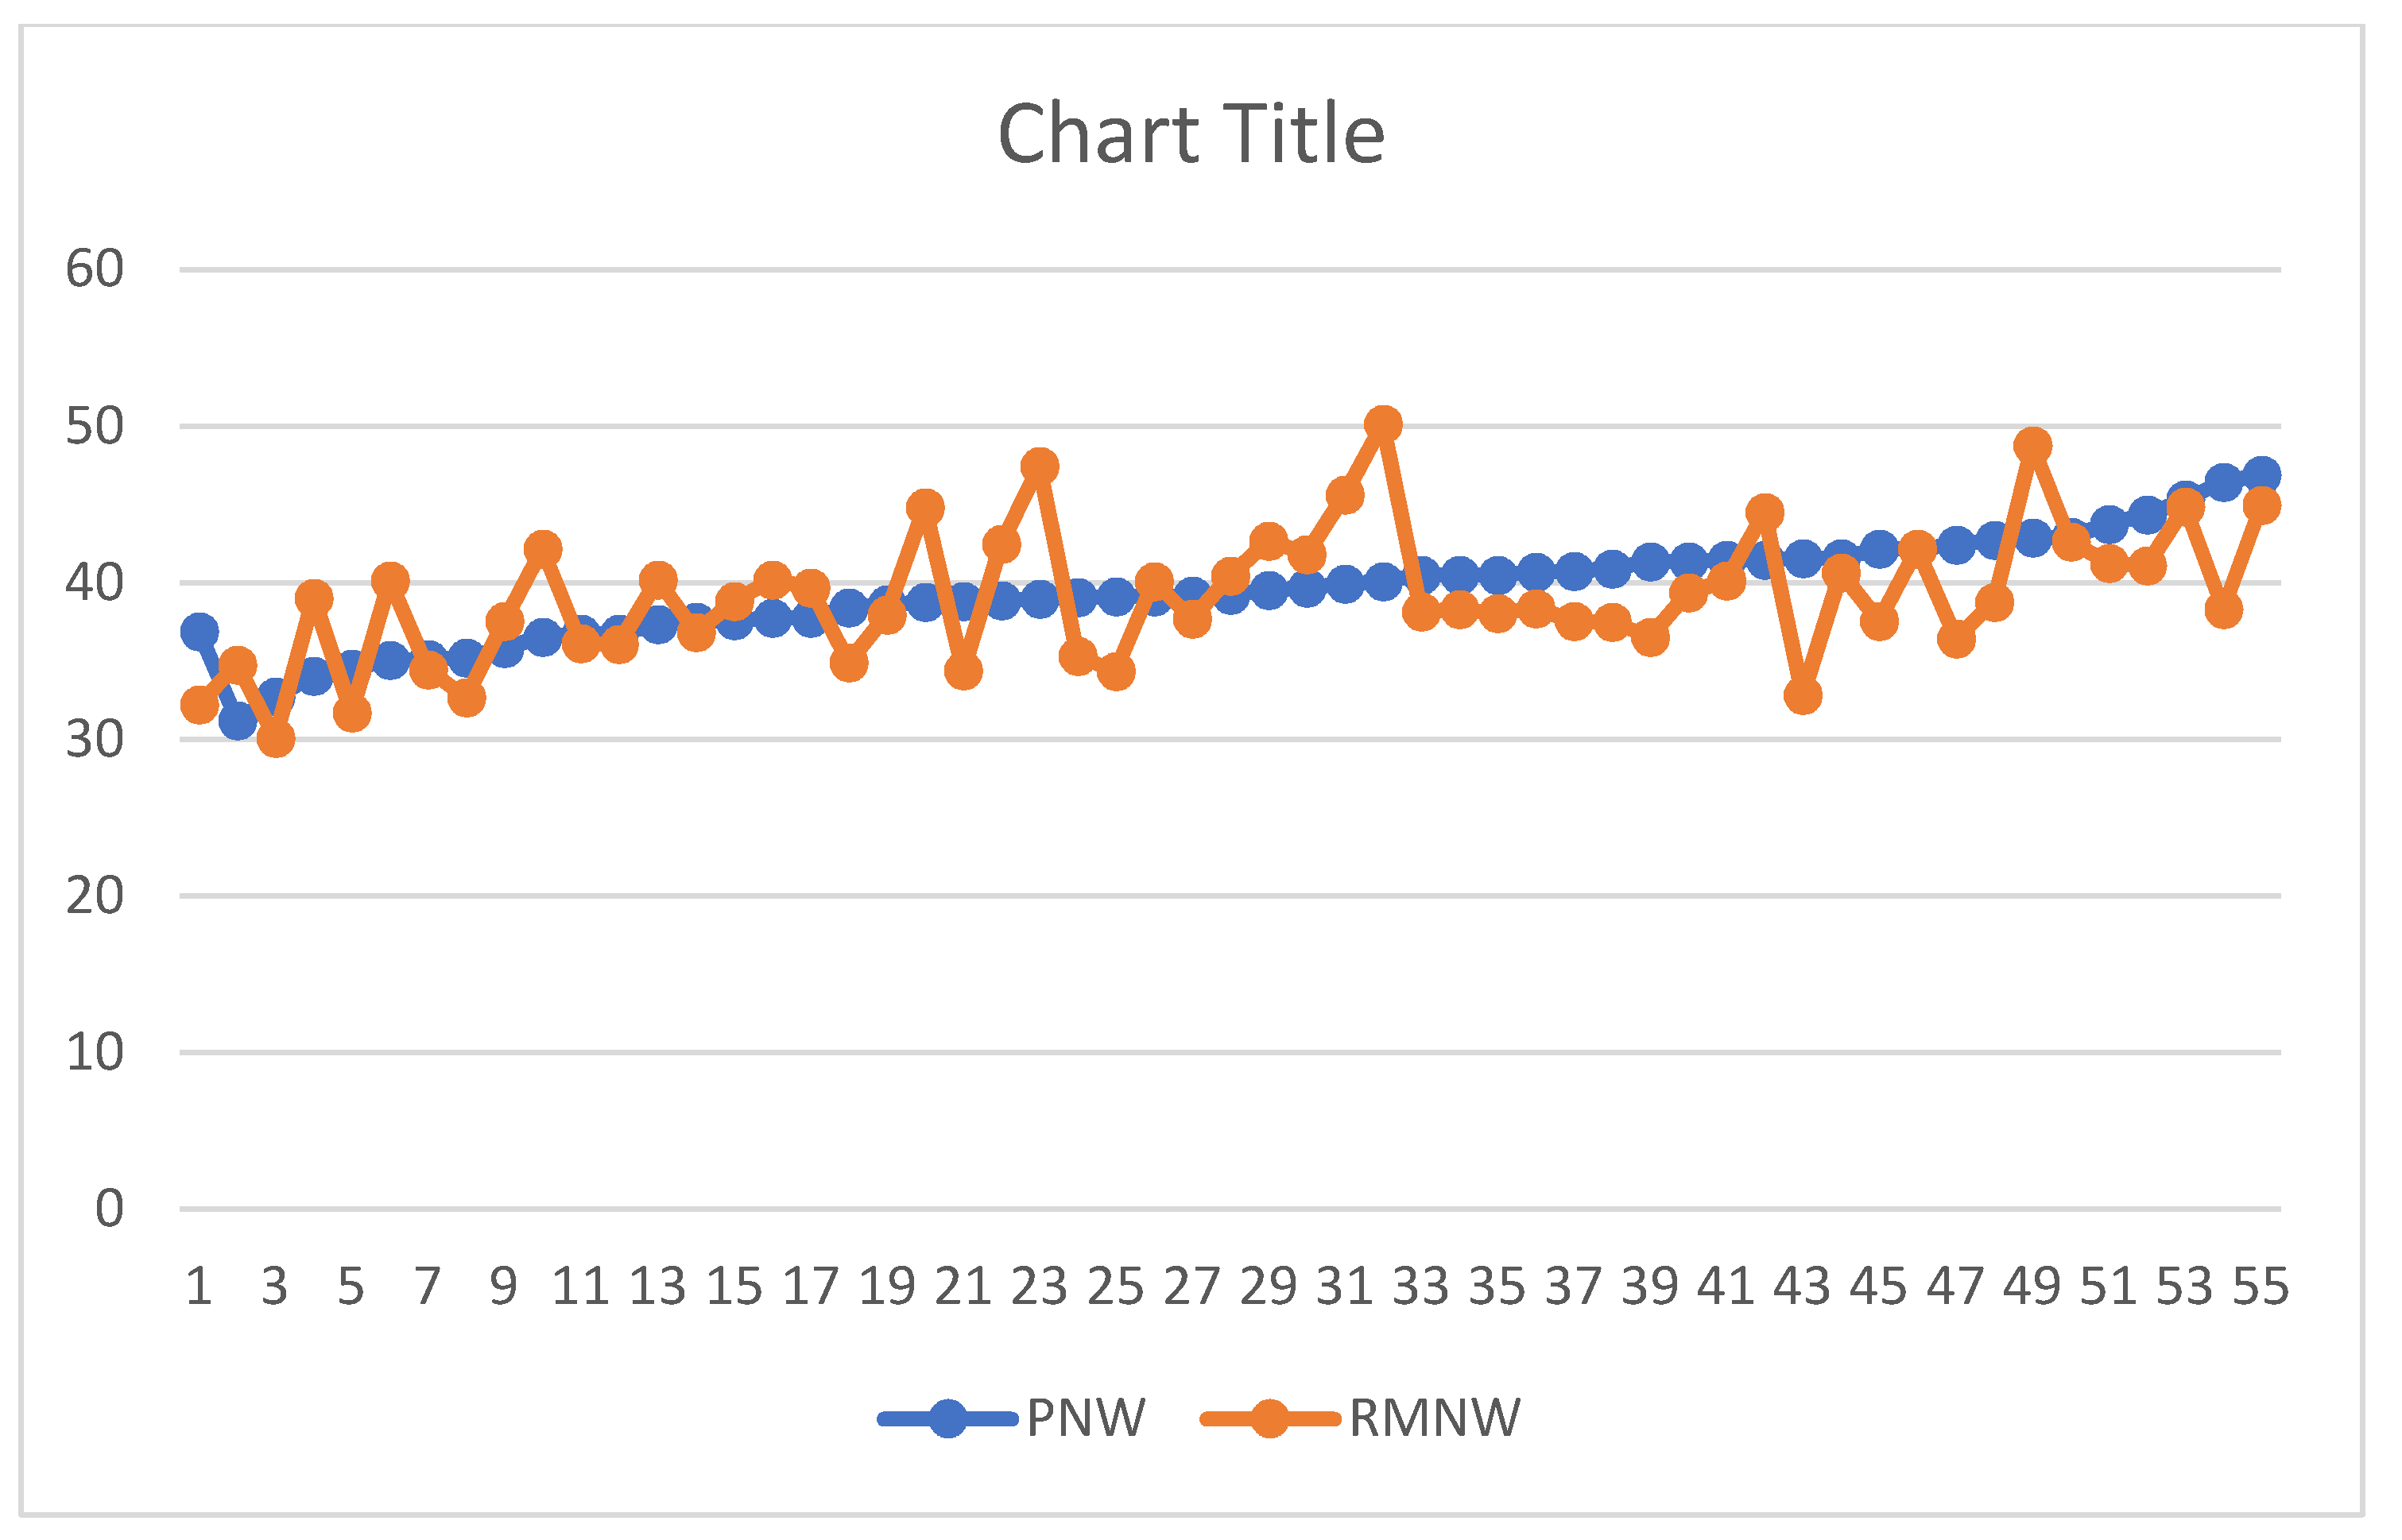
Our analysis found a threshold of marginal significance approaching the standard threshold (
p = 0.05), which may indicate possible differences between the two types of values (the ones resulting from the formula developed by Rynn and colleagues being higher) (
Figure 6).
4. Discussion
Craniofacial reconstruction is currently the elective method in identifying victims, based on examination of the skull. The purpose of craniofacial reconstruction is therefore to create an image as close as possible to that of the individual before death, thus allowing skeletal identification in the absence of other means of identification or helping to guide it.
In order to be able to perform the technique of craniofacial reconstruction and, implicitly, to obtain an image as reliable and as close to reality as possible, it is necessary to know the thickness of soft tissues in specific locations (cheeks, chin, nose, lips, eyes, forehead). This parameter requires a wealth of research carried out on specific populations [
8,
9,
10,
11,
12,
13,
14]. In this respect, the objective of the present study was to analyze the relationship between hard tissue and soft tissue with regard to the maximum width of the nose, a first parameter in the construction of the morphological aspect of the nose [
17].
The objective pursued in this paper was achieved, the results providing both a normal distribution of variables and a significant relationship between the hard tissue and soft tissue; thus, the thickness and morphology of soft tissues are dependent on skeletal structure. This helps the craniofacial reconstruction process.
The interest of this research work in facial reconstruction is given primarily by the originality of the work at national level, in Romania, the craniofacial reconstruction being a completely new field in legal medicine in this country. As a result of the above, it goes without saying that there are currently no valid data on the correlation between soft and hard tissue specific to the Romanian population. Thus, the present paper represents an important contribution in the field of the identification process in legal medicine by introducing craniofacial reconstruction methods as well as presenting data specific to the adult population of Romania. At the same time, the craniofacial reconstruction process is an important aspect for the progress of knowledge and research in the field of identification and, implicitly, forensic anthropology. Even if craniofacial reconstruction is a separate work area, or can be considered a separate area, it could represent, in legal medicine, a final complementary examination for anthropological expertise on deceased persons (skeleton, skull, bone remains, etc.) [
18].
The literature mentions that the anatomical relations between soft and skeletal tissues can be obtained using imaging methods: X-ray, computer tomography, magnetic resonance, or ultrasonography [
19,
20,
21]. In the present study, the authors chose the cranio-cerebral tomographic computer images as working material to obtain accurate data for the relationship between soft tissue and bone for the morphology of the nose. The advantages of using the computer tomography images are as follows: (i) they offer a better view of the bone compared to MRI or ultrasonography; (ii) are much easier to interpret and do not require exhaustive knowledge in radiology; (iii) the available database is larger [
22,
23].
In the study conducted by Rynn and Wilkinson, the authors addressed this topic by developing regression formulas for the morphology of the nose (maximum width of the nose, length, height, projection, and more) valid for the white Caucasoid population. In the aforementioned study, the participating subjects consisted of Northern Brits and white Americans. Rynn and Wilkinson noted that the maximum width of the nose (predicted nose width) represents the maximum width of the nasal aperture/3 × 5, without taking into account the sex or age of the subjects included in the study [
16].
Initially, we compared the results of the research carried out by Rynn and colleagues on a new adult Romanian population. According to the results of the present study, there are differences between the actual value of the maximum width of the nose and the maximum width of the nose predicted by the regression equation developed by Rynn and Wilkinson (
Table 7,
Figure 6). Therefore, the authors developed a regression formula to predict the aforementioned parameter specific to the adult population of Romania. This research needs to be continued and validated on a larger number of participants.
The results confirm the close relationship between the maximum width of the nasal aperture and the maximum width of the nose, the bone being a significant predictor for the morphology of soft tissue (
Table 3). At the same time the statistical analysis carried out shows that in the case of the adult population of Romania, the sex of the individual is also an important predictor for estimating the maximum width of the nose starting from the maximum distance of the nasal aperture.
Figure 6 highlights the differences between the real values of the maximum nose width of the Romanian adult population and the values resulting from the Rynn and colleague’s formula (the predicted nose width).
Figure 6 also shows that the values predicted according to the regression equation that includes the sex of the participants developed in this research are the closest, one can even say similar to the actual values of the maximum nose width of the adult population of Romania. The second set of values, those predicted as a result of the simple regression equation without taking into account the sex of the participants is slightly larger, but also close to the actual values. These may be important in cases where sex cannot be estimated accurately and we can use only the simple equation, without expecting significant errors.
The literature mentions that the nasal morphology interacts statistically with age of the participants, especially for the parameters which outline the nasal structure (the anterior projection, the height and length of the nose) [
16,
19]. One study shows a small increasing of the piriform aperture and of the nasal width for each 10 years [
7,
24]. In our study, this difference is not applicable because the age is not a predictable factor for maximum width of the nose or for maximum width of the aperture, as resulting from the statistical analysis. Regarding sex as a factor that has been suggested to affect the morphology of the maximum width of the nose, our study confirms the results from the literature [
23,
24].
In this research, the authors developed two types of regression formulas to estimate the maximum width of the nose: a regression formula that includes the sex of the participants as well as a regression formula without including the sex of the participants. Both regression formulas have the same mean (
Table 7) and slightly different standard deviations, and
Figure 6 shows that the results of the two regression formulas have similar values.
The regression formula generated from this database, specific to the adult population of Romania regarding the maximum width of the nose, has the advantage that it is easy to use as measurements can be made either using a computer tomographic image or even directly on the available skull. It can also be used for 2D and 3D facial reconstruction.
We would like to underline the most important aspect of the study: the authors developed two regression equations for estimating the maximum nose width for Romanian adult population (one including the sex of the person, another one without it). This is an essential aspect for the future of Romanian anthropological research in general, and facial reconstruction in particular. Future research should be carried out based on the measurements of more landmarks and of more anatomical components of the facial skull and from other radiological data.
5. Conclusions
The results of the study show that each population is different. Additionally, the intense populational migration in recent years creates an increase in mixed populations in various parts of the globe. This proves the need for intensive studies and the development of new research for each type of population. Of course, new studies on the adult population of Romania are needed on a much larger number of cases, both for the morphology of the nose and for other anatomical components of the facial mass. The data used in this paper provides reliable results with a large applicability in the future for estimating the maximum nose width in facial reconstruction for Romanian adult populations. This paper is a good start in the development of the forensic facial reconstruction studies for Romanian adult populations.
Author Contributions
Conceptualization and design, C.W., M.M.D. and D.B.I.; methodology, M.M.D., S.S. and A.K.; software, M.M.D., S.S. and M.C.-R.; statistical analysis, M.M.D., S.S., M.C.-R.; data curation, M.M.D., S.I.D. and T.I.; writing—original draft preparation, M.M.D.; writing—review and editing, M.M.D., S.S., M.C.-R., K.E., C.W. and D.B.I.; supervision, C.W. and D.B.I. All authors have read and agreed to the published version of the manuscript.
Funding
This research was partially supported by COST, within MULTI-modal Imaging of FOREnsic SciEnce Evidence-tools for Forensic Science program, Action Number CA16101.
Acknowledgments
The authors thank the FaceLab team, John Moores University, Liverpool, UK for invaluable support and research facilities.
Conflicts of Interest
The authors declare no conflict of interest.
References
- Wilkinson, C. Forensic Facial Reconstruction; Cambridge University Press: New York, NY, USA, 2004; pp. 6–27. [Google Scholar]
- Wilkinson, C. Computerized Forensic Facial Reconstruction a Review of Current Systems. Forensic Sci. Med. Pathol. 2005, 1, 173–177. [Google Scholar] [CrossRef]
- Gupta, S.; Gupta, V.; Vij, H.; Vij, R.; Tyagi, N. Forensic Facial Reconstruction: The final frontier. J. Clin. Diagn. Res. 2015, 9, 26–28. [Google Scholar] [CrossRef] [PubMed]
- Drgacova, A.; Dupej, J.; Veleminska, J. Facial soft tissue thicknesses in the present Czech population. Forensic Sci. Int. 2016, 260, 106.e1–106.e7. [Google Scholar]
- Guyomarch, P.; Santos, F.; Dutailly, B.; Coqueugniot, H. Facial soft tissue depths in French adults: Variability, specificity and estimation. Forensic Sci. Int. 2013, 231, 411.e1–411.e10. [Google Scholar] [CrossRef] [PubMed]
- Verze, L. History of facial reconstruction. Acta Biomed 2009, 80, 5–12. [Google Scholar]
- Chen, F.; Chen, Y.; Yu, Y.; Qiang, Y.; Liu, M.; Fulton, D.; Chen, T. Age and sex related measurement of craniofacial soft tissue thickness and nasal profile in the Chinese population. Forensic Sci. Int. 2018, 212, 272.e1–272.e6. [Google Scholar] [CrossRef]
- Stephan, C.N.; Sievwright, E. Facial soft tissue thickness (FSTT) estimation models-and the strength of correlations between craniometric dimensions and FSTTs. Forensic Sci. Int. 2018, 286, 128–140. [Google Scholar] [CrossRef]
- De Greef, S.; Claes, P.; Vandermeulen, D.; Mollemans, W.; Suetens, P.; Willems, G. Large-scale in-vivo Caucasian facial soft tissue thickness database for craniofacial reconstruction. Forensic Sci. Int. 2006, 1595, S126–S146. [Google Scholar] [CrossRef]
- El-Mehallawi, I.H.; Soliman, E.M. Ultrasonic assessment of facial soft tissue thicknesses in adult Egyptians. Forensic Sci. Int. 2001, 117, 99–107. [Google Scholar] [CrossRef]
- Claes, P.; Vandermeulen, D.; De Greef, S.; Willems, G.; Clement, J.G.; Suetens, P. Computerized craniofacial reconstruction: Conceptual framework and review. Forensic Sci. Int. 2010, 201, 138–145. [Google Scholar] [CrossRef]
- Ridel, A.F.; Demeter, F.; Liebenderg, J.; L’Abbe, E.N.; Vadermeulen, D.; Oettle, A.C. Skeletal dimensions as predictors for the shape of the nose in a South African sample: A cone-beam computed tomography (CBCT) study. Forensic Sci. Int. 2018, 289, 18–26. [Google Scholar] [CrossRef] [PubMed]
- Chung, J.H.; Chen, H.T.; Wan-Yi, H.; Huang, G.S.; Shaw, K.P. A CT-scan database for the facial soft tissue thickness of Taiwan adults. Forensic Sci. Int. 2015, 253, 132.e1–132.e11. [Google Scholar] [CrossRef] [PubMed]
- Bulut, O.; Sipahioglu, S.; Hekimoglu, B. Facial soft tissue thicknesses database for craniofacial reconstruction in the Turkish adult population. Forensic Sci. Int. 2014, 242, 44–61. [Google Scholar] [PubMed]
- Sipahioglu, S.; Uluay, H.; Diren, H.B. Midline facial soft tissue thickness database of Turkish population: MRI study. Forensic Sci. Int. 2012, 219, 282.e1–282.e8. [Google Scholar] [CrossRef] [PubMed]
- Rynn, C.; Peters, H.L.; Wilkinson, C. Prediction of nasal morphology from the skull. Forensic Sci. Med. Pathol. 2010, 6, 20–34. [Google Scholar] [CrossRef]
- Tedeschi-Oliveira, S.V.; Haltenhoff Melani, R.F.; Haddad de Almeida, N.; Saavedra de Paiva, L.A. Facial soft tissue thickness of Brazilian adults. Forensic Sci. Int. 2009, 193, 127.e1–127.e7. [Google Scholar] [CrossRef]
- Wilkinson, C.; Motwani, M.; Chiang, E. The relationship between the soft tissues and the skeletal detail of the mouth. J. Forensic Sci. 2003, 48, 1–5. [Google Scholar] [CrossRef]
- Paim Strapasson, R.A.; Herrera, L.M.; Haltenhoff Melani, R.F. Forensic facial reconstruction: Relationship between the alar cartilage and piriform aperture. J. Forensic Sci. 2017, 10, 1–6. [Google Scholar] [CrossRef]
- Haddad de Almeida, N.; Michel-Crosato, E.; Saavedra de Paiva, L.A.; Haye Biazevic, M.G. Facial soft tissue thickness in the Brazilian population: New reference data and anatomical landmarks. Forensic Sci. Int. 2013, 231, 404.e1–404.e7. [Google Scholar] [CrossRef]
- Stephan, C.N.; Preisler, R. In vivo facial soft tissue thicknesses of adult Australians. Forensic Sci. Int. 2018, 282, 220.e1–220.e12. [Google Scholar] [CrossRef]
- Panenkova, P.; Benus, R.; Masnicova, S.; Obertova, Z.; Grunt, J. Facial soft tissue thicknesses of the mid-face for Slovak population. Forensic Sci. Int. 2012, 220, 293.e1–293.e6. [Google Scholar] [CrossRef] [PubMed]
- Perlaza Ruiz, N.A. Facial soft tissue thickness of Colombian adults. Forensic Sci. Int. 2013, 229, 160.e1–160.e9. [Google Scholar] [CrossRef] [PubMed]
- Starbuck, J.M.; Ward, R.E. The affect of tissue depth variation on craniofacial reconstructions. Forensic Sci. Int. 2007, 172, 130–136. [Google Scholar] [CrossRef] [PubMed]
© 2020 by the authors. Licensee MDPI, Basel, Switzerland. This article is an open access article distributed under the terms and conditions of the Creative Commons Attribution (CC BY) license (http://creativecommons.org/licenses/by/4.0/).


 ,
, 


