Article

Motion-Sphere: Visual Representation of the Subtle Motion of Human Joints

by
Adithya Balasubramanyam
,
Ashok Kumar Patil
,
Bharatesh Chakravarthi
,
Jae Yeong Ryu
and
Young Ho Chai
*
Virtual Environments Lab, Graduate School of Advanced Imaging Science, Multimedia and Film, Chung-Ang University, Seoul 06974, Korea
*
Author to whom correspondence should be addressed.
Appl. Sci. 2020, 10(18), 6462; https://doi.org/10.3390/app10186462
Submission received: 14 August 2020 / Revised: 11 September 2020 / Accepted: 12 September 2020 / Published: 16 September 2020
(This article belongs to the Special Issue Computer Graphics and Virtual Reality)

Abstract

:
Understanding and differentiating subtle human motion over time as sequential data is challenging. We propose Motion-sphere, which is a novel trajectory-based visualization technique, to represent human motion on a unit sphere. Motion-sphere adopts a two-fold approach for human motion visualization, namely a three-dimensional (3D) avatar to reconstruct the target motion and an interactive 3D unit sphere, that enables users to perceive subtle human motion as swing trajectories and color-coded miniature 3D models for twist. This also allows for the simultaneous visual comparison of two motions. Therefore, the technique is applicable in a wide range of applications, including rehabilitation, choreography, and physical fitness training. The current work validates the effectiveness of the proposed work with a user study in comparison with existing motion visualization methods. Our study’s findings show that Motion-sphere is informative in terms of quantifying the swing and twist movements. The Motion-sphere is validated in threefold ways: validation of motion reconstruction on the avatar, accuracy of swing, twist, and speed visualization, and the usability and learnability of the Motion-sphere. Multiple range of motions from an online open database are selectively chosen, such that all joint segments are covered. In all fronts, Motion-sphere fares well. Visualization on the 3D unit sphere and the reconstructed 3D avatar make it intuitive to understand the nature of human motion.

1. Introduction

The main aim of this study is to analyze and visually represent subtle variations of similar human motion in a structured manner. Human joint–bone motions can have numerous subtle orientation variations. Although these subtle variations are visually similar, the underlying orientations can differ markedly. Visualizing human motion with 244 kinematic degrees of freedom (DoF) is a challenging study area. Generally, existing research represents user poses and positions over time in order to visualize human body motion in 3D [1]. Together with spatial and temporal data, object orientation in 3D produces extensive data sets that require processing, organizing, and storing for 3D reconstruction.
This paper proposes Motion-sphere for visualizing human motion using data from multiple inertial measurement units (IMUs). Most contemporary motion capture studies record human joint orientations using sensors and/or camera and then apply them directly to a 3D avatar for reconstruction [2,3]. However, there is a considerable requirement for the accurate and correct visualization of human motion at the minute scale, offering insights into and visual differentiation of subtle changes in intended human motions.
It has become common practice to use IMUs for motion capture and analysis, providing more precise orientation estimates for any rigid body (in this case, human bones) as compared to camera-based or any other form of motion capture system [4]. Consequently, commercial vendors commonly offer hardware support for filtering noisy data, software compensation for heading drift, multiple IMU time synchronization, etc. [5]. Rigid body orientations that are calculated by sensors are presented as quaternions (four-dimensional (4D) numbers) that are widely used to realize three-dimensional (3D) rotation in animation and inertial navigation systems. Quaternions can communicate multiple orientation changes as a single change without causing gimbal lock situations. Hence, we adopted quaternions as the basic mathematical unit to represent human body orientation in 3D, consistent with most human motion analysis research [6,7,8].
Any human motion is a sequence of quaternion rotations, visually represented as a trajectory on a 3D unit sphere. Figure 1 shows an overview of the proposed Motion-sphere. A 3D LiDAR sensor is used to track the position of a moving human body. The 3D position of the pelvis is computed while using the segmentation of raw point cloud data based on the user’s height and IMU sensors are used to estimate the orientation of each bone joints during human body motion in a real environment. When a user performs a motion, orientation data from the IMU sensors are transformed into a 3D avatar’s coordinate frame for reconstruction.
The quaternion frames are decomposed into swing and twist [9] rotations and visualized as trajectories on a unit sphere. Mapping a grid on the unit sphere helps us to quantify specific human motion and individual bone movements and their respective rotations can be visually analyzed. The Motion-sphere enables comparisons between two sets with visually similar motion patterns. Therefore, the technique opens up itself to a wide range of applications, including athletic performance analysis, surveillance, man-machine interfaces, human motion tracking, kinesiology, physical fitness training, and therapy.
Each subtle movement is mapped on the unit sphere as a series of 3D points rotating about given X, Y, and Z axes. For example, lower limb movement in a sit-up action would be represented as a trajectory on a unit sphere. Although the left and right legs have similar movements, the subtle variation in orientation could not be identified in a video. Likewise, a sit-up performed a second time may have a different trajectory to the first. The human motion details are contained within the axis and orientation changes reflected by the quaternion trajectory. This paper visualizes human motion while using this trajectory, thus providing an excellent candidate for use in the aforementioned applications.
The current work validates the proposed Motion-sphere by considering the range of motion (ROM) from the TotalCapture dataset [10]. The reconstruction accuracy, visualization accuracy, learnability, and usability of the Motion-sphere are validated against a few existing motion visualization methods. We have demonstrated the use of Motion-sphere for comparing multiple human motion, authoring, and editing, and as a standard to validate the accuracy of reconstruction.
The remainder of this paper is organized, as follows. Section 2 discusses related work with respect to various methods used for human motion visualization. Section 3 and Section 4 present the hierarchical joint–bone segment and discusses details on decomposition and visualization. Section 5 validates the Motion-sphere and Section 6 demonstrates a few key applications of the Motion-sphere.

2. Related Work

Visualizing time-varying positions and orientations of multiple human joints is challenging. Among the various techniques proposed thus far, visualizing motion in two-dimensional (2D) image is widely practiced and considered to be the most intuitive approach [11]. Variations of hand gestures are visualized on a 2D strip using a stick model [12]. Although other metrics are considered to compare the gesture, orientation changes in the axis parallel to the torso (vertical axis) cannot be noted. Thereby, the temporal dimension of the human motion is fully overlooked.
Motion-cues is yet another visualization technique using key-poses [13]. They focus on the motion of a specific bone segment using directed arrows, noise waves, and stroboscopic illustrations. The primary focus is the artistic depiction of motion rather than the subtlety of time, space, and orientation. Such visualization is more appropriate for creating artistic or multimedia work [14]. Motion-track [8] uses a Self-organizing map to construct a sequence of key-poses that it connects through a 2D curve. This kind of visualization is suitable for full-body motions, like walking, running, jumping, or marching. Although it uses hierarchical skeletal model, there is no evidence of any visual depiction of individual bone segments orientations. Zhang et al. [15] proposes a technique of generating motion-sculpture (MoSculp) from a video. Again, this is useful for creating artistic expressions of human motion; it expresses motion as a 3D geometric shape in space and time. The orientation of joints are overlooked in the MoSculp, which makes it difficult to reconstruct the motion or sculpture.
Among various visualization methods, Oshita. et al. proposed a self-training system (STS) for visually comparing human motion by overlapping 3D avatar models [16]. The authors considered the motion data of tennis shots played by an expert vs. a trainee to compare the motion in terms of spatial, orientation, and temporal differences while using regular and curved arrows for visualization. Because 3D avatars are used for visualization, the technique does not exaggerate the differences and it becomes unnatural and difficult to note subtle variations in orientations.
Yasuda et al. [17] proposed a technique, called the Motion-belt, which visualizes motion as a sequence of key-poses. It offers temporal information on motion by varying the distance of the key-poses on a 2D belt. Specific color coding is used to represent the orientation of the pelvis (Full Body) in 360°. Although Motion-belt can successfully provide an overview of the motion type at a higher level of abstraction, it neglects details, such as the orientations of individual bones, and it is challenging to distinguish between human motions with subtle orientation variations. In addition, comparing a multitude of variations with respect to their orientation and position over time is highly difficult.
It is easy and intuitive to represent orientation while using a quaternion. Hanson [18] described a concise visualization of quaternions, including representing points on the edge of a circle, hypersphere ( S 3 ), single quaternion frame, etc., with several useful demonstrations, such as the belt trick, rolling ball, and locking gimbals. The approach is mainly for educational and demonstration purposes. Quaternion maps are the most common techniques for visualizing quaternions with the help of four spheres ( S 2 ). Each of these four spheres has a particular meaning, and visualizes the raw quaternions as a combination of three tuples ([x,y,z], [w,x,y], [w,y,z], [w,x,z]) as 3D points on a unit sphere, collectively as a trajectory. However, for human motion visualization, quaternion maps do not provide distinctive visual differences between human motion trajectories with subtle differences.
In one of our previous prototype studies [4], we visualized human motion in two-dimensional (2D) as a trajectory. Here, the raw quaternion data was considered, and a similar approach was adopted as in the current work for computing the 3D-points. A UV mapping technique [19] was used to map the 3D-points onto a 2D grid. The hierarchical nature of human bone segments was not considered an initial vector ( 0 , 0 , 0 , 1 ) in quaternion form was regarded as a starting point for any human bone motion visualization. The visualization did not consider the decomposition of quaternions into twist and swing rotations. Therefore, quantifying human motion was not an option. In another work [20], we decomposed the rotations into twist and swings and represented them on the unit sphere as 3D beads. The representation was accumulated rotation of all the parent segments into a single trajectory. Therefore, the kinematic hierarchy was not maintained in the details of the trajectory.
Various motion-databases, including CMU Mocap [21], MocapClub [22], Kitchen Capture [23], CGSpeed [24], and so on are publicly available online data sets. These represent major hierarchical rotation, scaling, and positional data of body segments in the form of Euler angles or quaternions. The list of motions they have captured includes walking, climbing, playing, dancing, sports performances, and other everyday movements. The current work shows examples of the visualization of ROM from the TotalCapture dataset [10] for demonstration and comparison. The TotalCapture dataset provides sequences of orientation data in the form of quaternions, and the position of joints in 3D with respect to the global reference frame. We validate the reconstruction accuracy of the avatar while using the same dataset.

3. Proposed Motion-Sphere

3.1. Kinematic Hierarchy and Twist-Swing Decomposition

A human body motion is a hierarchical movement with a parent–child relationship between joint–bone segments. The current work captures the movement of 10 hierarchical joint–bone segments, as shown in Figure 2, for full-body motion. IMU sensors attached to these segments give bone rotation data as quaternions. Initial calibration is performed for accurate reconstruction and visualization. The calibration aligns the 3D avatar’s segments with human bone axes. The quaternions that were obtained from the user’s T-pose ( q c ) rotate and align the subsequent raw quaternions ( q i ) from the sensors to the bone axes (i.e., q = q i q c 1 ). The 3D avatar reconstruction is achieved by rotating prefixed 3D vectors ( v ^ , that are initially aligned to the bone axes) by the resulting quaternion (i.e., q v ^ q 1 ).
It is a standard procedure to decompose humanoid joint–bone movement defined by a quaternion ( q ) into twist ( q t ) motion around an axis that is parallel to the bone axis and swing ( q s ) motion around a specific axis [9]. The twist–swing decomposition enables the understanding of joint–bone movement in a “twist first and swing next” order ( q = q s q t ) . Therefore, the axis v ^ of the bone could be a constant entity. Equations (1)–(3) show the steps for the twist–swing decomposition.
w ^ = q v ^ q 1
q s = cos α 2 , u ^ sin α 2
q t = q s 1 q
where, α = cos 1 v ^ · w ^ and u ^ = v ^ × w ^ . In addition, w ^ = q v ^ q 1 = q s v ^ q s 1 .
There is a twist rotation ( β ) around the bone axis ( v ^ ) defined by the quaternion q t .

3.2. Visualizing Swing Motion

A human joint movement is restricted to a certain kinematic DoF. Because of this, it would be intuitive to map joint swing movements as separate trajectories (a series of rotated point; w ^ in Equation (1)) on a unit sphere attached at the joints, as shown in the Figure 3a. Each limb, pelvis, and chest is mapped on a separate unit sphere. By themselves, these unit spheres do not provide detailed visual information about the extent of the swing. A grid is mapped onto the sphere to enable users to instinctively quantify swing rotation by merely looking at the visualization.
The mapped grid comprised of equidistant cells running from 0°–180° on the right and left side, starting from the front of the sphere. Vertically the cells go 0°–180°. The visualization presented in the current work, the grid cell size is 10°. The grid size may differ for different applications; this is discussed further in the experimental study. Figure 3 shows the right lower arm swinging from the attention pose to the front of the body by 90° and correspondingly visualized on the Motion-sphere (Figure 3b).
The trajectory representing the swing of a joint–bone segment is always relative to its parent bone in the hierarchy. The combined movement of parent–child bones is as shown in Figure 4. Here, the right upper arm swings from its initial attention pose to the right of the body by 90° (1–2 step in avatar and saffron trajectory on Motion-sphere), followed by a lower-arm swing of 90° front of the upper arm (2–3 step in avatar and yellow trajectory on Motion-sphere). Note that the rotation in reverse order (lower arm first and then upper arm) would yield the same result. The labels Front, Right, Back, and Left indicate the sagittal reference w.r.t. the parent bone on the grid texture, which make it easier for the user to see the swing direction on the latitude of the Motion-sphere, and the arrows with the trajectory indicate the direction of the swing.

3.3. Visualizing Twist Motion

The q s swings a point v ^ on a sphere to a new position w ^ , as discussed in Equations (1)–(3). However, the position of a point on the sphere does not change for a twist rotation of the bone. Therefore, only a trajectory would not suffice to represent a combination of twist and swing. To visualize the twist rotation q t by the bone axis v ^ , the Motion-sphere makes use of 3D models of the upper and lower limbs, as shown in Figure 5.
The twist orientation of the 3D models placed at equal distances on the swing trajectory enables the intuitive visualization of the complete human joint bone motion. Figure 6 shows an example of a simple twist–swing motion in the lower right arm. In Figure 6b, the avatar exhibits a lower right arm twist of approximately 75°–80° from attention pose (1) to end pose (3), while the actual twist is 75.9° as shown on the Motion-sphere. The models are also gradient colored in order to indicate the extent of the twist in the bone axis (color gradient is shown in Figure 5).

4. Demonstration of Trajectory Patterns

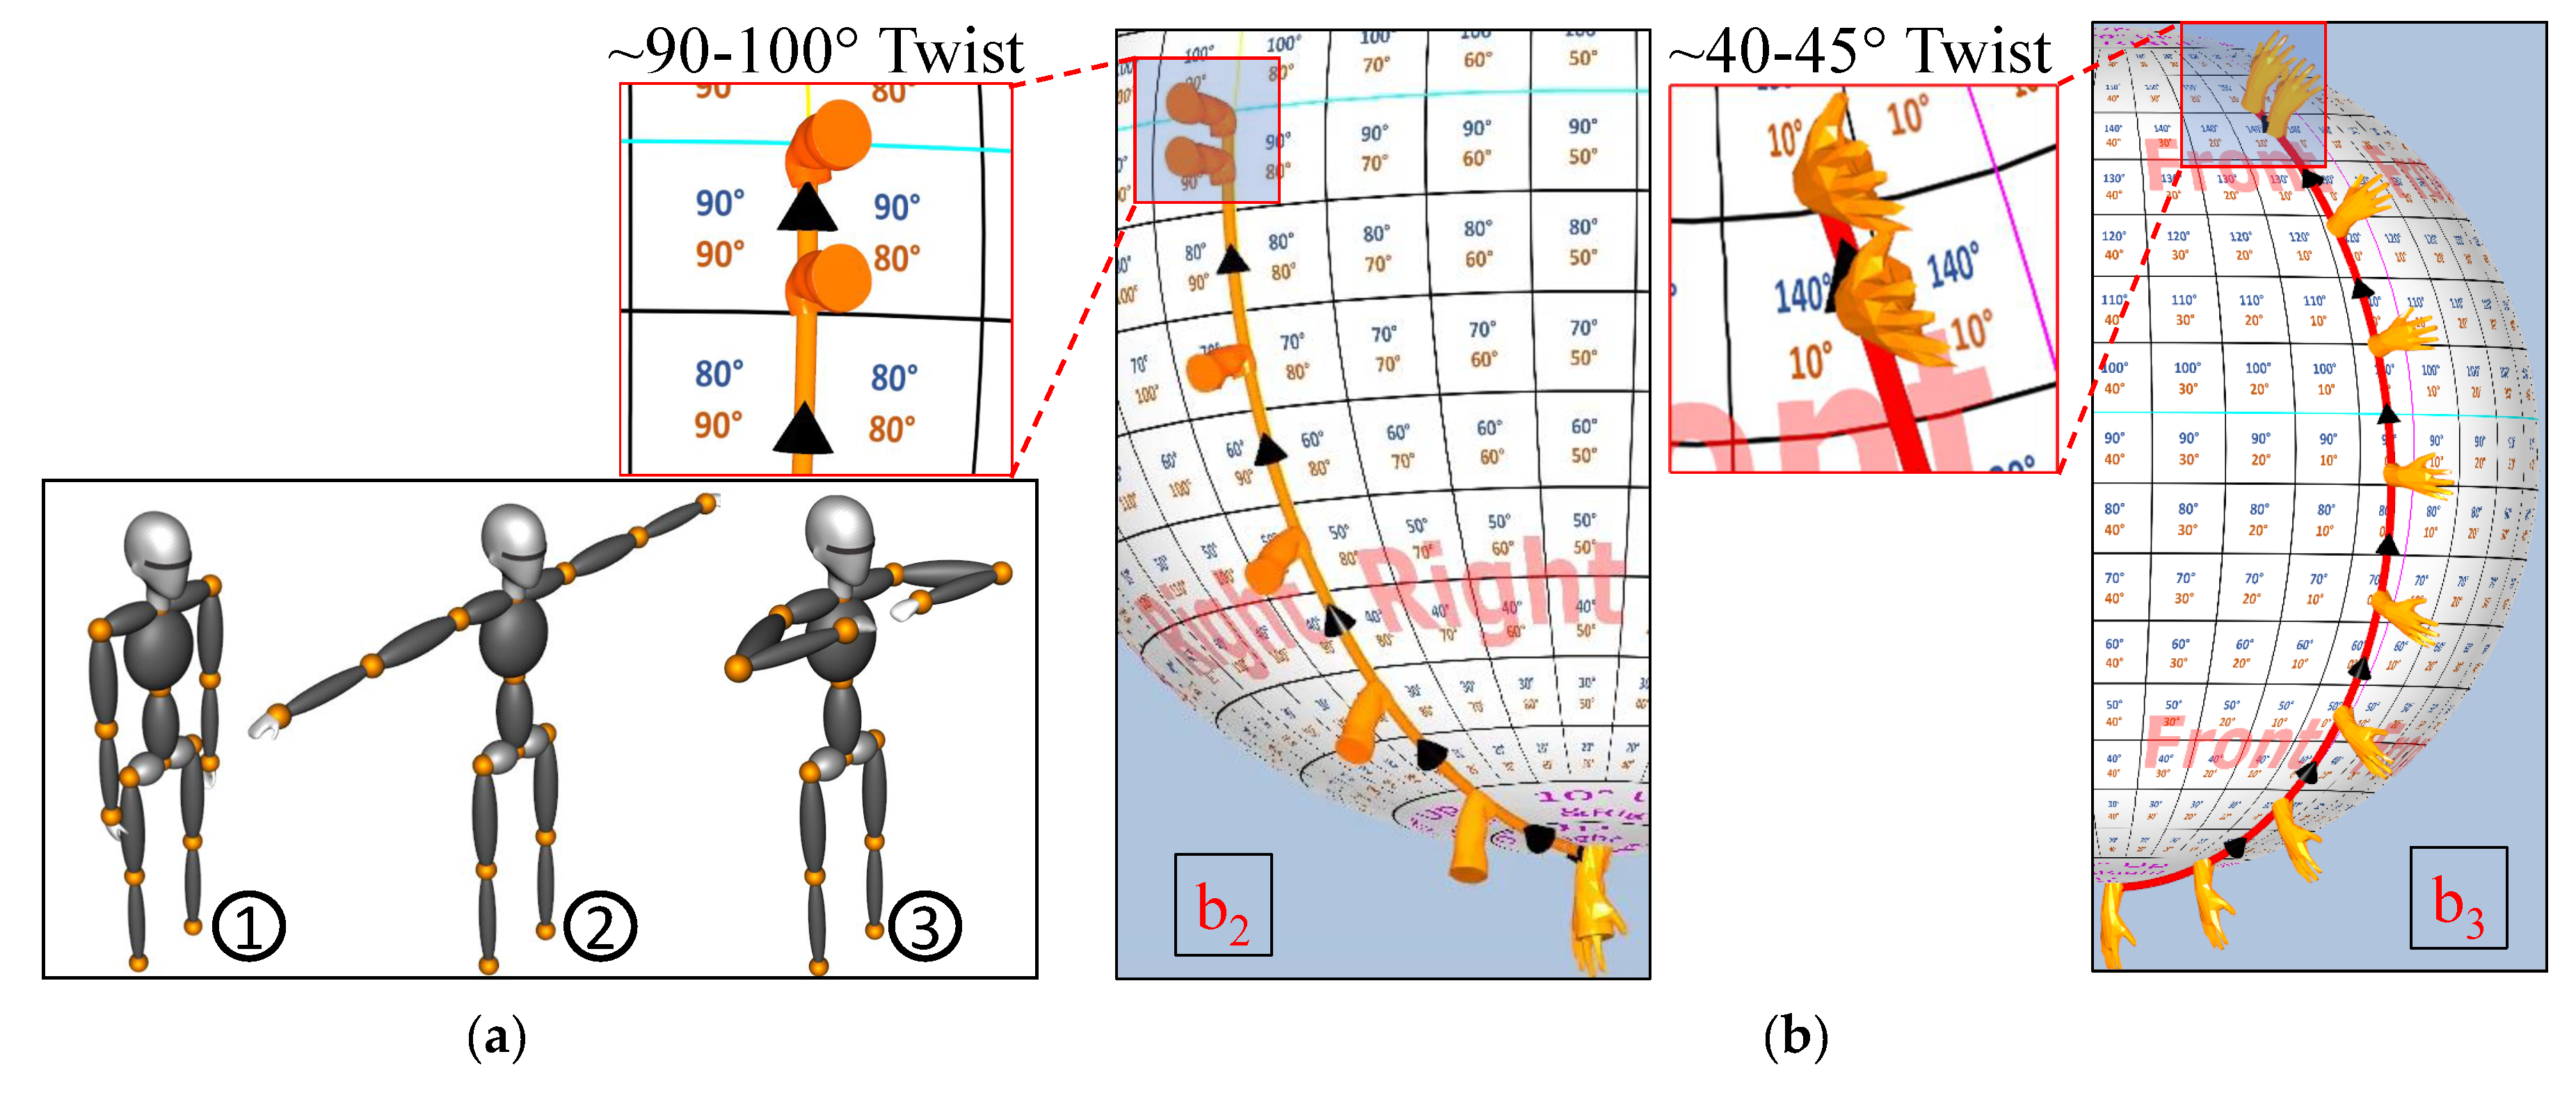
Figure 7 shows the trajectory of a simple right upper arm rotation from the TotalCapture dataset [10]. The upper arm takes a full rotational swing in the anti-clockwise direction with a twist of almost 120°. In addition, the rotational swing is clearly on the right of the Motion-sphere, as indicated on the sphere’s grid texture. The black arrows indicate the direction of the swing.
The Motion-sphere always visualizes the bone-segment motion with respect to the parent bone-segment’s orientation. Figure 8 shows a ROM movement of a right upper leg, in which the right upper (parent) and lower (child) legs appear to be moving in opposite directions in the initial phase (key frames 1–2). Although the orientation of the lower leg does not change significantly, it seems that the lower leg is rotating to the back of the upper leg (purely due to the upper leg rotation). In the second phase (key frames 2–3), the lower leg exhibits no movement (Figure 8c) w.r.t the upper leg, while the upper leg changes laterally by 40° right (Figure 8b). An approximately 80–85° twist can be noted due to the color change in the miniature upper leg model due to the lateral movement of the upper leg toward right.
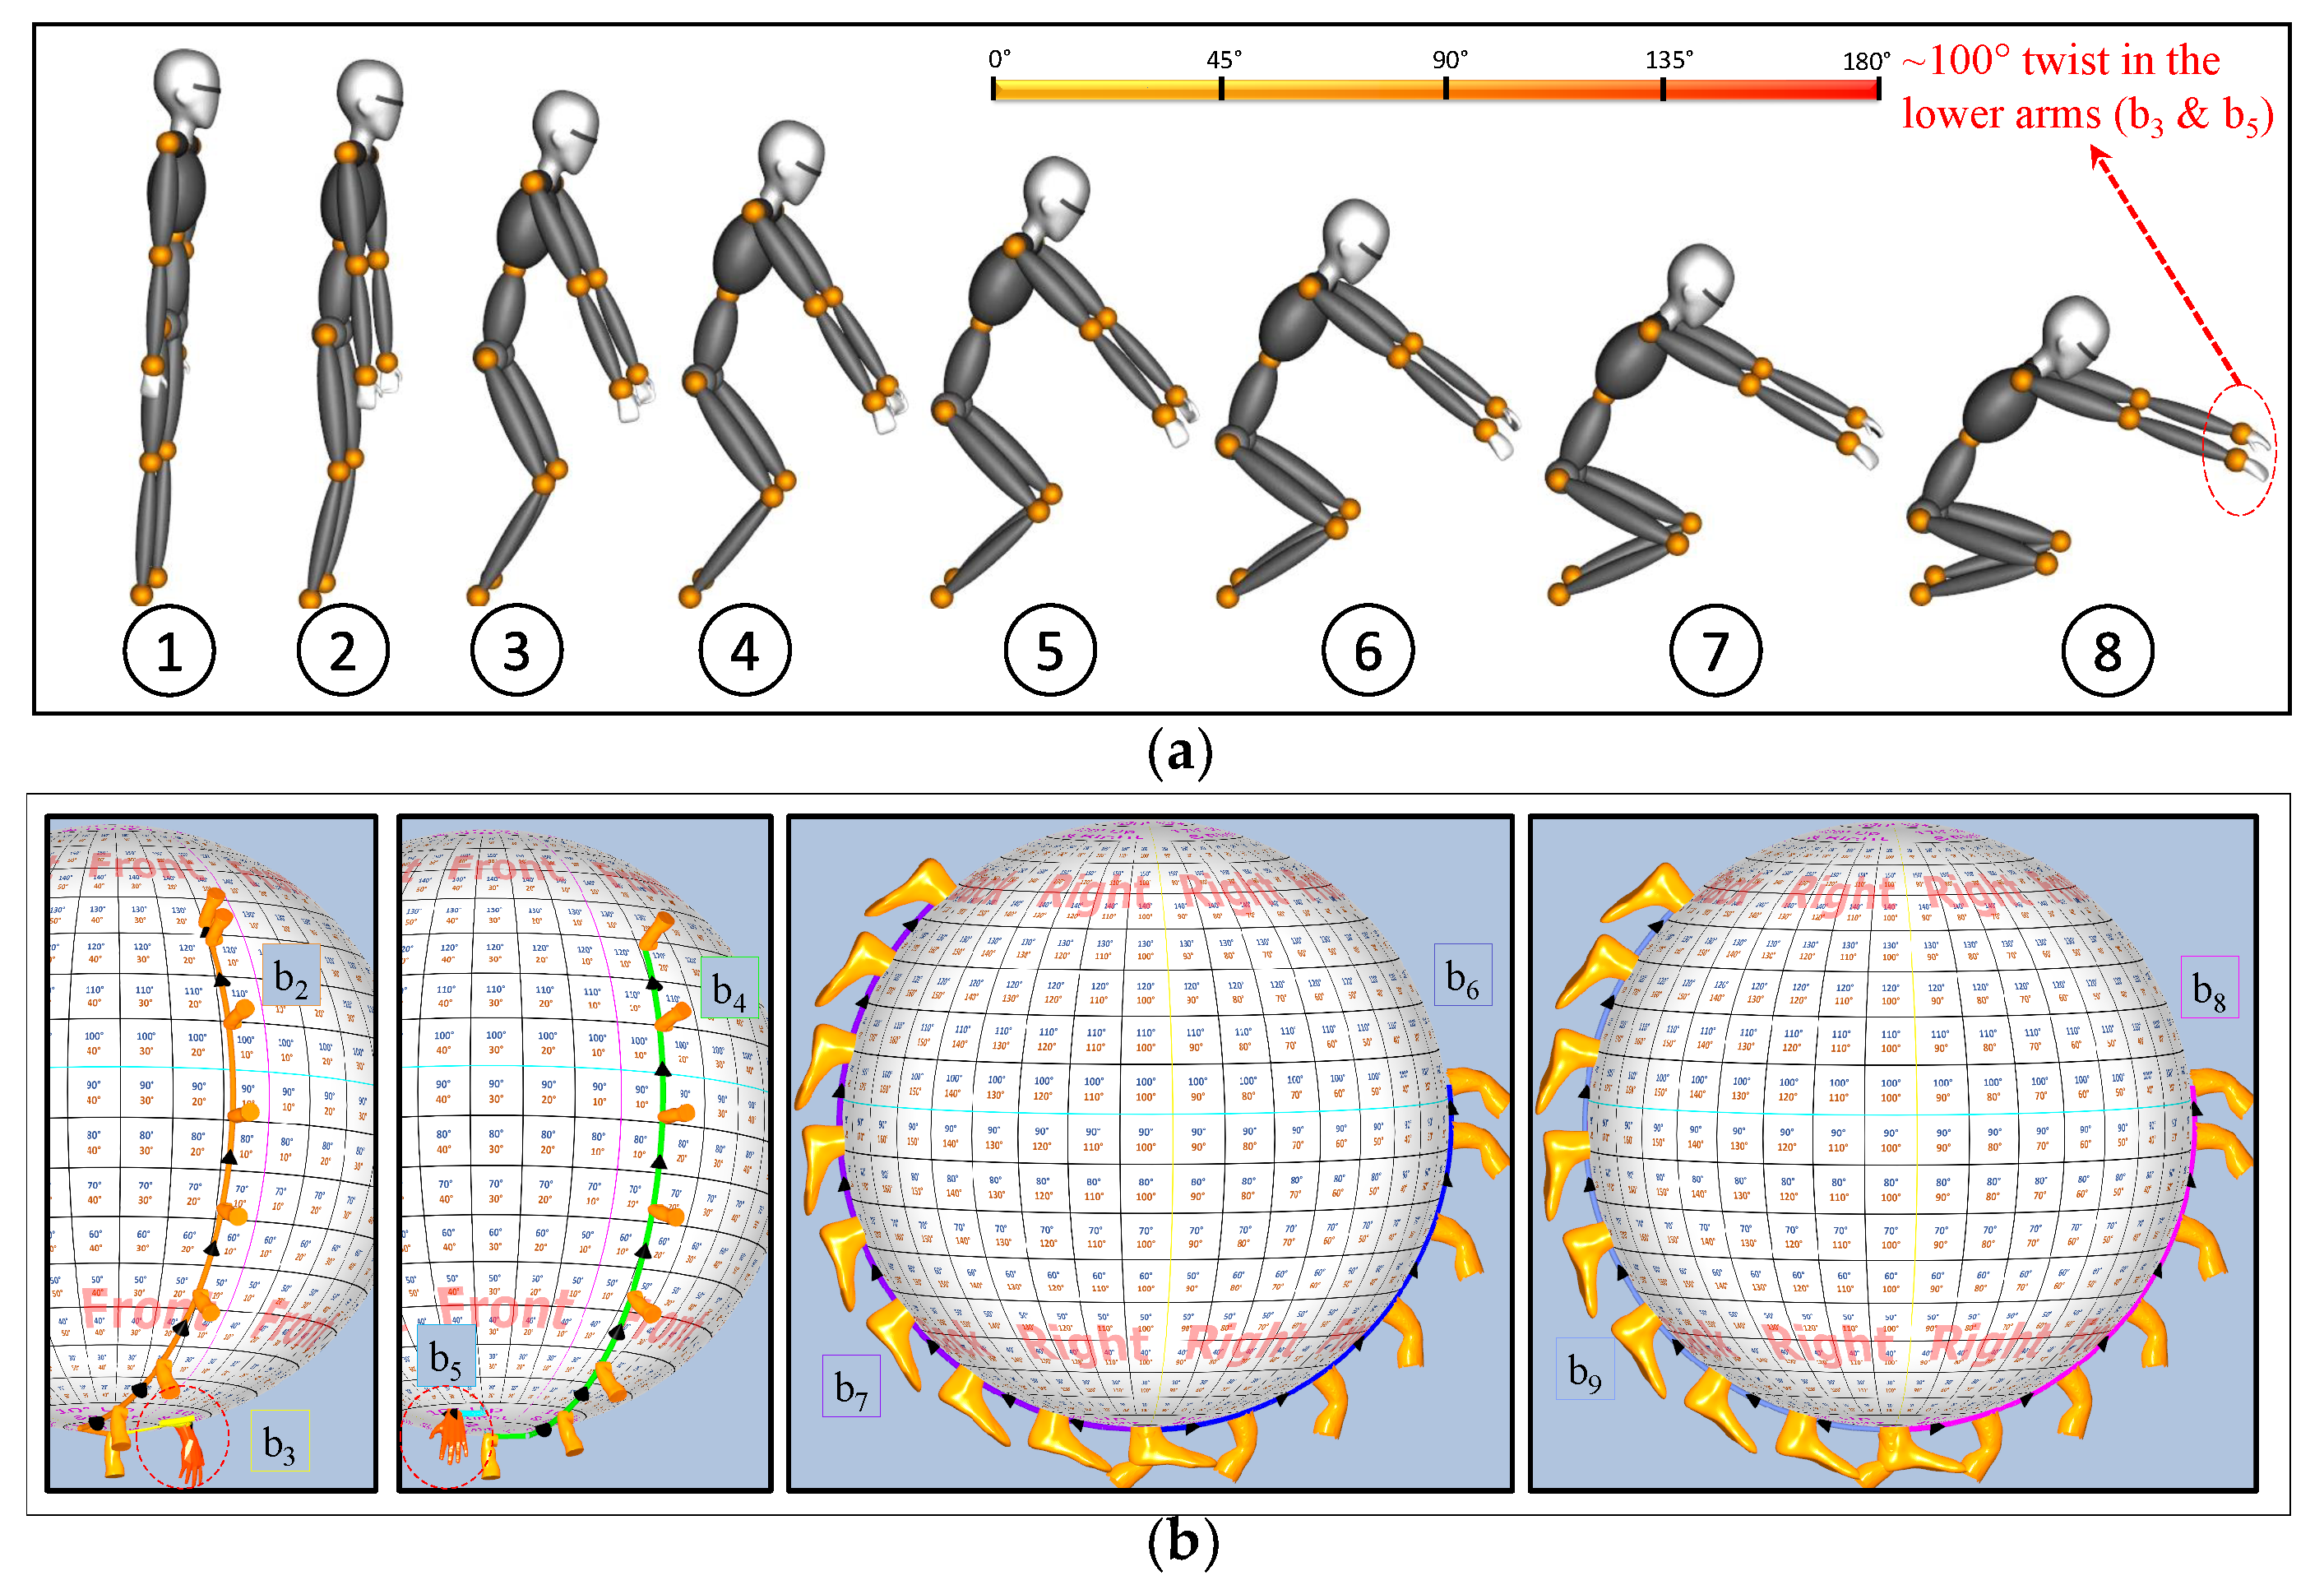
Figure 9 shows another twist-swing example that visulaizes the right arm swing. Key frame 1–2 are in a 90° upper arm swing movement toward right side of the body. A twist of 90–100° is noted from the color change due to the lateral swing. The lower arm swings in front w.r.t. the upper arm by 140° up and 10° right. The color change is minimal, with approx. 40° twist. Figure 9b shows the visualization.
Figure 10 visualizes the rotational movement exhibited by pelvis ( b 0 ) and the chest ( b 1 ). The corresponding spheres that are associated with b 0 & b 1 are selected among the menu options for visualization. Unlike the limbs, where the trajectories start at the south pole of the sphere in the attention pose, the trajectories for the pelvis and chest begin at the north pole, as shown in Figure 10. A 70° bend in b 0 and 60° bend in b 1 (w.r.t. b 0 ) is seen.

5. Evaluation of the Proposed Motion-Sphere

We approach the validation of the Motion-sphere in this section by discussing (1) the accuracy of reconstruction on the avatar using the ROM data from the TotalCapture dataset [10], (2) the accuracy of the visualization on a unit sphere against the ground truth, and (3) a user study to evaluate the usability, utility, insights, and the learnability of the Motion-sphere.

5.1. Accuracy of Reconstruction on the Avatar

In this section, we validate the accuracy of our 3D model motion reconstruction. Avatar is developed while using a visualization toolkit (written in C++) [25]. The procedure for updating the avatar is beyond the scope of this article (briefly described in Section 3.1). However, we briefly discuss the accuracy of reconstruction on the avatar, as the avatar is one of the two modules of the Motion-sphere. The TotalCapture dataset [10] has varied ROM; this can be directly applied on our 3D avatar to validate its reconstruction accuracy. Figure 11a shows a few selected reconstructed poses from the TotalCapture dataset against their ground truth images. Figure 11b shows multiple poses that were reconstructed on the same model using our data against the ground truth images. The result shows that the reconstruction is reasonably accurate.

5.2. Accuracy of Motion Visualization

Among the three parameters of motion the unit sphere can visualize (twist, swing, and speed), twist can only be quantified by the user’s experience, as it is visualized using the color map. However, the other two, can be validated against the ground truth data. To prepare ground truth data, we consider measurable swing motions using a physical joint angle measurement apparatus as shown in the Figure 12. Specific motions are manually annotated as ground truth data and swing visualizations are validated against this set. Table 1 shows the accuracy of swing. The grid sizes on the unit sphere are separated by 10°. Therefore, the average error of the measured swing is ± 5 ° . The grid size could be increased or reduced based on the application’s accuracy requirement.
The accuracy of the visualization depends on the grid size. Figure 13 shows how the accuracy improves based on the grid size.

5.3. A Comparative User Study

We selected 13 different ROMs from the TotalCapture data set for visualization on the Motion-sphere (Some of which are demonstrated in Section 4). The study validated parameters, such as the usability, utility, insights, and learnability. The twist quantification, which can only be validated by the user experience is also part of the user study. We compared the Motion-sphere visualization with the video, Motion-belt [17], STS [16] method. The user study included 10 participants aged 20–30 years. All of the participants were everyday computer users. The following procedure was used for the user study. The users were taught about the Motion-sphere visualization, Motion-belt, and the STS technique by providing them with multiple visualization slides with correct answers (swing, twist, and speed) and instructions as a training set. Sufficient time was given until the users were comfortable before the next phase of testing. The second time, different motion visualization slides without any correct answers were given to users and they were asked to predict the correct swing, twist, and speed of the motion just by visualization. Following this, qualitative user experience was captured. The process was repeated for five iterations.
We found that the users were able to predict the swing with fairly good accuracy as compared to the video and Motion-belt technique. However, we had mixed results when predicting the twist. Although the users opined that color coding the miniature models of limbs was helpful, they could not quite get it accurately in all three techniques. Figure 14 shows the error in the participants’ prediction against the ground truth values. We classified speed into Fast, Medium, or Slow. All three techniques fared equally in their visualization of speed.
When the participants were presented with five sets of motion, each motion comprising two data for comparison, and asked to provide their perceived difference w.r.t. the swing and twist, an average error of 8° was noted in STS and 4° in the Motion-sphere, as indicated in Figure 15a. The learnability of the Motion-sphere was also tested across multiple iterations. In their qualitative analysis, the users collectively opined that they were more comfortable and felt more in control of their prediction of the parameters at the end of the experiment. Figure 15b, shows the improvement in the accuracy of prediction while using the Motion-sphere in the second iteration.

6. Application of Motion-Sphere

In this section, we discuss examples of how the Motion-sphere visualization method can be applied to comparing users’ bone movements, to author a new full body human motion or edit the captured human motion, and to validate the accuracy of the 3D avatar’s reconstruction.

6.1. Comparing Users’ Motion

Various poses within the ROM data from the same user with two iterations are mapped on the Motion-sphere. The Motion-sphere aids in understanding subtle variations in human motion by magnifying the differences in the motion visually. Figure 16 is a sample visualization of two motions with subtle variations that are visually unrecognizable in the image. In Figure 16a, user-1’s right arm is slightly tilted to the right of the reference line (pink line), while the user-2’s right arm is tilted to the left of the reference line. This subtle 10° variation in the motion is noticed in the Motion-sphere. In addition, the body anatomy of the individuals and the calibration are some factors that influence the comparison. However, such comparisons are mainly helpful in rehabilitation, where patients’ recovery can be measured based on changes in their bone segment rotation over time [26,27].

6.2. Authoring and Editing Full Body Human Motion

In most current motion capture work, the orientation of human joints are captured while using sensors and/or cameras and directly applied to a 3D avatar for reconstruction. However, there is no means by which the captured quaternion data can be edited for consistent, accurate, and correct representation of human motion, just like editing is required for written, audible and visual material to convey a correct, consistent, and accurate ideas. The Motion-sphere is a necessary intuitive visualization that can represent orientations of human motion for desirable delicate remodeling or to delicately reorient human motion. Authoring and Editing can be seen from two perspectives. First, authoring a new motion involves no data acquisition from the sensors whatsoever. A sequence of key frames that define the motion are formulated using the Motion-sphere, the speed at which the motion has to be performed is predefined and the intermediate frames are generated by spherical linear interpolation. The second method is to edit existing motion. This involves acquiring motion while using a motion capture technique (using IMU sensors attached to the body), visualizing the acquired motion on a Motion-sphere, and then editing the key frames to represent the motion correctly, consistently, and accurately as desired by the user. Figure 17 shows a sequence of key frames (1 and 2) defined for a certain yoga movement called the Urdhva-hastasana, compared to sensor acquired motion for Urdhva-hastasana, which is consistent with the authored motion. The number of data frames between each key frames defines the speed of the motion itself. This could be controlled in the motion authoring tool by either adding new intermediate frames or deleting the existing ones.
The Motion-sphere aids as a tool in authoring new motion, and editing the existing motion in a desired manner. A prototype implementation of the authoring/editing system with the help of Motion-sphere is demonstrated here. Figure 18 shows another example of newly authoring a squat motion with eight key frames. The authoring of a squat motion was achieved without any preexisting data points; it is quite natural that a greater number of key frames means a more realistic human motion reconstruction. Squat motion demonstrates the authoring of a full body motion such as swing in upper and lower limbs, and twist in lower arms (100°, as noted by the colored miniature model). Figure 18b shows the visualization of the authored motion, where two bones (one limb) are combined in a single sphere ([ b 2 & b 3 ],[ b 4 & b 5 ],[ b 6 & b 7 ],[ b 8 & b 9 ]). The Authoring/Editing tool is a prototype implementation; we intend to explore Motion-sphere’s actual usage and its impact in the field of human motion authoring and editing in future work.

6.3. Validating the Accuracy of 3d Avatar

Validating the accuracy of reconstruction has always been a qualitative study. The accuracy is visually observed and a certain inference is built while using these observations. We can see that in the experimental study, the Motion-sphere provides an accurate representation of human motion as a trajectory on the unit sphere, which corresponds to the bone segment movement in the human body. Therefore, the Motion-sphere can aid as a measuring tool to quantitatively measure the accuracy of reconstruction with respect to the swing, twist, and speed of human motion.

7. Discussion

Generally, people find it comfortable to follow a video for fitness training, as it is a common medium used to observe any kind of human motion. However, Motion-sphere is more informative for detecting patterns in user motion, so that users can imitate experts’ movements more accurately. In the case of video clips, there is no definitive way to quantify a twist or pattern of swing as we discussed in view of several studies in the previous section. In addition, a subtle twist or swing in a bone–joint segment can be completely overlooked due to the 2D nature of the video clip. We visualized various human motion data from the TotalCapture data set and tested the Motion-sphere for a yoga training application, with a sequence of yoga movements, called the Surya Namaskara. From the trainer’s perspective, the Motion-sphere supports them to provide distinct corrective suggestions to their pupils regarding their body posture. Motion-sphere is effective for analyzing and visualizing the structure and relationship between the joint–bone segments and the effect of a parent joint on the child. Every person has a different skeletal anatomy in terms of bone length and flexibility, which are captured during calibration (Section 3.1). However, the captured motion data in a single calibration session is more suitable for comparative visualization
The kinematic hierarchy that is discussed in Section 3.1 covers 10 bone-segments, including the pelvis ( b 0 ), chest ( b 1 ), upper limbs ( b 2 , b 3 , b 4 , & b 5 ), and lower limbs ( b 6 , b 7 , b 8 , & b 9 ). The neck and shoulder bones move depending on the chest, while the hip bones move depending on the pelvis. Additionally, various other bones, like the feet, hands, fingers, and head, are merely extensions in the hierarchy by either increasing the number of sensors or by adopting deep learning methods like in the [28,29]. The Motion-sphere could be extended to these bone segments, depending on the application. The future work intends to extend Motion-sphere for the aforementioned bone-segments.
Each bone-segment movement is mapped and visualized on a unit sphere as trajectory, as discussed in Section 3.2. It is natural that the trajectories overlap and clutter for a prolonged motion (constitutes multiple key poses), leading to difficulty in understanding the motion. Therefore, the Motion-sphere works best when the movement between lesser number of key poses are visualized. This also compliments the very purpose of visualizing the subtle motions while using the Motion-sphere.

8. Conclusions

This paper focused on the visualization of subtle human motion. Visualization helps to quantify individual joint bone movements for comparative analysis. We used quaternions for 3D rotations. Visualizing and recognizing subtle human motion variations greatly enhances motion capture and reconstruction quality, both of which are essential for regular usage and research. Among other benefits, the current work enables opportunities in fitness, rehabilitation, posture correction, and training. Future work will develop the current work into a standard for the visual representation and analysis of human motion.
Most work in the area of human motion visualization is based on 3D avatar analysis. Motion-sphere is a novel approach for recognizing and analyzing subtle human movement based on motion trajectory visualization. As every single orientation of human motion has a unique representation on a Motion-sphere, it offers a wide scope in the future to alter or edit motions to eventually generate new variations. The positional data of the user from the LiDAR helps in realistic reconstruction of the performed motion. In the future, we intend to extend the scope of our research to visualizing positional data. The position of human joints is strictly hierarchical and depends on the position of the pelvis. Therefore, exploring ways of visualizing the pelvis’s position in 3D space would be interesting to see alongside the Motion-sphere. Thus, the scope of Motion-sphere would not be limited to joint–bone analysis, but it can extend to areas, such as locomotion, and gait analysis. The authoring of human motion or editing captured motion from the sensor seems like a very interesting application of the Motion-sphere. Therefore, exploring user-friendly ways of authoring human motion using the Motion-sphere and standardizing the Motion-sphere for avatar reconstruction validation are promising future works.

Author Contributions

Conceptualization, A.B. and Y.H.C.; methodology, A.B. and A.K.P.; software, A.B. and A.K.P.; validation, A.B., A.K.P. and B.C.; formal analysis, A.B. and A.K.P.; investigation, A.B. and A.K.P.; resources, A.B. and A.K.P.; data curation, A.B., A.K.P. and J.Y.R.; writing—original draft preparation, A.B.; writing—review and editing, A.B.; visualization, A.B., A.K.P. and B.C; supervision, Y.H.C.; project administration, A.K.P.; funding acquisition, Y.H.C. All authors have read and agreed to the published version of the manuscript.

Funding

This work was supported by Institute of Information & Communications Technology Planning & Evaluation (IITP) grant funded by the Korea government (MSIT) (No. 2018-0-00599, SW Computing Industry Source Technology Development Project, SW Star Lab).

Acknowledgments

We would like to thank all the participants for their time and support in conduction of the experiments.

Conflicts of Interest

The authors declare no conflict of interest.

Abbreviations

The following abbreviations are used in this manuscript:
ROMRange of Motion
LiDARLight detection and Ranging
IMUInertial Measurement Unit
DoFDegree of Freedom
STSSelf-Training System

References

  1. Fablet, R.; Black, M.J. Automatic Detection and Tracking of Human Motion with a View-Based Representation; Springer: Berlin/Heidelberg, Germany, 2002; pp. 476–491. [Google Scholar]
  2. Gilbert, A.; Trumble, M.; Malleson, C.; Hilton, A.; Collomosse, J. Fusing visual and inertial sensors with semantics for 3d human pose estimation. Int. J. Comput. Vis. 2019, 127, 381–397. [Google Scholar]
  3. Zheng, Y.; Chan, K.C.; Wang, C.C. Pedalvatar: An IMU-based real-time body motion capture system using foot rooted kinematic model. In Proceedings of the 2014 IEEE/RSJ International Conference on Intelligent Robots and Systems, Chicago, IL, USA, 14–18 September 2014; pp. 4130–4135. [Google Scholar]
  4. Patil, A.K.; B, B.C.S.; Kim, S.H.; Balasubramanyam, A.; Ryu, J.Y.; Chai, Y.H. Pilot Experiment of a 2D Trajectory Representation of Quaternion-based 3D Gesture Tracking. In Proceedings of the ACM SIGCHI Symposium on Engineering Interactive Computing Systems (EICS’19), Valencia, Spain, 18–21 June 2019; ACM: New York, NY, USA, 2019; pp. 11:1–11:7. [Google Scholar]
  5. Roetenberg, D.; Luinge, H.; Slycke, P. Xsens MVN: Full 6DOF Human Motion Tracking Using Miniature Inertial Sensors; Technical Report; Xsens Motion Technologies B.V.: Enschede, The Netherlands, 2009; Volume 1. [Google Scholar]
  6. Yun, X.; Bachmann, E.R. Design, implementation, and experimental results of a quaternion-based Kalman filter for human body motion tracking. IEEE Trans. Robot. 2006, 22, 1216–1227. [Google Scholar] [CrossRef] [Green Version]
  7. Sabatini, A.M. Quaternion-based extended Kalman filter for determining orientation by inertial and magnetic sensing. IEEE Trans. Biomed. Eng. 2006, 53, 1346–1356. [Google Scholar] [CrossRef] [PubMed]
  8. Hu, Y.; Wu, S.; Xia, S.; Fu, J.; Chen, W. Motion track: Visualizing variations of human motion data. In Proceedings of the 2010 IEEE Pacific Visualization Symposium (PacificVis), Taipei, Taiwan, 2–5 March 2010; pp. 153–160. [Google Scholar]
  9. Dobrowolski, P. Swing-twist decomposition in clifford algebra. arXiv 2015, arXiv:1506.05481. [Google Scholar]
  10. Trumble, M.; Gilbert, A.; Malleson, C.; Hilton, A.; Collomosse, J. Total Capture: 3D Human Pose Estimation Fusing Video and Inertial Sensors. In Proceedings of the British Machine Vision Conference (BMVC), London, UK, 7 September 2017. [Google Scholar]
  11. Li, W.; Bartram, L.; Pasquier, P. Techniques and Approaches in Static Visualization of Motion Capture Data; MOCO’16; ACM: New York, NY, USA, 2016; pp. 14:1–14:8. [Google Scholar]
  12. Jang, S.; Elmqvist, N.; Ramani, K. GestureAnalyzer: Visual Analytics for Pattern Analysis of Mid-Air Hand Gestures. In Proceedings of the 2nd ACM Symposium on Spatial User Interaction, Honolulu, HI, USA, 4–5 October 2014. [Google Scholar]
  13. Bouvier-Zappa, S.; Ostromoukhov, V.; Poulin, P. Motion Cues for Illustration of Skeletal Motion Capture Data. In Proceedings of the 5th International Symposium on Non-Photorealistic Animation and Rendering (NPAR’07), San Diego, CA, USA, 4–5 August 2007; ACM: New York, NY, USA, 2007; pp. 133–140. [Google Scholar]
  14. Cutting, J.E. Representing Motion in a Static Image: Constraints and Parallels in Art, Science, and Popular Culture. Perception 2002, 31, 1165–1193. [Google Scholar] [CrossRef] [PubMed]
  15. Zhang, X.; Dekel, T.; Xue, T.; Owens, A.; He, Q.; Wu, J.; Mueller, S.; Freeman, W.T. MoSculp: Interactive Visualization of Shape and Time. In Proceedings of the 31st Annual ACM Symposium on User Interface Software and Technology (UIST’18), Berlin, Germany, 14–17 October 2018; ACM: New York, NY, USA, 2018; pp. 275–285. [Google Scholar]
  16. Oshita, M.; Inao, T.; Mukai, T.; Kuriyama, S. Self-Training System for Tennis Shots with Motion Feature Assessment and Visualization. In Proceedings of the International Conference on Cyberworlds (CW), Singapore, 3 October 2018; pp. 82–89. [Google Scholar]
  17. Yasuda, H.; Kaihara, R.; Saito, S.; Nakajima, M. Motion belts: Visualization of human motion data on a timeline. IEICE Trans. Inf. Syst. 2008, 91, 1159–1167. [Google Scholar] [CrossRef] [Green Version]
  18. Hanson, A.J. Visualizing Quaternions; ACM: Los Angeles, CA, USA, 2005; p. 1. [Google Scholar]
  19. Wikipedia Contributors. UV Mapping—Wikipedia, The Free Encyclopedia. 2020. Available online: https://en.wikipedia.org/w/index.php?title=UV_mapping&oldid=964608446 (accessed on 11 August 2020).
  20. Kim, S.; Balasubramanyam, A.; Kim, D.; Chai, Y.H.; Patil, A.K. Joint-Sphere: Intuitive and Detailed Human Joint Motion Representation; The Eurographics Association (EUROVIS): Norrkoping, Sweden, 2020. [Google Scholar]
  21. CMU. Carnegie Mellon University—CMU Graphics Lab—Motion Capture Library. 2020. Available online: http://mocap.cs.cmu.edu/ (accessed on 11 August 2020).
  22. MocapClub. 2020. Available online: http://www.mocapclub.com/Pages/Library.htm (accessed on 11 August 2020).
  23. Quality of Life Grand Challenge. Kitchen Capture. 2020. Available online: http://kitchen.cs.cmu.edu/pilot.php (accessed on 11 August 2020).
  24. CGSpeed. The Daz-Friendly BVH Release of CMU’s Motion Capture Database-Cgspeed. 2020. Available online: https://sites.google.com/a/cgspeed.com/cgspeed/motion-capture/daz-friendly-release (accessed on 11 August 2020).
  25. Schroeder, W.J.; Avila, L.S.; Hoffman, W. Visualizing with VTK: A Tutorial. IEEE Comput. Graph. Appl. 2000, 20, 20–27. [Google Scholar] [CrossRef] [Green Version]
  26. Zhou, H.; Hu, H. Human motion tracking for rehabilitation—A survey. Biomed. Signal Process. Control 2008, 3, 1–18. [Google Scholar] [CrossRef]
  27. Ananthanarayan, S.; Sheh, M.; Chien, A.; Profita, H.; Siek, K. Pt Viz: Towards a Wearable Device for Visualizing Knee Rehabilitation Exercises; Association for Computing Machinery: New York, NY, USA, 2013; pp. 1247–1250. [Google Scholar]
  28. Huang, Y.; Kaufmann, M.; Aksan, E.; Black, M.J.; Hilliges, O.; Pons-Moll, G. Deep inertial poser: Learning to reconstruct human pose from sparse inertial measurements in real time. ACM Trans. Graph. (TOG) 2018, 37, 1–15. [Google Scholar] [CrossRef] [Green Version]
  29. Wouda, F.J.; Giuberti, M.; Rudigkeit, N.; van Beijnum, B.J.F.; Poel, M.; Veltink, P.H. Time Coherent Full-Body Poses Estimated Using Only Five Inertial Sensors: Deep versus Shallow Learning. Sensors 2019, 19, 3716. [Google Scholar] [CrossRef] [PubMed] [Green Version]
Figure 1. Overview of the proposed Motion-sphere.
Applsci 10 06462 g001
Figure 2. Three-dimensional (3D) avatar hierarchy.
Applsci 10 06462 g002
Figure 3. (a) A trajectory representing the lower right arm (red line) on the unit sphere. (b) Trajectory amounting to 90° toward the front (indicated by the labels), on a grid mapped Motion-sphere.
Applsci 10 06462 g003
Figure 4. Upper arm has a 90° swing toward the right of the body and, the lower arm has a 90° swing in front of the upper arm: (a) A combined swing movement of parent–child (upper right arm–lower right arm) on the avatar. (b) Visualization of the combined swing movement on a Motion-sphere.
Applsci 10 06462 g004
Figure 5. 3D Models adopted to intuitively visualize the twist. A gradient color is used to color the models based the degree of twist.
Applsci 10 06462 g005
Figure 6. An example of a twist-swing combined motion. (a) A front swing of the right lower arm to the body (120°), with a positive twist (gradient red shade 0°–64.2°–75.9°). (b) The avatar view is as seen from the person’s right side.
Applsci 10 06462 g006
Figure 7. Visualization of right upper arm ( b 2 ) movement for a rotational backward arm swing.
Applsci 10 06462 g007
Figure 8. (a) Reconstruction of the right upper leg range of motion (ROM) movement of TotalCapture on a 3D avatar (b) Visualization of the movement on a Motion-sphere for b 6 (c) Visualization of b 7 movement.
Applsci 10 06462 g008
Figure 9. (a) Reconstruction of the ROM movement of the lower arms on a 3D avatar (b) Visualization of the right arm ( b 2 , b 3 ) on a Motion-sphere.
Applsci 10 06462 g009
Figure 10. (a) Overlapping avatar depicting movement between the two key poses 1, and 2 (b) Visualization of trajectory on the sphere associated with pelvis ( b 0 ), selected among the menu options (c) Visualization of trajectory on the sphere associated with chest ( b 1 ), selected among the menu options.
Applsci 10 06462 g010
Figure 11. Validation of the motion reconstruction with our 3D Avatar: (a) Reconstruction of the TotalCapture Range of Motion (Subject 1) data (b) Reconstruction of our user data.
Applsci 10 06462 g011
Figure 12. Swing angle measurement between the target bone segment and its parent bone segment for the ground truth.
Applsci 10 06462 g012
Figure 13. Accuracy of swing visualization w.r.t. the grid size.
Applsci 10 06462 g013
Figure 14. (a) Average participant’s swing prediction error against the ground truth (b) Average participant’s twist prediction error against the ground truth, for Motion-belt, Video and Motion-sphere.
Applsci 10 06462 g014
Figure 15. (a) Average error as predicted by the participants against ground truth (b) Learnability of Motion-sphere against Video and Motion-belt, accuracy of the prediction over iterations.
Applsci 10 06462 g015
Figure 16. Comparison of human motion in multiple users’ data. (a) Visualization of user’s right upper arm ( b 2 ) data on the sphere. (b) Users performing upper arm movements.
Applsci 10 06462 g016
Figure 17. (a) Trajectories of the right upper arm ( b 2 ) for both the authored and sensor-acquired. (b) Key frames (1 and 2) as performed by the user and as authored on the 3D avatar.
Applsci 10 06462 g017
Figure 18. (a) Eight key frames authored using the Motion-sphere by editing the points on the unit sphere and three-dimensional (3D) reconstruction on a virtual avatar. (b) Visualization of full body trajectory for squat movement authored using a Motion-sphere.
Applsci 10 06462 g018
Table 1. Swing visualization accuracy of Motion-sphere against the ground truth: the measured swing is with respect to the parent joint segment.
Sl. NoType of MotionGround Truth
(in Degree)
Measured
(in Degree)
Standard
Error
1Lower Arm Swing1181224.69
2Upper Arm Swing183178
3Lower Leg Swing105107
4Upper Leg Swing108103

