Article

A Machine Learning Approach to Predicting Readmission or Mortality in Patients Hospitalized for Stroke or Transient Ischemic Attack

1
Division of Neurology, Department of Internal Medicine, Ditmanson Medical Foundation Chia-Yi Christian Hospital, Chiayi 600, Taiwan
2
Department of Information Management and Institute of Healthcare Information Management, National Chung Cheng University, Chiayi 621, Taiwan
3
Department of Nursing, Min-Hwei Junior College of Health Care Management, Tainan 736, Taiwan
4
Department of Information Management, National Central University, Taoyuan 320, Taiwan
5
MOST AI Biomedical Research Center at National Cheng Kung University, Tainan 701, Taiwan
*
Author to whom correspondence should be addressed.
Ling-Chien Hung and Sheng-Feng Sung contributed equally to this work.
Appl. Sci. 2020, 10(18), 6337; https://doi.org/10.3390/app10186337
Submission received: 13 August 2020 / Revised: 7 September 2020 / Accepted: 9 September 2020 / Published: 11 September 2020
(This article belongs to the Special Issue Medical Artificial Intelligence)

Abstract

:
Readmissions after stroke are not only associated with greater levels of disability and a higher risk of mortality but also increase overall medical costs. Predicting readmission risk and understanding its causes are thus essential for healthcare resource allocation and quality improvement planning. By using machine learning techniques on initial admission data, this study aimed to develop prediction models for readmission or mortality after stroke. During model development, resampling methods were implemented to balance the class distribution. Two-layer nested cross-validation was used to build and evaluate the prediction models. A total of 3422 patients were included for analysis. The 90-day rate of readmission or mortality was 17.6%. This study identified several important predictive factors, including age, prior emergency department visits, pre-stroke functional status, stroke severity, body mass index, consciousness level, and use of a nasogastric tube. The Naïve Bayes model with class weighting to compensate for class imbalance achieved the highest discriminatory capacity in terms of the area under the receiver operating characteristic curve (0.661). Despite having room for improvement, the prediction models could be used for early risk assessment of patients with stroke. Identification of patients at high risk for readmission or mortality immediately after admission has the potential of enabling early discharge planning and transitional care interventions.

1. Introduction

Stroke is a leading cause of mortality and adult disability worldwide [1,2]. It causes a huge financial burden on the healthcare system [3]. Stroke survivors are prone to recurrence of stroke. Approximately 7% to 12% of patients with a first ischemic stroke have stroke recurrence within one year [4,5]. In addition, patients with stroke are likely to develop complications such as pneumonia, urinary tract infection, falls, etc., which may have a deleterious effect on the outcome of stroke [6]. As a result, a substantial proportion of stroke survivors are readmitted for various reasons after the initial hospitalization. In Taiwan, the 30-day readmission rate in patients with stroke was around 10% [7,8], and the 1-year readmission rate was between 30% and 43% [7,8,9,10]. Moreover, nearly 30% of the first-year medical cost for patients with stroke was spent on readmission [9]. Therefore, readmission after stroke is costly and needs more attention.
Patients with stroke who are readmitted have greater levels of disability, a higher risk of mortality, and more medical resource utilization than those not readmitted [11,12]. At the same time, risk-standardized mortality and readmission rates are used as indicators for hospital performance [13]. Even though it is arguable to link these indicators to reimbursement [14], the US Centers for Medicare & Medicaid Services (CMS) has implemented a program to reduce payments to hospitals with excess readmissions [15]. Specifically, for stroke care, CMS uses a hospital-level 30-day risk-standardized all-cause readmission measure to determine payments to hospitals [16]. Hospitals would thereby be penalized if their risk-standardized readmission rates were higher than expected [17]. Similarly, in Taiwan, the rate of unplanned 14-day readmission for the same or a related diagnosis and crude mortality rate are among the continuous monitoring indicators of care quality of Taiwan’s hospital accreditation system [18]. While the hospital level is determined based on the results of hospital accreditation, it in turn determines the reimbursement a hospital will receive from the National Health Insurance program in Taiwan.
Thorough knowledge of the risk and causes of readmission or mortality is thus essential for both quality improvement planning and healthcare resource allocation. Because the occurrence of medical complications increases the risk of readmission or mortality, aggressive management, and treatment of complications that are potentially modifiable might be able to reduce readmissions or mortality following stroke [6,8,19]. Furthermore, early risk assessment using information available upon admission might help identify high-risk patients for targeted interventions, which could possibly prevent avoidable readmissions, reduce mortality and improve functional outcomes, and even enhance the financial health of hospitals.
Because machine learning (ML) techniques have been widely used in clinical decision support, this study aimed to use ML-based techniques to explore the predictive factors and to develop prediction models for readmission or mortality in patients hospitalized for stroke or transient ischemic attack (TIA). Specifically, this study compared prediction models that were developed using various ML techniques based on initial admission data from a large teaching hospital in Taiwan.

2. Materials and Methods

2.1. Study Population

The study hospital is a 1000-bed teaching hospital serving a city and its adjoining rural areas of approximately 500,000 inhabitants. The study population was identified from the hospital stroke registry, which enrolled consecutive patients hospitalized for ischemic stroke, hemorrhagic stroke, or TIA within 10 days of symptom onset. Ischemic stroke, hemorrhagic stroke, and TIA were defined in accordance with the criteria of the Taiwan Stroke Registry [20]. Adult patients admitted with the principal diagnosis of stroke or TIA between October 2007 and January 2016 who were discharged alive were identified. Only those who gave informed consent to participate in the stroke registry were included. Patients who were lost to follow-up at 90 days were excluded. The earliest admission during the study period was designated as the index hospitalization. The study protocol was approved by the Ditmanson Medical Foundation Chia-Yi Christian Hospital Institutional Review Board (CYCH-IRB No.104098).

2.2. Variables

The dependent variable of the dataset was a combined outcome of readmission or mortality within 90 days after discharge from the index hospitalization. While previous studies mainly focused on 30-day readmission models [21,22], around half of the first readmissions within one year after stroke occurred within 90 days [8]. The prediction of 90-day readmission after stroke has gained attention in recent years [23,24].
As a standard operating protocol for the stroke registry, each patient was interviewed in person or by telephone at 90 days. Information was obtained from a proxy for patients who could not be interviewed because of neurological deficits or death. The reason to use a combined outcome was to avoid underestimation of readmission rates. Patients who did not survive until hospitalization because of critical illness or sudden death might be recorded as dead rather than readmission during the telephone interview.
The independent variables included variables that were available upon admission, such as demographic data, initial vital signs and laboratory results, past medical history and comorbidities, treatment-seeking behavior, pre-stroke functional status as assessed using the modified Rankin Scale (mRS), and initial stroke severity as assessed using the National Institutes of Health Stroke Scale (NIHSS). Age, pre-stroke mRS, and initial NIHSS were treated as continuous variables. The frequency of prior emergency department (ED) visits within one year was categorized into 0, 1, or ≥2 visits. Prior hospitalizations within one year before the index hospitalization were categorized as yes or no. Physiological measurements and laboratory values were categorized into meaningful groups to align with clinical practice (Table S1). For example, the body mass index (BMI) status was categorized according to the local standard as follows: underweight (<18.5 kg/m2), normal (18.5–23.9 kg/m2), overweight (24–26.9 kg/m2), and obese (≥27 kg/m2) [25].

2.3. Machine Learning Techniques

Various ML algorithms, including C4.5, classification, and regression tree (CART), k-nearest neighbor (kNN), logistic regression (LR), multilayer perceptron (MLP), Naïve Bayes (NB), random forest (RF), and support vector machines (SVM) were used to build classifiers for prediction of readmission or mortality. Specifically, the J48, SimpleCart, IBK, Logistic, MultilayerPerceptron, NaiveBayes, RandomForest, and SMO modules of Weka 3.8.3 open-source data mining software (Hamilton, New Zealand, www.cs.waikato.ac.nz/ml/weka) were used.
Class imbalance is common in health-related datasets and may distort the performance evaluation of ML methods because of their preference towards the majority class. Therefore, cost-sensitive learning and data resampling have been widely used to address this problem [26,27]. This study implemented several resampling methods, including undersampling, oversampling, synthetic minority oversampling technique (SMOTE), and class weighting, to investigate their effect on the performance of classifiers. Specifically, the SpreadSubsample, Resample, SMOTE, and ClassBalancer filters in Weka were used.

2.4. Experiments

Experiments were conducted using Python 3.7 with the python-weka-wrapper3 package version 0.1.7 running on the MacOS 10.15 operating system. The scripts can be downloaded from Supplementary Material. Figure 1 illustrates the process of the classifier building. Two-layer nested cross-validation was used to build and evaluate the classifiers. In the outer loop, the dataset was split into 10 folds containing a training set and a holdout test set in a 9:1 ratio using stratified random sampling. The process of data splitting was repeated three times by varying the random seed, thus generating 30 training and test set pairs. In the inner loop, the training set was used to build classifiers, for which another 10-fold cross-validation was used to find the optimal hyperparameters (Table 1). The classifiers with the optimal hyperparameters were tested on the holdout test set. Then the evaluation metrics from the 30 training and test set pairs were averaged to estimate the generalization performance of classifiers. This approach ensures that the training, validation, and evaluation data are completely separated.
Feature selection is a common ML technique. It has the potential of improving training efficiency, result comprehensibility, and prediction performance. Therefore, during the experiments, feature selection was applied to the training sets mainly to filter out redundant and/or irrelevant features from the original data to build a more explainable model. In this study, the correlation-based feature subset selection (CfsSubsetEval module in Weka) with the BestFirst search method was used to perform the feature selection procedure. A correlation-based feature selection method was used to evaluate the correlations between feature subsets and the dependent variable. The optimal feature subset contains features that are highly correlated with the dependent variable, but uncorrelated with each other [28]. The best first search strategy was used to find an optimal feature subset from the feature space. This approach does not specify a threshold to determine the most important features. Instead, the search terminates when the limit of the number of fully expanded subsets that result in no improvement is reached [28].

2.5. Evaluation Metrics and Statistical Analysis

Several metrics were calculated to evaluate the performance of classifiers built using different ML techniques and resampling methods. True positives (TP) indicate the number of patients correctly classified as having the outcome whereas true negatives (TN) mean the number of patients correctly classified as not having the outcome. False positives (FP) indicate the number of patients incorrectly classified as having the outcome while false negatives (FN) mean the number of patients incorrectly classified as not having the outcome. Accuracy is (TP + TN) / (TP + TN + FP + FN). Sensitivity is TP / (TP + FN) whereas specificity is TN / (TN + FP). The receiver operating characteristic (ROC) curve displays the full picture of the trade-off between sensitivity and specificity by plotting sensitivity as a function of (1 − specificity) for all possible thresholds. The performance of classifiers was compared according to the area under the ROC curve (AUC).
Continuous variables were reported with means and standard deviations or medians with interquartile ranges, and categorical variables were reported with counts and percentages. Clinical features between patient groups were compared by Chi-square tests for categorical variables and t-tests or Mann–Whitney U tests for continuous variables. The average of the estimates from the 30 dataset pairs were compared using paired t-tests. All statistical analyses were performed using Stata 15.1 (StataCorp, College Station, Texas). Two-tailed p values < 0.05 were considered statistically significant.

3. Results

A total of 5581 eligible patients were identified from the hospital stroke registry. After excluding patients who did not give informed consent (n = 1384) and those who were lost to follow-up at 90 days (n = 775), the remaining 3422 patients comprised the study population. The study population did not differ statistically from those who were excluded in age (68.3 ± 12.6 versus 68.3 ± 12.9, p = 0.928), sex (female 39.9% versus 41.3%, p = 0.317), and stroke severity (NIHSS median 4, interquartile range [IQR] 2–9 versus 5, IQR 2–11, p = 0.056). Table 2 gives the demographics and characteristics of the stroke of the study population. Patients with the combined outcome were older, more likely to be female, and had greater stroke severity. The 90-day rate of readmission or mortality was 17.6% (602/3422). Table S1 lists the independent variables considered to build the models. Most of the variables were significantly different between groups.

3.1. Important Features

Correlation-based feature selection was applied to the 30 training sets to find the optimal feature subset. Table 3 lists the features and the times that each feature was selected from the training sets. Among them, age, prior ED visits within one year, pre-stroke functional status as assessed by the mRS, initial stroke severity as assessed by the NIHSS, BMI, consciousness level as assessed by the Glasgow Coma Scale, and use of nasogastric tube were the most important features that predict readmission or mortality at 90 days after stroke. These features were constantly selected by the feature selection algorithm from the 30 different training sets. In addition, failed dysphagia screening test, coronary artery disease, cancer, heart failure, atrial fibrillation, recent infection, prior hospitalization within one year, the stage of renal dysfunction as assessed by the estimated creatinine clearance rate, and use of Foley catheter, which were selected in more than 20 out of the 30 feature selection processes, were also key features.

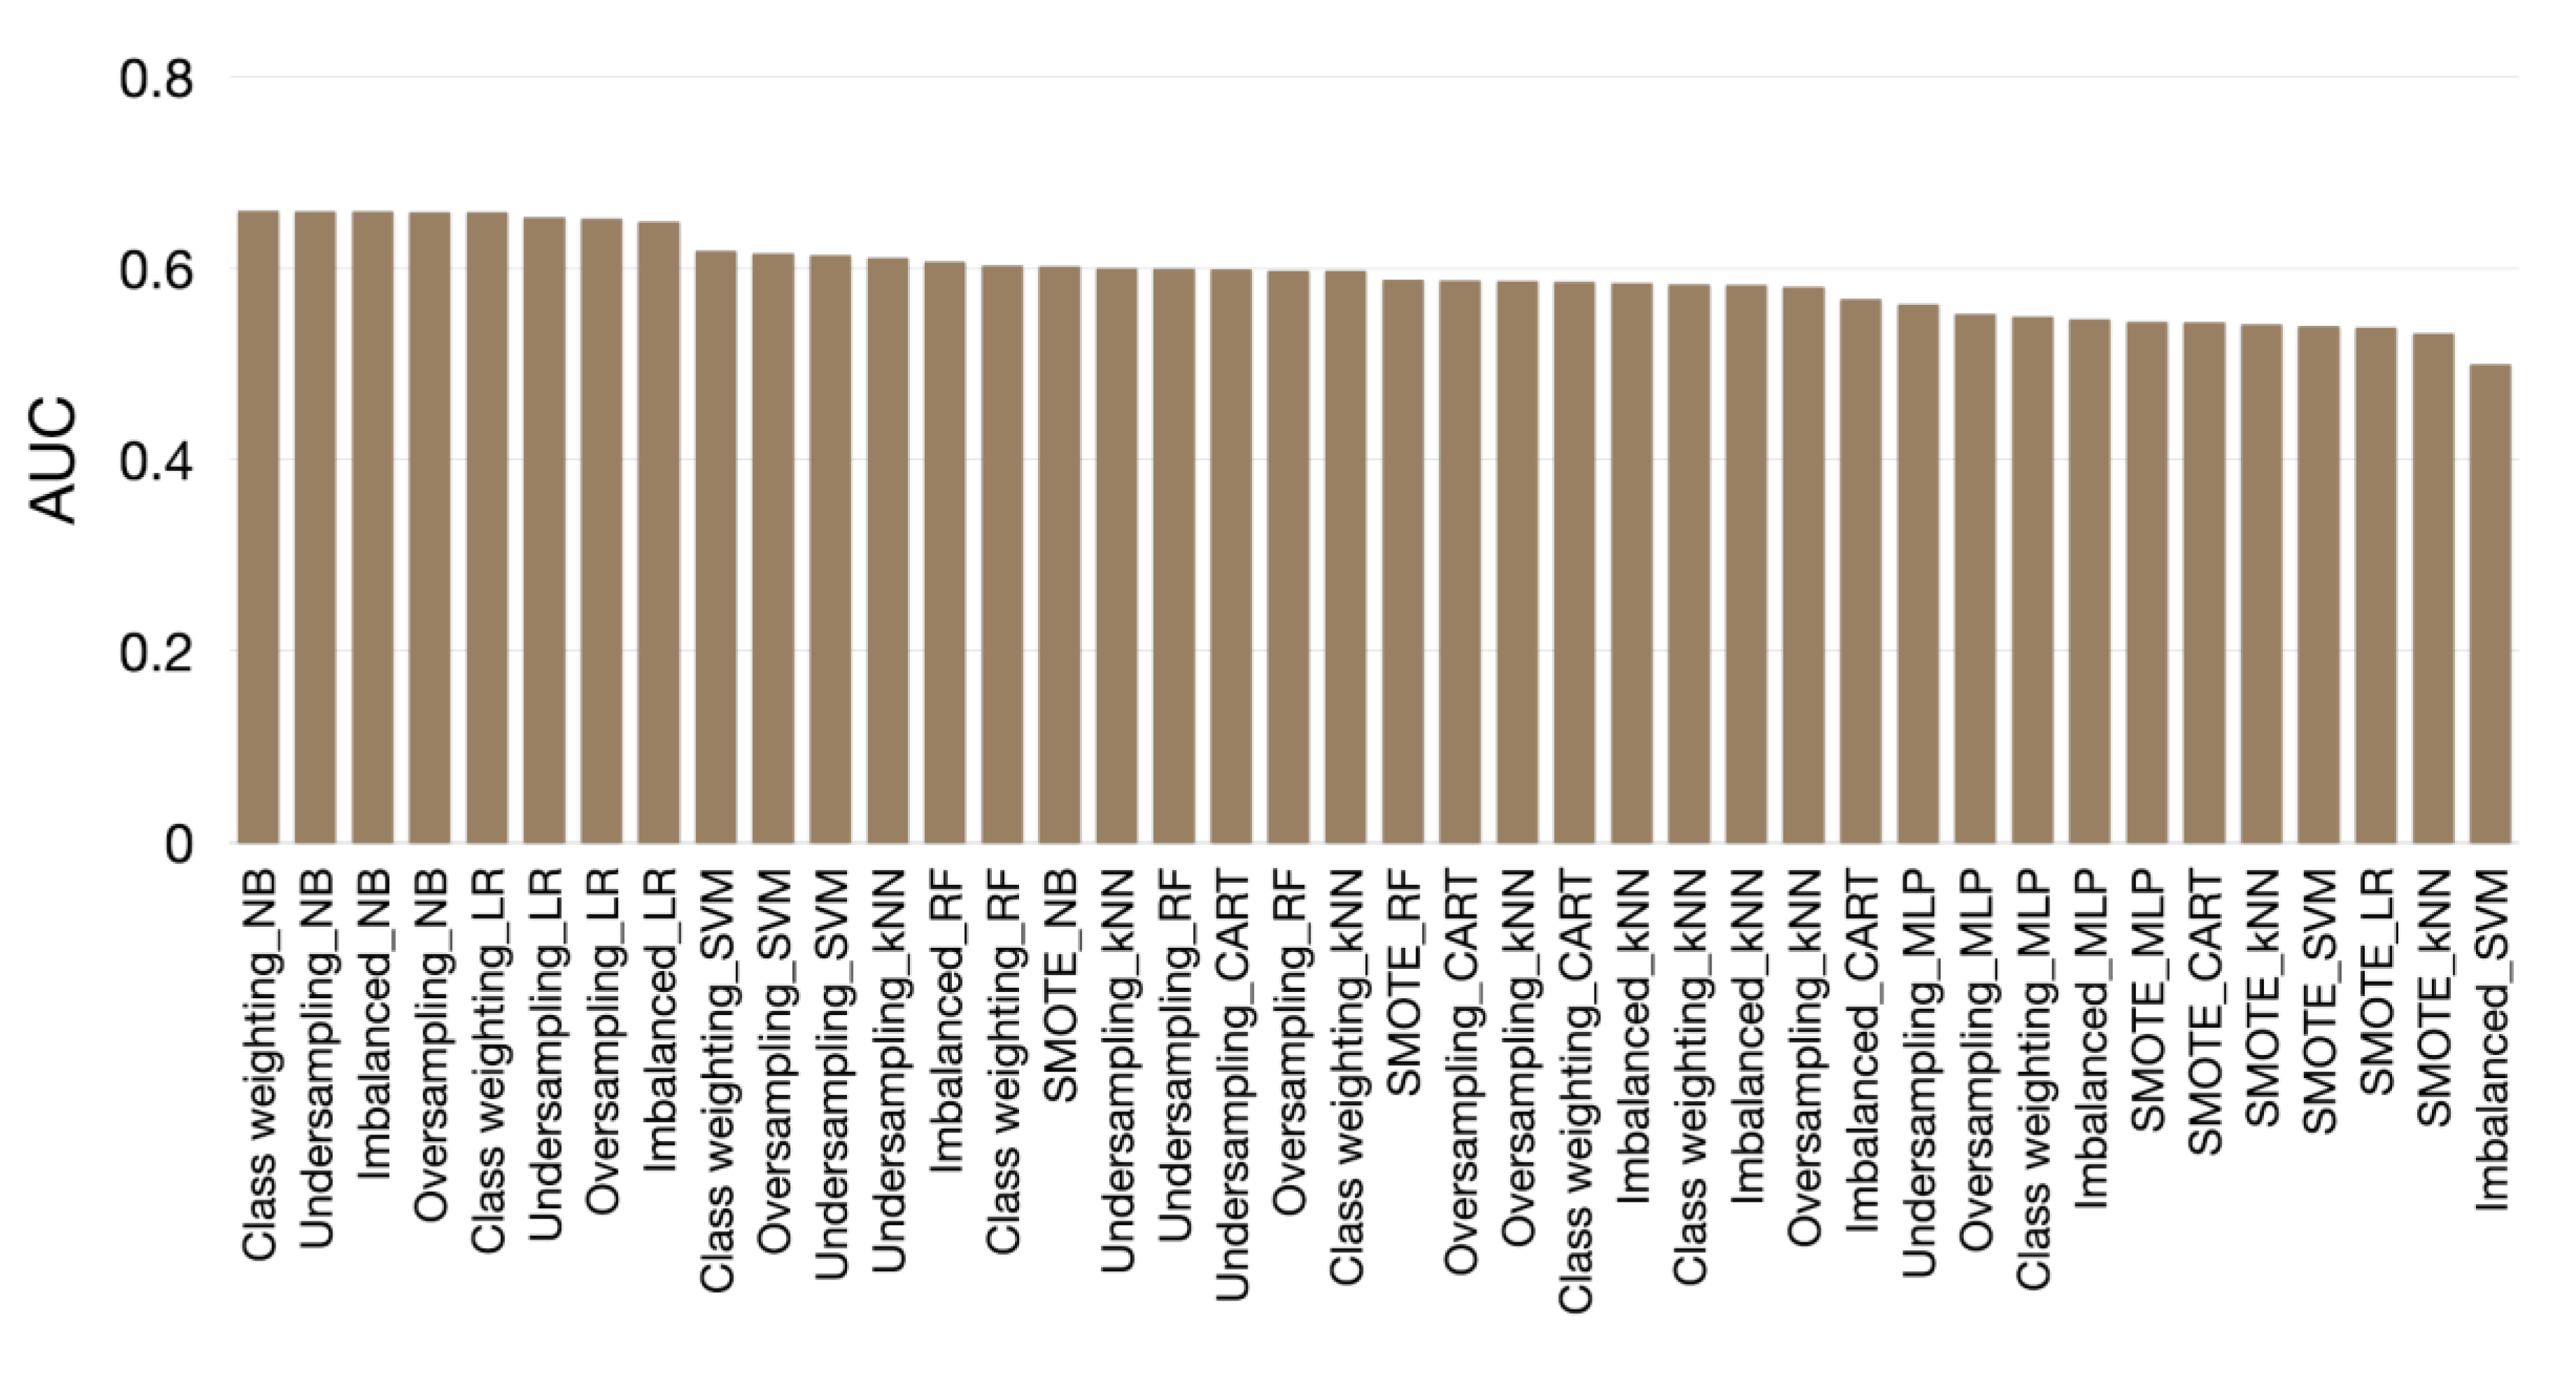
3.2. Evaluation Results

Table 4 gives the average AUC, sensitivity, specificity, and accuracy of various prediction models. The average AUC values across the ML techniques and resampling methods are displayed as a heatmap in Figure 2. In general, the AUC values of NB (0.602–0.661) and LR models (0.539–0.659) were higher than those of the other ML techniques, whereas MLP models (0.545–0.563) had the lowest AUC values. Among the data resampling methods, the undersampling method improved the performance of prediction for most of the ML techniques. On the contrary, the SMOTE method resulted in lower performance for all the ML techniques. Figure 3 shows the average AUC values ordered from the highest to the lowest. NB models with class weighting, undersampling, imbalanced, and oversampling, and LR with class weighting ranked the top five. The AUC values between the top five models were not significantly different according to paired t-tests.

4. Discussion

4.1. Principal Findings

By analyzing a hospital stroke registry, this study found a rate of readmission or mortality of 17.6% at 90 days after stroke or TIA. The most important features that predict readmission or mortality included age, prior ED visits within one year, pre-stroke functional status, initial stroke severity, BMI, consciousness level, and use of nasogastric tube. Several ML techniques were applied to build prediction models. NB and LR models performed better than the other models in terms of AUC. The best model, i.e., the NB model with class weighting, achieved an AUC of 0.661. Although data resampling was expected to improve the performance of prediction, not all resampling methods performed equally well. Among them, the undersampling method improved prediction performance for most of the ML techniques.

4.2. Comparisons with Past Studies

Previous studies that examined 90-day readmissions after stroke have found readmission rates ranging from around 18% to 26% [12,24,29,30] even though the inclusion criteria and outcome measures varied slightly across studies. The rate of readmission or mortality in this study was similar to those in previous reports. However, this study differed from previous readmission models in that only the variables available upon stroke admission were used to build the prediction models.
Several prior studies have investigated readmissions in patients with stroke admitted to post-acute-care or inpatient rehabilitation facilities [21,22,31]. Even though their predictor variables were more informative and generally included past medical history, comorbidities, complications during acute care, and factors related to post-acute care [21,22,31], their values of AUC were not much different from those in this study. For example, a large retrospective study of 803,124 patients with stroke using inpatient rehabilitation facility functional outcome data achieved AUC values ranging from 0.553 to 0.694 in predicting 30-day readmissions [21]. In other words, the prediction of readmission after stroke is not a trivial task. This is probably because various patient clinical and social characteristics are associated with readmission and these characteristics are not always routinely collected in clinical databases [32].
In addition to readmission models for stroke, a systematic review found that readmission models for various disease populations based on administrative data, clinical data, or both generally performed inadequately [33]. Those tested in large populations had a particularly poor discriminative ability with AUCs between 0.55 and 0.65. A study that developed readmission models for heart failure also reported that the use of ML algorithms did not improve prediction performance compared with traditional statistical models [34].

4.3. Clinical Implications and Applications in Real-World Settings

The mechanisms underlying readmission are complex and remain incompletely understood. In addition to physiological factors and medical conditions, a variety of psychological, social, and economical factors may intertwine with each other to cause readmission. As shown in Table 3, variables related to socioeconomic statuses such as education and occupation, and variables regarding social support such as ED arrival mode and patient’s main caregiver, were more or less associated with the risk of readmission. Moreover, without adequate hospital discharge planning and transitional care interventions, patients may be readmitted after discharge from acute stroke care even though their medical conditions have been properly treated. For example, family members may lack the training, skills, and support services to provide caregiving for disabled stroke survivors, and therefore, bring patients back to the hospital. Adequate preparation and support for transition from acute stroke care to home may be required to reduce readmissions [24].
Previous studies have shown that a substantial proportion (up to 12.9%) of readmissions were potentially preventable [16,35]. Even though hospital discharge planning has the potential of preventing readmissions [36], one of the key steps is to identify patients at risk of readmission, preferably in the early stage of admission. The prediction models in this study were developed using only variables available upon admission and, therefore, can be used to estimate the probability of readmission soon after patients are admitted to the hospital. A clinical decision support system employing the ML prediction models developed in this study can facilitate clinicians to identify patients likely to experience readmission upon hospital admission. In this way, early targeted interventions for patients at high risk of readmission can be enabled. Certainly, these predischarge interventions should be tailored to the individual patient according to the estimated risk of readmission and may include patient needs assessment, patient education, medication reconciliation, the arrangement of early outpatient follow-up, and referrals to home health rehabilitation [37,38,39]. Furthermore, after hospital discharge, at-risk patients identified by the prediction models can be closely monitored to detect in time whether they are having problems and about to bounce back [40].

4.4. Future Directions

Several approaches may be attempted to improve the performance of prediction models for readmission. First, high-dimensional information in administrative claims data may be used to supplement clinical information in the development of prediction models. Readmission models for patients with chronic pancreatitis using standardized billing codes and basic patient characteristics were found to perform reasonably with AUCs ranging from 0.65 to 0.73 [41]. Second, in addition to structured clinical information, significant determinants of readmission, such as social factors, can be extracted from clinical notes through natural language processing [42], and in turn, used to build prediction models. Third, other ML algorithms can be explored. For example, extreme gradient boosting models were shown to have higher AUCs than traditional statistical models in predicting 90-day readmissions due to recurrent ischemic events in patients with ischemic stroke [23].

4.5. Limitations

First, this is a single-hospital study and the generalizability of the study findings should therefore be made with caution. Second, about 39% (2159/5581) of patients were excluded from the analysis because of declining informed consent or missing 3-month data. However, the possibility of selection bias might not be a concern because the study population did not differ from excluded patients in age, sex, and stroke severity. Third, the dependent variable of interest, i.e., readmission or mortality, was obtained through interviews with patients or their proxies. Therefore, recall bias might cause underestimation of the dependent variable. Fourth, this study did not use variables related to the process of acute care or post-acute care hospitalizations to develop prediction models, thus possibly undermining the prediction performance. On the other hand, prediction models using only information available upon admission might be advantageous in delivering the early targeted intervention to patients at high risk of readmission or mortality.

5. Conclusions

This study developed ML-based models to predict readmission or mortality in patients hospitalized for stroke or TIA. Several important predictive factors that increase the risk of readmission or mortality were identified, including age, prior ED visits within one year, pre-stroke functional status, initial stroke severity, BMI, consciousness level, and use of nasogastric tube. Various resampling methods were implemented to balance the class distribution. Nevertheless, they did not always improve predictive performance. The NB model with class weighting to compensate for class imbalance achieved the highest prediction performance in terms of the AUC. Even though the prediction models did not have a high discriminatory capacity, these models could be useful for identifying patients at high risk for readmission or mortality immediately after admission and enable early discharge planning and transitional care interventions. Future studies may explore previously unrecognized predictive factors in clinical text or high-dimensional electronic medical records.

Supplementary Materials

The scripts of our experiments can be downloaded at the following link: https://osf.io/y9dqc/?view_only=c3da6cdfc50c4348b6d6b7537940b49e. The following are available online at https://www.mdpi.com/2076-3417/10/18/6337/s1, Table S1: Independent variables.

Author Contributions

Conceptualization, L.-C.H. and S.-F.S.; methodology, S.-F.S., and Y.-H.H.; software, S.-F.S.; validation, L.-C.H. and S.-F.S.; formal analysis, L.-C.H. and S.-F.S.; investigation, L.-C.H., S.-F.S., and Y.-H.H.; resources, S.-F.S.; data curation, L.-C.H.; writing—original draft preparation, L.-C.H. and S.-F.S.; writing—review and editing, S.-F.S. and Y.-H.H.; visualization, S.-F.S.; supervision, Y.-H.H.; project administration, Y.-H.H.; funding acquisition, S.-F.S. All authors have read and agreed to the published version of the manuscript.

Funding

This research was funded by the Ditmanson Medical Foundation Chia-Yi Christian Hospital Research Program, grant number R109-013.

Acknowledgments

We would like to thank Li-Ying Sung for English language editing.

Conflicts of Interest

The authors declare no conflict of interest.

References

  1. Roth, G.A.; Abate, D.; Abate, K.H.; Abay, S.M.; Abbafati, C.; Abbasi, N.; Abbastabar, H.; Abd-Allah, F.; Abdela, J.; Abdelalim, A.; et al. Global, regional, and national age-sex-specific mortality for 282 causes of death in 195 countries and territories, 1980–2017: A systematic analysis for the Global Burden of Disease Study 2017. Lancet 2018, 392, 1736–1788. [Google Scholar] [CrossRef] [Green Version]
  2. Kyu, H.H.; Abate, D.; Abate, K.H.; Abay, S.M.; Abbafati, C.; Abbasi, N.; Abbastabar, H.; Abd-Allah, F.; Abdela, J.; Abdelalim, A.; et al. Global, regional, and national disability-adjusted life-years (DALYs) for 359 diseases and injuries and healthy life expectancy (HALE) for 195 countries and territories, 1990–2017: A systematic analysis for the Global Burden of Disease Study 2017. Lancet 2018, 392, 1859–1922. [Google Scholar] [CrossRef] [Green Version]
  3. Johnson, C.O.; Nguyen, M.; Roth, G.A.; Nichols, E.; Alam, T.; Abate, D.; Abd-Allah, F.; Abdelalim, A.; Abraha, H.N.; Abu-Rmeileh, N.M.; et al. Global, regional, and national burden of stroke, 1990–2016: A systematic analysis for the Global Burden of Disease Study 2016. Lancet Neurol. 2019, 18, 439–458. [Google Scholar] [CrossRef] [Green Version]
  4. Bergström, L.; Irewall, A.-L.; Söderström, L.; Ögren, J.; Laurell, K.; Mooe, T. One-Year Incidence, Time Trends, and Predictors of Recurrent Ischemic Stroke in Sweden From 1998 to 2010. Stroke 2017, 48, 2046–2051. [Google Scholar] [CrossRef]
  5. Hsieh, C.-Y.; Wu, D.P.; Sung, S.-F. Trends in vascular risk factors, stroke performance measures, and outcomes in patients with first-ever ischemic stroke in Taiwan between 2000 and 2012. J. Neurol. Sci. 2017, 378, 80–84. [Google Scholar] [CrossRef]
  6. Kumar, S.; Selim, M.H.; Caplan, L.R. Medical complications after stroke. Lancet Neurol. 2010, 9, 105–118. [Google Scholar] [CrossRef]
  7. Li, H.-W.; Yang, M.-C.; Chung, K.-P. Predictors for readmission of acute ischemic stroke in Taiwan. J. Formos. Med Assoc. 2011, 110, 627–633. [Google Scholar] [CrossRef] [Green Version]
  8. Lin, H.-J.; Chang, W.-L.; Tseng, M.-C. Readmission after stroke in a hospital-based registry: Risk, etiologies, and risk factors. Neurology 2011, 76, 438–443. [Google Scholar] [CrossRef]
  9. Lee, H.-C.; Chang, K.-C.; Huang, Y.-C.; Hung, J.-W.; Chiu, H.-H.E.; Chen, J.-J.; Lee, T.-H. Readmission, mortality, and first-year medical costs after stroke. J. Chin. Med Assoc. 2013, 76, 703–714. [Google Scholar] [CrossRef] [Green Version]
  10. Hsieh, C.-Y.; Lin, H.-J.; Hu, Y.-H.; Sung, S.-F. Stroke severity may predict causes of readmission within one year in patients with first ischemic stroke event. J. Neurol. Sci. 2017, 372, 21–27. [Google Scholar] [CrossRef]
  11. Kind, A.; Smith, M.; Liou, J.-I.; Pandhi, N.; Frytak, J.R.; Finch, M.D. The price of bouncing back: One-year mortality and payments for acute stroke patients with 30-day bounce-backs. J. Am. Geriatr. Soc. 2008, 56, 999–1005. [Google Scholar] [CrossRef] [PubMed]
  12. Bjerkreim, A.T.; Thomassen, L.; Brøgger, J.C.; Waje-Andreassen, U.; Næss, H. Causes and Predictors for Hospital Readmission after Ischemic Stroke. J. Stroke Cerebrovasc. Dis. 2015, 24, 2095–2101. [Google Scholar] [CrossRef] [PubMed]
  13. Fonarow, G.C.; Smith, E.E.; Reeves, M.J.; Pan, W.; Olson, D.; Hernandez, A.F.; Peterson, E.D.; Schwamm, L.; for the Get With the Guidelines Steering Committee and Hospitals. Hospital-Level Variation in Mortality and Rehospitalization for Medicare Beneficiaries With Acute Ischemic Stroke. Stroke 2011, 42, 159–166. [Google Scholar] [CrossRef] [PubMed] [Green Version]
  14. Axon, R.N.; Williams, M.V. Hospital Readmission as an Accountability Measure. JAMA 2011, 305, 504–505. [Google Scholar] [CrossRef] [PubMed]
  15. Daras, L.C.; Ingber, M.J.; Carichner, J.; Barch, D.; Deutsch, A.; Smith, L.M.; Levitt, A.; Andress, J. Evaluating Hospital Readmission Rates After Discharge From Inpatient Rehabilitation. Arch. Phys. Med. Rehabilitation 2018, 99, 1049–1059. [Google Scholar] [CrossRef]
  16. Lichtman, J.H.; Leifheit-Limson, E.C.; Jones, S.B.; Wang, Y.; Goldstein, L.B. Preventable Readmissions Within 30 Days of Ischemic Stroke Among Medicare Beneficiaries. Stroke 2013, 44, 3429–3435. [Google Scholar] [CrossRef] [Green Version]
  17. Fisher, S.R.; Graham, J.E.; Krishnan, S.; Ottenbacher, K.J. Predictors of 30-Day Readmission Following Inpatient Rehabilitation for Patients at High Risk for Hospital Readmission. Phys. Ther. 2016, 96, 62–70. [Google Scholar] [CrossRef] [Green Version]
  18. Chiu, W.-T.; Yang, C.-M.; Lin, H.-W.; Chu, T.-B. Development and implementation of a nationwide health care quality indicator system in Taiwan. Int. J. Qual. Heal. Care 2006, 19, 21–28. [Google Scholar] [CrossRef] [Green Version]
  19. Shah, S.V.; Corado, C.; Bergman, D.; Curran, Y.; Bernstein, R.A.; Naidech, A.M.; Prabhakaran, S. Impact of Poststroke Medical Complications on 30-Day Readmission Rate. J. Stroke Cerebrovasc. Dis. 2015, 24, 1969–1977. [Google Scholar] [CrossRef]
  20. Hsieh, F.-I.; Lien, L.-M.; Chen, S.-T.; Bai, C.-H.; Sun, M.-C.; Tseng, H.-P.; Chen, Y.-W.; Chen, C.-H.; Jeng, J.-S.; Tsai, C.-F.; et al. Get With The Guidelines-Stroke Performance Indicators: Surveillance of Stroke Care in the Taiwan Stroke Registry: Get With The Guidelines-Stroke in Taiwan. Circulation 2010, 122, 1116–1123. [Google Scholar] [CrossRef] [Green Version]
  21. Slocum, C.; Gerrard, P.; Black-Schaffer, R.; Goldstein, R.; Singhal, A.; Divita, M.A.; Ryan, C.M.; Mix, J.; Purohit, M.; Niewczyk, P.; et al. Functional Status Predicts Acute Care Readmissions from Inpatient Rehabilitation in the Stroke Population. PLoS ONE 2015, 10, e0142180. [Google Scholar] [CrossRef] [PubMed]
  22. Fehnel, C.R.; Lee, Y.; Wendell, L.C.; Thompson, B.B.; Potter, N.S.; Mor, V. Post–Acute Care Data for Predicting Readmission After Ischemic Stroke: A Nationwide Cohort Analysis Using the Minimum Data Set. J. Am. Hear. Assoc. 2015, 4, e002145. [Google Scholar] [CrossRef] [PubMed] [Green Version]
  23. Xu, Y.; Yang, X.; Huang, H.; Peng, C.; Ge, Y.; Wu, H.; Wang, J.; Xiong, G.; Yi, Y. Extreme Gradient Boosting Model Has a Better Performance in Predicting the Risk of 90-Day Readmissions in Patients with Ischaemic Stroke. J. Stroke Cerebrovasc. Dis. 2019, 28, 104441. [Google Scholar] [CrossRef]
  24. Kilkenny, M.F.; Dalli, L.L.; Kim, J.; Sundararajan, V.; Andrew, N.E.; Dewey, H.M.; Johnston, T.; Alif, S.M.; Lindley, R.I.; Jude, M.; et al. Factors Associated With 90-Day Readmission After Stroke or Transient Ischemic Attack. Stroke 2020, 51, 571–578. [Google Scholar] [CrossRef]
  25. Chu, N.-F. Prevalence of obesity in Taiwan. Obes. Rev. 2005, 6, 271–274. [Google Scholar] [CrossRef]
  26. Rao, R.R.; Makkithaya, K. Learning from a Class Imbalanced Public Health Dataset: A Cost-based Comparison of Classifier Performance. Int. J. Electr. Comput. Eng. (IJECE) 2017, 7, 2215. [Google Scholar] [CrossRef]
  27. Chen, J.; Lalor, J.; Liu, W.; Druhl, E.; Granillo, E.; Vimalananda, V.G.; Yu, H.; Cronin, R.; Sulieman, L. Detecting Hypoglycemia Incidents Reported in Patients’ Secure Messages: Using Cost-Sensitive Learning and Oversampling to Reduce Data Imbalance. J. Med. Internet Res. 2019, 21, e11990. [Google Scholar] [CrossRef] [Green Version]
  28. Hall, M.A. Correlation-based feature selection for machine learning. Ph.D. Thesis, The University of Waikato, Hamilton, New Zealand, April 1999. [Google Scholar]
  29. Ottenbacher, K.J.; Graham, J.E.; Lee, J.; Al Snih, S.; Karmarkar, A.; Reistetter, T.; Ostir, G.V.; Ottenbacher, A.J. Hospital Readmission in Persons With Stroke Following Postacute Inpatient Rehabilitation. J. Gerontol. Ser. A Boil. Sci. Med. Sci. 2012, 67, 875–881. [Google Scholar] [CrossRef]
  30. Andrews, A.W.; Li, D.; Freburger, J.K. Association of Rehabilitation Intensity for Stroke and Risk of Hospital Readmission. Phys. Ther. 2015, 95, 1660–1667. [Google Scholar] [CrossRef]
  31. Ottenbacher, K.J.; Smith, P.M.; Illig, S.B.; Linn, R.T.; Fiedler, R.C.; Granger, C.V. Comparison of logistic regression and neural networks to predict rehospitalization in patients with stroke. J. Clin. Epidemiology 2001, 54, 1159–1165. [Google Scholar] [CrossRef]
  32. Hu, J.; Gonsahn, M.D.; Nerenz, D.R. Socioeconomic Status and Readmissions: Evidence From An Urban Teaching Hospital. Heal. Aff. 2014, 33, 778–785. [Google Scholar] [CrossRef] [PubMed] [Green Version]
  33. Kansagara, D.; Englander, H.; Salanitro, A.; Kagen, D.; Theobald, C.; Freeman, M.; Kripalani, S. Risk Prediction Models for Hospital Readmission. JAMA 2011, 306, 1688. [Google Scholar] [CrossRef] [PubMed] [Green Version]
  34. Frizzell, J.D.; Liang, L.; Schulte, P.J.; Yancy, C.W.; Heidenreich, P.A.; Hernandez, A.F.; Bhatt, D.L.; Fonarow, G.C.; Laskey, W.K. Prediction of 30-Day All-Cause Readmissions in Patients Hospitalized for Heart Failure: Comparison of Machine Learning and Other Statistical Approaches. JAMA Cardiol. 2017, 2, 204–209. [Google Scholar] [CrossRef] [Green Version]
  35. Vahidy, F.; Donnelly, J.; McCullough, L.D.; Tyson, J.E.; Miller, C.C.; Boehme, A.K.; Savitz, S.I.; Albright, K.C. Nationwide Estimates of 30-Day Readmission in Patients With Ischemic Stroke. Stroke 2017, 48, 1386–1388. [Google Scholar] [CrossRef]
  36. Henke, R.M.; Karaca, Z.; Jackson, P.; Marder, W.D.; Wong, H.S. Discharge Planning and Hospital Readmissions. Med. Care Res. Rev. 2016, 74, 345–368. [Google Scholar] [CrossRef] [PubMed]
  37. Kripalani, S.; Theobald, C.; Anctil, B.; Vasilevskis, E.E. Reducing hospital readmission rates: Current strategies and future directions. Annu. Rev. Med. 2013, 65, 471–485. [Google Scholar] [CrossRef] [Green Version]
  38. Leppert, M.; Sillau, S.; Lindrooth, R.C.; Poisson, S.N.; Campbell, J.D.; Simpson, J.R. Relationship between early follow-up and readmission within 30 and 90 days after ischemic stroke. Neurology 2020, 94, e1249–e1258. [Google Scholar] [CrossRef]
  39. Hong, I.; Knox, S.; Pryor, L.; Mroz, T.M.; Graham, J.; Shields, M.F.; Reistetter, T.A. Is Referral to Home Health Rehabilitation Following Inpatient Rehabilitation Facility Associated With 90-Day Hospital Readmission for Adult Patients With Stroke? Am. J. Phys. Med. Rehabilitation 2020. [Google Scholar] [CrossRef]
  40. Bates, D.W.; Saria, S.; Ohno-Machado, L.; Shah, A.; Escobar, G. Big Data In Health Care: Using Analytics To Identify And Manage High-Risk And High-Cost Patients. Heal. Aff. 2014, 33, 1123–1131. [Google Scholar] [CrossRef] [Green Version]
  41. He, D.; Mathews, S.C.; Kalloo, A.N.; Hutfless, S.M. Mining high-dimensional administrative claims data to predict early hospital readmissions. J. Am. Med Informatics Assoc. 2014, 21, 272–279. [Google Scholar] [CrossRef] [Green Version]
  42. Navathe, A.S.; Zhong, F.; Lei, V.J.; Chang, F.Y.; Sordo, M.; Topaz, M.; Navathe, S.B.; Rocha, R.A.; Zhou, L. Hospital Readmission and Social Risk Factors Identified from Physician Notes. Heal. Serv. Res. 2017, 53, 1110–1136. [Google Scholar] [CrossRef] [PubMed]
Figure 1. The process of classifier building. In the outer loop, 10-fold cross-validation (CV) was used to estimate the performance of the classifiers. In the inner loop, another 10-fold CV was used to find the optimal hyperparameters.
Applsci 10 06337 g001
Figure 2. Heat map showing the area under the receiver operating characteristic curve (AUC) across the ML techniques and resampling methods. In the heat map, the red color indicates high, yellow intermediate, and green low values of AUC.
Applsci 10 06337 g002
Figure 3. Performance of various ML models in predicting 90-day readmission or mortality in patients hospitalized for stroke or transient ischemic attack. Prediction models are ordered according to the area under the receiver operating characteristic curve (AUC).
Applsci 10 06337 g003
Table 1. Machine learning (ML) techniques and hyperparameter tuning. NA = not applicable.
TechniquesHyperparametersRangeIncrement
NBNANANA
LRRidge valueDefaultNA
RFNumber of trees10–20010
kNNNumber of neighbors1–201
SVMComplexity0.5–1.00.5
KernelPolyKernel, RBFKernelNA
C4.5Confidence factor0.20–0.450.05
Minimum of number of instances per leaf2–201
CARTMinimum number of instances per leaf2–201
MLPLearning rate0.1–0.50.2
Momentum0.1–0.30.1
Table 2. Demographics and characteristics of stroke of the study population. TIA = transient ischemic attack. ICH = intracerebral hemorrhage. NIHSS = National Institute of Health Stroke Scale. SD = standard deviation. IQR = Interquartile range.
Clinical FeatureTotal (n = 3422)Readmission or Mortality within 90 Days
(n = 602)
No Readmission or Mortality within 90 Days
(n = 2820)
p
Age, years, mean (SD)68.3 (12.6)71.3 (12.3)67.7 (12.6)<0.001
Female, n (%)1366 (39.9)264 (43.9)1102 (39.1)0.030
Stroke type, n (%) 0.924
Ischemic stroke2622 (76.6)465 (77.2)2157 (76.5)
TIA467 (13.7)80 (13.3)387 (13.7)
ICH333 (9.7)57 (9.5)276 (9.8)
NIHSS, median (IQR)4 (2–9)6 (3–14)4 (2–8)<0.001
Table 3. Features selected among 30 training sets. BMI = body mass index. CAD = coronary artery disease. eCCr = estimated creatinine clearance rate. ED = emergency department. ESRD = end-stage renal disease. GCS = Glasgow Coma Scale. mRS = modified Rankin Scale. NIHSS = National Institutes of Health Stroke Scale.
FeaturesSelection Times (out of 30)
Age30
Prior ED visits within one year30
Pre-stroke mRS30
NIHSS30
BMI group30
GCS group30
Use of nasogastric tube30
Failed dysphagia screening test29
CAD29
Cancer29
Heart failure28
Atrial fibrillation27
Recent infection25
Prior hospitalization within one year23
eCCr stage22
Use of Foley catheter22
Hematocrit18
ESRD18
Hemoglobin18
Diabetes mellitus7
ED arrival mode4
Occupation2
Cared by attendant2
Education1
Use of birth control pill1
Table 4. The average performance of various models. AUC = area under the receiver operating characteristic curve.
AUCSensitivitySpecificityAccuracy
Imbalanced
C4.50.5830.0970.9600.808
CART0.5680.0710.9650.808
kNN0.5850.0440.9800.815
LR0.6490.0750.9830.823
MLP0.5470.1880.8840.762
NB0.6600.3280.8680.773
RF0.6070.0700.9560.800
SVM0.5000.0001.0000.824
Undersampling
C4.50.6000.5310.6420.623
CART0.5990.5260.6570.634
kNN0.6110.4340.7400.686
LR0.6530.5530.6800.657
MLP0.5630.4940.6210.599
NB0.6600.5030.7420.700
RF0.5990.5780.5750.575
SVM0.6140.4650.7630.711
Oversampling
C4.50.5810.4720.6560.624
CART0.5880.5160.6430.620
kNN0.5870.4820.6460.617
LR0.6520.5500.6880.663
MLP0.5520.3950.7080.653
NB0.6590.5110.7390.699
RF0.5980.3460.7720.697
SVM0.6160.4840.7480.701
SMOTE
C4.50.5420.2380.7960.698
CART0.5440.2630.7800.689
kNN0.5320.3130.7240.652
LR0.5390.3690.6960.638
MLP0.5450.2910.7740.689
NB0.6020.4310.7400.686
RF0.5880.1620.8700.745
SVM0.5400.3970.6820.632
Class weighting
C4.50.5840.4860.6570.627
CART0.5860.5020.6360.613
kNN0.5980.4880.6600.630
LR0.6590.5580.6930.669
MLP0.5500.3640.7380.673
NB0.6610.4990.7440.701
RF0.6030.2390.8440.737
SVM0.6180.4860.7510.704

