Article

Influencing Factors and Shear Capacity Formula of Single-Keyed Dry Joints in Segmental Precast Bridges under Direct Shear Loading

1
School of Civil Engineering & Experiment-Teaching Center for Mechanics, Central South University, 68 South Shaoshan Road, Changsha 410075, China
2
China Construction Fifth Engineering Division Corp. LTD., 158 First Zhongyi Road, Changsha 410004, China
3
School of Civil Engineering, Central South University, 68 South Shaoshan Road, Changsha 410075, China
4
School of Civil Engineering & National Engineering Laboratory for High Speed Railway Construction, Central South University, 68 South Shaoshan Road, Changsha 410075, China
*
Authors to whom correspondence should be addressed.
Appl. Sci. 2020, 10(18), 6304; https://doi.org/10.3390/app10186304
Submission received: 19 August 2020 / Revised: 6 September 2020 / Accepted: 8 September 2020 / Published: 10 September 2020

Abstract

:
This article investigates the nonlinear behavior of single-keyed dry joints in segmental precast bridges under direct shear loading on the basis of nonlinear finite element analysis on lots of specimens with concrete plastic damage considered. Through detailed discussion on existing research, influence factors of the ultimate shear capacity of the keyed dry joint are analyzed, a new shear capacity formula was proposed and evaluated. The feasibility and correctness of the FE simulation method were verified by comparison with the existed experimental results. Concrete tensile strength at the key root is critical to the ultimate bearing capacity of the single-keyed dry joint under the direct shear loading. Friction on the joint interface and dimension parameters of the key do not have much effect on the ultimate shear capacity. However, reasonable key inclination ( tan θ ) would be suggested as 0.7~0.9. In comparison with the predicted results obtained by other existed formulas, the proposed formula is demonstrated to be in perfect consistency with both tests and the FE simulation results.

1. Introduction

Through the segmental construction method was said firstly used in China on arch bridges in the 7th century and was used in Europe until the 12th century, the first segmental precast concrete bridge was Choisy-Le-Roi, built in 1962 by Eugène Freyssinet and Jean Muller, crossed the Seine River in France [1,2,3]. After that, with the development of prestressing techniques, segmental precast bridges are used in highway bridges, urban viaducts, and some railway bridges more and more [4,5,6,7]. In recent decades, due to the advantages of less traffic disturbance, low environmental pollution, and short construction period, segmental precast bridges are vigorously promoted in China, especially for the application in urban viaducts and transit railway [8,9,10].
Segmental precast bridges are defined as bridges consisted of discrete segments stressed together by prestressed tendons to form bridge superstructure and substructure [2,11]. Connected through the mechanical interlocking of multiple keys in the web section of the segments, segmental precast bridges are expected to behave as a monolithic structure and maintain allowable stress state for the serviceability limit state. In AASHTO (American Association of State Highway and Transportation Officials) bridge design specifications [12,13,14,15], it is emphasized allowable compression and tension stresses for segmental precast bridges depending on the type of joint and the presence or absence of bonded reinforcing across the joints. Without epoxy and temporary post-tensioning, dry joints are designed with smaller reduction factor for the shear capability and higher residual compression. These may result in thicker web walls or greater amounts of post-tensioning steel. But compared with undesirable brittle failure in epoxied joints, segmental precast bridges with dry joints are more favorable, moreover, cost-saving in epoxy construction [15,16,17,18]. Multiple keys distributed over the height of the web and flanges of the segments play important roles in the following three aspects, (1) aligning segments during erection, (2) transferring the shear force between segments during service, (3) ensuring durability by protecting the prestress tendons against corrosion where the tendons pass through the joints. According to AASHTO LRFD (Load Resistance Factor Design)-17 [12], shear keys between segments should be utilized to prevent relative sliding between adjacent segments in segmental precast bridges. In conclusion, the behavior of segmental precast bridges is dependent on the behavior of the joints between segments [19,20].
Through experiments and finite element analysis, researchers have demonstrated that the prestress value, shape, and number of the keys, concrete strength, friction coefficient, etc., are all significant parameters affecting the shear capacity of the dry joints. Based on the research results, the different shearing capacity formula of dry joints were proposed and discussed.
As early as in 1983, through experiments on different types of joints, including no keys, single large key, and multiple keys, Koseki and Breen [21] investigated the shear transfer strength across these types of joints used between adjacent segments of segmental precast bridges. Experimental results showed that the failure mode of the dry joint specimen is a direct shear failure at the key root. According to the test results, the formula of the shear bearing capacity V   of dry joint was proposed, namely, V is the sum of V f , and V c . Here, V f is the friction resistance of the keys, V c   is the shear resistance at the concrete key root. The formula was later adopted by AASHTO [15]. 1990, Buyukozturk [22] conducted direct shear tests on keyed joints, considering parameters, such as a number of keys, prestressing level, and the epoxy thickness. It was found that the shear capacity V of the joints increased with the increase of lateral pre-compression stress δ n . Consequently, the shear bearing capacity of the keyed joints is proposed as V is equal to the product of A k (area of the key root) and τ (average shear stress at the key root). In which, τ is linearly related to the lateral prestress δ n and the concrete tensile strength f t .
In 2002, after verifying finite element model through test results, Rombach [23,24] conducted numerical parametric study on the shear bearing capacity of dry joints with various number and shapes of shear keys, concrete qualities etc. On this basis, the shear capacity V of the keyed dry joint was considered a combination of a frictional and a shear part [23]. However, different from the recommendation in AASHTO [15], the frictional part included the total area of the joint and not only the smooth parts. The load-bearing capacity of the keys depends on the concrete compressive strength and the area of the failure plane of the keys. Meanwhile, a safety coefficient was considered. Based on the direct shear test results of the keyed dry joints, Turmo [17,18] compared the predictions of ultimate joint strength in terms of the provisions in ATEP [2,25] and AASHTO [15]. It was shown that results obtained by the provisions in AASHTO were more consistent with test results. Taking concrete compressive strength higher than 50 MPa with comparatively lower tensile strengths into consideration, Turmo [17] proposed a new formula be included in the Euro-code. Liu [26] proposed a formula for evaluating the shear bearing capacity of UHPC joints. It was found to have better agreement with the shear test results than that in the AASHTO provisions.
Aiming to the existing formulas, further investigations were carried out by researchers. Comparing experimental results with the AASHTO [15] and another design criterion, Zhou [27] found that the provisions in AASHTO [15] and Rombach formula [23] underestimated the shear bearing capacity of the single-keyed joint by a value up to 40%, but greatly overestimated the shear capacity of dry multiple-keyed dry joints. Hence, it was suggested to introduce strength reduction factors for multiple-keyed dry joints. Subsequently, to investigate the structural behavior of the keyed dry joints under the direct shear, a numerical analysis model was established by Shamass [28], and a parametric study was carried out on predicting the shear capacity of multiple-keyed dry joints. Results showed that the shear capacity predicted by the AASHTO code equation diverges from that predicted by numerical analysis at high confining pressure. This is because the contribution of friction in the total shear capacity decreased with an increase in confining pressure. The same conclusions were demonstrated by Jiang [29,30,31]. Meanwhile, Jiang [32] also investigated the influence of key depth on the shear resistance of the dry joint. Results showed that the predicted results, according to the provisions in AASHTO [15], are more applicable for dry joints with key depth in 35 mm and 40 mm. Ahmed [2] demonstrated through experiments that the average shear transfer of a single key is higher for specimens with a smaller number of keys. Four flange shear keys are capable of increasing the shear capacity by 14% and the elastic stiffness of the joints by 73%. Compared with simulating results, Jiang [33] demonstrated AASHTO standard overestimated the shear capacity of single-keyed dry joints with fixing imperfections at the lower surface of the key by up to 0.602–22.0%, but greatly underestimated that of the rest, and proposed a modified formula with a strength reduction factor.
Regarding the shear capacity of the keyed joints in segmental precast bridges, the following points could be summarized according to the above researches. Firstly, concrete compressive strength, friction resistance of keys are the critical influence factors of the shear capacity of the keyed joints. But as the contribution and influence coefficient of each part to be concerned, especially due to the lack of detailed explanation from the failure mechanism of the keyed dry joint, the conclusions of different studies are quite different. Secondly, lateral prestress, number, and structural geometry of the keys affect the shear capacity of the keyed dry joint to some extent. Still, no clear influence regularity about these factors is presented yet. Thirdly, though the provisions in AASHTO are not well applicable to all kinds of joints in segmental precast bridges, the applicability of other existing formulas is also limited to some extent. Therefore, it is necessary to investigate further about the influence law of different influencing factors, and accordingly to obtain a universal calculation formula for the shear capacity of joints in segmental precast bridges.
For the above research purposes, with the finite element simulation analysis method considering the plastic damage of concrete, the influence laws of different factors on the ultimate shear capacity of the single-key dry joints are studied in this paper. The factors include lateral prestress, concrete strength, structural geometry of the keys (depth, inclination angle, aspect ratio), etc. Based on the numerical results and comprehensive evaluation of the existing formula, the shear capacity calculation formula of the single-key dry joint was proposed in terms of the maximum principal stress failure criterion. And the applicability of the proposed formula was verified by comparing it with the existing experimental results and numerical results.

2. Nonlinear Simulation Analysis of a Single-Keyed Dry Joint

2.1. Overview of the Simulation Example

The test specimen of the single-keyed joint in Reference [31] is chosen to be the simulation example, which was made of C40 concrete and HRB 400 rebar with a diameter of 16 mm. The total dimensions of the specimen are 370 mm in height, 340 mm in length, and 100 mm in width. Dimensions of the single key are 100 mm in height (H), 35 mm in depth (d), and with an inclined angle θ , tan θ = 0.714. The dimensions and configurations of the specimen are shown in Figure 1. To simulate the effect of prestressing in segmental precast bridges, confining pressure was applied by a hydraulic jack before applying vertical load. Displacement-control loading method was adopted, vertical load was applied on the specimen at a constant rate of 0.005 mm/s, and the maximum loading displacement was 4 mm.

2.2. Constitutive Relationship of Materials

2.2.1. Concrete Uniaxial Stress-Strain Relationship

According to Reference [34], the uniaxial tensile and compressive stress-strain expression, are seen in Equations (1) and (2), respectively. For C40 concrete of the test specimen in Reference [31], the Elastic modulus was 3.6 × 10⁴ MPa, the Poisson’s ratio was 0.2, the uniaxial compressive and tensile strength was 41.5 Mpa and 3.56 Mpa, respectively—corresponding uniaxial stress-strain curves are illustrated in Figure 2a,b.
y = { 1.2 x 0.6 x 3 , x 1 x α t ( x 1 ) 1.7 + x ,   x > 1 ,   x = ε ε t ,   y = σ f t *
y = { α a x + ( 3 2 α a ) x 2 + ( α a 2 ) x 3 , x 1 x α d ( x 1 ) 2 + x ,   x > 1 ,   x = ε ε c ,   y = σ f c *
Here, α t is the parameter value of the falling section of the uniaxial tensile stress-strain curve of concrete, f t * is the uniaxial tensile strength of concrete, and ε t is the peak tensile strain of concrete corresponding to f t * , α a and α d are the parameter values of the rising and falling sections of the concrete uniaxial compressive stress-strain curve; f c * is the uniaxial compressive strength of the concrete, and ε c is the peak concrete compressive strain corresponding to f c * .

2.2.2. Plastic Damage Model of Concrete

For nonlinear finite element (FE) analysis of concrete structure, plastic damage of the concrete should be considered. In ABAQUS, a concrete plastic damage model is provided. In this model, damage factor D is introduced to reduce the stiffness matrix so that the plastic damage of concrete could be reflected, shown as Equation (3a). The unloading stiffness would decrease as the damage in concrete increases. Thus, the one-dimensional constitutive relation of concrete considering plastic damage [35] could be expressed as Equation (3b).
E D = ( 1 D ) E , 0 D 1
σ = ( 1 D ) E ( ε ε ˜ p l ) , 0 D 1
where, D is the damage factor, E is the elastic modulus with no damage, σ is the stress, ε is the total strain, and ε ˜ p l is the inelastic strain. When D equals to zero, it indicates that the material is not damaged; when D equals to 1.0, it indicates that the material has no bearing capacity.
According to the stress-strain curves in Figure 2, damage factor D could be obtained by Najar energy method [36,37], shown as in Equation (4). Where, W 0 = E 0 ε 2 / 2 and W e = f ( ε ) d ε represent the strain energy of the material in the non-damaged and damaged state, respectively, f ( ε ) represents the uniaxial tensile and compressive stress-strain function of the concrete. The corresponding relationship between D and ε ˜ p l is illustrated in Figure 3a,b.
D = W 0 W e W 0

2.2.3. Stress-Strain Relationship of Rebar

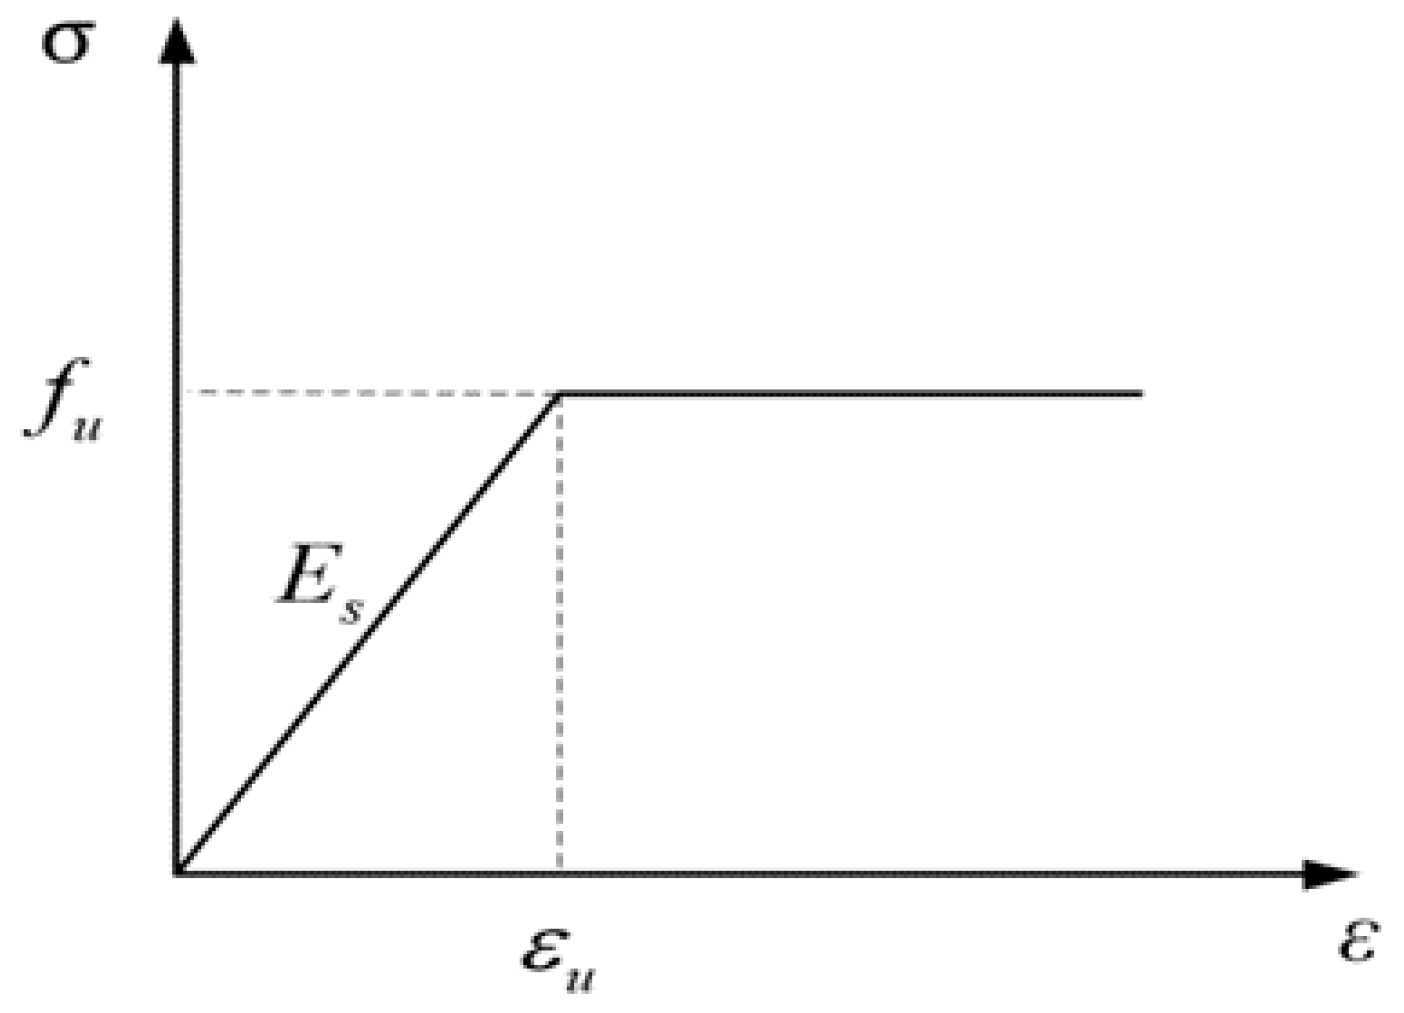
The elastic modulus of the HRB400 steel bar with a diameter of 16 mm is 2.1 × 10⁵ MPa, and the ultimate strength fu is 600 MPa. The ideal elastoplastic constitutive relationship is adopted for the rebar, shown as in Figure 4.

2.3. Finite Element Model

Based on the above constitutive relationship of materials, the FE model of the simulation example was established with ABAQUS, and through nonlinear elastoplastic analysis was conducted to obtain the ultimate shear capacity of the simulation example.
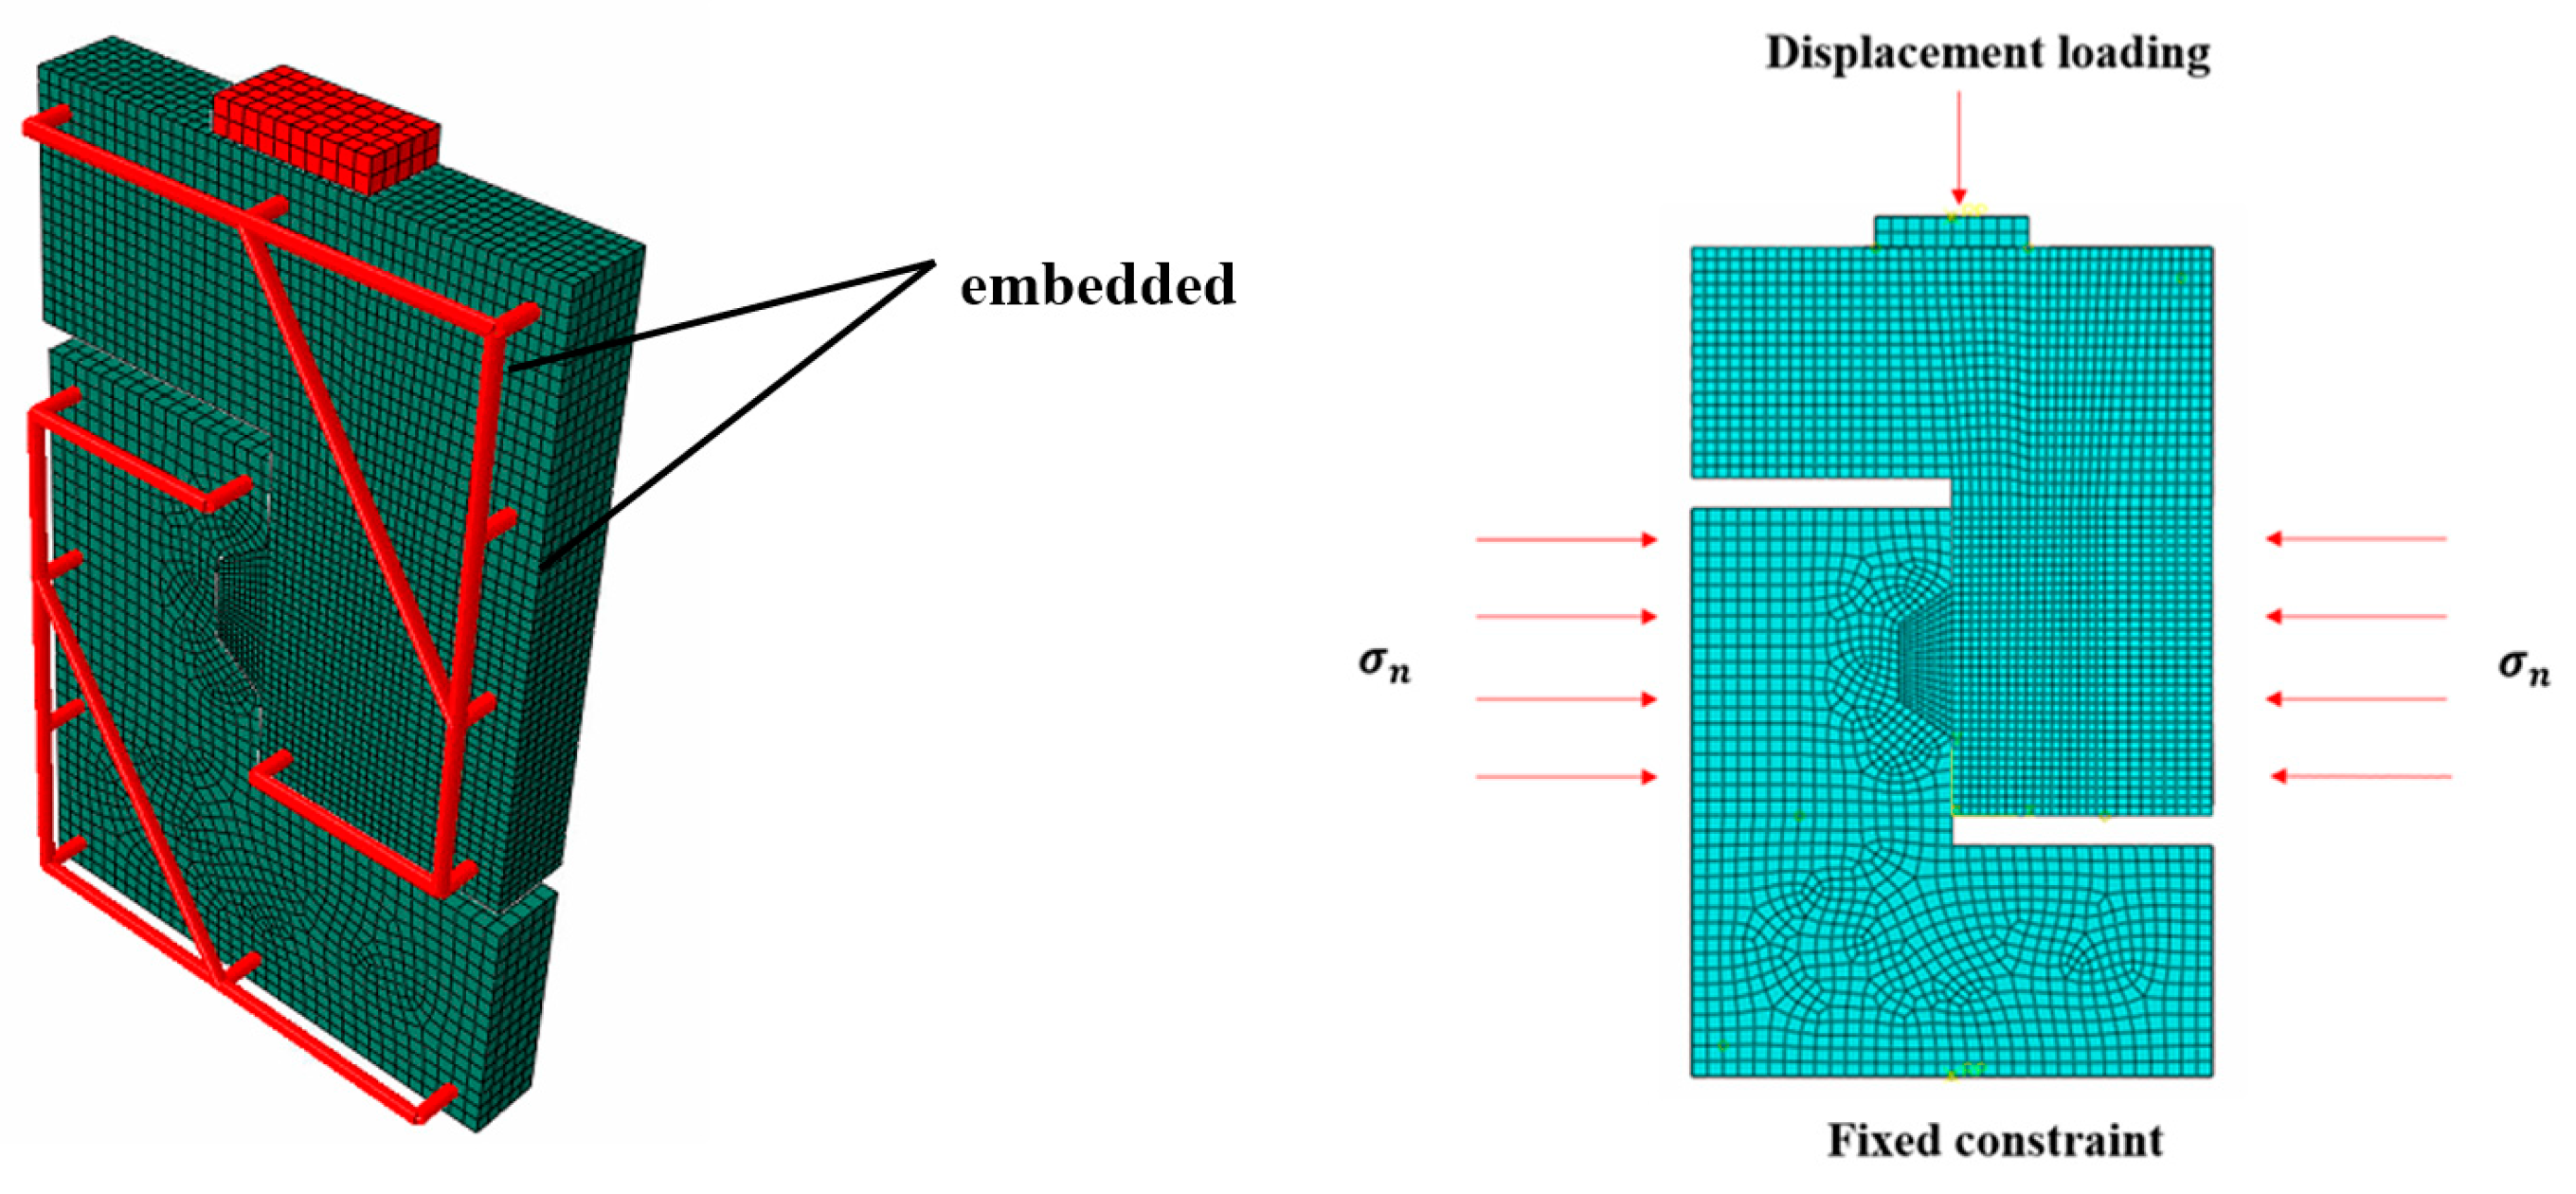
The concrete part was dispersed with 8-node solid element C3D8, the rebars were dispersed with truss element T3D2 [38]. To meet the calculation accuracy and efficiency at the same time, after comparing the calculation results of FE models with different mesh sizes, the elements in the single key area were especially refined so that the minimum element dimension was 5 mm. There were 45,000 elements and 105,600 nodes for the simulation example.
The prestressed tendons were not considered in the FE model, and the prestress was simulated by applying lateral surface loads on both sides of the simulation example.
The freedoms of rebar elements are coupled with those of the concrete elements through embedded constraints in ABAQUS. The friction interaction between two concave-convex keys are simulated by defining contact elements, the attribute of which is a kind of friction hard contact expressed with a penalty function. The friction coefficient for a smooth concrete surface is taken as 0.6 [31], and limited-slip mode is adopted. The simulation example is fixed at the bottom. The FE model of the simulation example is illustrated in Figure 5.
Same as that in Reference [31], displacement loading control method is also adopted for the simulation. There are two load steps, the first load step is to apply constraints, and lateral prestress on the simulation example; the second step is to apply displacement load.

2.4. Verification of the Simulation Method

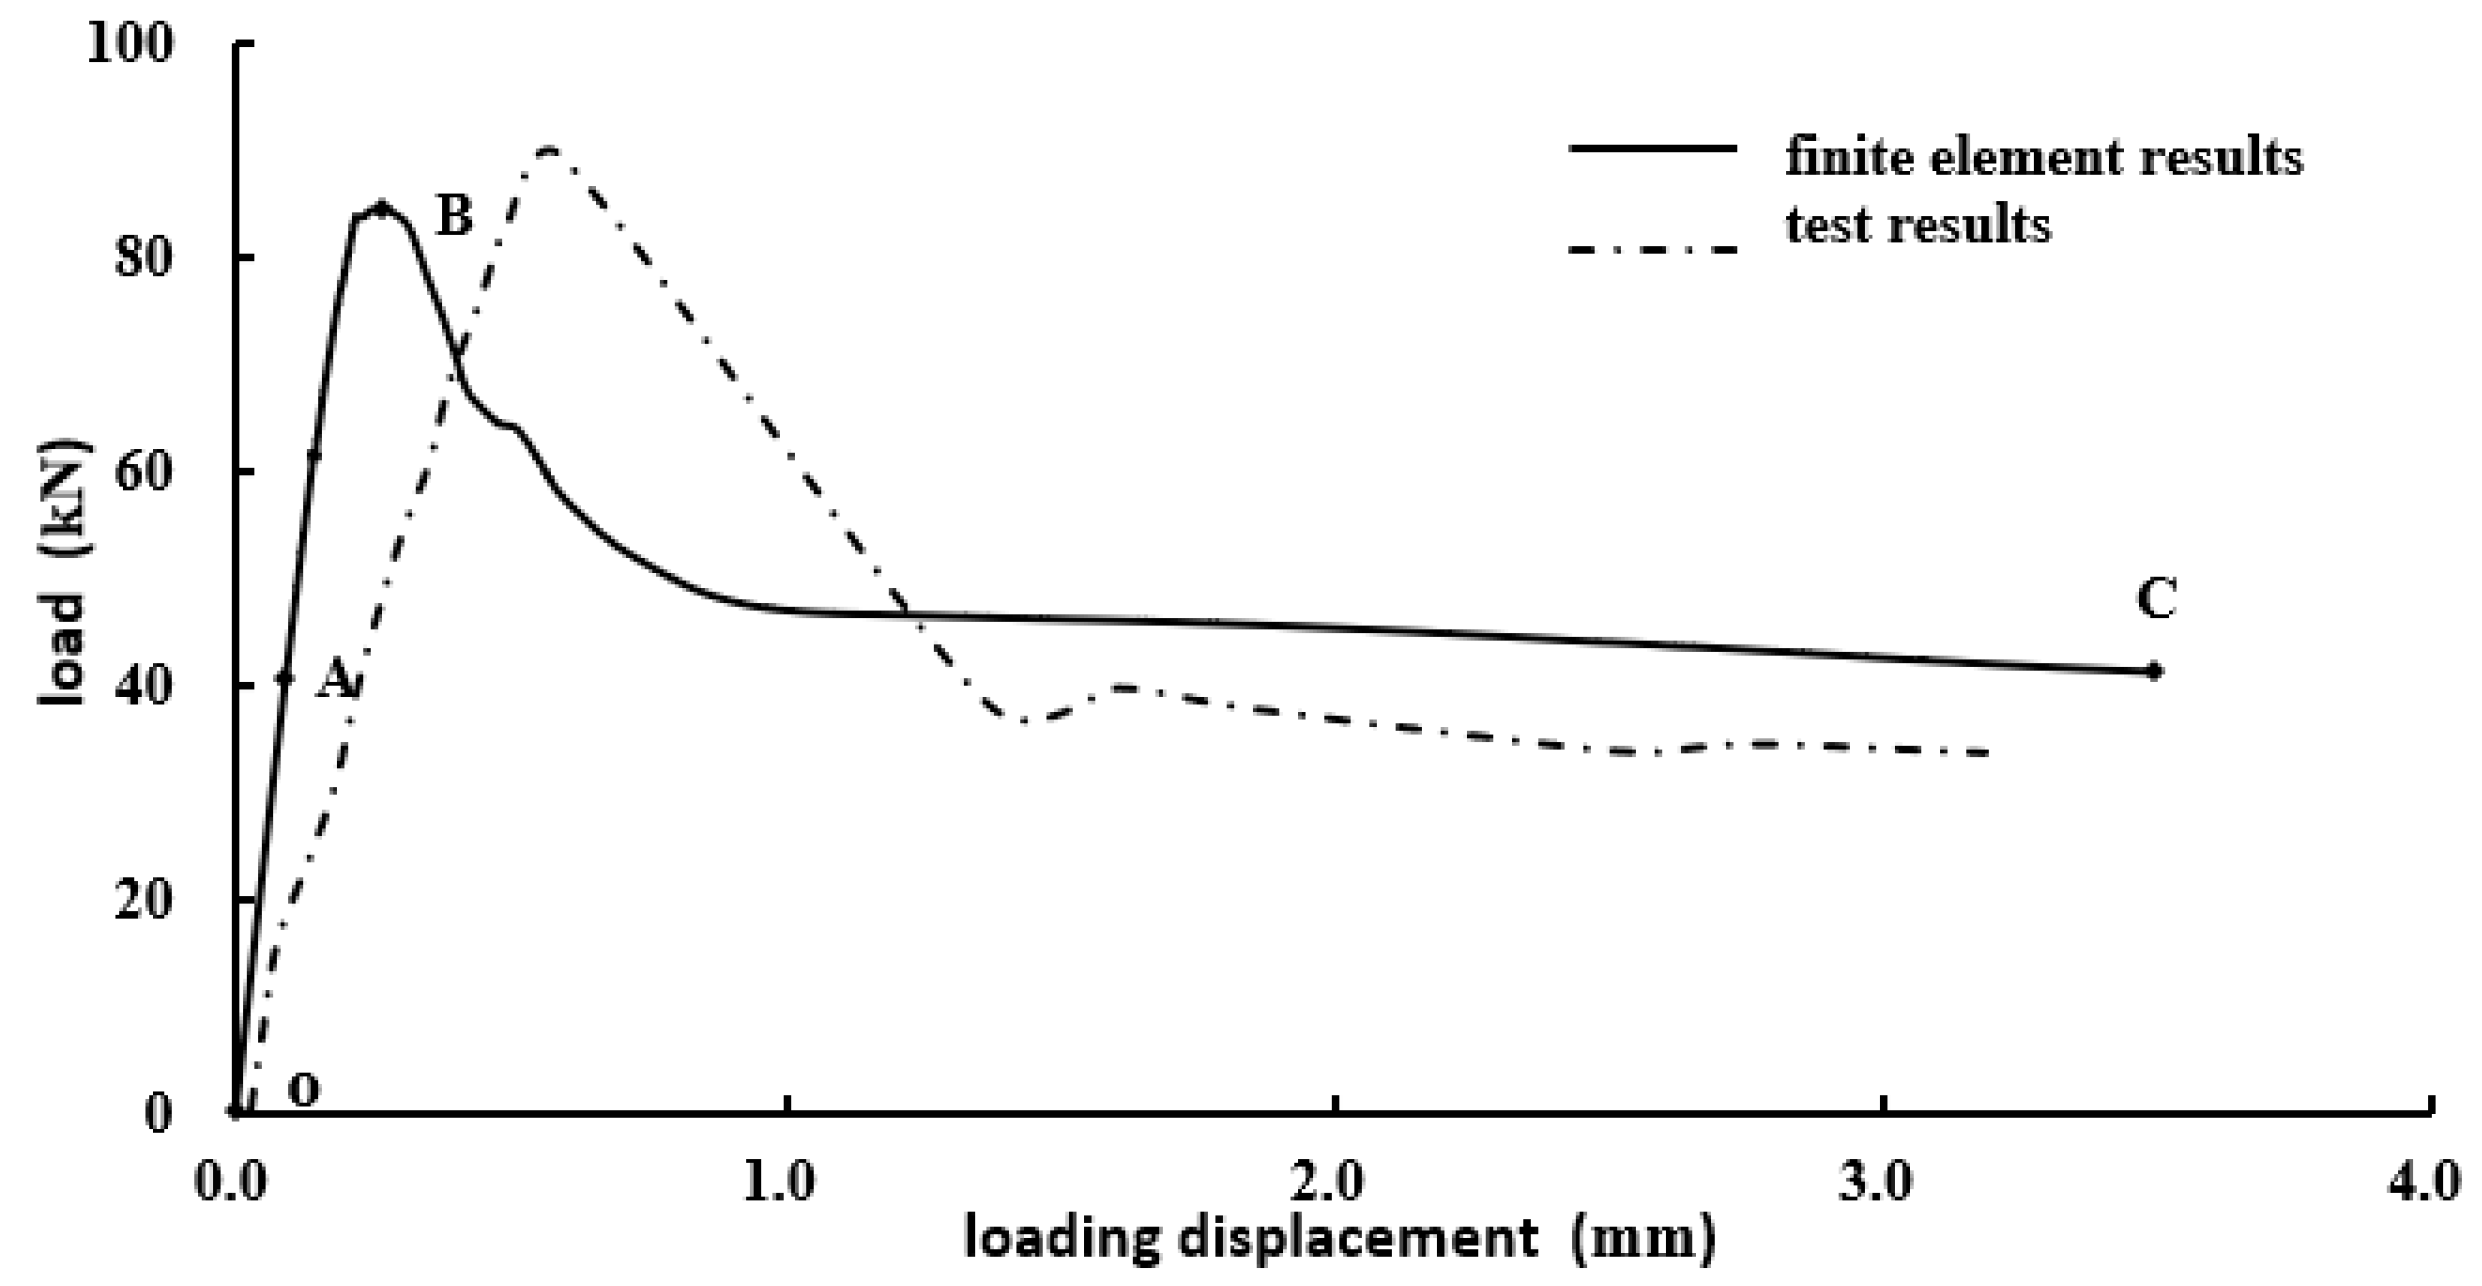
For the four kinds of the test specimen in Reference [31], the calculated ultimate shear capacity is obtained on basis of the above FE model. It could be seen that the calculated ultimate shear bearing capacity is close to the tested results, and the difference between them is less than 8%. The details are listed in Table 1. For the simulation example, the calculated change trend between load and displacement is also like that of the test results. Shown as in Figure 6. In other words, the simulation method above has been verified to be correct and effective to simulate the behavior of the single-keyed dry joint.

2.5. Nonlinear Behavior under Direct Shear

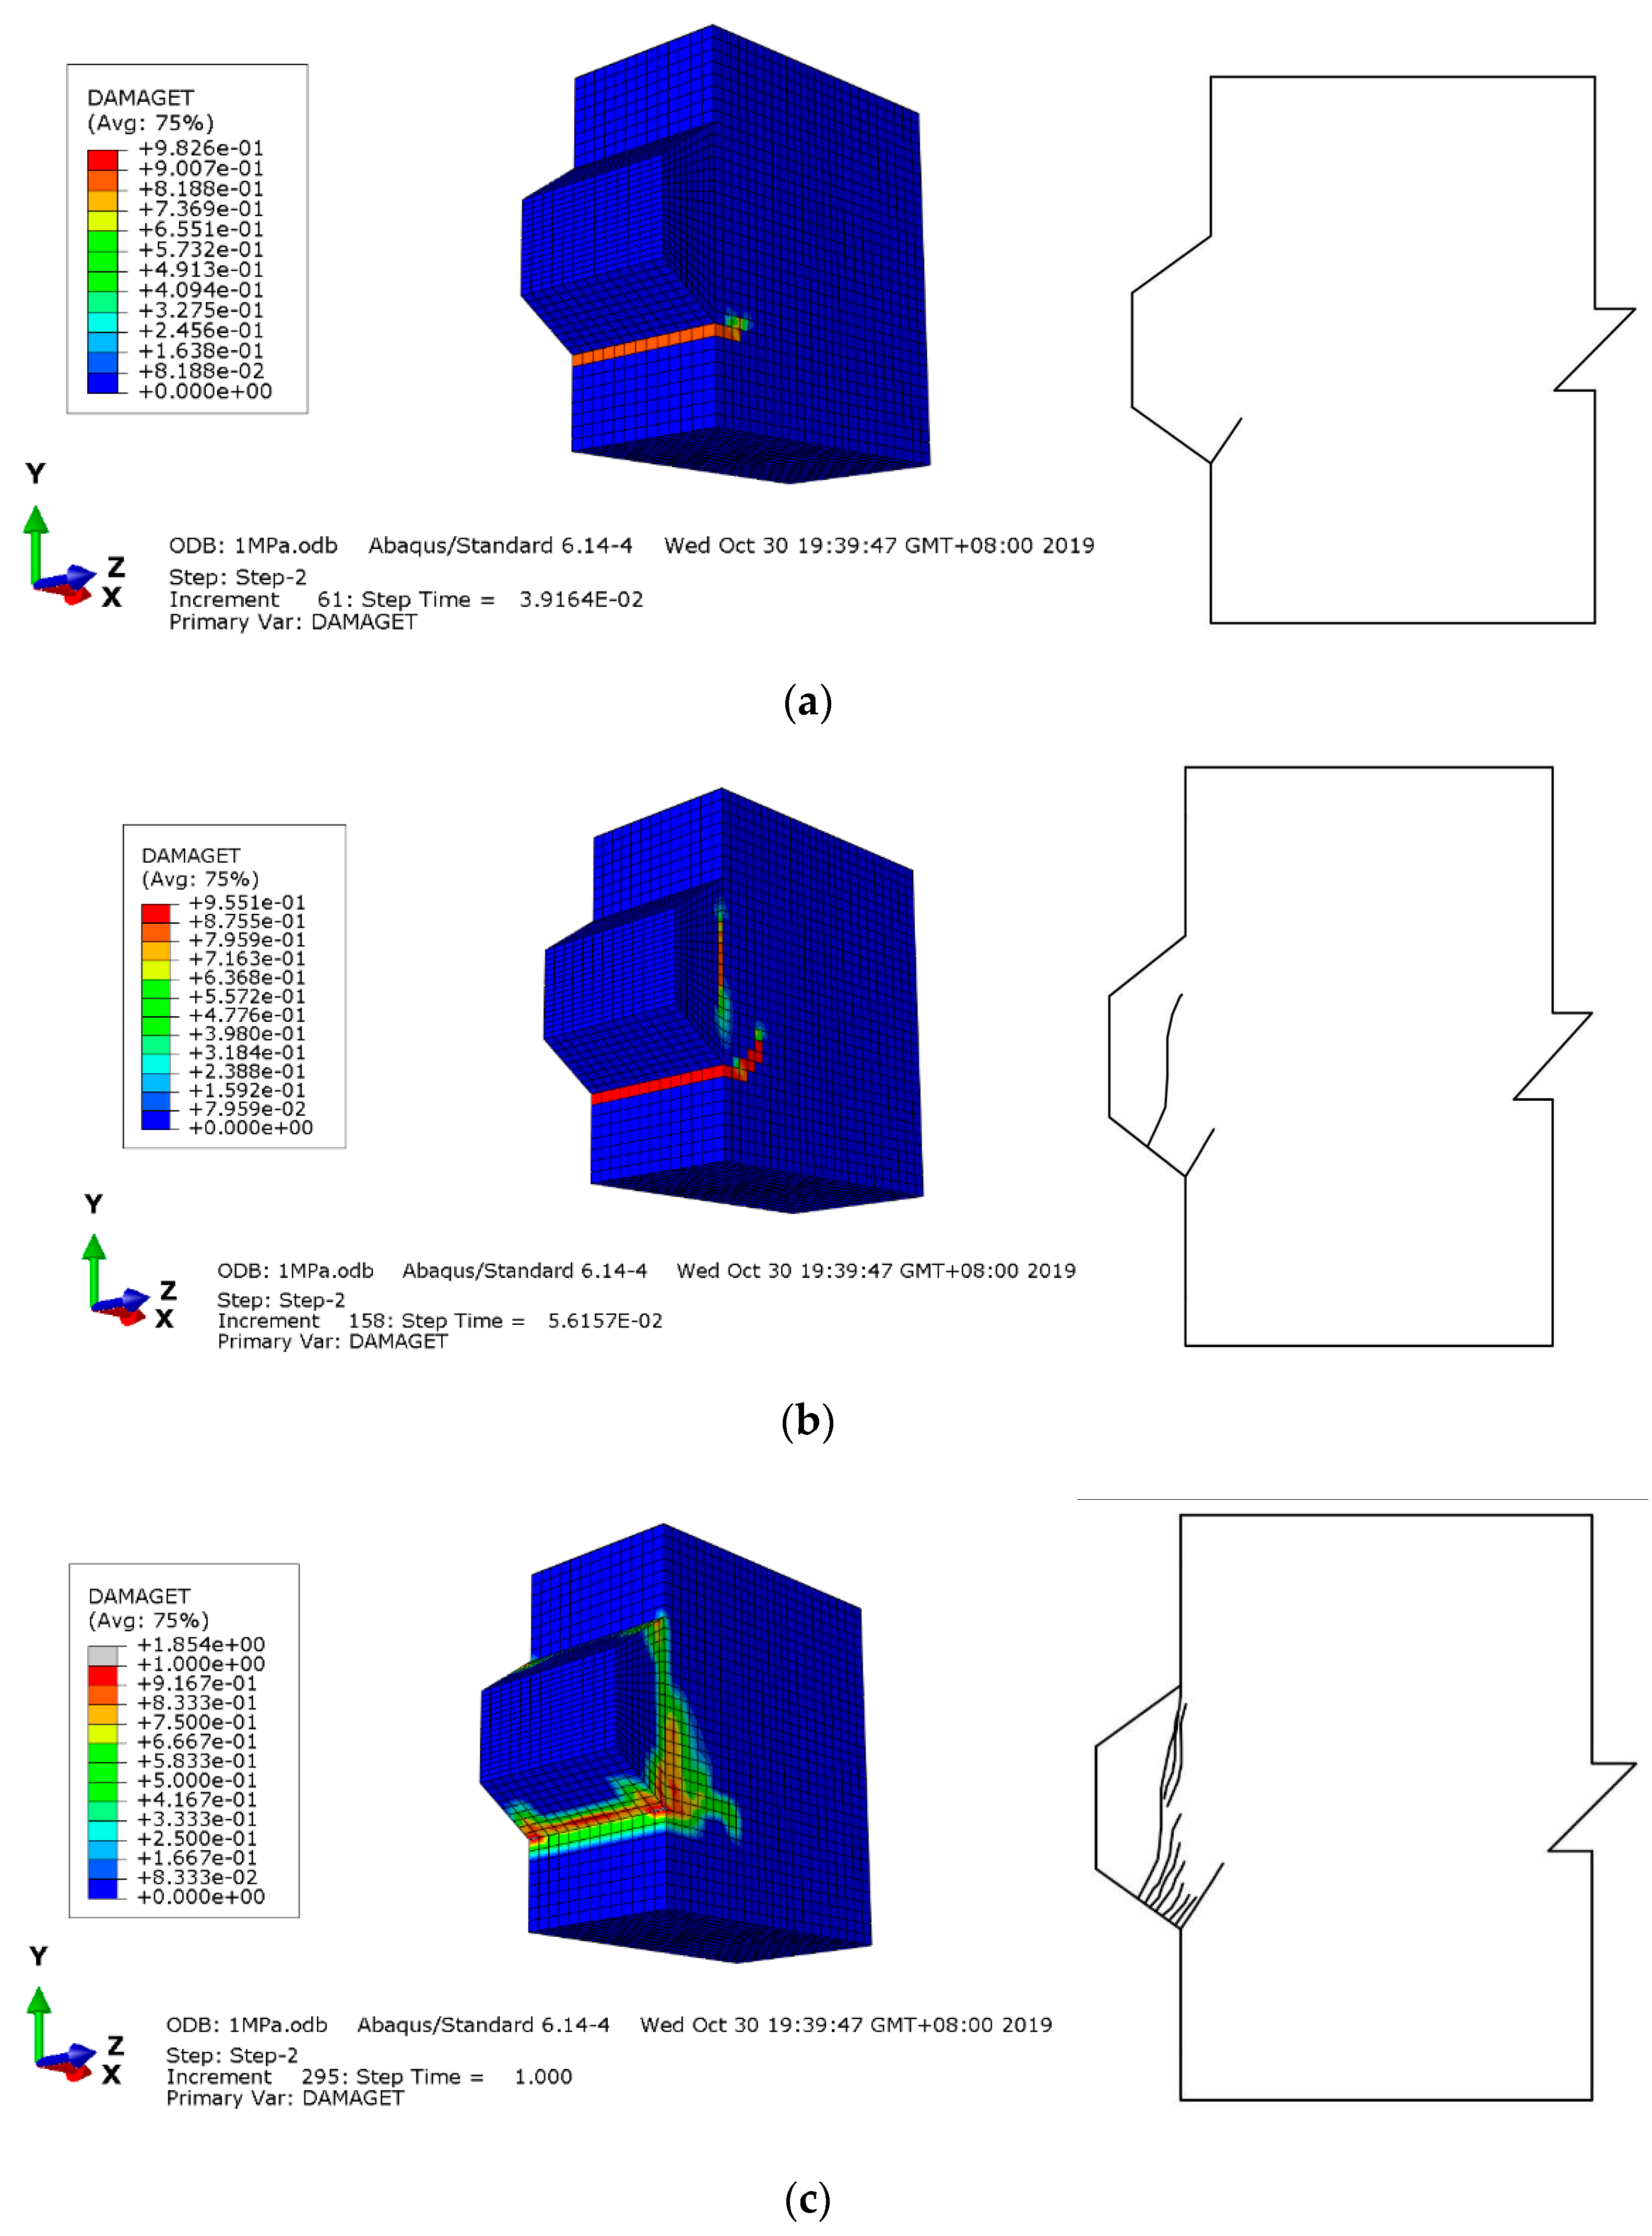
Apparently, the nonlinear behavior development of the single-keyed dry joint showed in Figure 6 could be divided into three stages. The first stage is indicated as OA. At this stage, the load is linear to the displacement, but small local stress concentration appeared on the underside of the key root. In this small area, the concrete has shown tensile damage, which corresponded to the initial cracks occurred in the tests. See Figure 7a.
With the increase of displacement, the load-displacement curve showed a bit nonlinear at the second stage, AB. The ultimate shear bearing capacity of the single-keyed dry joint was reached at B point. Meanwhile, the concrete tensile damage area on the underside of the key continues to expand upward until it penetrated the entire key root. The same is true for the development of concrete cracks in the test specimens. See Figure 7b.
At the stage BC, the bearing capacity of the single-keyed dry joint decreased quickly with the increase of displacement, while the concrete tensile damaged area expanded more seriously. Finally, there were two strips of concrete tensile damage area that started from the key root. One is developed diagonally upwards 45°, and the other is developed upward vertically along the key root section. Experimental results [31] showed that the cracks in the concrete of test specimens also increased and developed in this way. See Figure 7c.
Both FE simulation results and experimental results demonstrated concrete tensile strength at the key root is critical to the ultimate bearing capacity of the single-keyed dry joint under the direct shear loading.

3. Discussion on the Existing Shear Capacity Formula

In the literature, several experimental studies and various FE models are available; the most significant parameters affecting the shear behavior of joints are the prestressing stress, epoxy thickness, shape of keys, concrete strength, contact area, and friction coefficient.

3.1. Existing Shear Capacity Formula

(1)
Buyukozturk’s formula [22]
Based on experimental and theoretical research, Buyukozturk from the Massachusetts Institute of Technology proposed a shear resistance formula of the keyed dry joints, which is as follows:
V u = A j ( 0.647 f c + 1.36 σ n )
where, f c is the compressive strength of the concrete cylinder, σ n is the lateral prestress on the joint, and A j is the total area of the joint interface.
(2)
AASHTO (2003) provisions [15]
The formula adopted by AASHTO [15] divides the shear capacity into two parts, one is the resistance provided by the friction force on the smooth surfaces of the key, the other is the resistance provided by the concrete key roots. The expression is as follows:
V u = A k f c ( 0.205 σ n + 0.996 ) + 0.6 A s m σ n
where, A k is the area of the key root, A s m is the smooth area of the key interface.
(3)
ATEP provisions [25]
In ATEP provisions, the shear capacity of the keyed joint is proportional to the area of the entire joint interface, which is expressed as follows:
V u = A j ( 1.14 σ n + 0.0564 f c d )
where, f c d is the design value of concrete compressive strength.
(4)
Rombach’s formula [23]
With a safety factor introduced, the shear capacity formula of the keyed dry joint proposed by Rombach is expressed as:
V u = ( μ σ n A j + 0.14 f c k A k ) / γ F
where, μ is the friction coefficient, take as 0.65; γ F is the safety factor, take as 2.0; f c k is the standard value of concrete compressive strength.
(5)
Turmo’s formula [17]
Based on the experimental results of lots of groups of the test specimen, Turmo did some revision on the empirical formula of concrete tensile strength in AASHTO. Consequently, a new formula about the shear capacity of the keyed dry joints was proposed as follows:
V u = A k f c k 2 / 3 ( 0.07 σ n + 0.33 ) + 0.6 σ n A s m , f c k 50
V u = A k l n ( 1 + 0.1 f c m ) ( 0.49 σ n + 0.233 ) + 0.6 σ n A s m , f c k > 50
where, f c m is the average value of concrete compressive strength.

3.2. Comparison of the Existing Formulas

Obviously, in the above formulas, lateral prestress and concrete strength are regarded as the main influential factors of the shear capacity of the keyed dry joints. As friction on the joint interface to be concerned, except for Buyukozturk’s formula and ATEP provisions, the other three formulas have taken the influence of friction into account. However, when calculating the friction contribution, the considerations of these formulas regarding the friction contact surface area are also different.
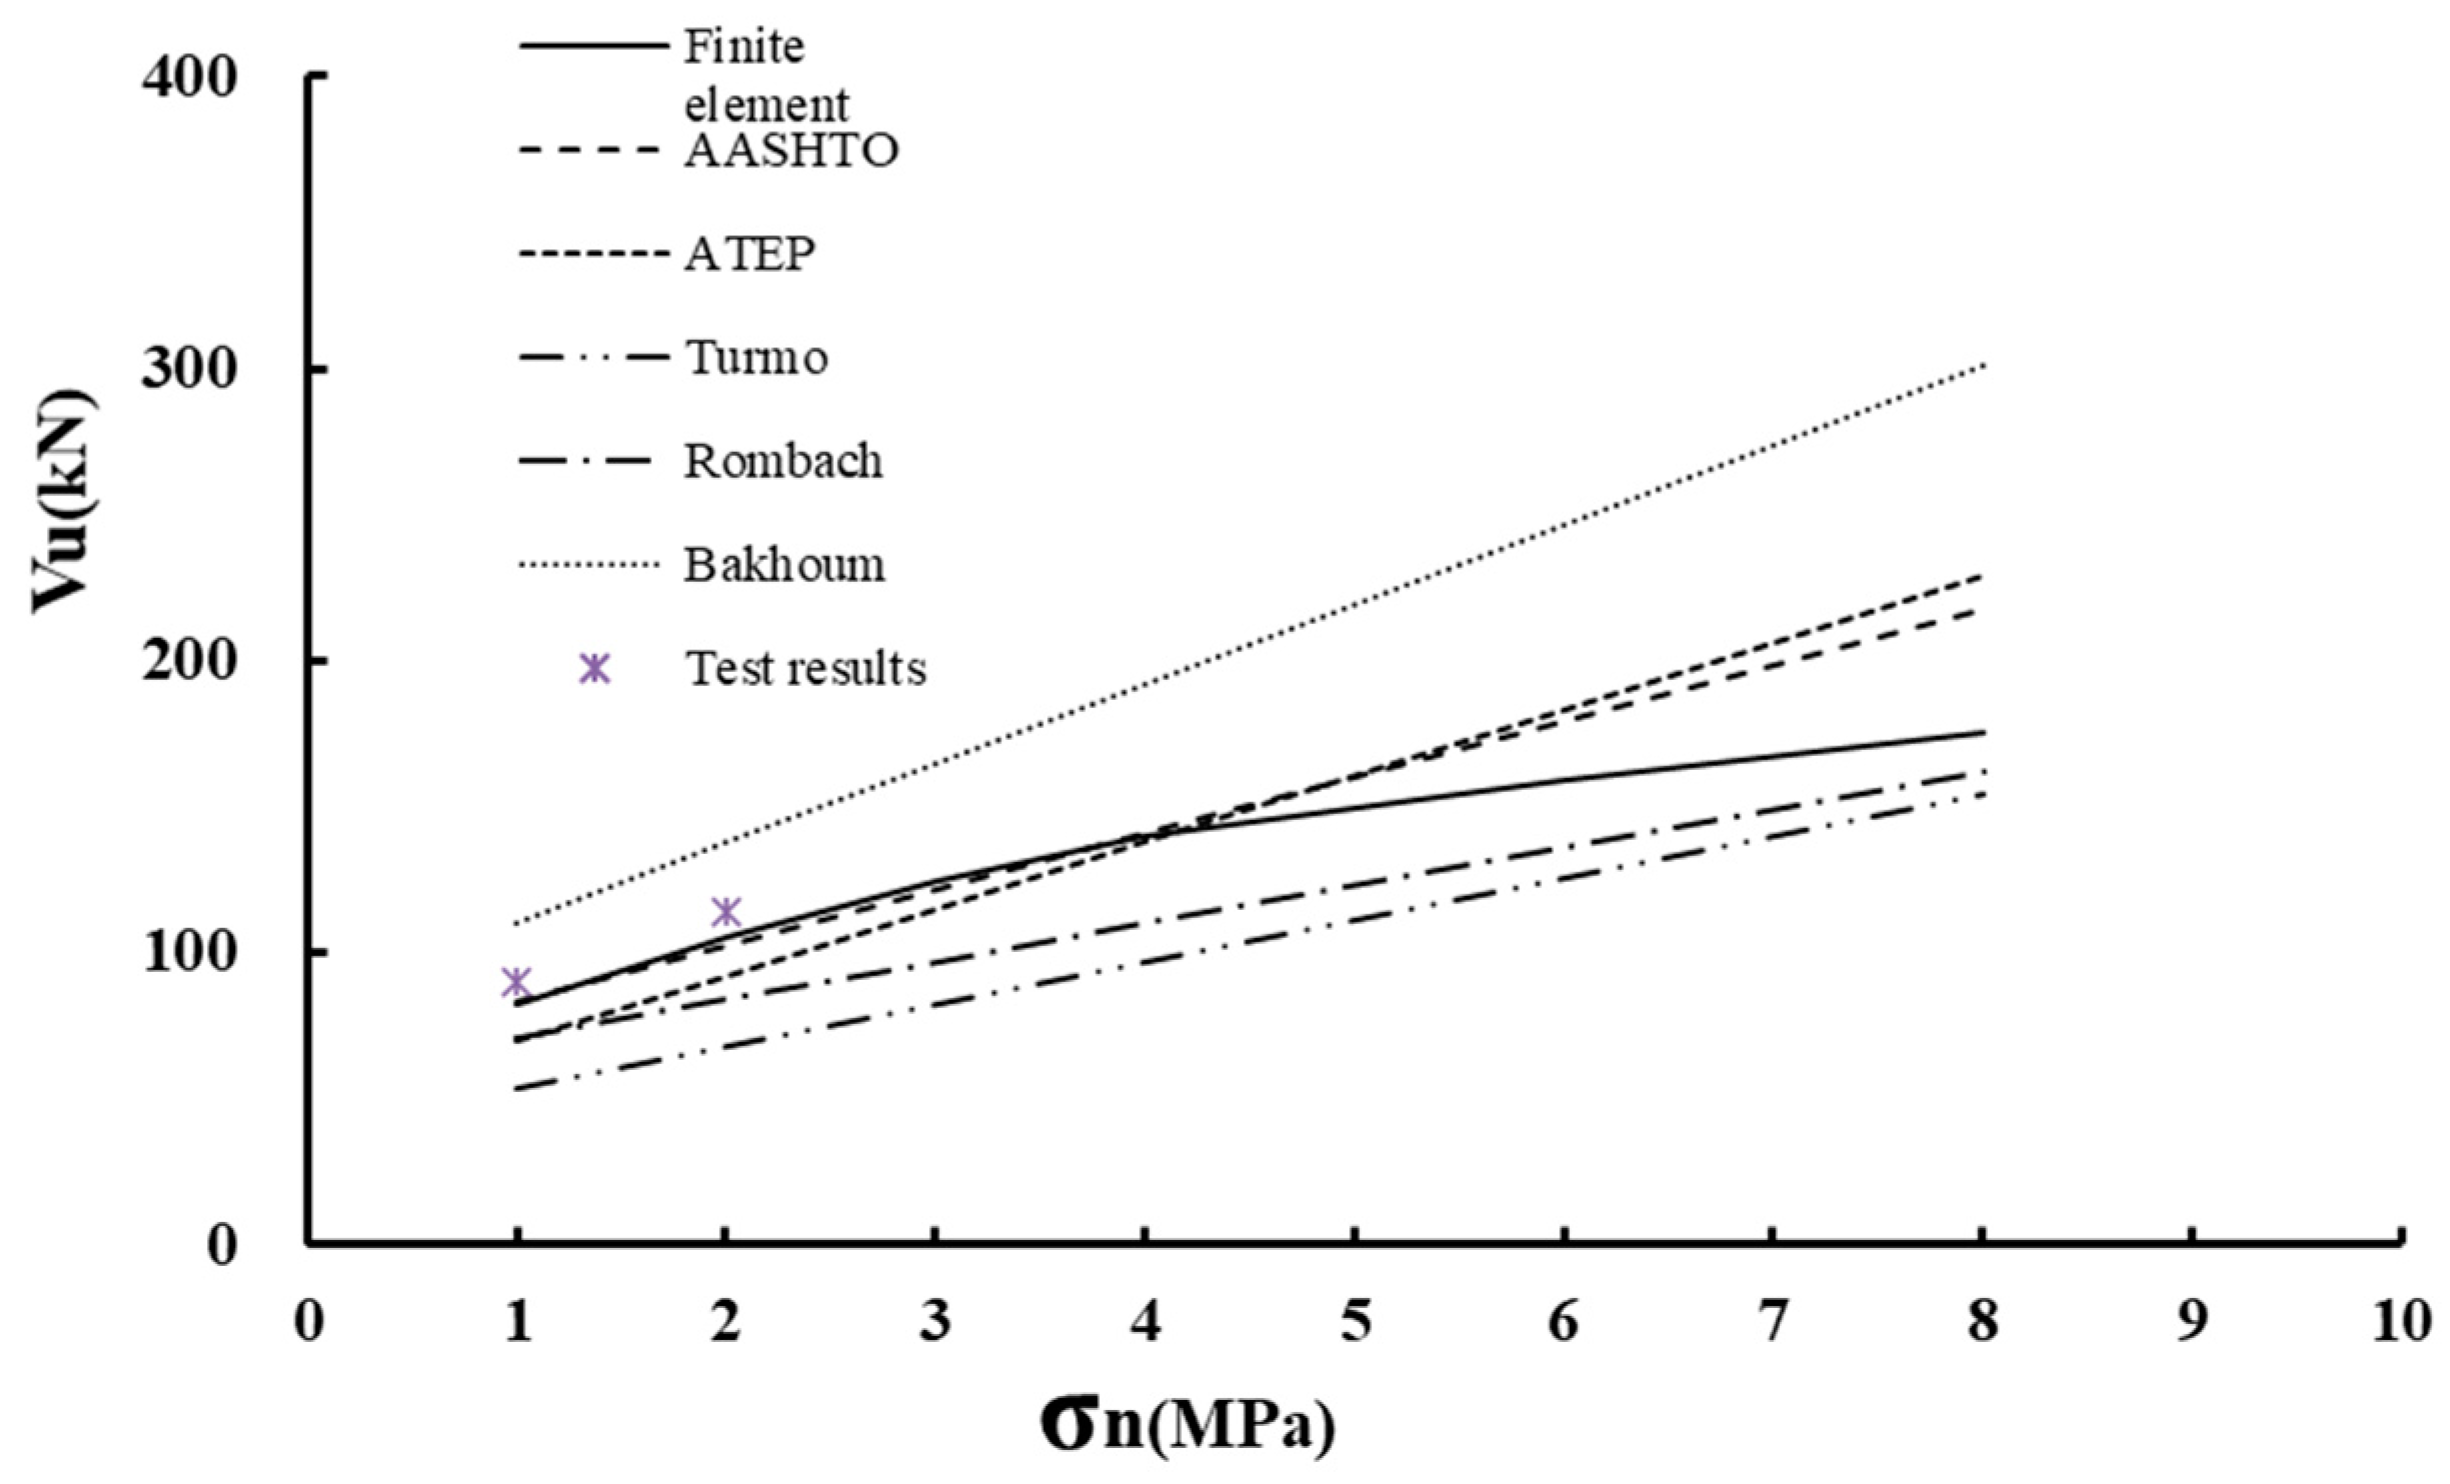
For the same simulation example [31], with different lateral prestress applied, the shear capacity calculated by the formulas listed in Section 3.1 are showed in Table 2 and Figure 8. It could be seen that the shear capacity calculated by the formulas showed a linear relationship with lateral prestress. Among them, the results obtained by AASHTO and ATEP are much closer to the FE results and test results than those of the other formulas. Though being lack of test results under high prestress level, the shear capacity obtained by the formulas and that by FE simulation showed larger and larger deviation when the prestress level is over 4 MPa.
Usually, friction on the joint interface would increase with the increase of lateral prestress. Though considering differently on friction, the shear capacity acquired according to the provisions in AASHTO and ATEP showed that same comparing results with those obtained by FE simulation. Therefore, it is necessary to analyze whether the contribution of friction should be considered in the shear capacity of the keyed dry joints on the aspect of the force transmission mechanism.

3.3. Force Transmission Mechanism

Shown as in Table 3, for the simulation example in this paper, no matter the lateral prestress level is 1.0 MPa or 8.0 MPa, the calculated shear capacity of the example specimens had no obvious change when the friction coefficient ranged from 0.4 to 1.0. This conclusion is inconsistent with AASHTO provisions.
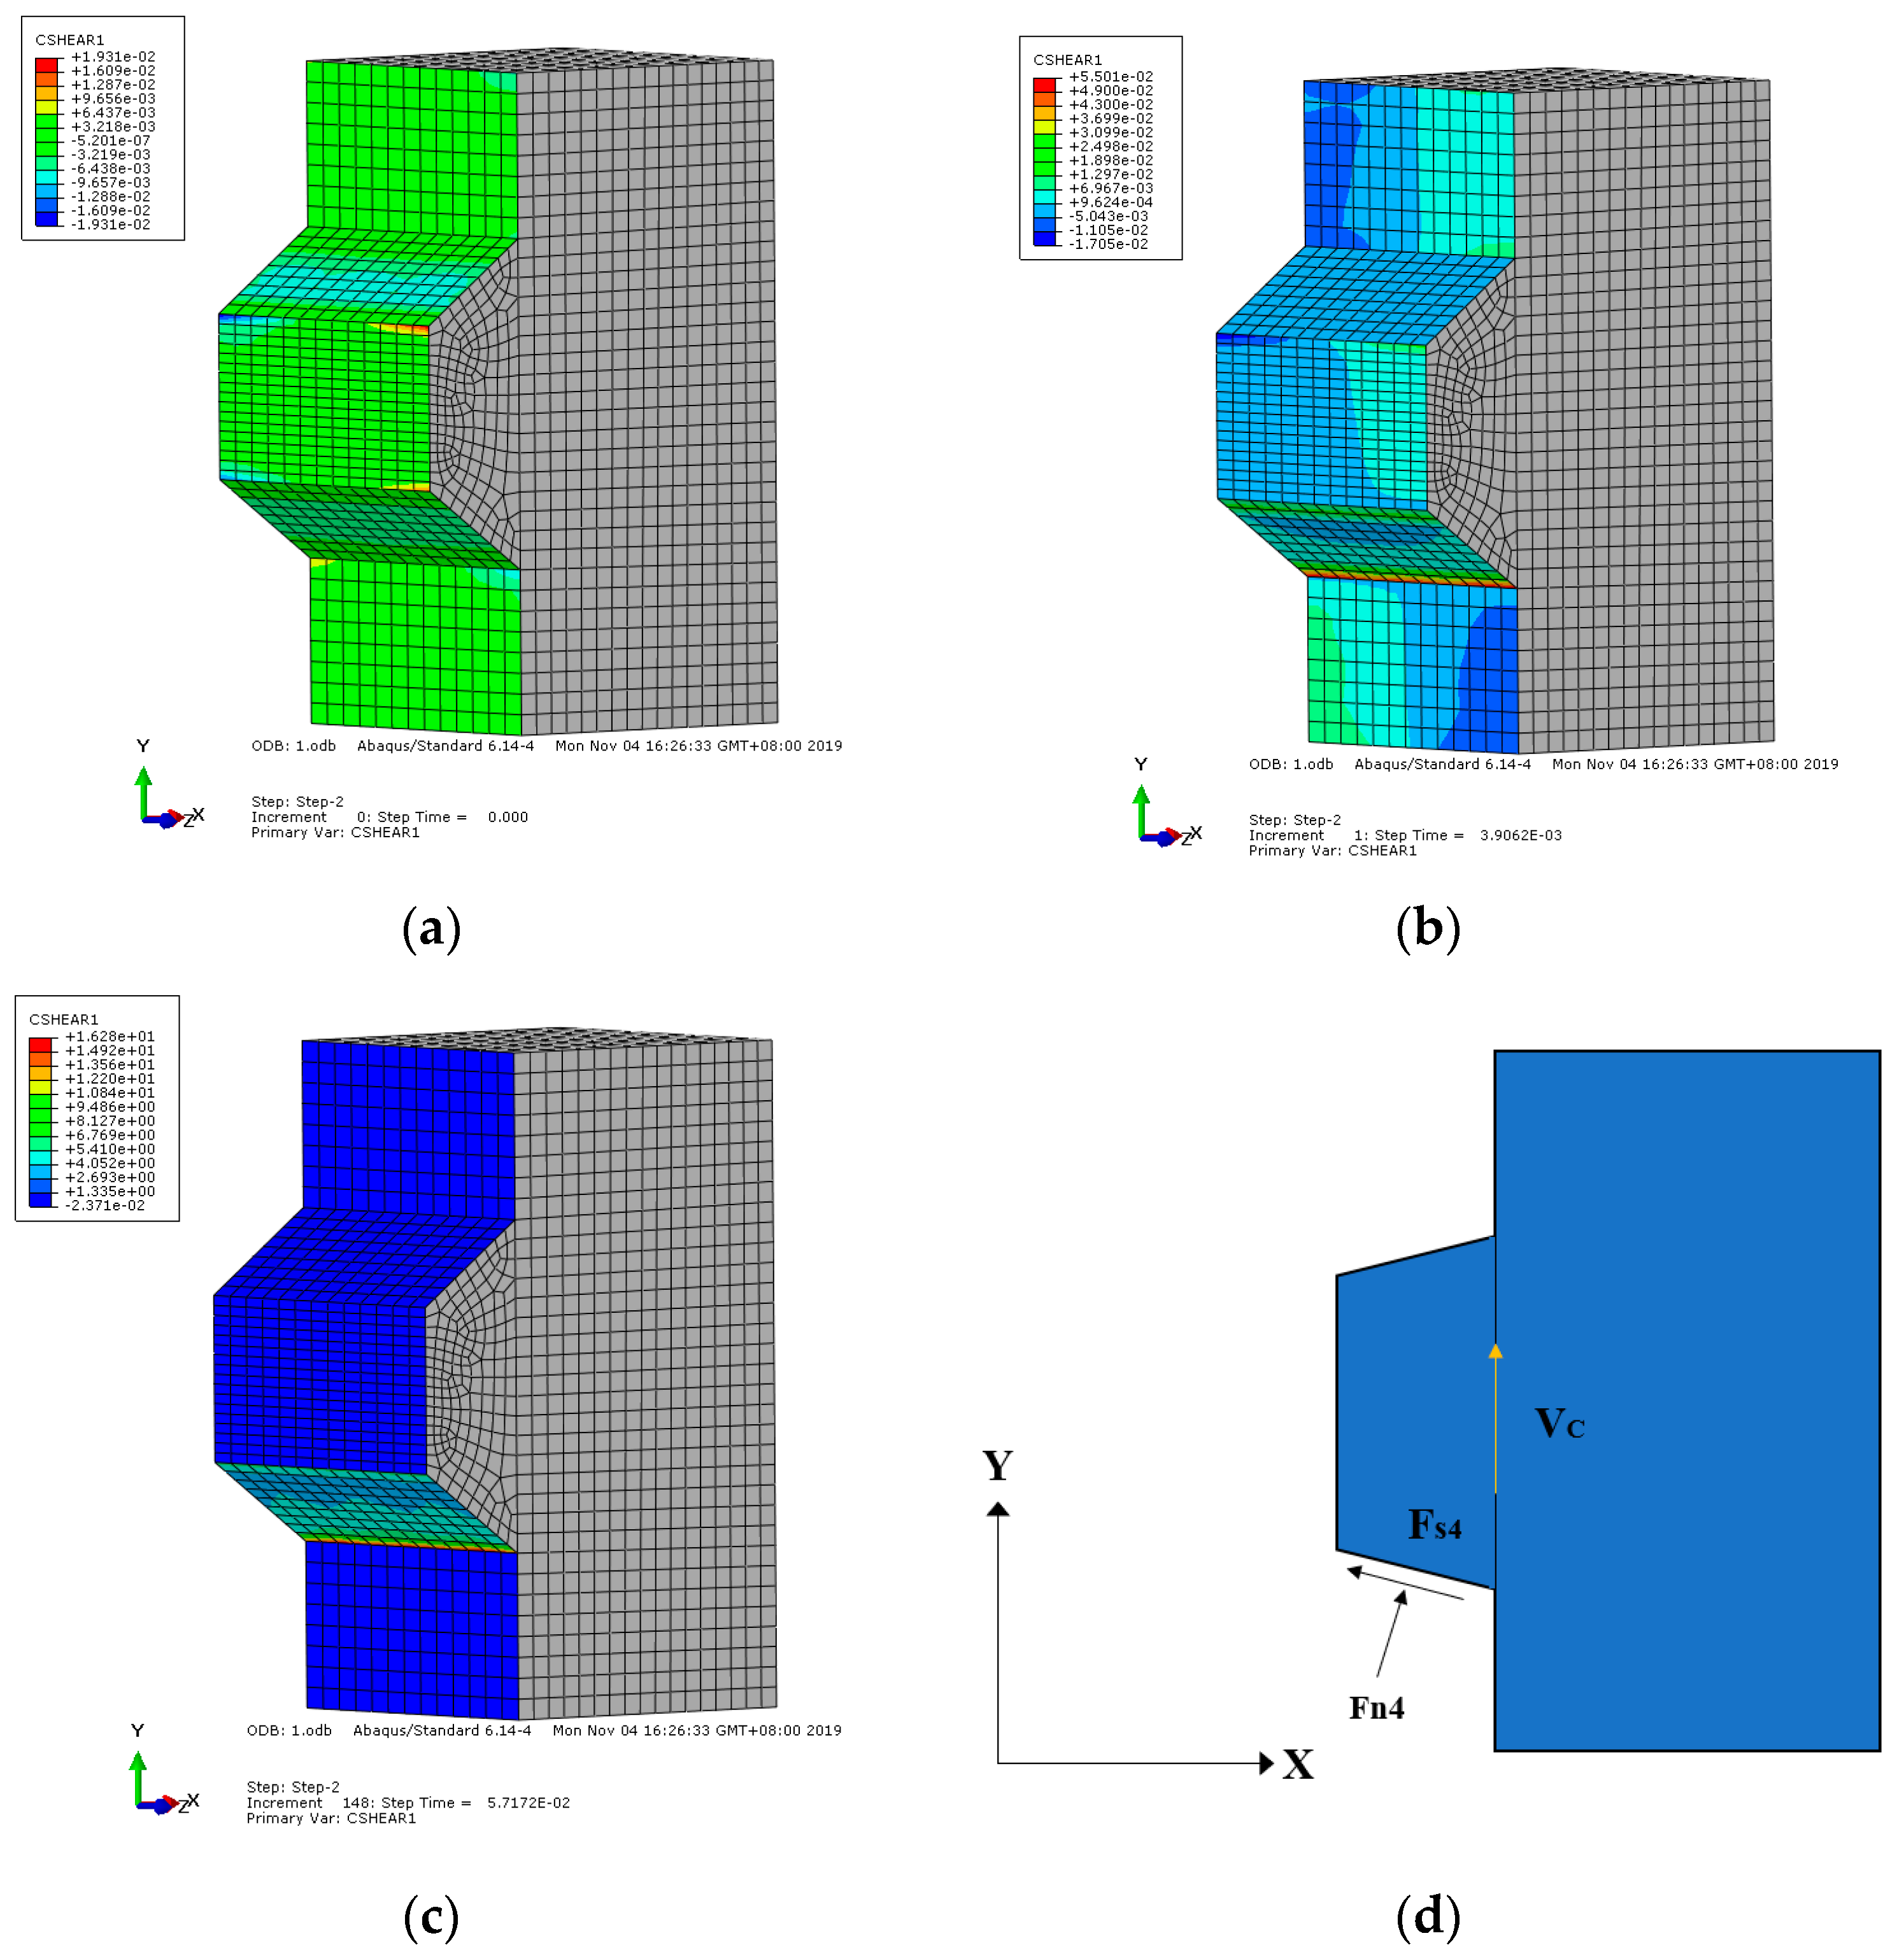
The friction force status of the joint interface at the different stage is shown in Figure 9, in which the friction coefficient is 0.6, and the lateral prestress is 0.2 MPa. Apparently, when there was only lateral prestress applied, the friction force on the joint interface is almost zero (Figure 9a). When the direct shear force applied by loading displacement, there was friction appeared on surface 4 (see Figure 1), but not much friction on the other surfaces of the joint interface (Figure 9b). When the joint was reaching its ultimate shear capacity, the maximum friction on surface 4 is up to 16.3 MPa, but zero on the other surfaces (Figure 9c). Accordingly, the force state on the joint interface could be simplified as Figure 9d.
In Figure 9d, F s 4 and F n 4 are the friction force and normal pressure on surface 4, respectively. V c is the vertical force on key root section. Take the key as isolated body, it is easy to know that the vertical resistance on the key root section is equal to the sum of vertical components of F s 4 and F n 4 .Integrate the results of finite element simulation analysis under ultimate conditions, there is F s 4 y = 17.1 k N , F n 4 y = 65.2 k N , V u = 82.3 k N . Compared with the data listed in Table 1, the ultimate shear capacity of the keyed dry joint V u = V c = F s 4 y + F n 4 y . Besides, according to the value of F s 4 y and F n 4 y , the corresponding friction coefficient μ on the interface is 0.35. It means that when friction coefficient is over 0.35, the joint interface is in the static friction equilibrium state. The function of the friction force is only to transfer force between adjacent joints; the ultimate shear capacity of the joint does not increase with the increase of friction coefficient. Namely, the shear capacity of the keyed dry joint is only provided by the concrete key, which is related to the average shear stress   τ and area of the key root section   A k .

4. Influencing Factors Analysis

According to the above research conclusion, besides lateral prestress and concrete tensile strength, the parameters related to the key root dimensions are considered in the following influencing factors analysis about the shear capacity of the keyed dry joint. Such as key depth, key inclination, and key aspect ratio (B/H). Here, taking the simulation example in Figure 1 as a basic specimen, different groups of specimens were designed by changing the above parameters individually. Details are listed in Table 4.

4.1. Lateral Prestress

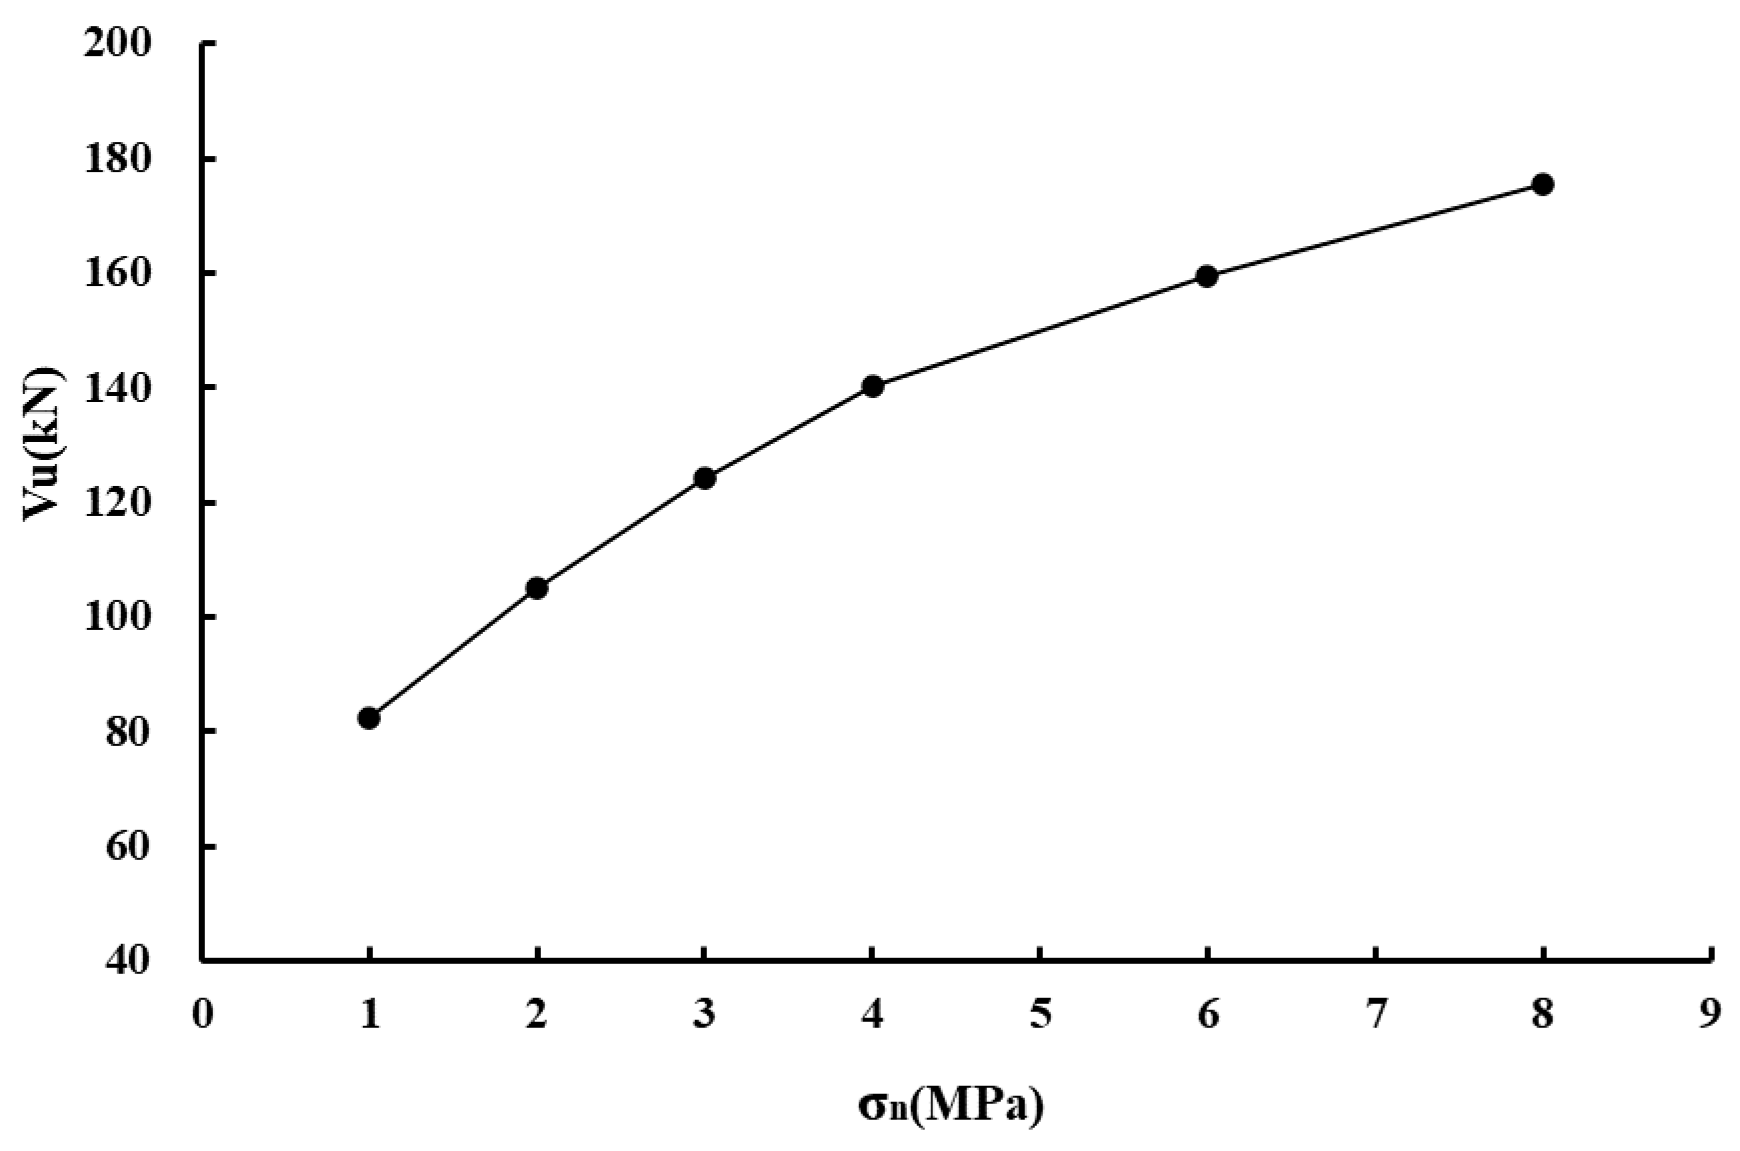
Shown as in Figure 10, when lateral prestress σ n increased from 1 MPa to 4 MPa, the corresponding ultimate shear capacity of the keyed dry joint V u is increased from 82.27 kN to 140.21 kN, the increasement is up to 70.4%. At this stage, V u is basically proportionally to σ n . When σ n increased from 4 MPa to 6 MPa, the increasement of V u is only about 25.3%, from 140.21 kN to 175.67 kN, and the σ n V u curve showed some nonlinear change. Influence of lateral prestress level on the shear capacity of the keyed dry joint decrease when σ n is over 6 MPa.

4.2. Concrete Tensile Strength

The change of the ultimate shear capacity V u along with concrete tensile strength f t is shown in Figure 11. Obviously, as concrete tensile strength f t increasing, the shear bearing capacity V u was increased approximately proportionally. When the concrete was changed from C35 to C65, corresponding tensile strength f t increased from 2.20 MPa to 4.01 MPa, V u is increased from 61.21 kN to 105.86 kN with an increasement up to 72.9%.

4.3. Dimension Parameters of the Key

(1)
Key depth
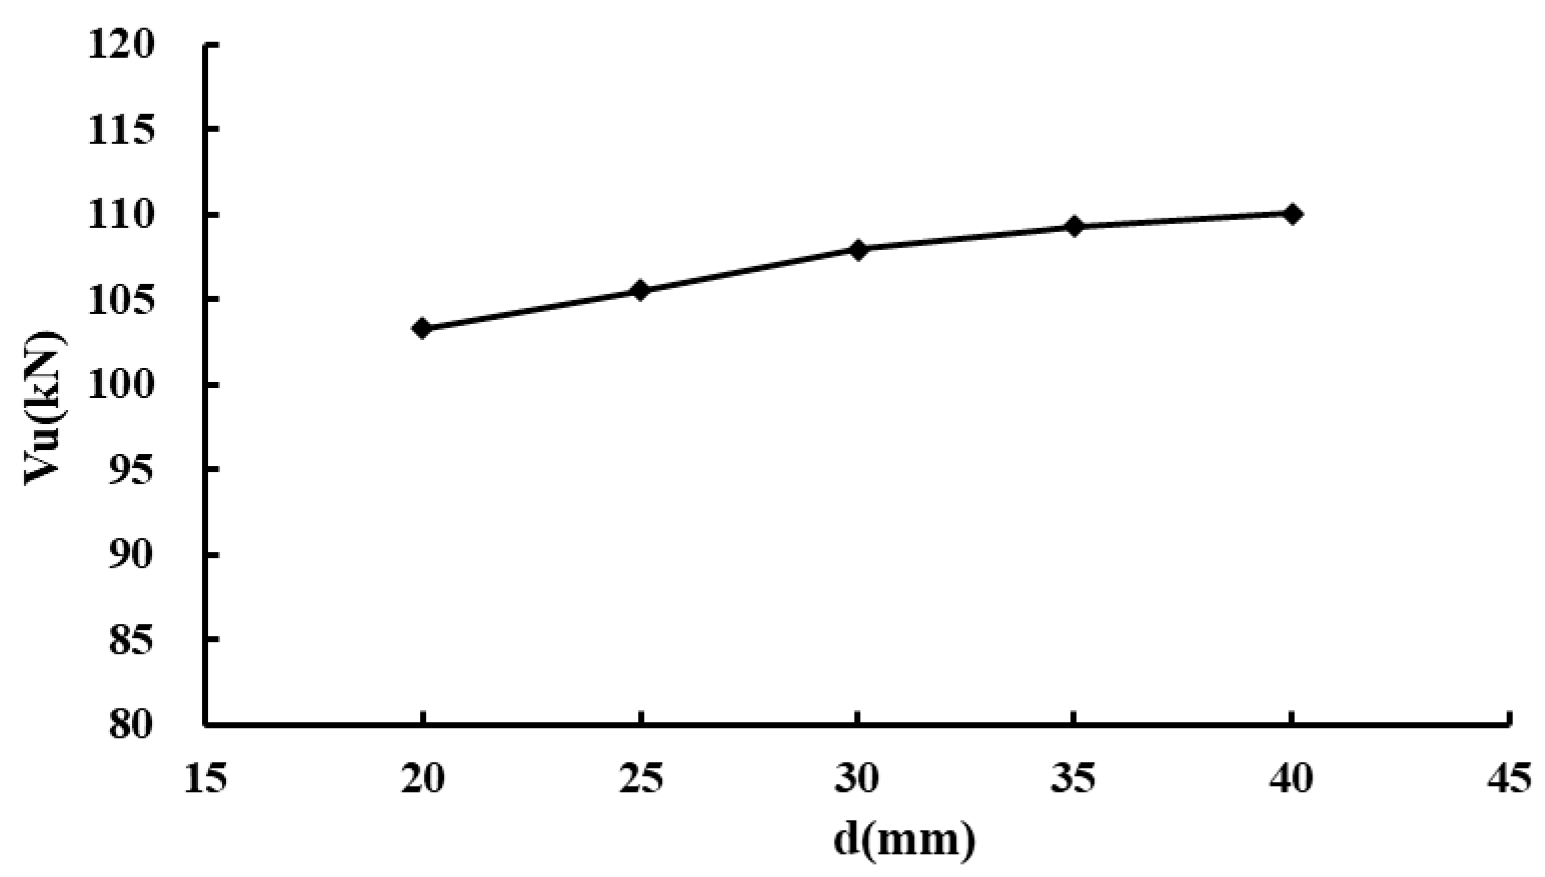
The influence of key depth d on the ultimate shear capacity of the keyed dry joint is illustrated in Figure 12. When d increased from 20 mm to 40 mm, V u is increased from 103.31 kN to 110.05 kN, the increasement is only about 6.5%. Therefore, key depth has no much influence on the ultimate shear capacity of the keyed dry joint.
(2)
Key inclination
The influence of key inclination tan θ on the ultimate shear capacity V u presented a convex parabolic change, shown as in Figure 13. With the increase of tan θ from 0.429 to 0.771, the V u is increased from 93.78 kN to 106.21 kN with an increasement of 13.2%. Since then, V u decreases slightly with the increase of tan θ . According to the curve in Figure 13, a reasonable range of tanθ would be suggested as 0.7~0.9 to obtain a comparatively high shear capacity V u .
(3)
Key aspect ratio (B/H)
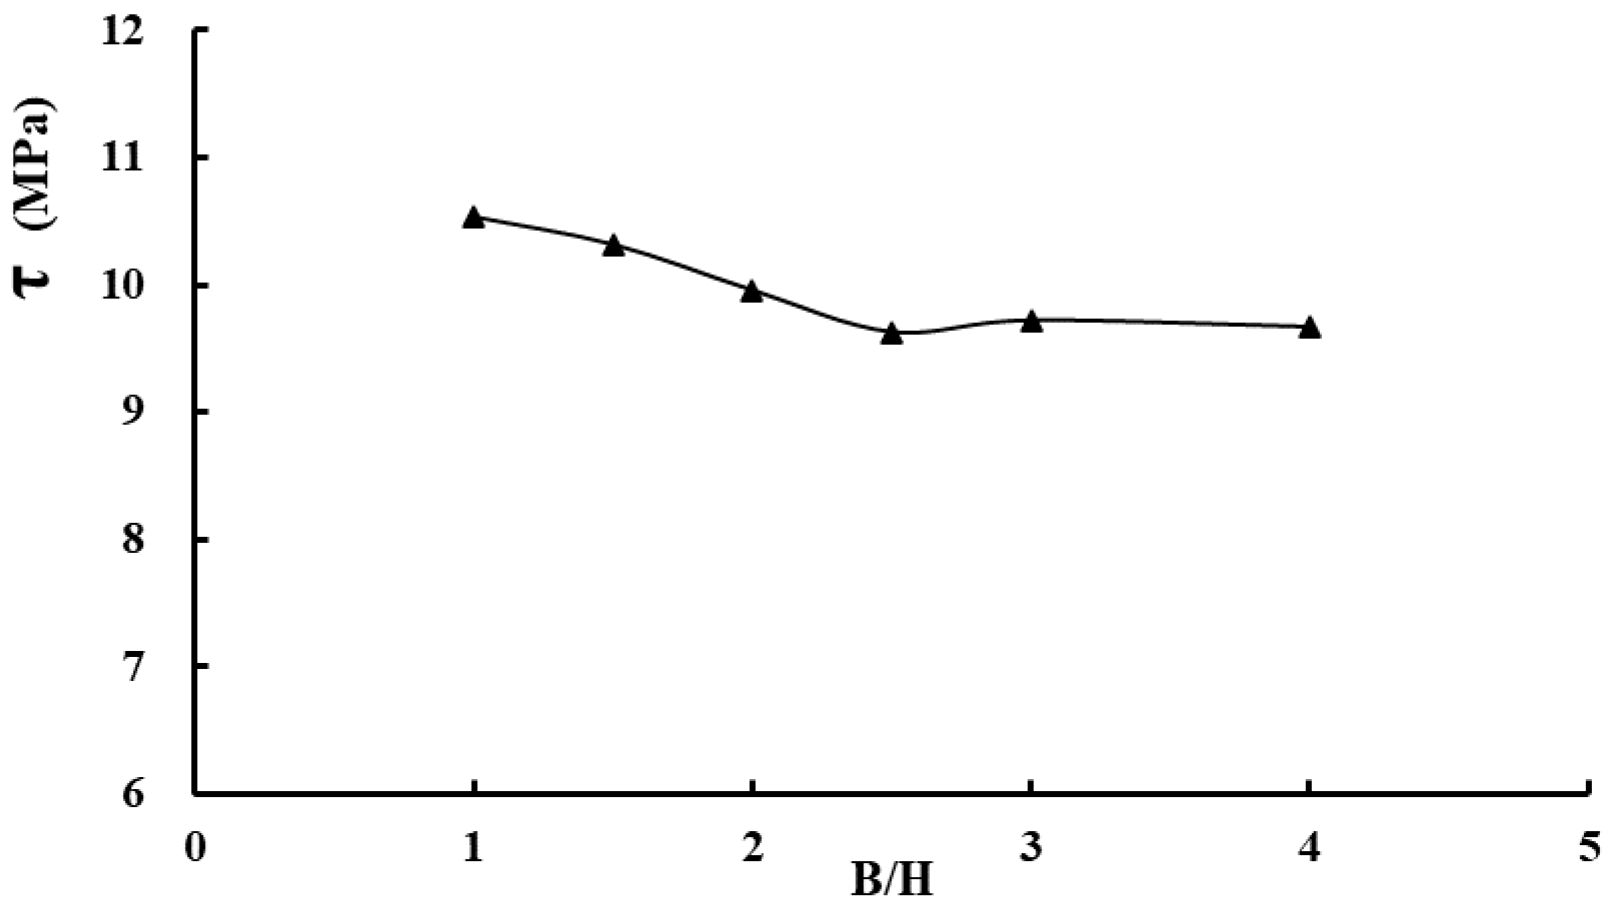
The relationship between the ultimate shear capacity V u and key aspect ratio (B/H) is approximately proportional, see Figure 14. With the increase of B/H from 1.0 to 4.0, the average shear stress τ on the key root section reduced from 10.53 MPa to 9.67 MPa, the reduction amplitude is 8.5%. Shown as in Figure 15.
In comparison, the impact of tan θ on V u is slightly larger than that of d and B/H. But in general, dimension parameters of the key have little effect on the ultimate shear bearing capacity of the keyed dry joint.

5. Proposal and Evaluation of New Shear Capacity Formula

5.1. New Shear Capacity Formula

According to the above research, the ultimate shear capacity V u of the keyed dry joints is not affected by friction force on the joint interface, or by the dimension parameters of the key. The shear resistance of the concrete key root is the only contributor to V u . Namely, V u = τ A k , τ is the average shear stress, A k is the sectional area of the key root.
Distribution of the maximum principal tensile stress on the key root section of the simulation example in Figure 1 is shown in Figure 16. Even under the ultimate state, the principal stress on the whole key root section did not reached concrete tensile strength everywhere. Therefore, the principal tensile stress on the key root section could be obtain by ζ f t . Here,   f t is the concrete tensile strength, ζ is the reduction coefficient.
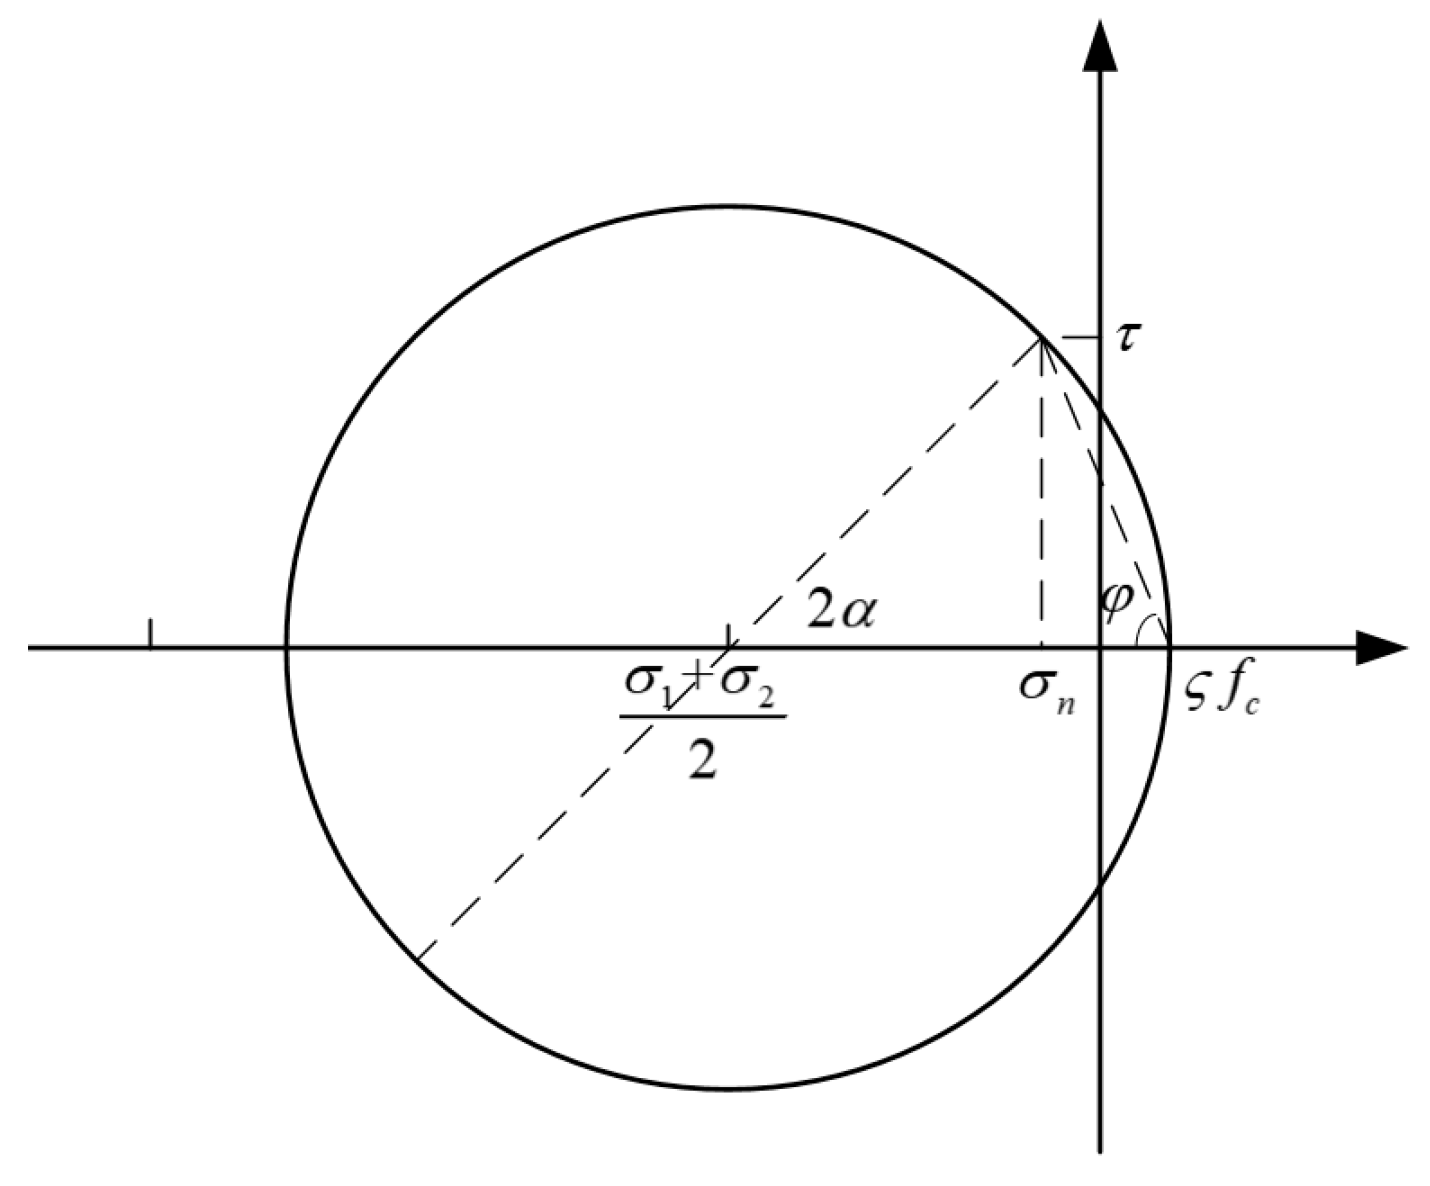
Suppose the shear stress distribute evenly along key root width, then the stress status of any point in the key root could be illustrated as the Mohr stress circle in Figure 17. In which, τ is the vertical shear stress on the key root section, σ n is the lateral pre-compression stress applied on the joint, α is the angle between the principal tensile stress and the horizontal plane.
According to the geometric relationship illustrated in Figure 17
τ s i n 2 α = τ t a n 2 α + σ n + ζ f t
then
τ = c o t α ( σ n + ζ f t )
c o t α = t a n φ = τ ζ f t σ n
According to the maximum principal stress strength criterion, there is:
σ 1 = σ n + σ y 2 + ( σ n σ y ) 2 4 + τ 2 = ζ f t
where, σ y = V B H H W = η τ . η = H W is the aspect ratio of the shear compression zone, and W is the width of the vertical compression zone. Thus, Equation (13) can be converted into the following
σ n + η τ 2 + ( σ n η τ ) 2 4 + τ 2 = ζ f t
then
τ = 1 2 [ η ( ζ f t σ n ) + η 2 ( ζ f t σ n ) 2 + 4 ζ f t ( ζ f t σ n ) ]
substitute Equation (13) into Equation (16), there is
c o t α = 1 2 [ η + η 2 + 4 / ( 1 σ n / ζ f t ) ]
let t = σ n / ζ f t , cotα can be regarded as the function of t, there is
f ( t ) = 1 2 [ η + η 2 + 4 / ( 1 t ) ]
derivation of Equation (18)
d f ( t ) d t = 2 ( 1 t ) 2 η 2 + 4 / ( 1 t )
Obviously, d f ( t ) / d t > 0 , f ( t ) is an increasing function of t. That is, cotα is proportional to σ n / ζ f t , while α is inverse proportional to σ n / ζ f t . Through fitting analysis of the FE simulation results in Table 4, the reasonable value of ζ is obtained to be 0.394.
Based on the above analysis, a new formula of shear capacity of the single-keyed dry joints is proposed as follows:
V = A k c o t ( 0.117 σ n / f t + 0.235 ) ( σ n + 0.394 f t )

5.2. Evaluation of New Formula

To evaluate the applicability of the proposed formula, take the test specimens in Jiang [30], Liu [26], Zhou [27], and Buyukozturk [22] as examples, the calculated shear capacity of the test specimens obtained by the proposed formula are compared with those obtained by the existing formulas mentioned in Section 3.1. Details of all test specimens in the above references are listed in Table 5. The corresponding calculated results obtained by different formulas are listed in Table 6.
In Table 6, data in the brackets are the ratios of shear capacity calculated according to each formula to corresponding test results, R A v is the average value of the ratios in each column. Obviously, R A v of the proposed formula Equation (20) is 0.998, which is the closest to 1.0 compared with other formulas. It indicates the calculated results obtained by Equation (20) are highly consistent with the existing experimental results. In the second place, calculated results obtained according to AASHTO also showed decent consistency with test results. Poor applicability of the other formulas is demonstrated with over 20% difference between calculated results and test results.
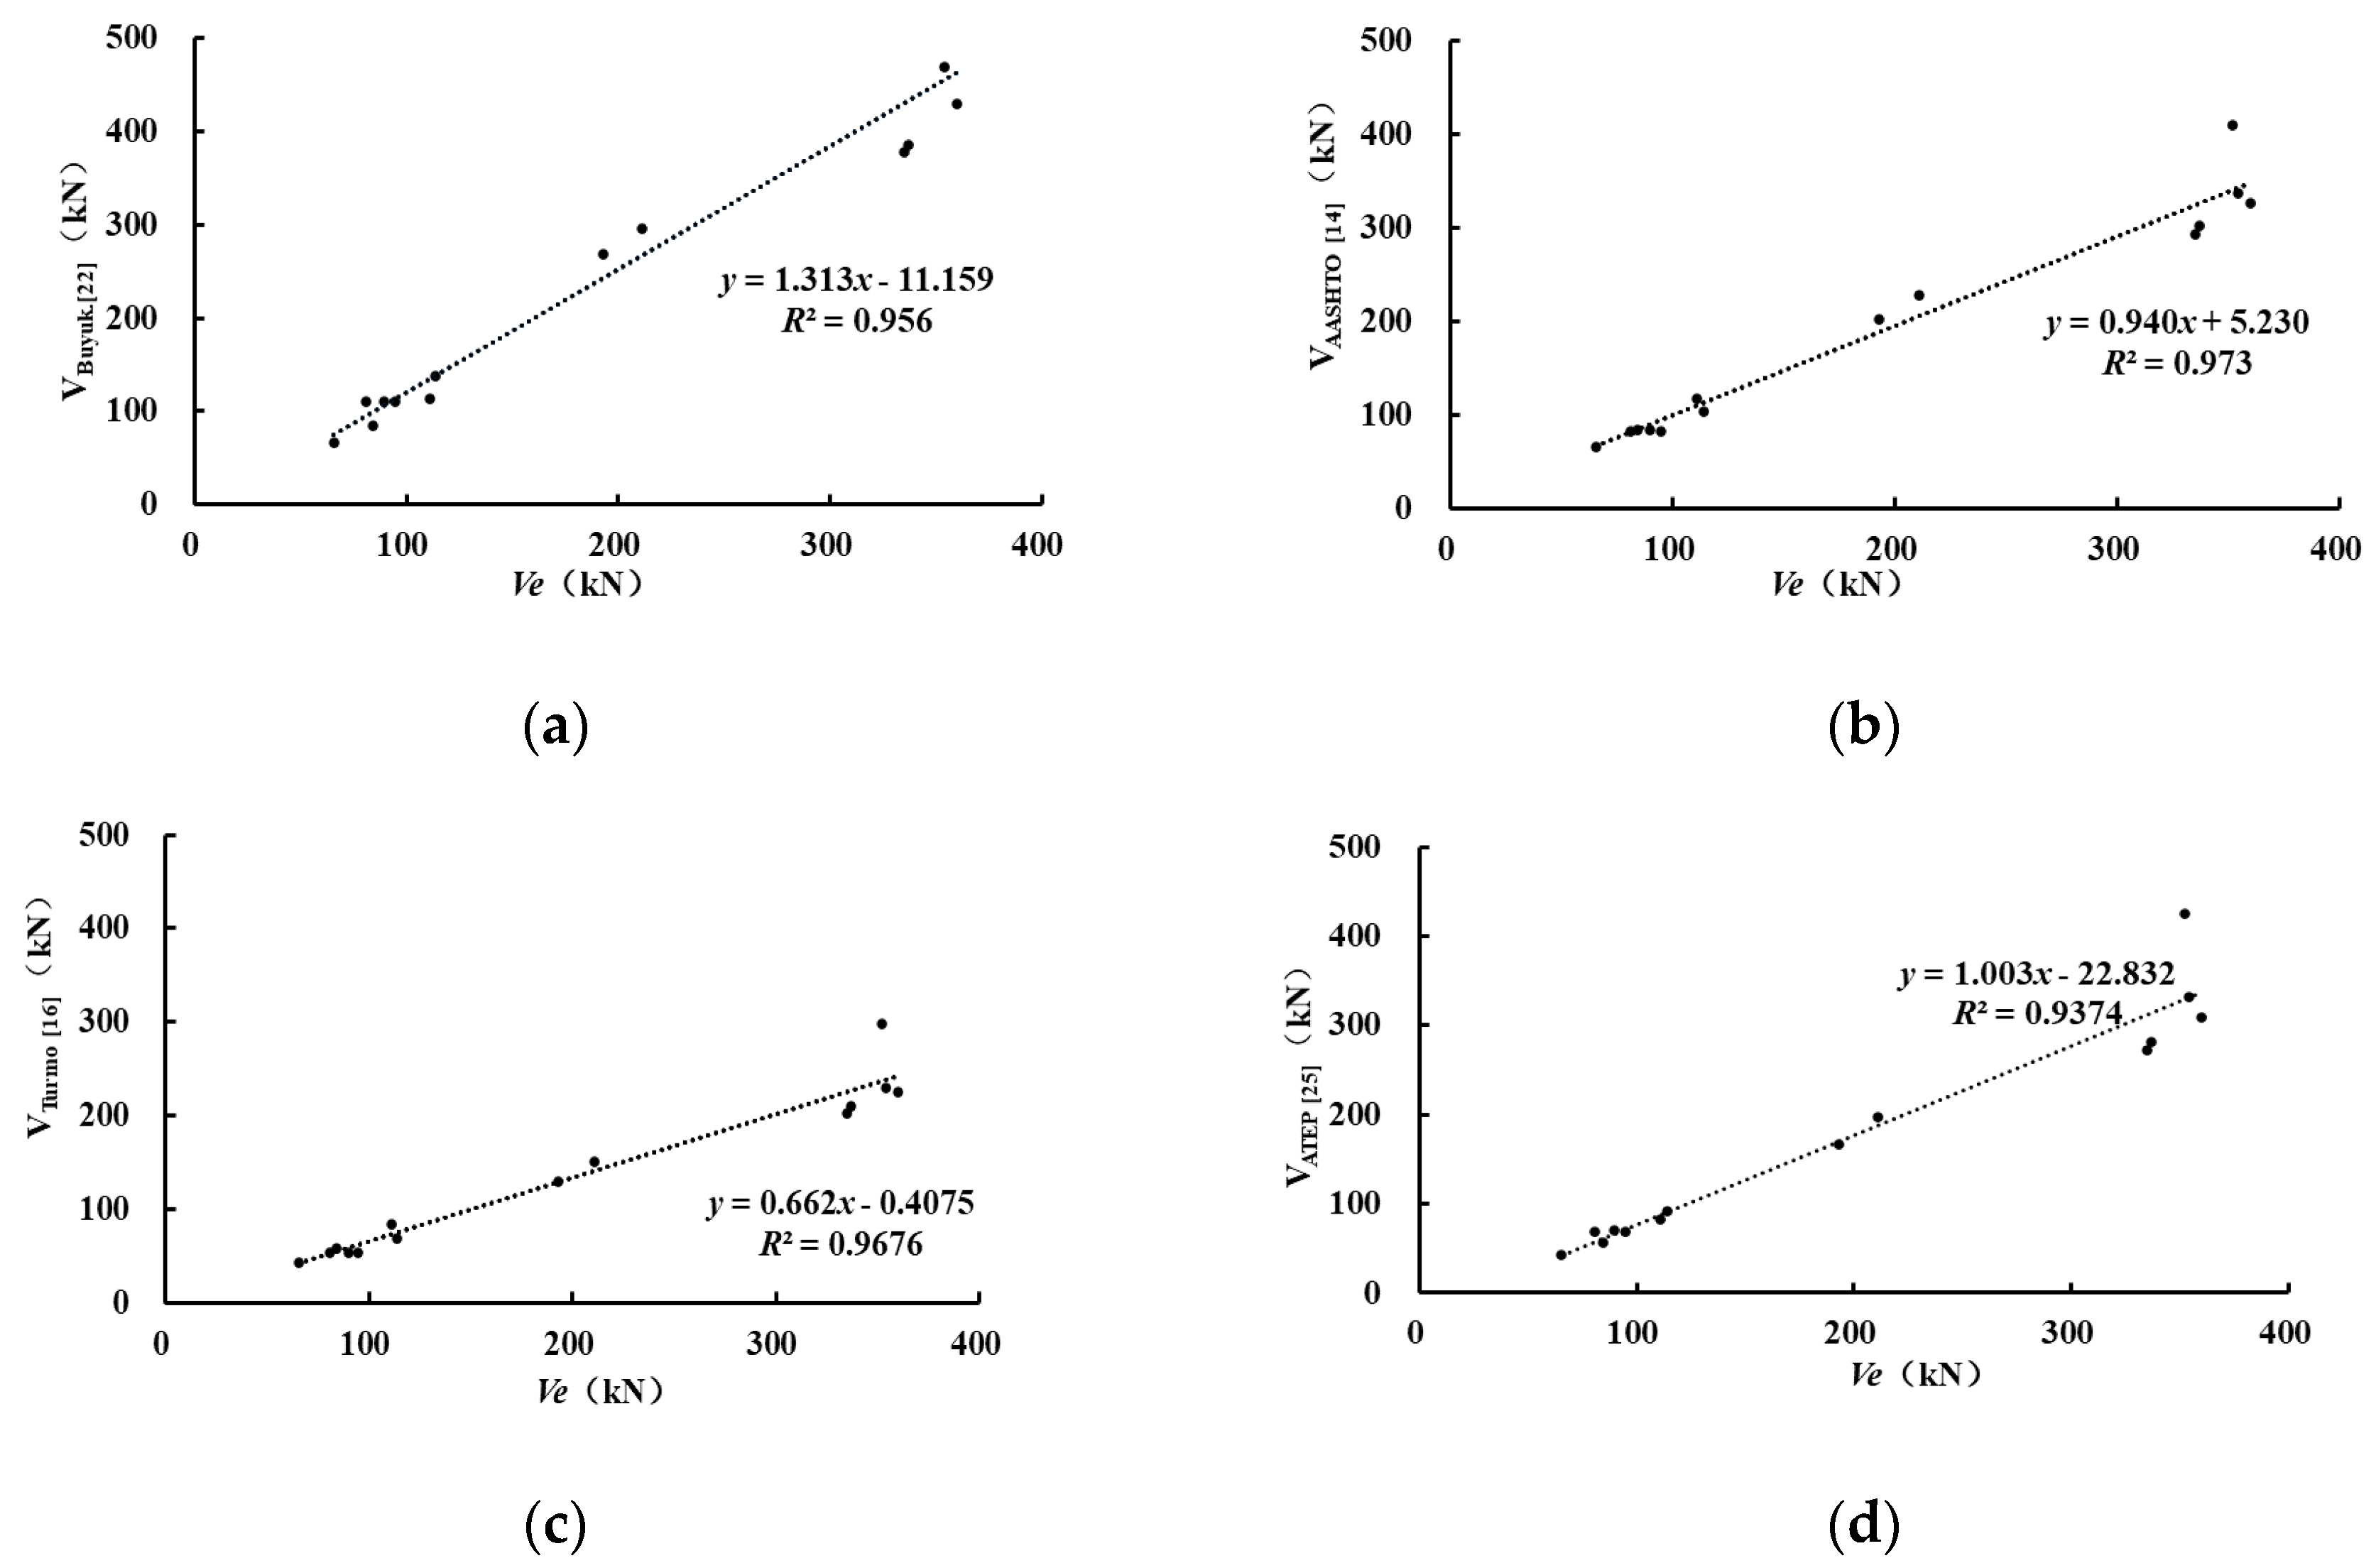
Through regression analysis, the relation between experimental and predicted joint shear strength of different formulas is presented in Figure 18, values of R 2 are also listed in Table 6, which reflects the prediction accuracy of the formulas. Similarly, R 2 of Equation (20) proposed in this paper is the 0.982, which showed higher accuracy in predicting the shear capacity of single keyed dry joint than other existing formulas.
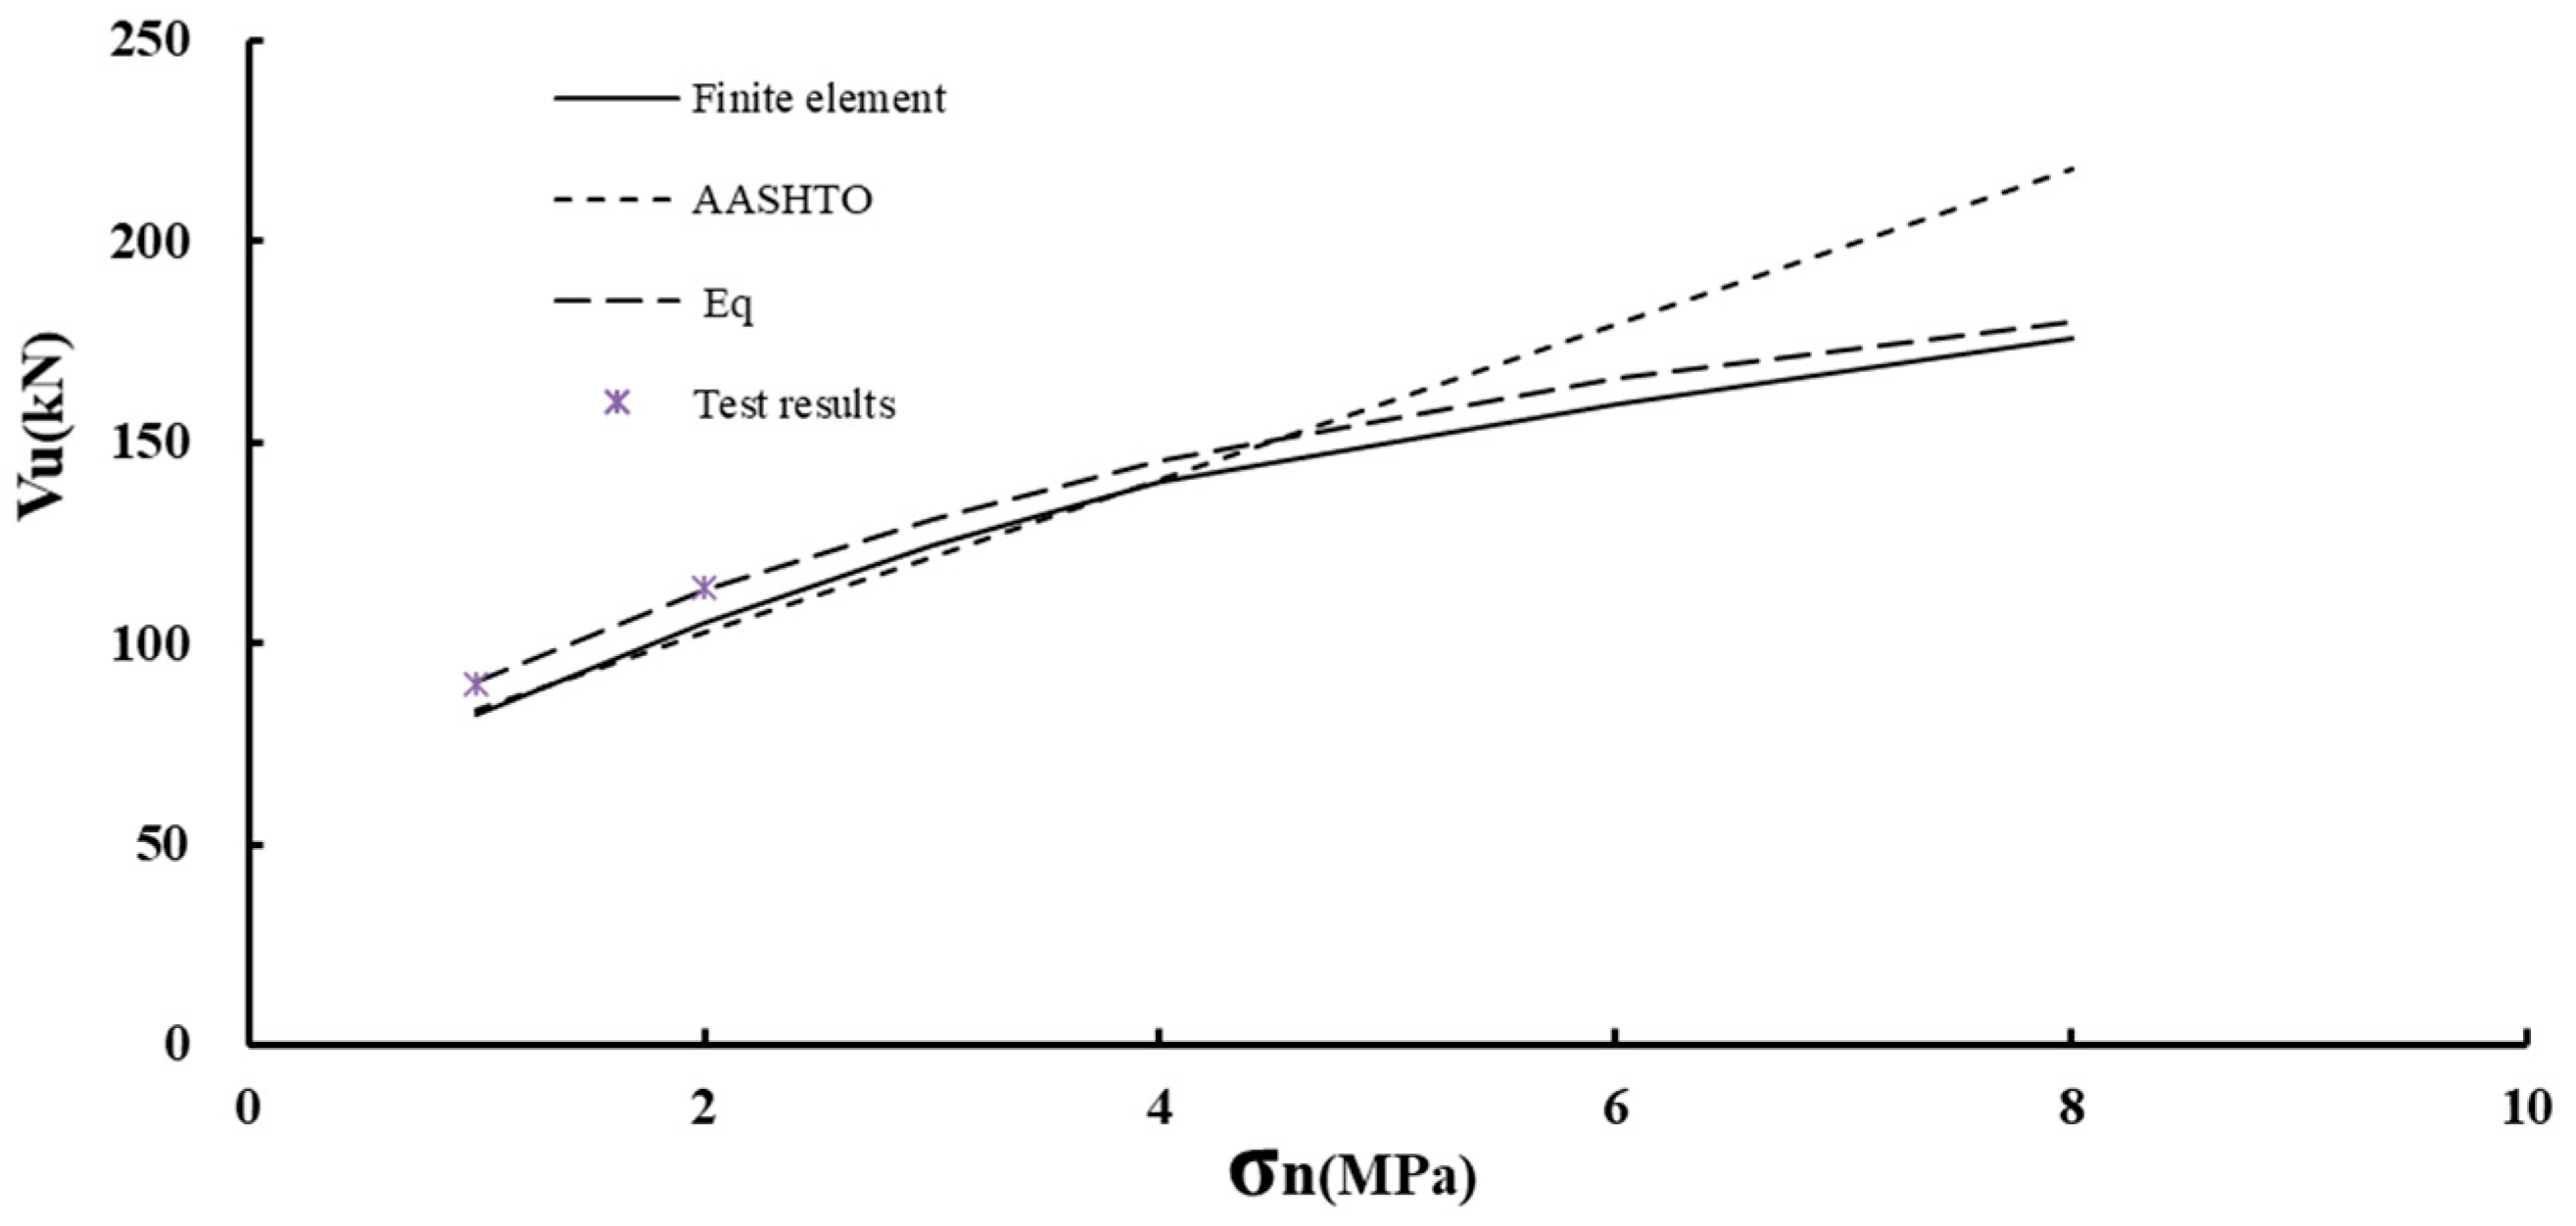
Furthermore, for high level of lateral prestress situation, the shear capacity predicted by AASHTO and Equation (20) are compared with FE simulated values in Figure 19. All the specimens are the same as in Table 4. Different from AASHTO overestimating the shear capacity of the keyed dry joint, the predicted results of Equation (20) showed perfect consistency with both tests and the FE simulation results.

6. Conclusions

Based on nonlinear FE analysis on lots of specimens and detailed discussion on existing research, influence factors of the single-keyed dry joints in segmental precast bridges under the direct shear loading were investigated. A new shear capacity formula was proposed in this paper, and the main conclusions are as follows:
(1)
Considering the plastic damage of concrete, the nonlinear FE model of the single-keyed dry joint was established, the ultimate shear capacity analysis under the direct shear loading was carried out on existed test specimen. Results demonstrated that the simulated results are in good agreement with the existing experimental results. Thus, the feasibility and correctness of the finite element simulation method were verified.
(2)
Both simulated and experimental results indicated that tensile damage occurred in on the underside of the key root even in the linear stage, which was then developed 45° upwards or vertically along the key root section. Concrete tensile strength at the key root is critical to the ultimate bearing capacity of the single-keyed dry joint under the direct shear loading.
(3)
The shear resistance of the concrete key root, related to lateral prestress and concrete tensile strength, is the only contributor to the ultimate shear capacity V u of the keyed dry joints. Friction on the joint interface was demonstrated to be only transferring force between the adjacent joints, V u does not increase with the increase of friction coefficient. Neither do dimension parameters of the key (such as key depth, key inclination and key aspect ratio) have much effect on V u . Meanwhile, a reasonable range of key inclination ( tan θ ) would be suggested as 0.7~0.9 to obtain comparatively higher value of V u .
(4)
According to the above investigation and supposing the shear stress distributed evenly along key root width, a new formula of the shear capacity of the single-keyed dry joints was proposed based on the maximum principal stress strength criterion. In comparison with the predicted results obtained by other existed formulas, the proposed formula is demonstrated to be in perfect consistency with both tests and the FE simulation results.

Author Contributions

Conceptualization, W.H. and M.P.; methodology, W.H.; software, M.P.; validation, M.P., B.J. and Y.T.; formal analysis, W.H. and L.Z; investigation, M.P.; resources, M.P.; data curation, M.P. and B.J.; writing—original draft preparation, M.P. and W.G.; writing—review and editing, W.H. and Y.T.; visualization, Y.T.; supervision, L.Z.; project administration, W.H.; funding acquisition, W.H. All authors have read and agreed to the published version of the manuscript.

Funding

This research was funded by Natural Science Foundation of Hunan Province, Grant number 2019JJ40385.

Acknowledgments

Special thanks are extended to the reviewers for their valuable suggestions. The authors would like to thank Z. John Ma, University of Tennessee, Knoxville for his help in revising the original manuscript, and the reviewers and the editor for their hard work as well.

Conflicts of Interest

The authors declare no conflict of interest.

References

  1. Wang, Z.; Wang, J.; Zhao, G.; Zhang, J. Design criterion for the self-centering capacity of precast segmental UHPC bridge columns with unbonded post-tensioning tendons. Eng. Struct. 2019, 200, 109706. [Google Scholar] [CrossRef]
  2. Ahmed, G.H.; Aziz, O.Q. Shear strength of joints in precast posttensioned segmental bridges during 1959–2019, review and analysis. Structures 2019, 20, 527–542. [Google Scholar] [CrossRef]
  3. Podolny, W. An overview of precast prestressed segmental bridges. PCI J. 1979, 24, 56–87. [Google Scholar] [CrossRef] [Green Version]
  4. Prakhya, G.; Hopkin, I.; Hansford, B. Construction of a concrete segmental arch bridge over a railway. In Proceedings of the Institution of Civil Engineers—Bridge Engineering; Thomas Telford Ltd.: Westminster, London, 2019; Volume 172, pp. 226–240. [Google Scholar] [CrossRef]
  5. Li, G.; Hu, H.; Zhao, S. Axial–shear–flexure interaction behavior of joints in precast concrete segmental bridge columns. J. Bridg. Eng. 2018, 23, 04018071. [Google Scholar] [CrossRef]
  6. Figg, L.; Pate, W.D. Precast concrete segmental bridges—America’s beautiful and affordable icons. Pci. J. 2004, 49, 26. [Google Scholar]
  7. National Academies of Sciences and Medicine. Recommended AASHTO Guide Specifications for ABC Design and Construction; Culmo, M.P., Marsh, L., Stanton, J., Eds.; National Academies Press: Washington, DC, USA, 2018; p. 219. [Google Scholar] [CrossRef]
  8. Hou, W.; Li, Y.; Zheng, Y.; Guo, W. Multi-frequency energy harvesting method for vehicle induced vibration of rail transit continuous rigid bridges. J. Clean. Prod. 2020, 254, 119981. [Google Scholar] [CrossRef]
  9. Hou, W.; Li, Y.; Guo, W.; Li, J.; Chen, Y.; Duan, X. Railway vehicle induced vibration energy harvesting and saving of rail transit segmental prefabricated and assembling bridges. J. Clean. Prod. 2018, 182, 946–959. [Google Scholar] [CrossRef]
  10. Song, S. Experimental Study and Theoretical Analysis in Bending and Joint Shear of High-Speed Railway Precast Segmental Concrete Box Biudges. Ph.D. Thesis, Southeast University, Nanjing, China, 2015. [Google Scholar]
  11. Anagnostopoulou, M.; Andre, F.; Amjad, A. Seismic Design and Analysis of a Precast Segmental Concrete Bridge Model; Technical report MCEER-11-0002, Sep.15, 2011; FHWA. NY 14261; University of New York: New York, NY, USA, 2011. [Google Scholar]
  12. AASHTO. AASHTO LRFD Bridge Design Specifications, 8th ed.; American Association of State Highway and Transportation Officials: Washington, DC, USA, 2017. [Google Scholar]
  13. AASHTO. AASHTO LRFD Bridge Design Specifications, 7th ed.; American Association of State Highway and Transportation Officials: Washington, DC, USA, 2014. [Google Scholar]
  14. Watts, R.; Mills, R.W.; Fish, R. The highway coalition revisited: Using the advocacy coalition framework to explore the content of the American Association of State Highway and Transportation Officials’ Daily Transportation Update. Public Voices 2016, 13, 79. [Google Scholar] [CrossRef]
  15. AASHTO. Interim Rivisions to the Guide Specifications for Design and Construction of Segmental Concrete Bridges, 2nd ed.; American Association of Hwy and Transportation Officials: Washington, DC, USA, 2003. [Google Scholar]
  16. Saibabu, S.; Srinivas, V.; Sasmal, S.; Lakshmanan, N.; Iyer, N.R. Performance evaluation of dry and epoxy jointed segmental prestressed box girders under monotonic and cyclic loading. Constr. Build. Mater. 2013, 38, 931–940. [Google Scholar] [CrossRef]
  17. Turmo, J.; Ramos, G.; Aparicio, A.C. Shear strength of match cast dry joints of precast concrete segmental bridges_ proposal for Eurocode 2. Mater. Constr. 2006, 56, 45–52. [Google Scholar]
  18. Turmo, J.; Ramos, G.; Aparicio, A. Shear strength of dry joints of concrete panels with and without steel fibres. Eng. Struct. 2006, 28, 23–33. [Google Scholar] [CrossRef]
  19. Bu, Z.-Y.; Wu, W.-Y. Inter shear transfer of unbonded prestressing precast segmental bridge column dry joints. Eng. Struct. 2018, 154, 52–65. [Google Scholar] [CrossRef]
  20. Leung, C.C.Y.; Au, F.T.K. Performance of in situ stitches in precast segmental bridges. Mag. Concr. Res. 2016, 68, 1–10. [Google Scholar] [CrossRef] [Green Version]
  21. Koseki, K.; Breen, J. Exploratory Study of Shear Strength of Joints for Precast Segmntal Bridges; FHWA/TX-84/32+248-l, September, 1983; Center for Transportation Research, The University of Texas at Austin: Austin, TX, USA, 1983. [Google Scholar]
  22. Büyüköztürk, O.; Bakhoum, M.M.; Beattie, S.M. Shear behavior of joints in precast concrete segmental bridges. J. Struct. Eng. 1990, 116, 3380–3401. [Google Scholar] [CrossRef]
  23. Rombach, I.G. Precast segmental box girder bridges with external prestressing—Design and construction. In Proceedings of Segmental Bridges; INSA: Rennes, India, 2002; pp. 1–15. [Google Scholar]
  24. Rombach, G.; Specker, A. Design of joints in segmental hollow box girder bridges. In Proceedings of the 1st FIB Kongress, Osaka, Japan, 13–19 October 2002. [Google Scholar]
  25. Alcalde, M.; Cifuentes, H.; Medina, F. Shear strength of dry keyed joints and comparison with different formulations. In Proceedings of the VIII International Conference on Fracture Mechanics of Concrete and Concrete Structures, Univ. of Castilla-La Mancha, Ciudad Real, Spain, 10–14 March 2014. [Google Scholar]
  26. Liu, T.; Wang, Z.; Guo, J.; Wang, J. Shear strength of dry joints in precast UHPC segmental bridges: Experimental and theoretical research. J. Bridg. Eng. 2019, 24, 04018100. [Google Scholar] [CrossRef]
  27. Zhou, X.; Mickleborough, N.; Li, Z. Shear strength of joints in precast concrete segmental bridges. ACI Struct. J. 2005, 102, 3–11. [Google Scholar]
  28. Shamass, R.; Zhou, X.; Alfano, G. Finite-element analysis of shear-off failure of keyed dry joints in precast concrete segmental bridges. J. Bridg. Eng. 2015, 20, 04014084. [Google Scholar] [CrossRef] [Green Version]
  29. Jiang, H.; Feng, J.; Liu, A.; Liang, W.; Tan, Y.; Liang, H. Effect of specimen thickness and coarse aggregate size on shear strength of single-keyed dry joints in precast concrete segmental bridges. Struct. Concr. 2019, 20, 955–970. [Google Scholar] [CrossRef]
  30. Jiang, H.; Wei, R.; Ma, Z.J.; Li, Y.; Jing, Y. Shear strength of steel fiber-reinforced concrete dry joints in precast segmental bridges. J. Bridg. Eng. 2016, 21, 04016085. [Google Scholar] [CrossRef]
  31. Jiang, H.; Chen, L.; Ma, Z.J.; Feng, W. Shear behavior of dry joints with castellated keys in precast concrete segmental bridges. J. Bridg. Eng. 2015, 20, 04014062. [Google Scholar] [CrossRef]
  32. Jiang, H.B.; Di Wang, S.; Fang, Z.C.; Chen, G.; Li, J.H. Numerical analysis on the shear behavior of single-keyed dry joints in precast high-strength concrete segmental bridges. Math. Biosci. Eng. 2019, 16, 3144–3168. [Google Scholar] [CrossRef] [PubMed]
  33. Jiang, H.; Chen, M.; Sha, Z.; Xiao, J.; Feng, J. Numeric analysis on shear behavior of high-strength concrete single-keyed dry joints with fixing imperfections in precast concrete segmental bridges. Mater. 2020, 13, 2914. [Google Scholar] [CrossRef] [PubMed]
  34. Zhenhai, G.; Xudong, S. Principle and Analysis of Reinforced Concrete, 1st ed.; Tsinghua University Press: Beijing, China, 2003. [Google Scholar]
  35. Wei, L.; Ming, X.; Zhongfan, C. Parameter calibration and verification of ABAQUS concrete damage plasticity model. Ind. Build. 2014, 44, 167–171. [Google Scholar]
  36. Najar, J. Continuous Damage of Brittle Solids; Springer: Vienna, Austria, 1987; pp. 233–294. [Google Scholar]
  37. Nan, T.; Jing-jiang, S.; Ke, D. Comparative study on calculation method of damage factor for concrete damage plasticity model. In Proceedings of the 26th National Academic Conference on Structural Engineering, Changsha, Hunan, China, 26–31 July 2007; p. 6. [Google Scholar]
  38. Ombres, L.; Verre, S. Numerical modeling approaches of FRCMs/SRG confined masonry columns. Front. Built Environ. 2019, 5, 5. [Google Scholar] [CrossRef] [Green Version]
Figure 1. Dimensions and configurations of the specimen (unit: mm).
Applsci 10 06304 g001
Figure 2. (a) The tensile stress-strain relationship of concrete; (b) the compressive stress-strain relationship of concrete.
Applsci 10 06304 g002
Figure 3. (a) Relationship between tensile damage and inelastic strain; (b) relationship between compressive damage and inelastic strain.
Applsci 10 06304 g003
Figure 4. Ideal elastic-plastic stress-strain curve for reinforcement.
Applsci 10 06304 g004
Figure 5. Finite element model of the single-keyed dry joint.
Applsci 10 06304 g005
Figure 6. Load-displacement curve of F1.0-d35-A25/35-B100 specimen.
Applsci 10 06304 g006
Figure 7. Tension damage distribution diagram and crack development process; (a) load to point A; (b) load to point B; (c) load to point C.
Applsci 10 06304 g007
Figure 8. Calculation results of various formulas under different lateral prestress.
Applsci 10 06304 g008
Figure 9. Vertical force component of tangential force at the contact surface; (a) under lateral prestress; (b) 0.004 V u state; (c) under ultimate load V u ; (d) diagram of forces on the interface.
Applsci 10 06304 g009
Figure 10. The curve of V u versus σ n .
Applsci 10 06304 g010
Figure 11. The curve of V u versus f t .
Applsci 10 06304 g011
Figure 12. The curve of V u versus d.
Applsci 10 06304 g012
Figure 13. The curve of V u versus tan θ .
Applsci 10 06304 g013
Figure 14. The curve of V u versus B/H.
Applsci 10 06304 g014
Figure 15. The curve of τ   versus B/H.
Applsci 10 06304 g015
Figure 16. Distribution of the maximum principal tensile stress on the key root section.
Applsci 10 06304 g016
Figure 17. Mohr stress circle.
Applsci 10 06304 g017
Figure 18. Relation between the experimental and predicted joint shear strength of different formulas. (a) results of Buyukozturk’s formula.; (b) results of AASHTO (2003) provisions; (c) results of Turmo’s formula; (d) results of ATEP provisions; (e) results of Rombach’s formula; (f) results of Equation (20).
Applsci 10 06304 g018aApplsci 10 06304 g018b
Figure 19. Comparison of the shear capacity predicted by different formulas and FE simulated values.
Applsci 10 06304 g019
Table 1. The ultimate shear capacity comparison between finite element (FE) and test results.
Test SpecimenFE Results (kN)Test Results (kN)
F1.0-d35-A0.714-B100-H10082.2789.70
F2.0-d35-A0.714-B100-H100105.86113.87
F1.0-d25-A1-B100-H10074.8680.79
F1.0-d50-A0.5-B100-H10088.9094.47
Note: The symbol meanings of the test specimen name are as follows: F, lateral pre-compressive stress, in MPa; d, depth of the key, in mm; A, inclination tangent value of the key pressure surface; B, key width, in mm; H, key height, in mm.
Table 2. Calculation results of various formulas under different lateral prestress.
Lateral Preload123468
AASHTO83.37102.58121.78140.99179.40217.81
Turmo54.0168.4182.8197.21126.01154.81
ATEP69.6192.41115.21138.01181.31229.21
Rombach71.1084.1097.10110.10136.10162.10
Bakhoum110.56137.76164.96192.16246.26300.96
VE89.70113.87----
VF82.3105.3124.4140.2159.5175.7
Table 3. The shear bearing capacity of test pieces under different friction coefficients (unit: kN).
Friction Coefficient0.40.60.81.0
Specimen
F1.0-d35-A25/3583.1282.2782.8183.43
F8.0-d35-A25/35161.11161.91161.83162.67
Table 4. Finite element model parameters of the single-keyed dry joint.
GroupSpecimen Numberσn (MPa)Ft (MPa)d (mm)tanθB/H
GFGF1-114.01350.7141.0
GF1-22
GF1-33
GF1-44
GF1-55
GF1-66
GCrGCr1-122.20
GCr1-22.51
GCr1-32.74
GCr1-42.93
GCr1-54.01
GdGd1-14.0120
Gd1-225
Gd1-330
Gd1-435
Gd1-540
GAGA1-1350.429
GA1-20.571
GA1-30.657
GA1-40.714
GA1-50.771
GA1-61.000
GBHGBH1-10.7141.0
GBH1-21.5
GBH1-32.0
GBH1-42.5
GBH1-53.0
GBH1-64.0
Table 5. Summary of test specimens in references.
ReferenceSpecimen NumberSpecimen NumberConcrete Strength (MPa)
Jiang [31]F1.0-d35-A25/35-B100-H100J-1fcu = 48.5 MPa
F2.0-d35-A25/35-B100-H100J-2fcu = 48.5 MPa
F1.0-d25-A25/25-B100-H100J-3fcu = 48.5 MPa
F1.0-d50-A25/50-B100-H100J-4fcu = 48.5 MPa
Zhou [28]F1.0-D50-A25/50-B250-H100Z-1fc = 38.7 MPa
F1.0-D50-A25/50-B250-H100Z-2fc = 50 MPa
F2.0-D50-A25/50-B250-H100Z-3fc = 56.2 MPa
F2.0-D50-A25/50-B250-H100Z-4fc = 59.6 MPa
F3.0-D50-A25/50-B250-H100Z-5fc = 48.8 MPa
F4.0-D50-A25/50-B250-H100Z-6fc = 37.1 MPa
Liu [27]F10-D50-A25/50-B150-H100L-1ft = 4.6 MPa
Buyukozturk [23]F0.68-D32-A32/32-B76.2-H100B-1ft = 4.33 MPa
F2.07-D32-A32/32-B76.2-H100B-2ft = 3.97 MPa
F3.45-D32-A32/32-B76.2-H100B-3ft = 4.38MPa
Table 6. Summary of comparative test results (unit: kN).
SpecimenVBuyuk. [23]VAASHTO [15]VTurmo [17]VATEP [26]VRombach [24]V Equation (20)VE
J-1110.56 (1.23)83.37 (0.93)53.95 (0.60)69.61 (0.78)71.10 (0.79)95.44 (1.06)89.7
J-2137.76 (1.21)102.58 (0.90)68.34 (0.60)92.41 (0.81)84.10 (0.74)114.43 (1.01)113.9
J-3109.85 (1.36)82.71 (1.02)53.41 (0.66)68.82 (0.85)70.12 (0.87)91.22 (1.13)80.8
J-4109.85 (1.16)82.71 (0.88)53.41 (0.57)68.82 (0.73)70.12 (0.74)91.22 (0.97)94.5
Z1269.25 (1.40)201.78 (1.05)129.43 (0.67)166.13 (0.86)167.95 (0.87)223.86 (1.16)193.0
Z2378.52 (1.13)293.51 (0.88)202.42 (0.60)272.48 (0.81)261.70 (0.78)316.07 (0.94)335.0
Z3296.75 (1.41)227.31 (1.08)150.74 (0.71)198.00 (0.94)207.50 (0.98)245.74 (1.16)211.0
Z4385.75 (1.14)301.36 (0.89)209.31 (0.62)282.07 (0.84)273.60 (0.81)322.25 (0.96)337.0
Z5429.99 (1.19)326.35 (0.91)225.30 (0.63)308.62 (0.86)268.30 (0.75)349.46 (0.97)360.0
Z6469.04 (1.32)336.53 (0.95)229.66 (0.65)332.62 (0.94)259.85 (0.73)356.51 (1.01)354.0
L-1544.15 (1.55)410.48 (1.17)297.47 (0.85)425.25 (1.21)298.32 (0.85)325.68 (0.93)351.9
B-166.31 (1.01)65.34 (0.99)43.33 (0.66)42.86 (0.65)57.10 (0.87)62.69 (0.96)65.5
B-284.61 (1.00)84.16 (0.99)57.94 (0.69)56.73 (0.67)59.81 (0.71)82.01 (0.97)84.2
B-3112.6 (1.01)116.4 (1.05)83.83 (0.76)81.88 (0.74)80.02 (0.72)82.01 (0.74)111.0
RAv1.2220.9780.6620.8350.8000.998
R20.9560.9730.9680.9370.9760.982