Article

Ultrasound DMAS Beamforming for Estimation of Tissue Speed of Sound in Multi-Angle Plane-Wave Imaging

Department of Electrical Engineering, National Taiwan University of Science and Technology, Taipei 10607, Taiwan
*
Author to whom correspondence should be addressed.
Appl. Sci. 2020, 10(18), 6298; https://doi.org/10.3390/app10186298
Submission received: 3 August 2020 / Revised: 4 September 2020 / Accepted: 7 September 2020 / Published: 10 September 2020
(This article belongs to the Section Acoustics and Vibrations)

Abstract

:
Various methods have been proposed to estimate the tissue speed of sound (SOS) of propagating medium using the curvature of received channel waveform or the analysis of resultant image quality. In our previous study, baseband delay-multiply-and-sum (DMAS) beamforming methods have been developed for multi-angle plane-wave (PW) imaging which relies on signal coherence among transmit events (Tx-DMAS) or receive channel (Rx-DMAS) or both (2D-DMAS) to suppress low-coherence clutters. In this study, we further extend our DMAS beamforming to quantify the level of signal coherence for determining the average SOS in multi-angle PW imaging. The signal coherence in multi-angle PW imaging is represented as the DMAS coherence factor (DCF) which can be easily estimated from the magnitude ratio of the pixel value of DMAS image to that of DAS image. By searching the beamforming velocity that provides the highest signal coherence of echo matrix, the average tissue SOS of the imaged object can be determined. For the PICMUS experimental dataset, the optimal beamforming velocity (Copt) estimated by the proposed DCF method does provide the best image quality. For the Prodigy dataset, the estimated tissue SOS is 1426 ± 6 m/s which is very close to the actual tissue SOS of 1427 m/s and the estimated SOS also corresponds to the Copt with the minimal −6-dB lateral width and the maximal contrast within an error of 10 m/s. Estimation of tissue SOS in the proposed DCF method is also robust even in the presence of transmit delay error due to deviation of SOS.

1. Introduction

Ultrasound single plane-wave (PW) imaging only needs a single shot to reconstruct one image and thus has a very high frame rate. Because of the lack of transmit focusing, however, the image resolution, contrast (CR) and signal-to-noise ratio (SNR) degrade in single PW imaging. Therefore, previous studies have proposed multi-angle PW coherent compounding imaging (CPWC) [1] that can simultaneously maintain a high frame rate and achieve the quality of traditional transmit focused images. This method uses multiple transmit events (TxEt) of different PW angles to synthesize high-resolution images. The receiving channel (RxCh) echoes are firstly processed in parallel to obtain low-resolution sub-images of each PW angle, and then these sub-images are coherently summed to form a high-resolution compounded image. In other words, the final CPWC image pixel value is obtained by two-dimensional (2D) summation of the echo matrix in both the RxCh and the TxEt directions. Compared with CPWC imaging, the signal coherence of the 2D echo matrix can be further used to attenuate low coherent clutters in the image for better image resolution and CR. For example, delay-multiply-and-sum (DMAS) beamforming is based on signal coherence to improve the image quality of ultrasound array system. It remedies the low image resolution and high side lobe level of conventional delay-and-sum (DAS) beamforming by using mutual multiplication of possible channel pairs to suppress any spatially uncorrelated clutter artifacts and thermal noises [2,3,4,5,6]. Note that DMAS beamforming has been adopted in not only medical ultrasound but also photoacoustic imaging [7,8,9,10]. Several works have been developed to extend DMAS beamforming for PW imaging using either the signal coherence of the echo matrix in the TxEt direction [11] or in the RxCh direction [12]. Recently, a novel DMAS operation has also been proposed to extract the 2D spatial coherence of echo matrix for further improvement of image quality [13].
Similar to ultrasound imaging with focused transmit, the imaging quality of ultrasonic multi-angle PW imaging also depends on the accuracy of beamforming. In the process of beamforming, it is usually assumed that the tissue speed of sound (SOS) of propagating medium is a known fixed value for designing the delay profile among channels to achieve focusing. However, the actual tissue SOS varies widely according to the composition of tissues. Therefore, when the beamforming velocity (Cbeam) does not match the actual tissue SOS, a beamforming error occurs and results in a decrease in image resolution and CR. In the literatures tissue SOS estimation for finding the optimal Cbeam (Copt) can be roughly separated into two categories: pre-beamforming array signal analysis and post-beamforming image quality analysis. The former includes the RxCh waveform curvature fitting to the geometric position of every channel in an array using different Cbeam. The Cbeam that best fits the echo curvature is the Copt [14]. The minimum average phase variance method is to calculate the minimal phase variances of channel signal using different Cbeam to determine the Copt [15]. The phase variance can be also represented in the form of channel differential phase gradient between left and right sub-apertures [16,17]. On the other hand, the channel autocorrelation function of different Cbeam with the largest area under curve also correspond to the Copt [18]. Post-beamforming methods includes image spatial frequency spectrum analysis in the lateral direction to calculate the largest spatial spectral area within a specified frequency range as the Copt [19]. Similarly, the edge sharpness of image can be estimated using anisotropic diffusion filtering to locate the Copt the highest edge sharpness [20]. Autocorrelation of background speckle pattern also serve as the focus quality factor to quantify the image resolution. The Cbeam with the smallest average autocorrelation function value within a certain lateral displacement is the Copt [21].Autocorrelation can be also performed after de-convolving the image with a point-spread-function corresponding to different Cbeam [22]. Note that these aforementioned methods are not specifically developed for multi-angle PW imaging and thus they do not consider the signal coherence in the 2D echo matrix in multi-angle PW imaging on the estimation of tissue SOS.
In this study, we propose a tissue SOS estimation technique which depends on the signal coherence of 2D echo matrix in multi-angle PW imaging. The signal coherence in multi-angle PW imaging is represented as the DMAS coherent factor (DCF) which can be easily estimated from the magnitude ratio of the pixel value of DMAS image to that of DAS image. By searching the Copt that provides the highest signal coherence of echo matrix, the averaged tissue SOS of the imaged object can be determined.

2. Theory

2.1. BB-DMAS Beamforming

Compared to the original version of DMAS beamforming which relies on signal coherence among radio-frequency (RF) channel waveform [2], baseband DMAS (BB-DMAS) beamforming does not require oversampling and an additional band-pass filter to extract the RF-DMAS signal spectrally shifted to harmonic frequency [6]. Specifically, BB-DMAS beamforming first demodulates the received channel data down to the baseband and scales the channel magnitude using p-th root. After channel summation, the p-th power is performed to restore the signal dimensionality. Given the time-compensated baseband signal of the n-th RxCh as s n = a n e j ϕ n , the image output of BB-DMAS beamforming can be expressed as:
y BB - DMAS = ( 1 N n = 1 N a n p e j ϕ n ) p ,
where the degree of signal coherence among channels is determined by the p value (p > 1). When the p value increases, DMAS beamforming introduces more signal coherence into its image output and thus will have better clutter suppression. Nonetheless, when the p value is too high, DMAS image would suffer from high speckle variation, noticeable dark-region artifacts and highlighting effect of the focal zone. Note that BB-DMAS beamforming degenerates to DAS beamforming when p equals unity.

2.2. DMAS Beamforming in Multi-Angle PW Imaging

In multi-angle PW imaging, each image pixel comes from a 2D signal matrix comprising echoes in both RxCh and TxEt directions. Any combination of DAS and DMAS beamforming can be applied to the 2D echo matrix in the RxCh direction and the TxEt direction to determine the final B-mode image pixel. The resultant four beamforming methods include 2D-DAS (i.e., CPWC) for 2D summation of the echo matrix, 2D-DMAS for DMAS beamforming in both of RxCh and TxEt directions [13], Rx-DMAS for coherent summation in the TxEt direction and then DMAS processing in the RxCh direction [12], and Tx-DMAS for coherent summation in the RxCh direction and then DMAS processing in the TxEt direction [11]. Given the time-compensated baseband signal s n k = a n k e j ϕ n k for the n-th RxCh in the k-th TxEt (i.e., the k-th PW transmit angle), the four beamforming methods can be formulated as:
y 2 D - DAS = 1 M k = 1 M ( 1 N n = 1 N a n k e j ϕ n k ) ,
y 2 D - DMAS = [ 1 M k = 1 M ( 1 N n = 1 N a n k p e j ϕ n k ) ] p ,
y Rx - DMAS = ( 1 N n = 1 N c n p e j α n ) p with   c n e j α n = 1 M k = 1 M a n k e j ϕ n k ,
y Tx - DMAS = ( 1 M k = 1 M b k p e j β k ) p with   b k e j β k = 1 N n = 1 N a n k e j ϕ n k ,
Here, similar to Equation (1), the p value also represents the importance of the signal coherence in the image output of DMAS beamforming. Compared to the traditional CPWC (2D-DAS) beamforming in multi-angle PW imaging, all three DMAS images will have superior image resolution and CR. Specifically, for image resolution, CR, and artifact suppression, 2D-DMAS has the best performance and Tx-DMAS has the worst performance among these three DMAS methods. On the contrary, Tx-DMAS has the best contrast-to-noise ratio due to its higher speckle smoothness and suffers less from the dark-region artifacts around strong point reflectors [23].

2.3. DCF of Multi-Angle PW Imaging for Tissue SOS Estimation

In this study, the magnitude ratio of image pixel value of DMAS beamforming to that of 2D-DAS is defined as the DCF to indicate the degree of signal coherence. For low-coherent image targets like clutter, the DMAS image pixel value will decrease significantly relative to the 2D-DAS, so it will have a smaller DCF value. On the contrary, for high-coherent image targets like point reflector, its DMAS image pixel value will be similar to 2D-DAS and thus has a DCF value close to unity. Taking 2D-DMAS beamforming method as an example, the corresponding DCF value can be readily simplified as the (p − 1)-th power of the magnitude of phasor summation for every signal in the 2D echo matrix by assuming the echo signal of all RxCh at all transmit angle has the same amplitude (i.e., assuming a n k is a constant):
DCF 2 D - DMAS | y 2 D - DMAS y 2 D - DAS | = | [ 1 M k = 1 M ( 1 N n = 1 N a n k p e j ϕ n k ) ] p 1 M k = 1 M ( 1 N n = 1 N a n k e j ϕ n k ) | | 1 M N k = 1 M n = 1 N e j ϕ n k | p 1 ,
Though the approximation in Equation (6) only holds for point-like reflector, the magnitude ratio of DMAS image to 2D-DAS image can still be used to measure the signal similarity in phase for diffused scatterers without loss of generality. With the same assumption, the DCF obtained from the other two DMAS beamforming methods can also be approximated as the following formula:
DCF Rx - DMAS | y Rx - DMAS y 2 D - DAS | | 1 N n = 1 N e j α n | p 1 ,
DCF Tx - DMAS | y Tx - DMAS y 2 D - DAS | | 1 M k = 1 M e j β k | p 1 ,
where the definition of αn and βk is provided in Equations (4) and (5), respectively. Thought the DCF proposed in this study can be understood as the magnitude of phasor summation in the echo matrix of PW imaging, it should not be confused with the phase coherent factor in [24] or the vector coherent factor in [25] because they are intrinsically different in both definition and calculation.
In this study, we propose to use the aforementioned DCF to consider the signal coherence of echo matrix for tissue SOS estimation in multi-angle PW imaging. Figure 1a–c illustrate the DCF maps of different Cbeam. Figure 1a,c show that, when the Cbeam mismatches the tissue SOS, the signal coherence and the corresponding DCF value of the 2D echo matrix will decrease. In contrast, Figure 1b shows that the DCF value will be significantly higher when the Cbeam matches the tissue SOS. In our method, we will calculate the DCF map of different Cbeam and select the speckle region-of-interest (ROI) at the depth of elevational focus of the array probe (as shown by the black square in Figure 1b) to observe the change of DCF value with the Cbeam. As shown in Figure 1d, the Cbeam with the maximal DCF value is the Copt that corresponds to the tissue SOS estimated in our method as expressed in Equation (9):
C o p t = arg max C b e a m | DCF | ,
Note that, in the scenario of focused transmit imaging, the degree of signal coherence has also been used for estimation of tissue SOS so that the Cbeam with the highest signal coherence corresponds to the tissue SOS [18,26]. Nonetheless, all these methods demand for additional channel-domain processing to estimate the degree of signal coherence. On the contrary, the signal coherence in the proposed DCF method can be readily obtained by the magnitude ratio of image pixel value of DMAS beamforming to that of DAS beamforming and thus does not require to retain the received channel data for tissue SOS estimation. This drastically reduces the computational complexity for tissue SOS estimation.

3. Materials and Methods

We use Field II simulations and experimentally acquired data from a commercial phantom (Model 040GSE, CIRS, Norfolk, VA, USA) provided on the PICMUS platform (IEEE IUS 2016) [27] to validate the proposed DCF method for SOS estimation in multi-angle PW imaging. In addition to the PICMUS dataset, channel waveform from another experimental phantom (Model 042, CIRS) was also collected using Prodigy ultrasonic imaging system (S-sharp, New Taipei City, Taiwan). In this study, the effects of Rx aperture size, channel SNR and DMAS beamformer on tissue SOS estimation were firstly evaluated using PICMUS simulation phantoms, and the result of tissue SOS estimation was justified with image quality metrics such as –6-dB lateral width (LW) of wire targets and the CR of anechoic cyst. After choosing the proper Rx aperture size and DMAS beamformer in the simulations, the same setting is used to estimate the tissue SOS of the PICMUS experimental phantom. In order to determine the exact SOS of our own experimental phantom at the time of measurement, a 0.5 MHz single-element probe (Panametrics NDT A301S, Waltham, MA, USA) is used with a pulse transmitter/receiver (Panametrics 5072PR) and an oscilloscope to measure the pulse-echo time from the bottom of the phantom. Since the dimension of the experimental phantom is known, the actual tissue SOS of the phantom is calculated from the measured pulse-echo time. Note that the collection of channel data from 21 PW transmissions evenly distributed between −16° and +16° was accomplished within one hour after the pulse-echo measurement in order to avoid possible SOS variation of the phantom due to the change of ambient temperature [28]. The proposed DCF method is also tested using in-vivo carotid dataset on the PICMUS platform.
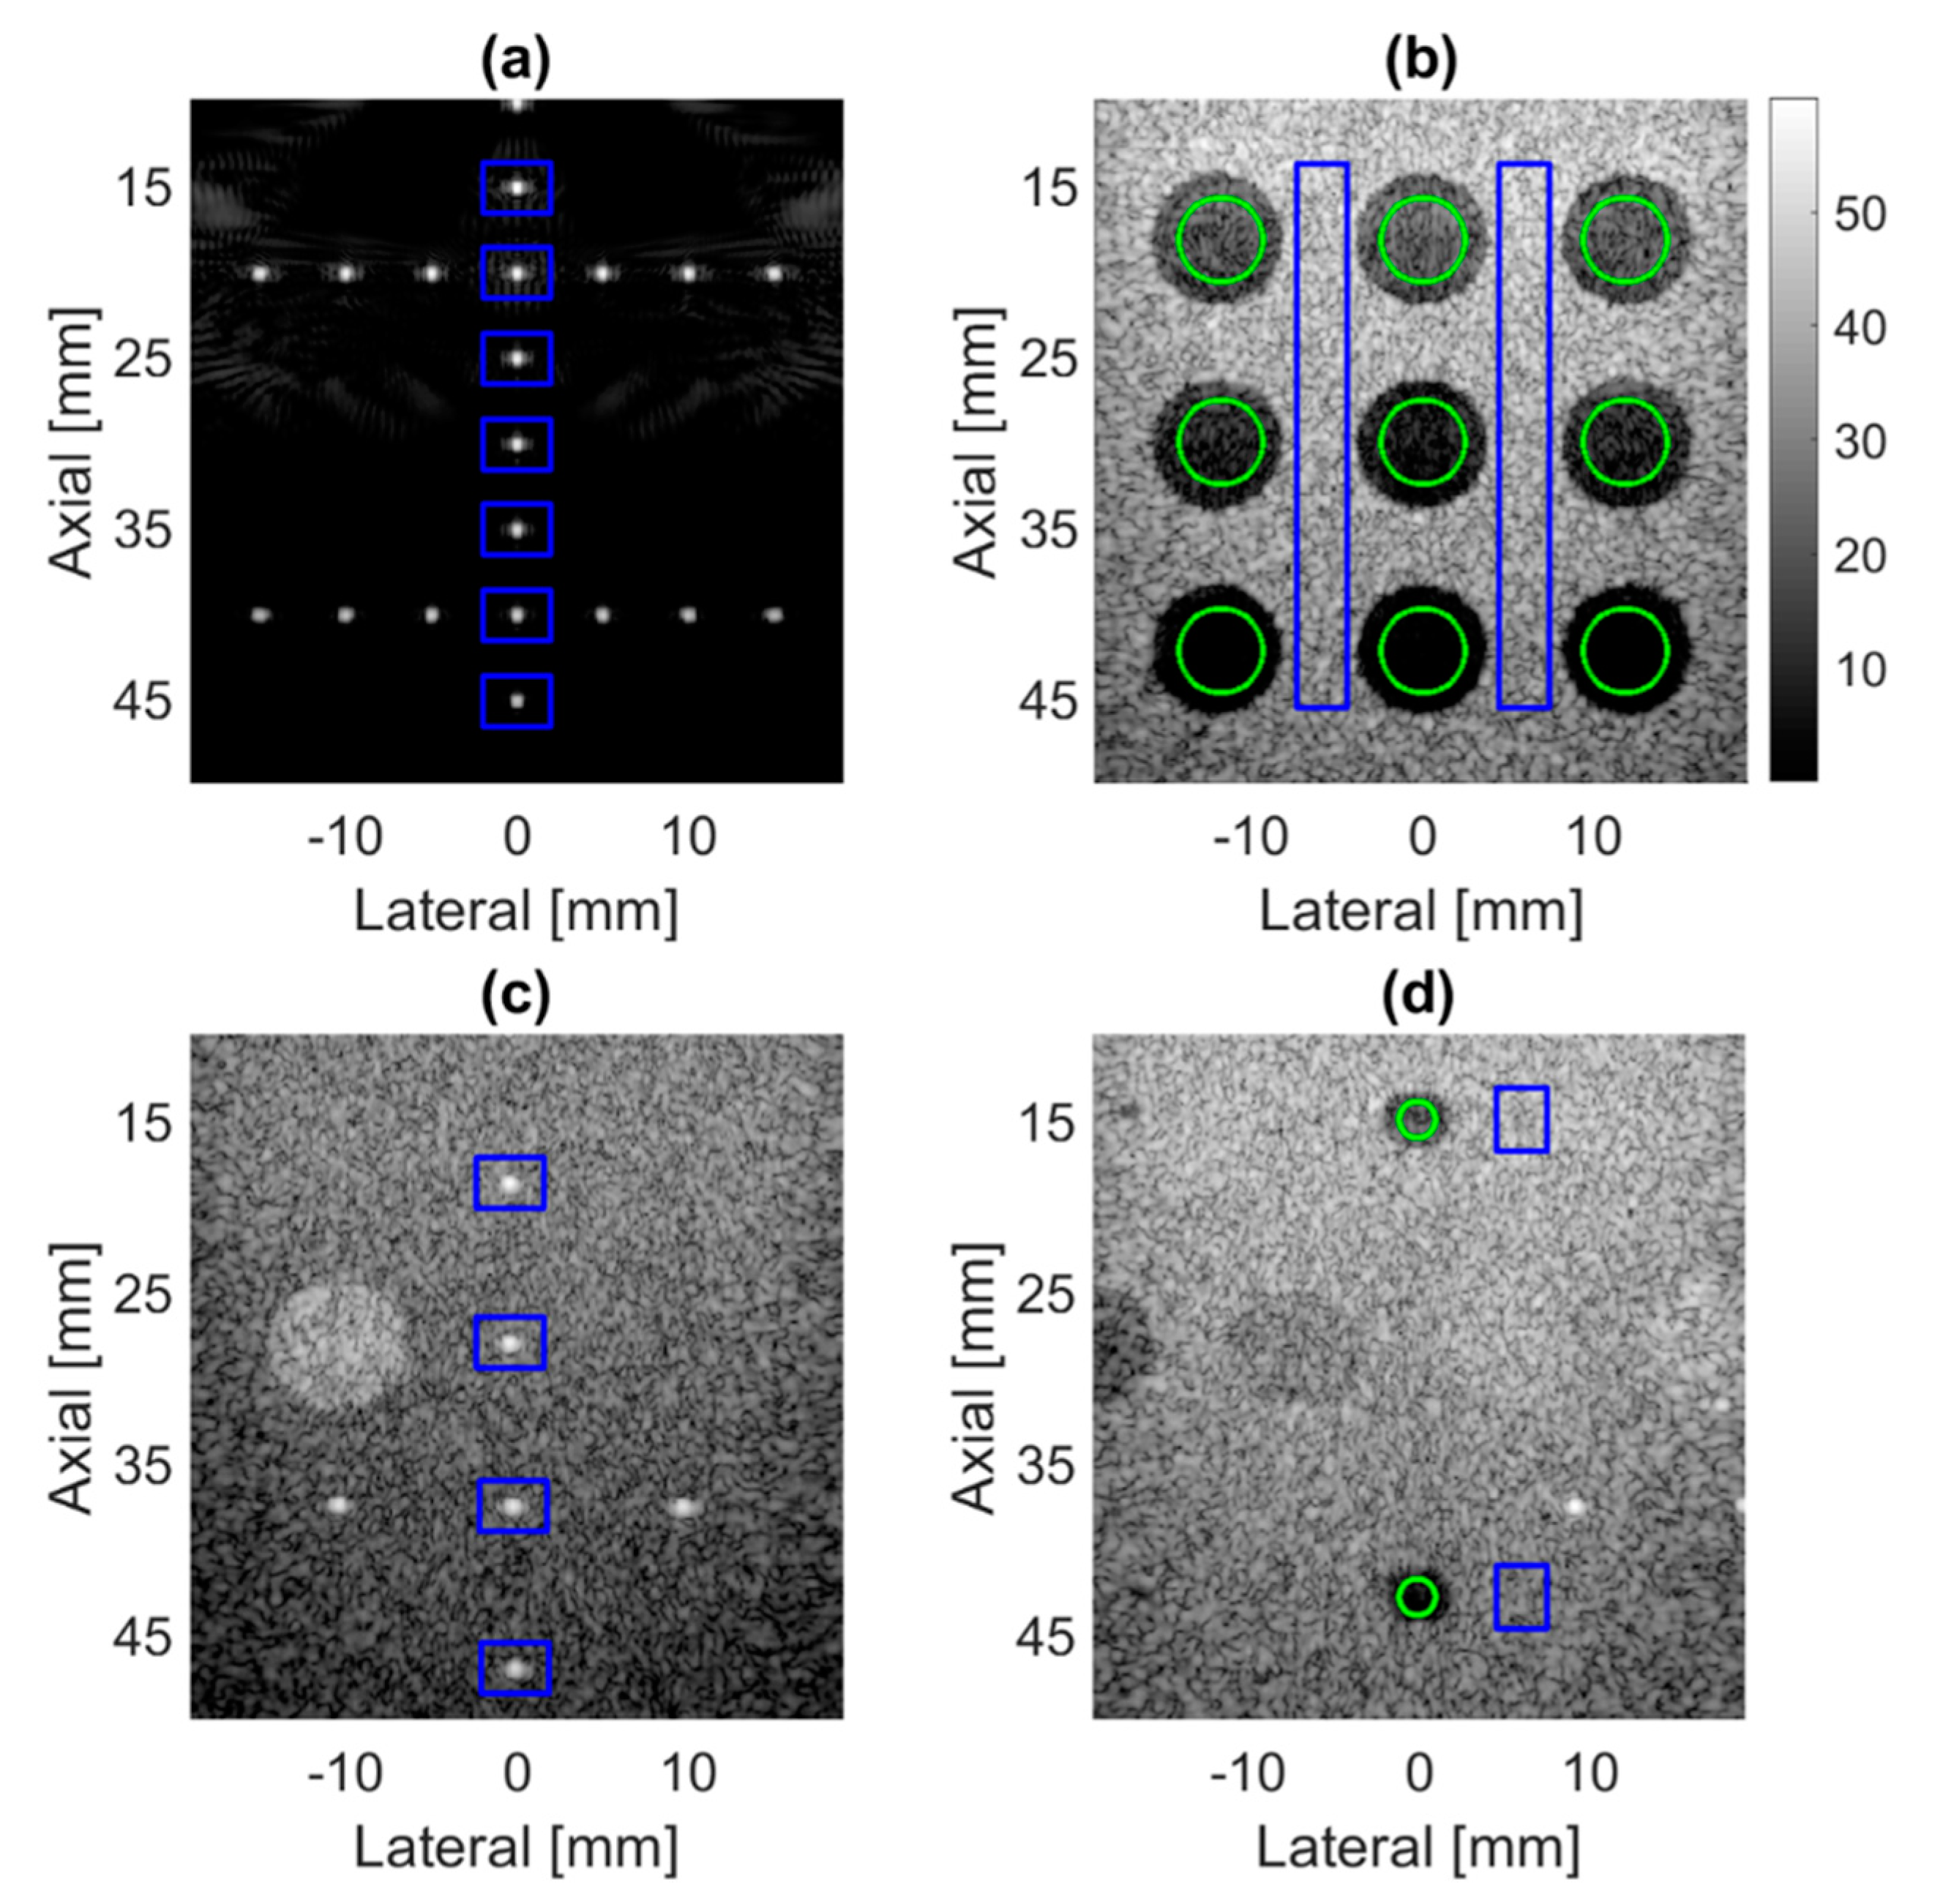
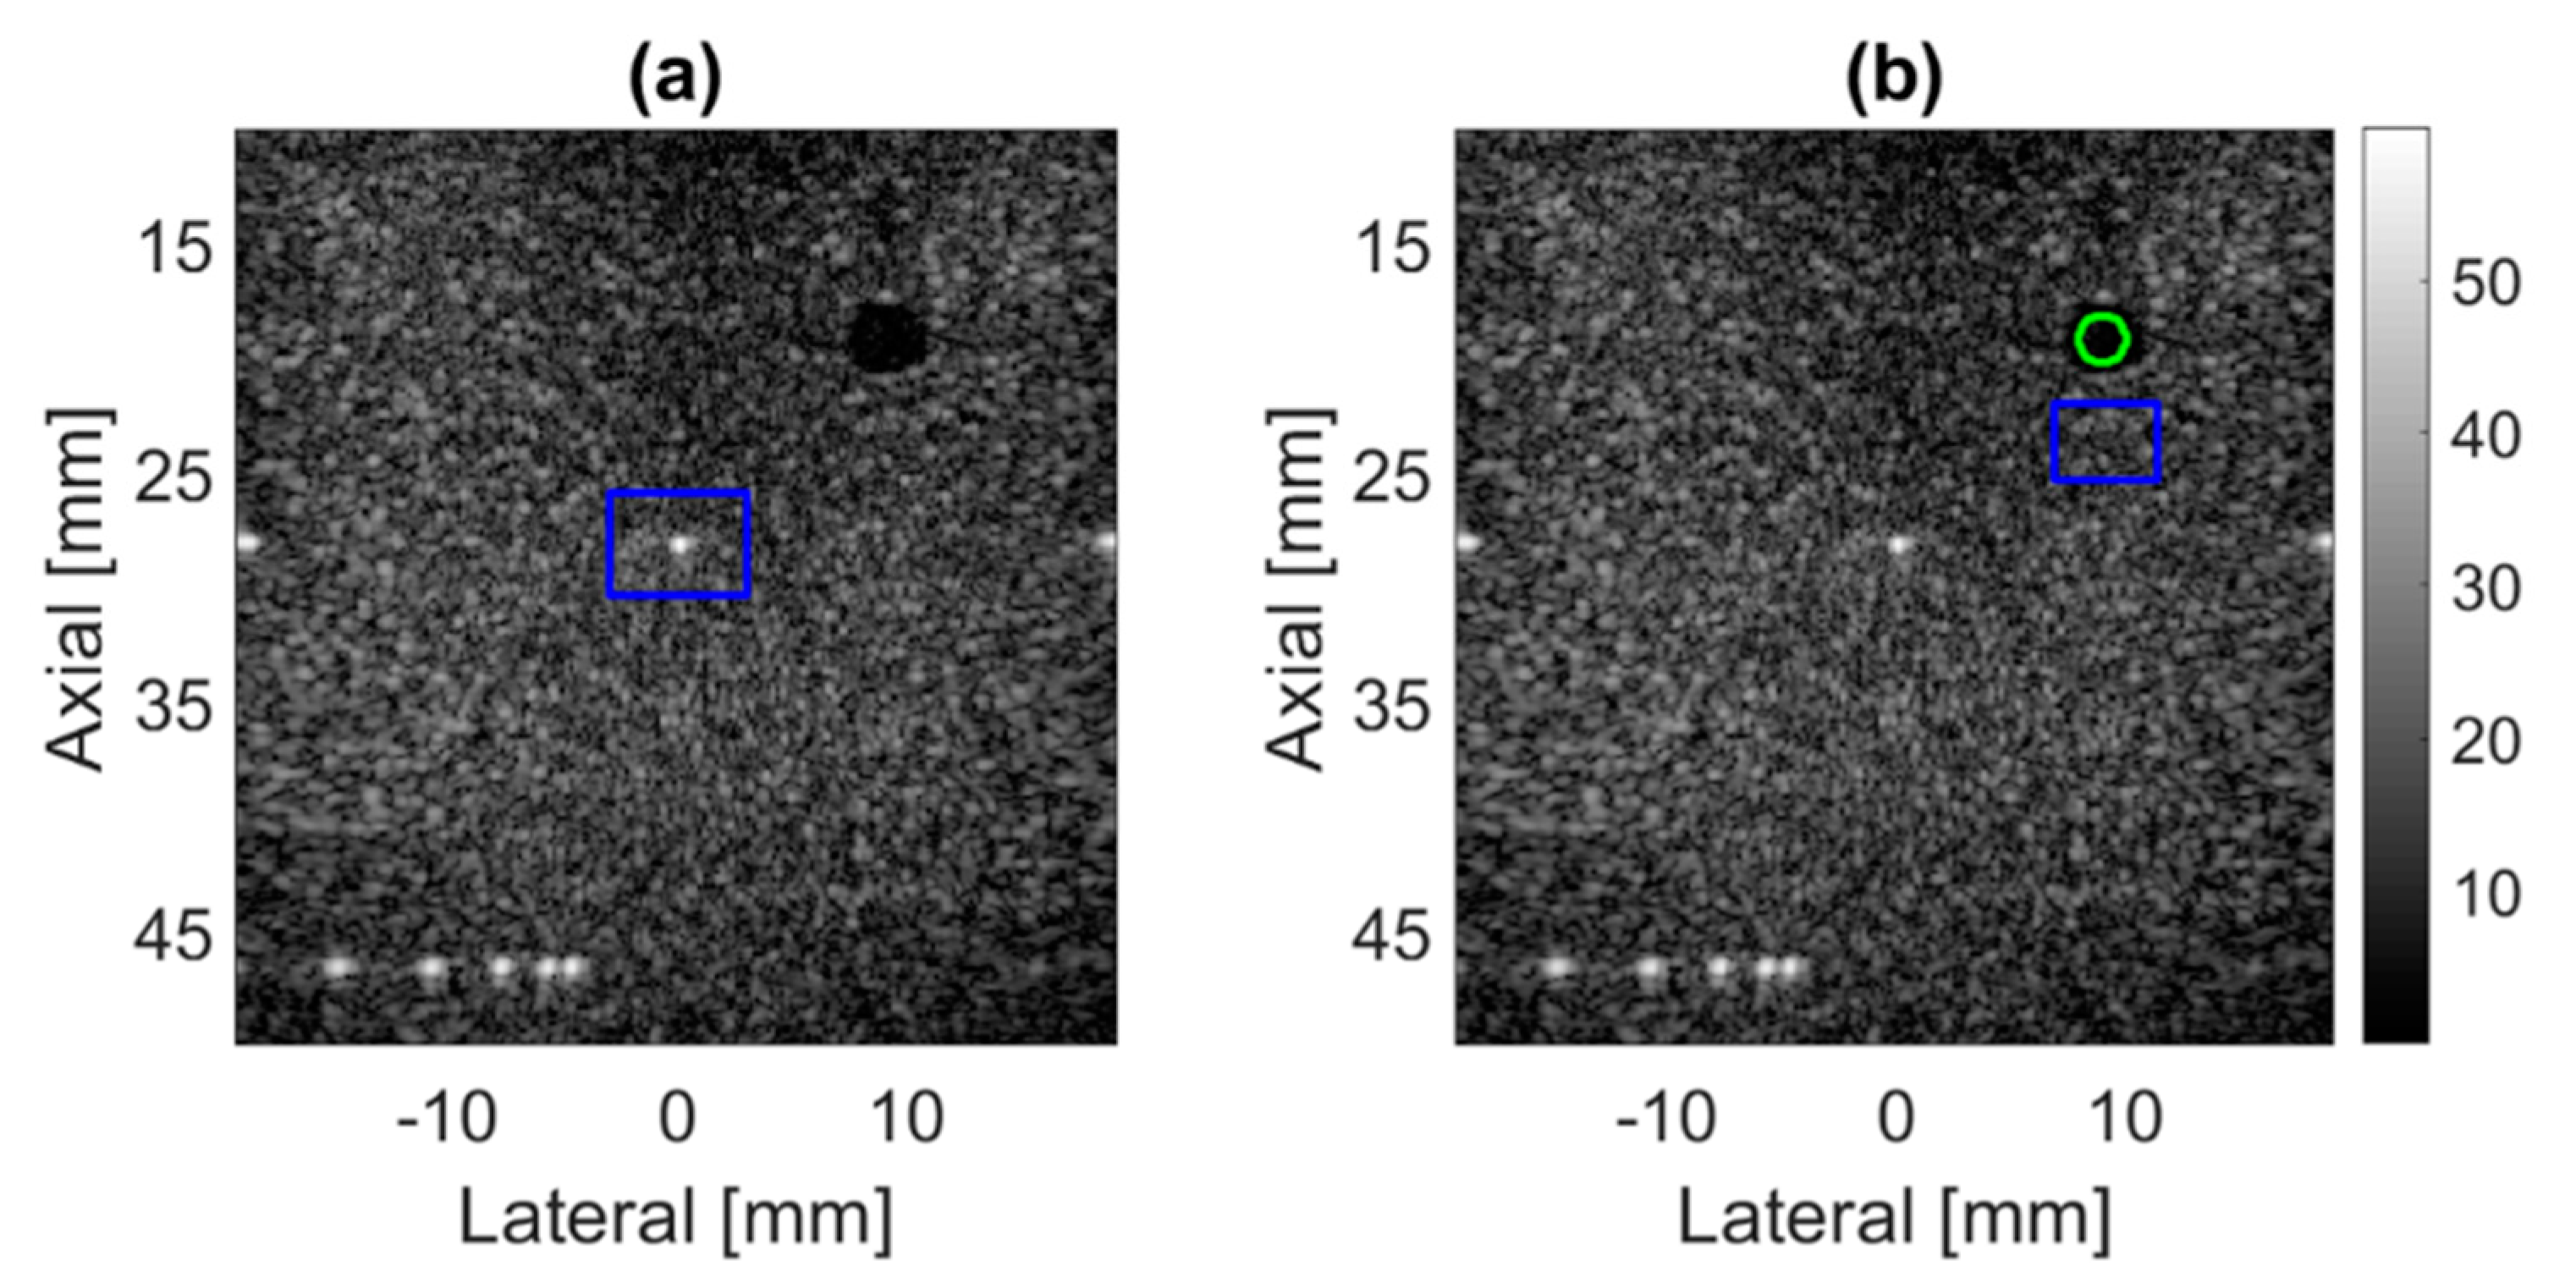
The imaging parameters of PICMUS dataset are listed in Table 1. The −6-dB LW of the simulation and experimental phantoms is calculated from the point targets in blue rectangular ROIs of Figure 2a,c. The CR is calculated based on the anechoic cysts in green circular ROIs and background area in blue rectangular ROIs of Figure 2b,d using Equation (10) where μbackground and μcyst represents the mean pixel values before log compression in the background area and in the cyst area, respectively. Note that the Cbeam with the minimal −6-dB LW and the maximal CR will be determined for comparison to the estimated Copt in the proposed method. The imaging parameters of Prodigy dataset are also provided in Table 2. The average −6-dB LW of the experimental phantom in the Prodigy dataset is calculated from the point target in blue rectangular ROI of Figure 3a, and the CR is calculated from the cyst area in green circular ROI and background area in blue rectangular ROI of Figure 3b.
The Cbeam used for calculating image quality and DCF value ranges from 1480 m/s to 1600 m/s for the PICMUS data and from 1370 m/s to 1490 m/s for Prodigy data. The increment of Cbeam is 10 m/s. It should be noted that the Cbeam is used to calculate the receive delay in both the DAS and DMAS beamforming. On the other hand, since the actual tissue SOS should be unknown during PW transmission, the calculation of transmit delay for PW steering is based on the nominal SOS in Table 1 and Table 2, respectively, for the PICMUS and the Prodigy datasets:
CR = 20 log 10 ( μ b a c k g r o u n d / μ c y s t ) ,

4. Results

4.1. PICMUS Simulation Dataset

Table 3 shows the Cbeam with the best image quality (minimal −6-dB LW and maximal CR) of different receiving aperture sizes represented by the corresponding receiving f-number (i.e., RxFn). Results show that when RxFn is equal to 1.5, the Cbeam with the minimal −6-dB LW appears to deviate from the actual tissue SOS in the simulation (i.e., 1540 m/s) and the Cbeam with the maximal CR matches the actual tissue SOS for all RxFn. Therefore, it is shown that the image quality metrics better correspond to the actual tissue SOS when the receiving aperture is large enough.
Figure 4 shows the effect of different receiving aperture sizes on estimation of tissue SOS when the p value is set to 2 under four different channel SNR. For each channel SNR, there are 10 independent realizations of random noise to calculate the average and standard deviation of SOS estimation. As expected, results indicate that the estimated SOS of the three DMAS methods will become more accurate and robust when the noise level decreases. In fact, for any channel SNR larger than 0 dB, all DMAS methods can provide the estimated Copt that accurately matches the actual tissue SOS of 1540 m/s in the PICMUS simulation data. Moreover, it is also shown that a larger receiving aperture (i.e., a smaller RxFn) will facilitate the estimation of tissue SOS. For example, when the channel SNR is −15 dB, the SOS estimation is 1544 ± 4.9, 1543 ± 4.6 and 1541 ± 3 m/s, respectively, for 2D-DMAS, Rx-DMAS and Tx-DMAS beamforming with the RxFn of 1.25. The SOS estimation improves to 1540 ± 0, 1540 ± 0 and 1540 ± 0, respectively, for 2D-DMAS, Rx-DMAS and Tx-DMAS beamforming when the RxFn decreases to 0.75. In other words, a larger receiving aperture and a lower noise level both help to ensure a reliable DCF value in the proposed method for accurate SOS estimation. It can be also found that Tx-DMAS generally has the lowest deviation and standard deviation compared to other DMAS beamforming methods. Based on the simulation results, we chose using Tx-DMAS method with a RxFn of 0.75 to estimate tissue SOS for subsequent PICMUS experimental data and Prodigy experimental data.
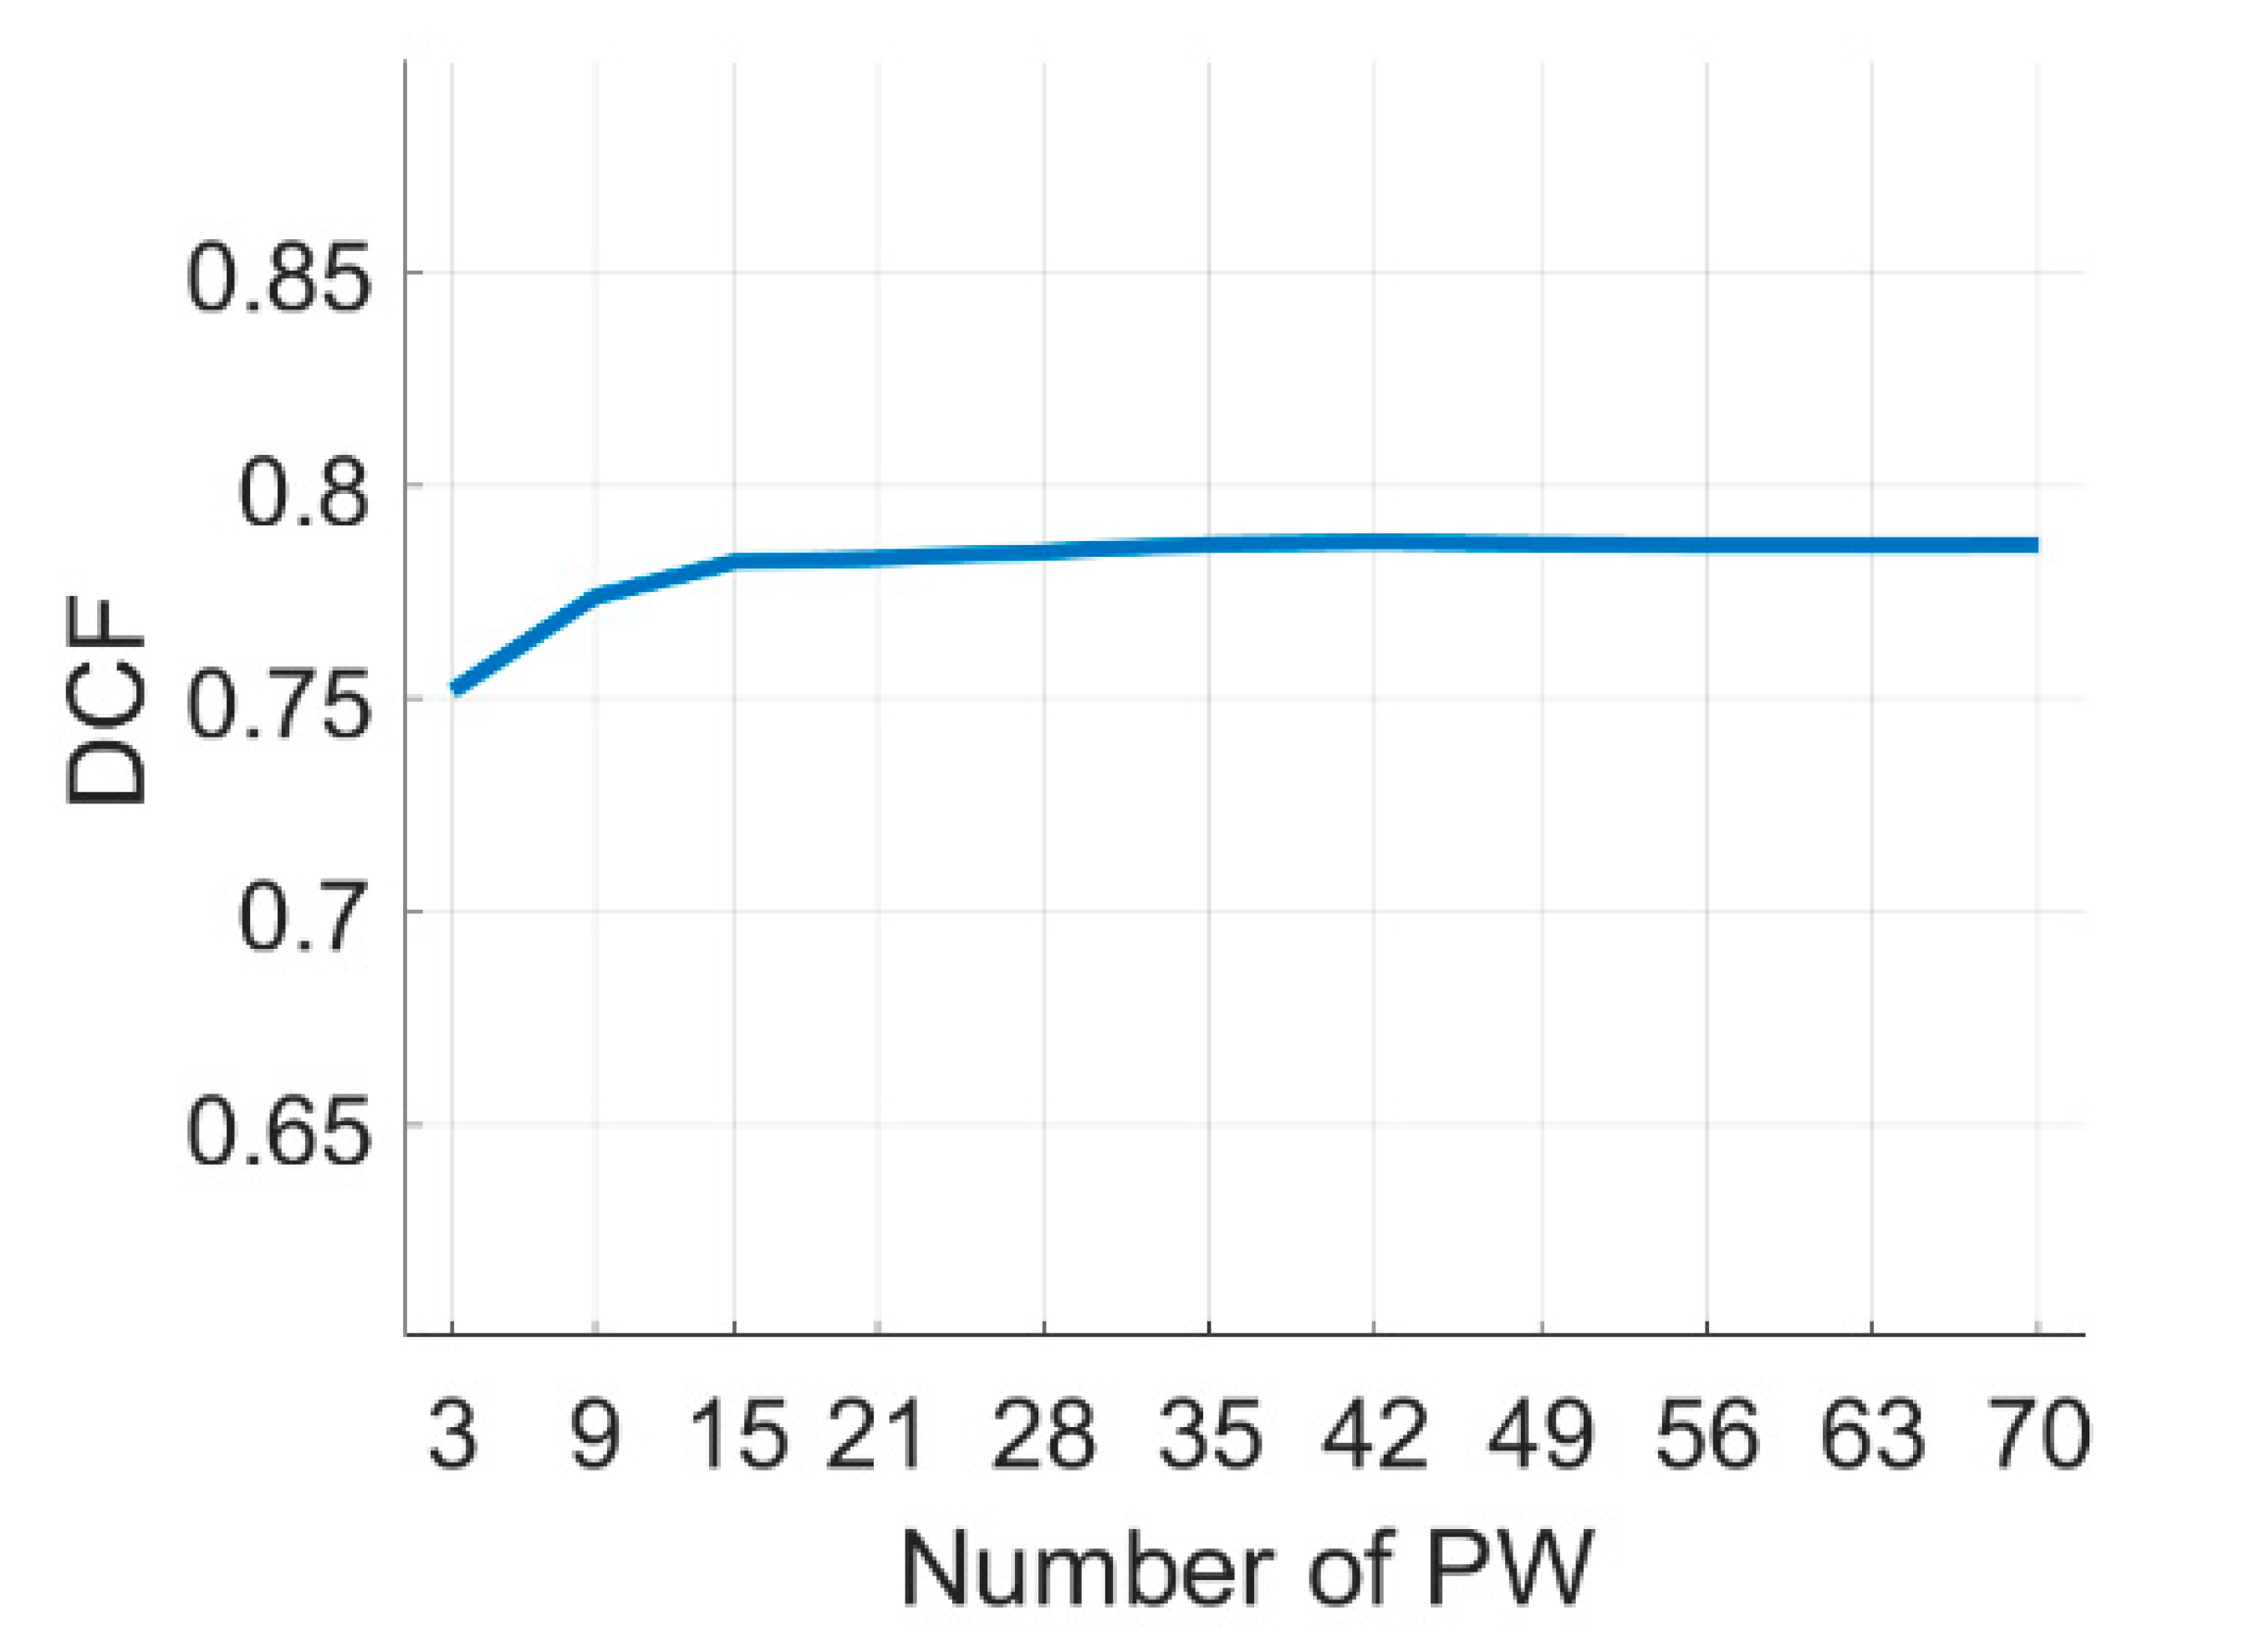
The number of PW for estimating the Copt in Figure 4 is 21. Figure 5 shows the effect of the number of PW on the DCF value when the beamforming method is Tx-DMAS and the p value is equal to 2. The results indicate that, when the number of PW is above 21, the DCF value tends to be stable. In order to reduce the computational complexity, we choose the number of PW equal to 21 for estimating the Copt.
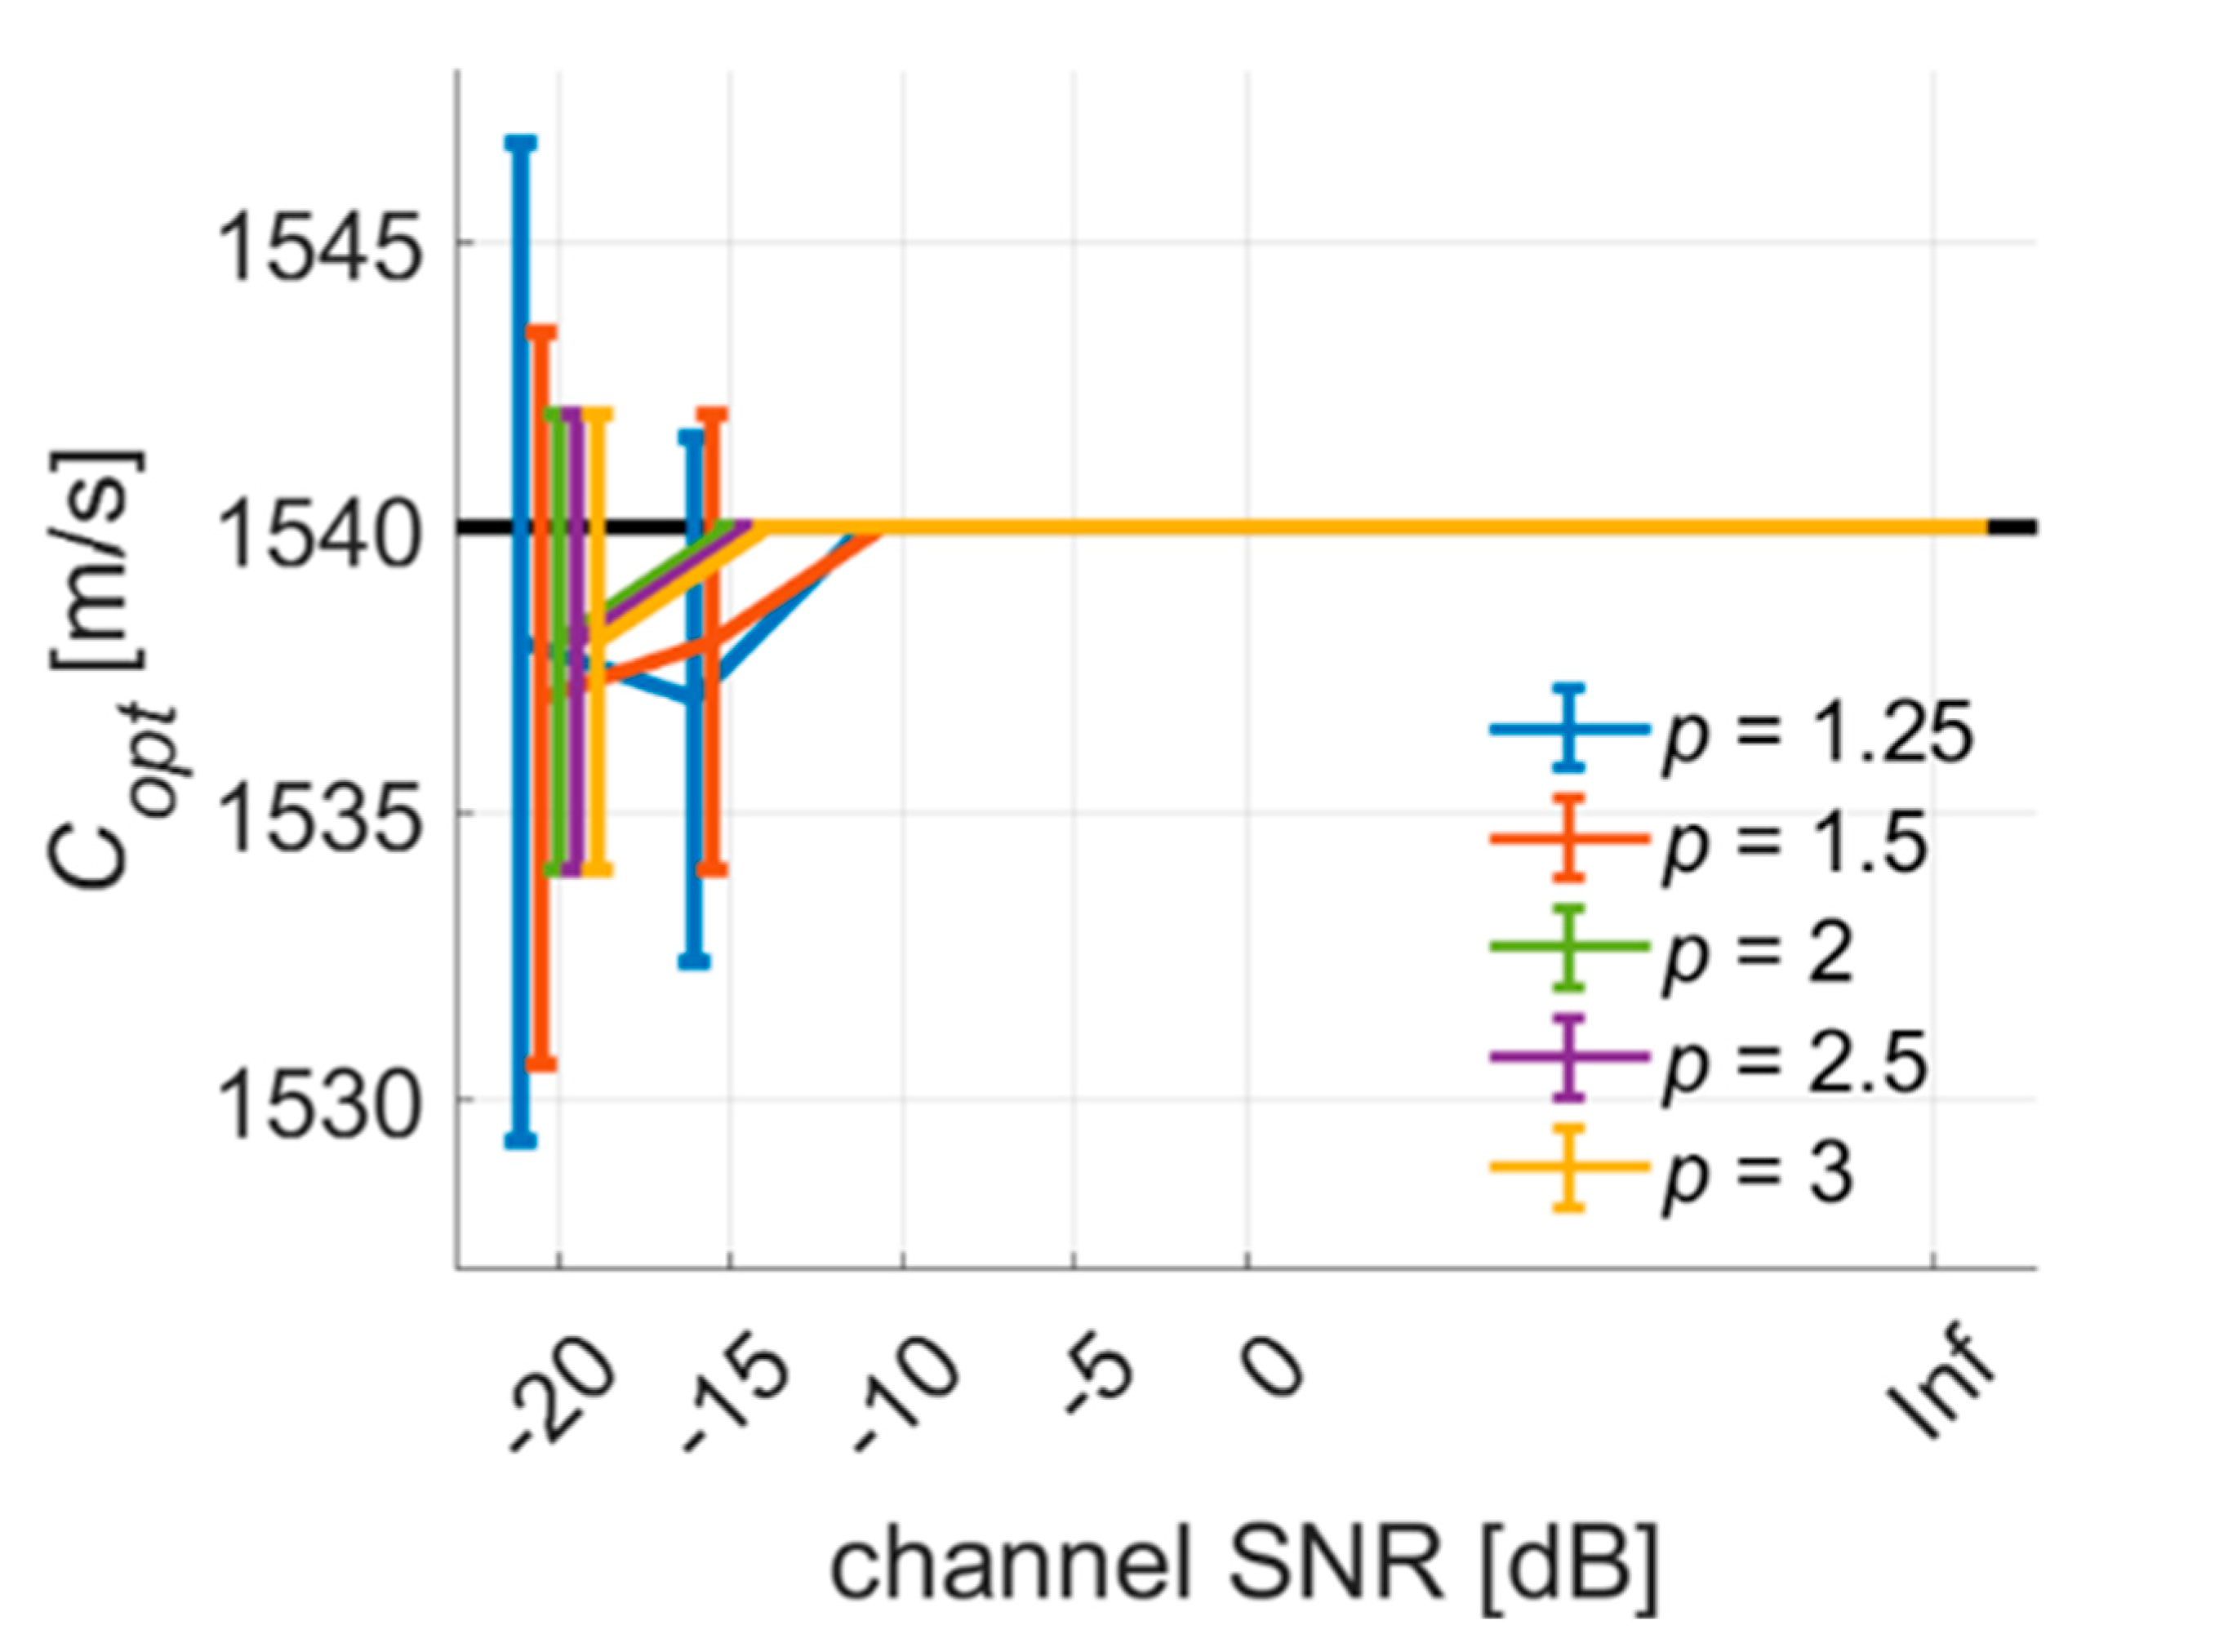
Figure 6 further shows that the effect of p values on SOS estimation in Tx-DMAS beamforming method. It was found that the three curves for p value of 2, 2.5, and 3 overlap and they provide lower deviation and standard deviation of SOS estimation compared to the case for p value of 1.25 and 1.5. In other words, when the p value has been larger than 2, it appears that further increasing the p value to emphasize the signal coherence for better SOS estimation is marginal in the DCF method. Therefore, in the following experiments, we use the setting of p = 2 to estimate the tissue SOS.

4.2. PICMUS Experimental Dataset

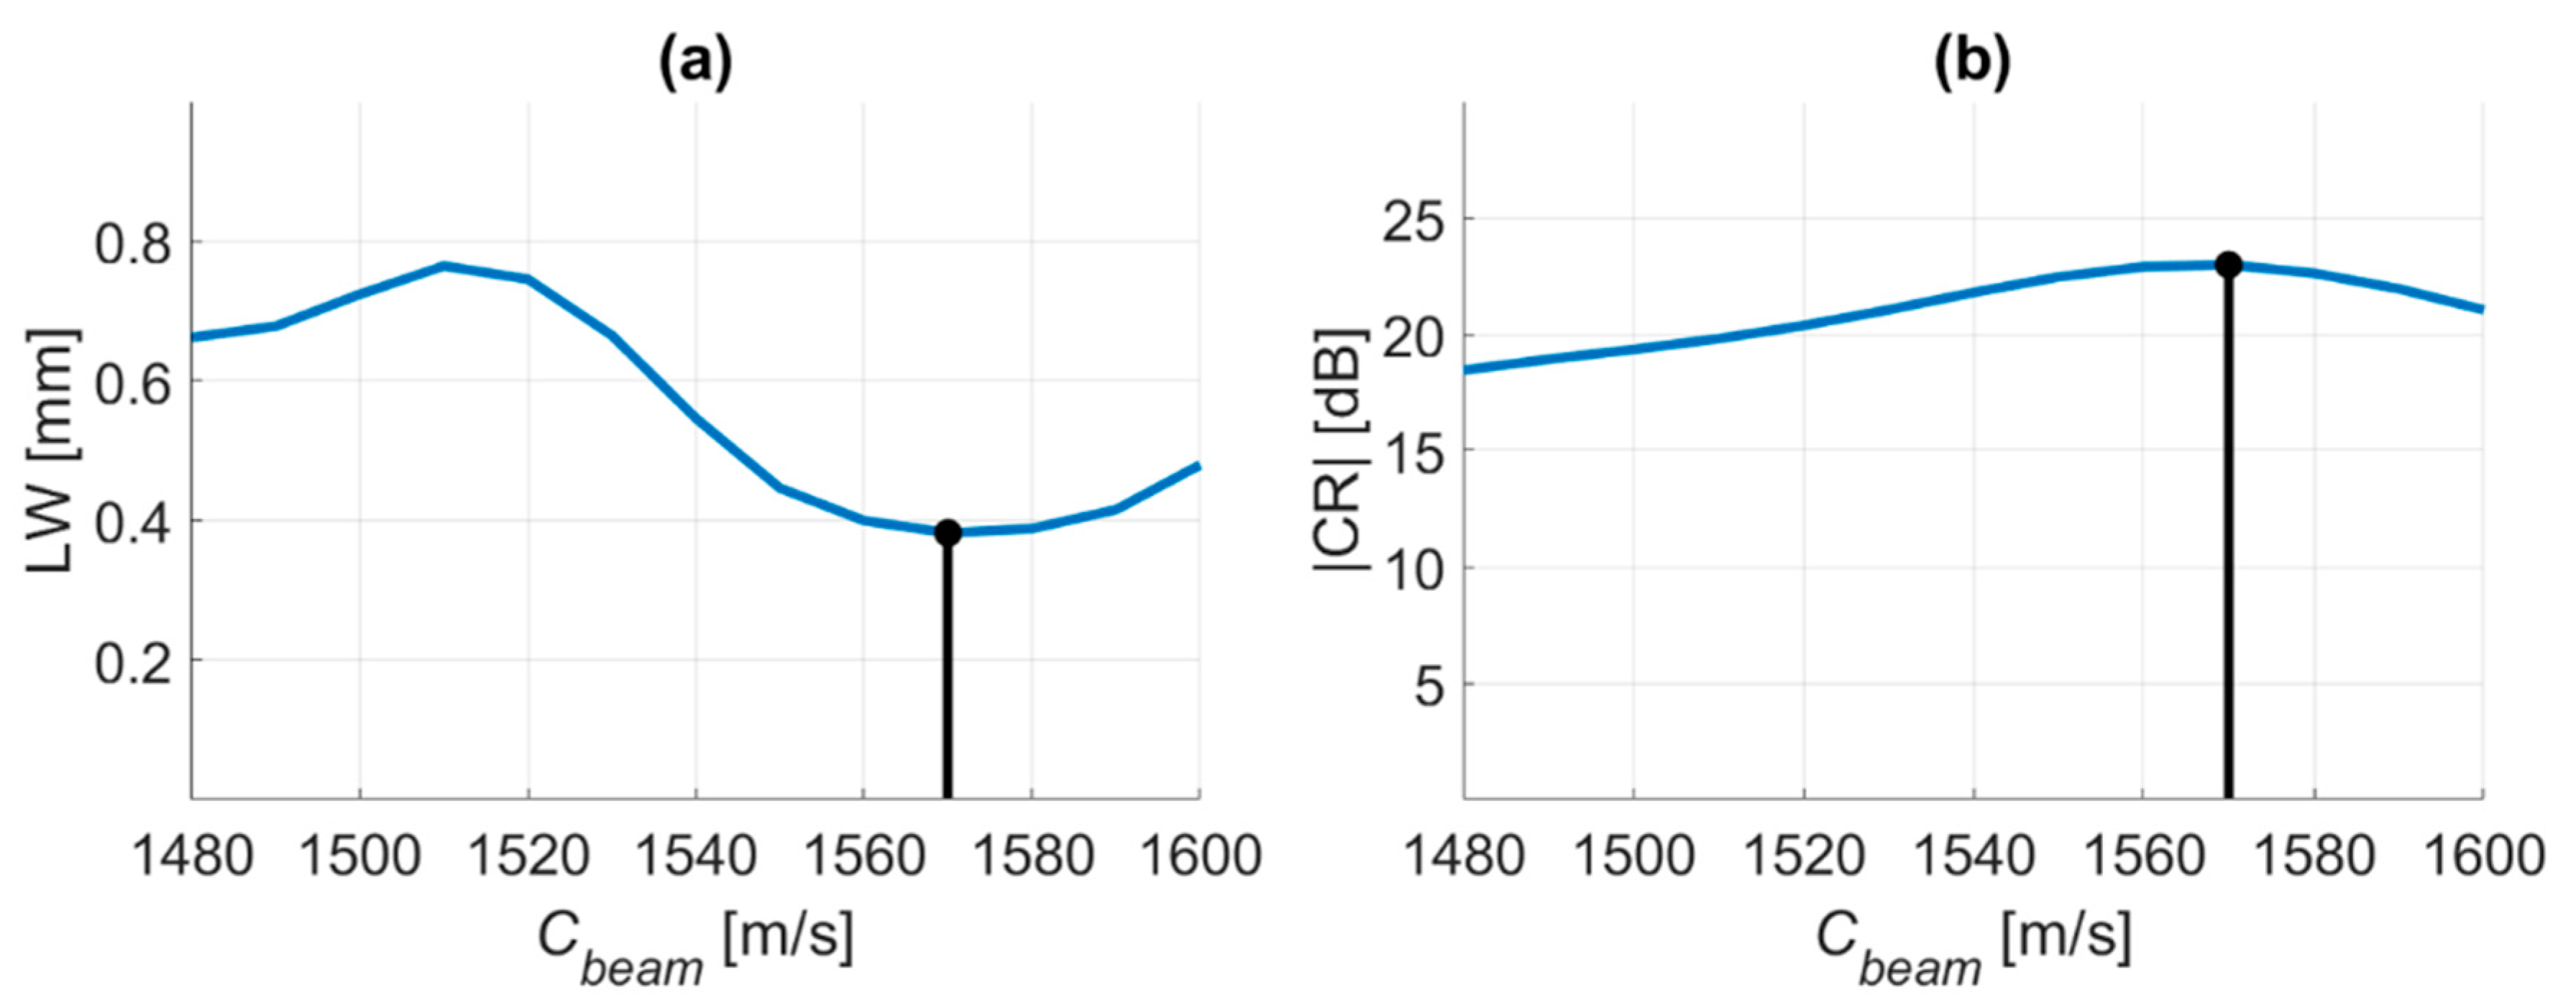
Figure 7 shows the image quality metrics as a function of Cbeam in the PICMUS experimental data. The Cbeam with the minimal −6-dB LW and the maximal CR is 1570 m/s. Please note that 1570 m/s is different from the nominal SOS of the experimental phantom provided by PICMUS data.
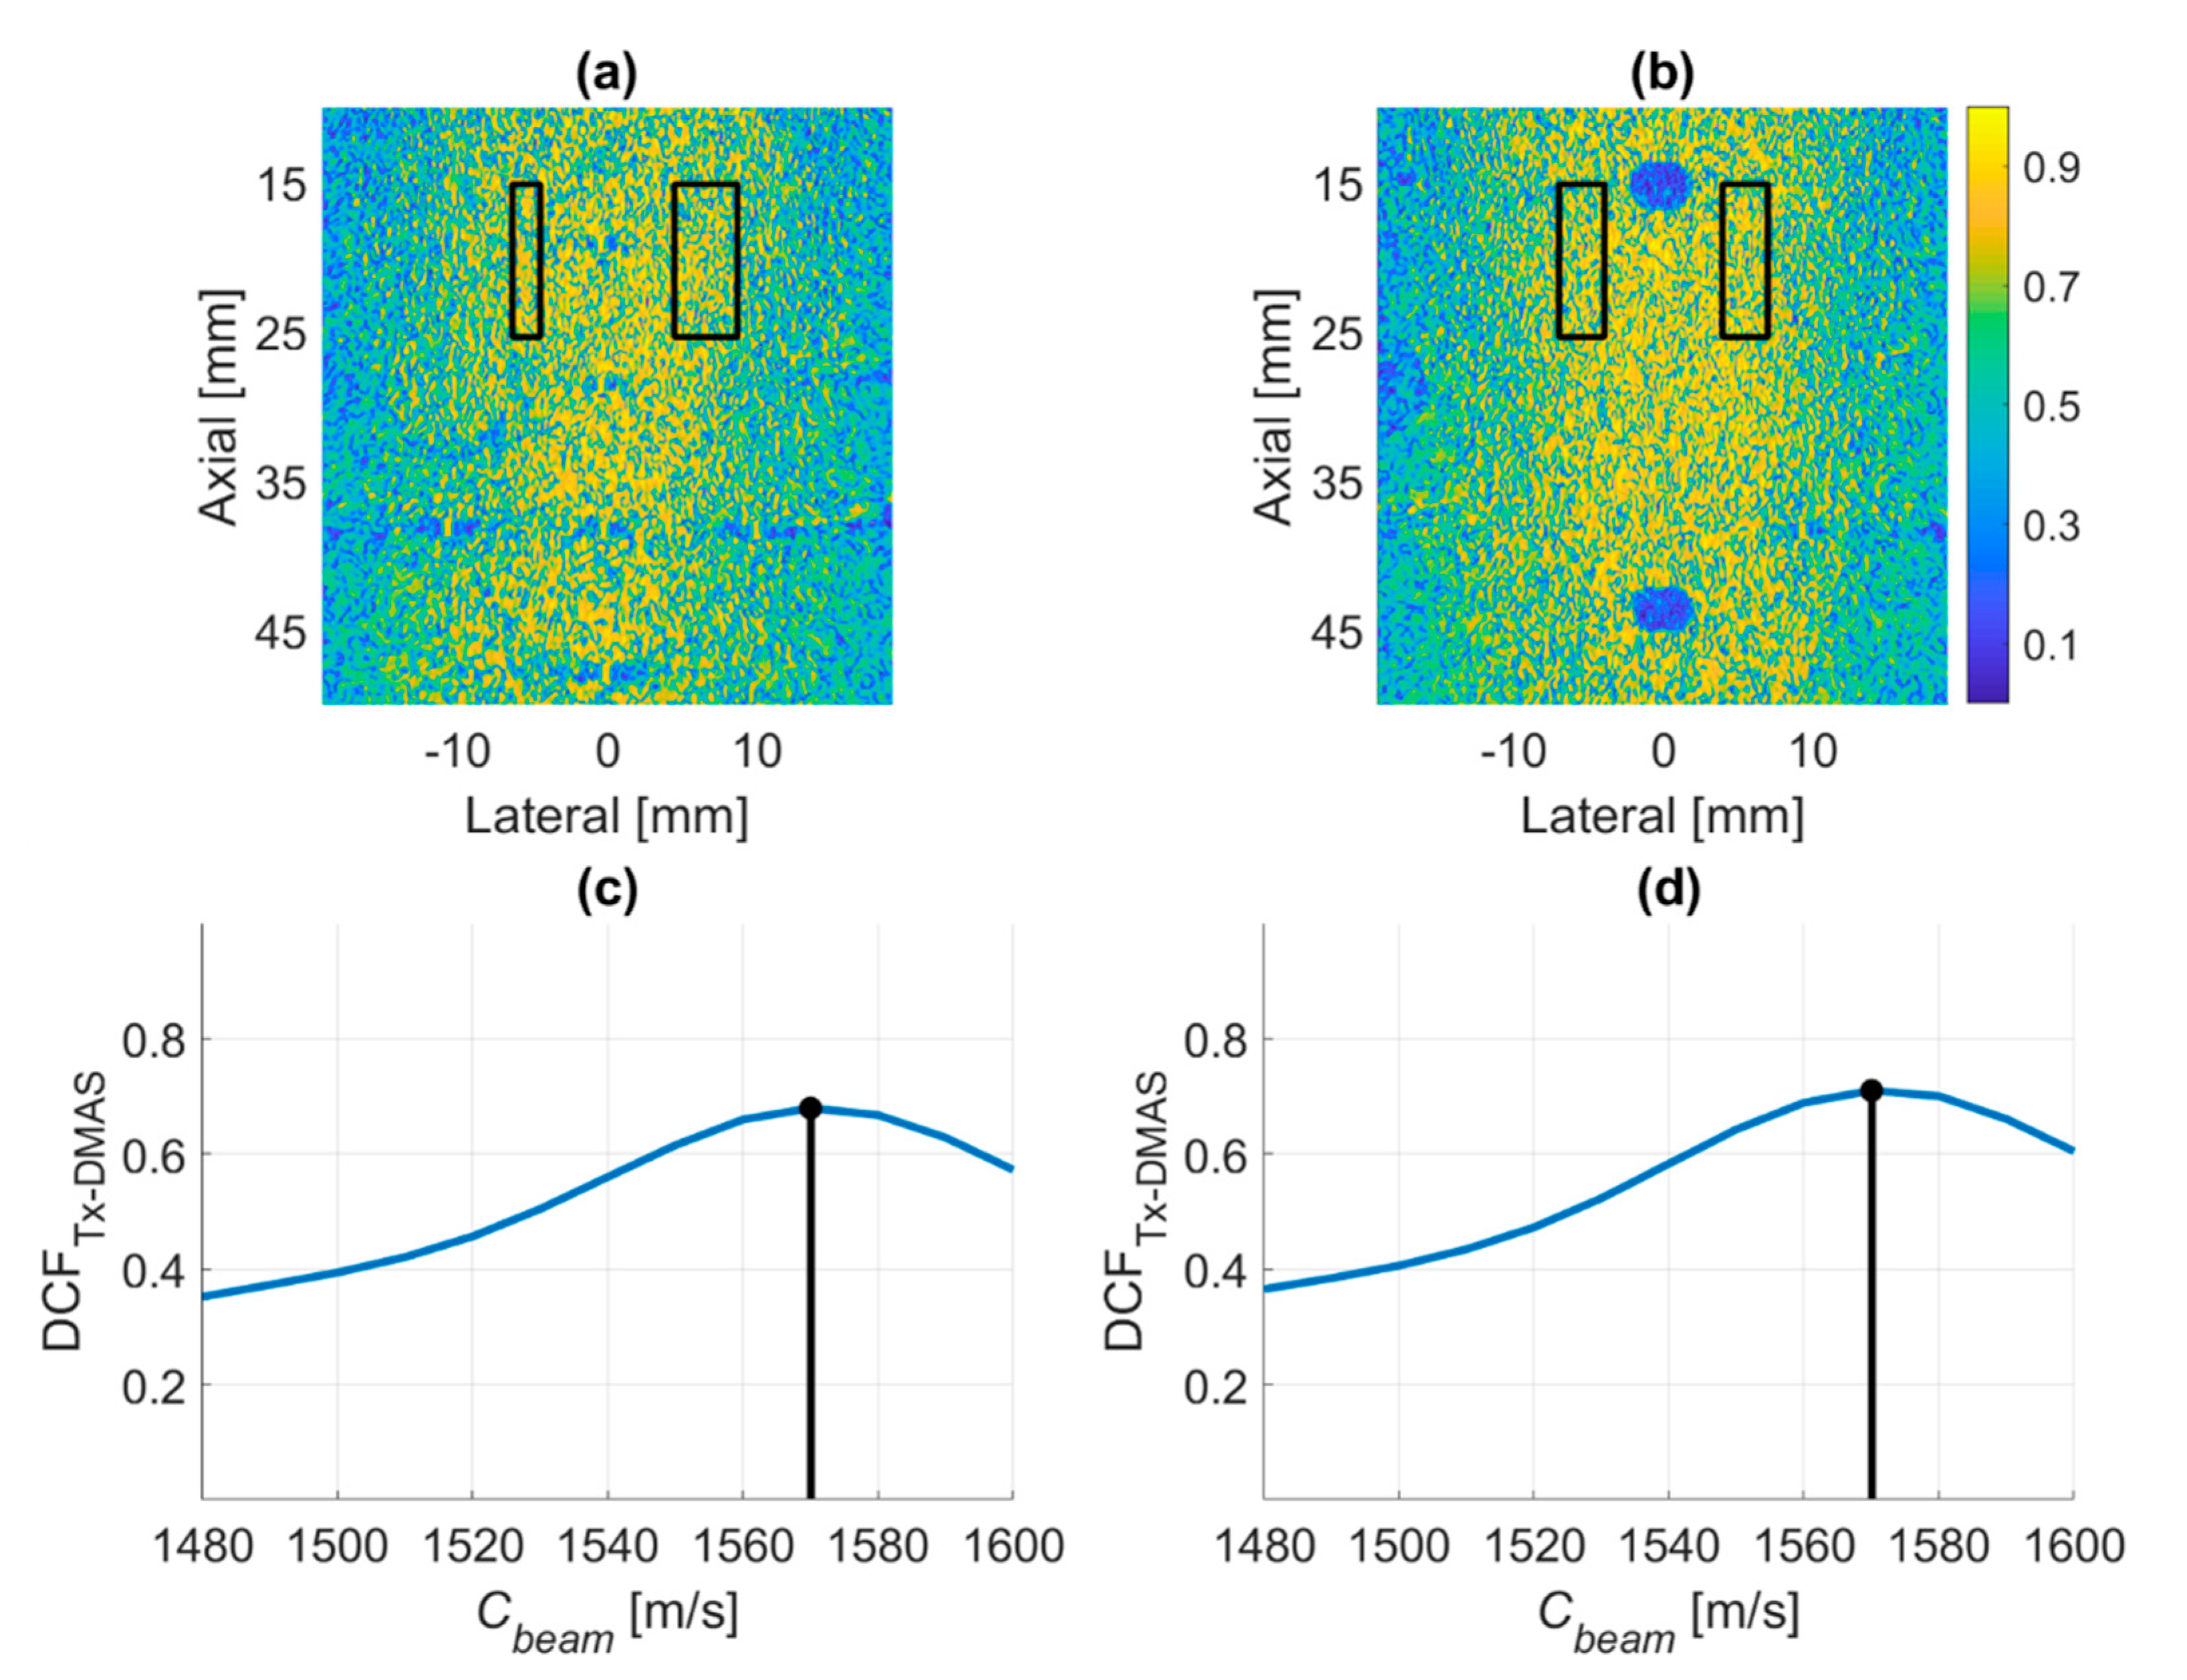
Figure 8a,b demonstrate the DCF map of Tx-DMAS beamforming with Cbeam of 1570 m/s in the PICMUS experimental data, where the black rectangular ROIs are used for estimation of tissue SOS. Figure 8c,d shows the averaged DCF value in Figure 8a,b as a function of Cbeam, respectively. The results indicate that the tissue SOS estimated by the proposed DCF method is 1570 m/s for PICMUS experimental dataset. Note that the estimated SOS agrees with the Cbeam with the maximal image quality, meaning that our DCF method can locate the correct tissue SOS.
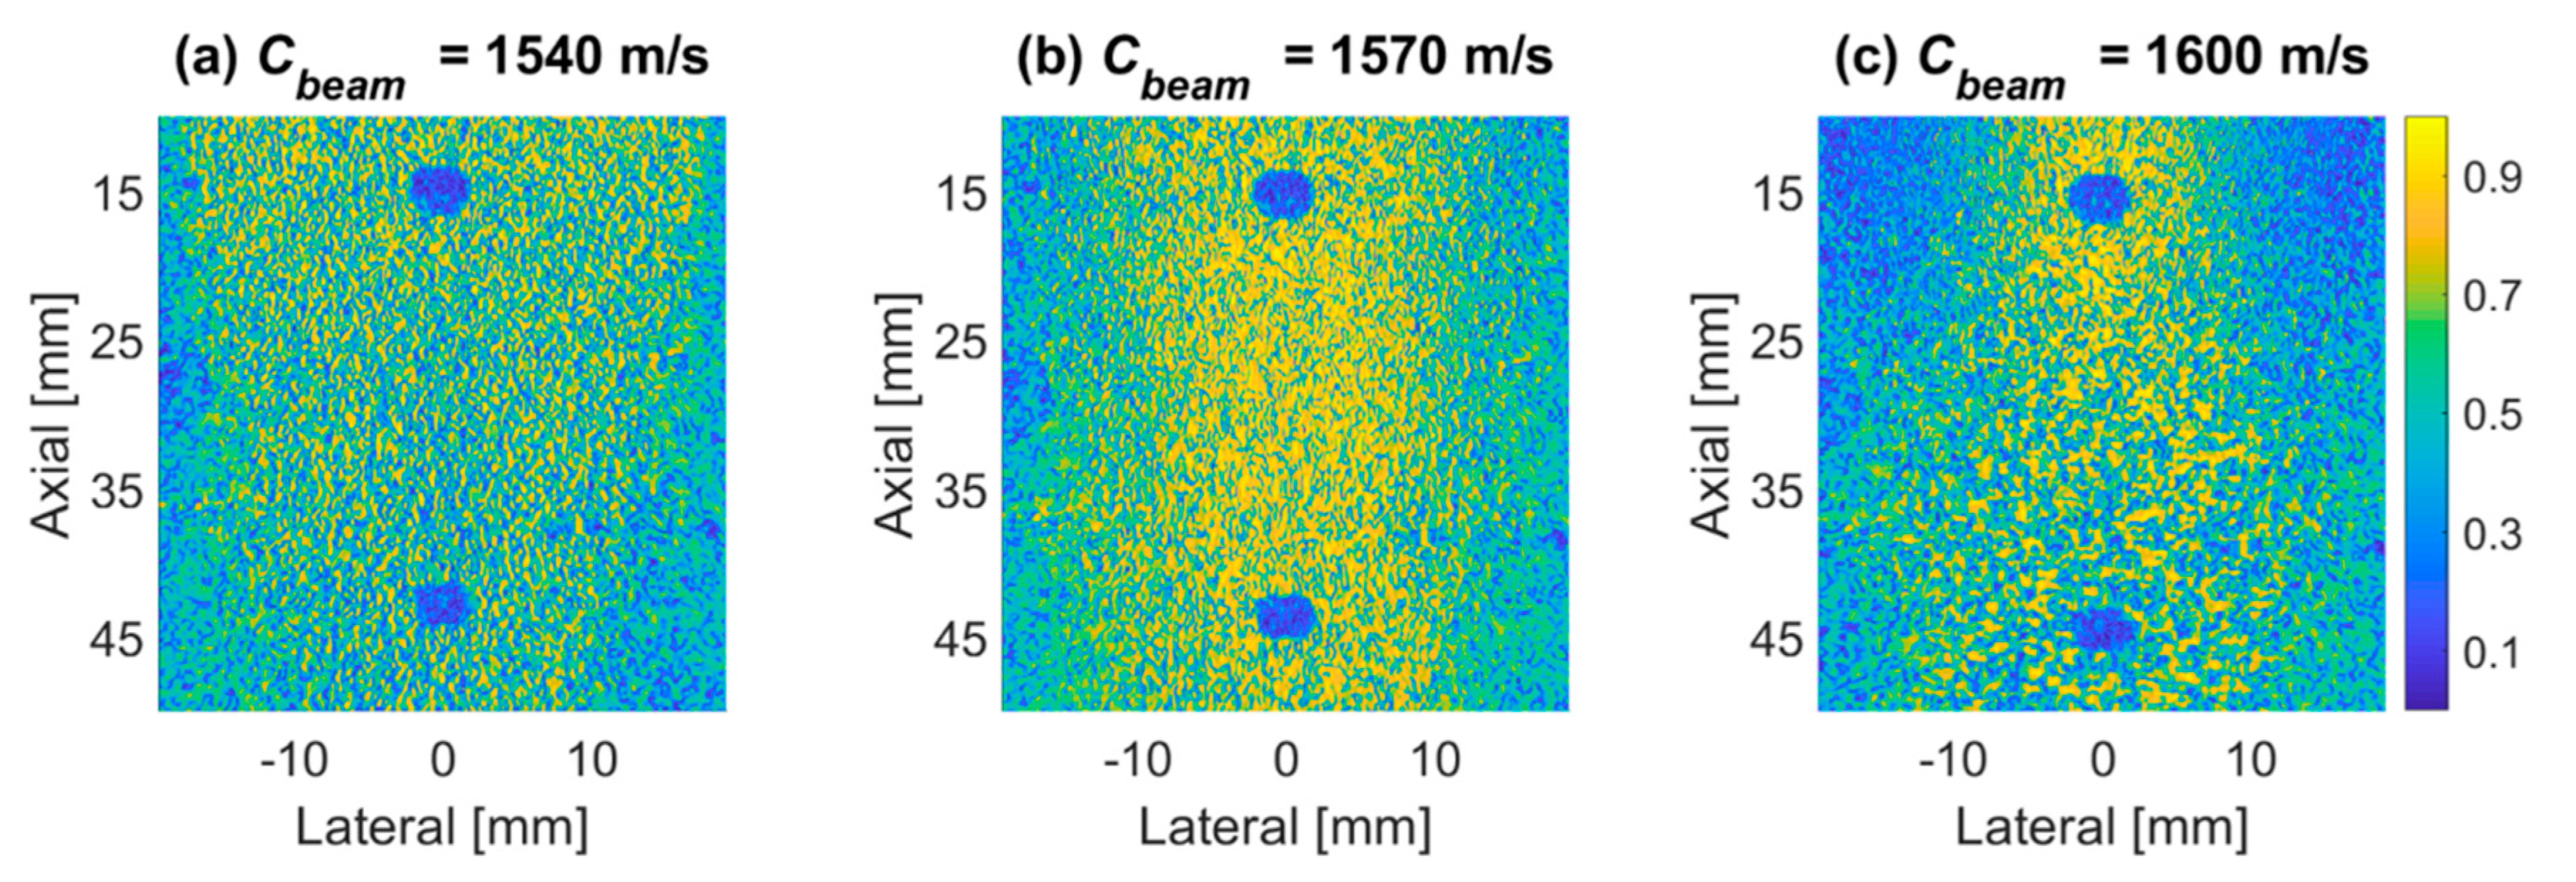
Figure 9 demonstrates the DCF maps of Tx-DMAS beamforming for the FOV in Figure 8b with Cbeam of 1540, 1570 and 1600 m/s. In the proposed method, it is shown that the Cbeam of 1570 m/s leads to the highest signal coherence and thus should correspond to the actual tissue SOS of the PICMUS experimental phantom.

4.3. Prodigy Experimental Dataset

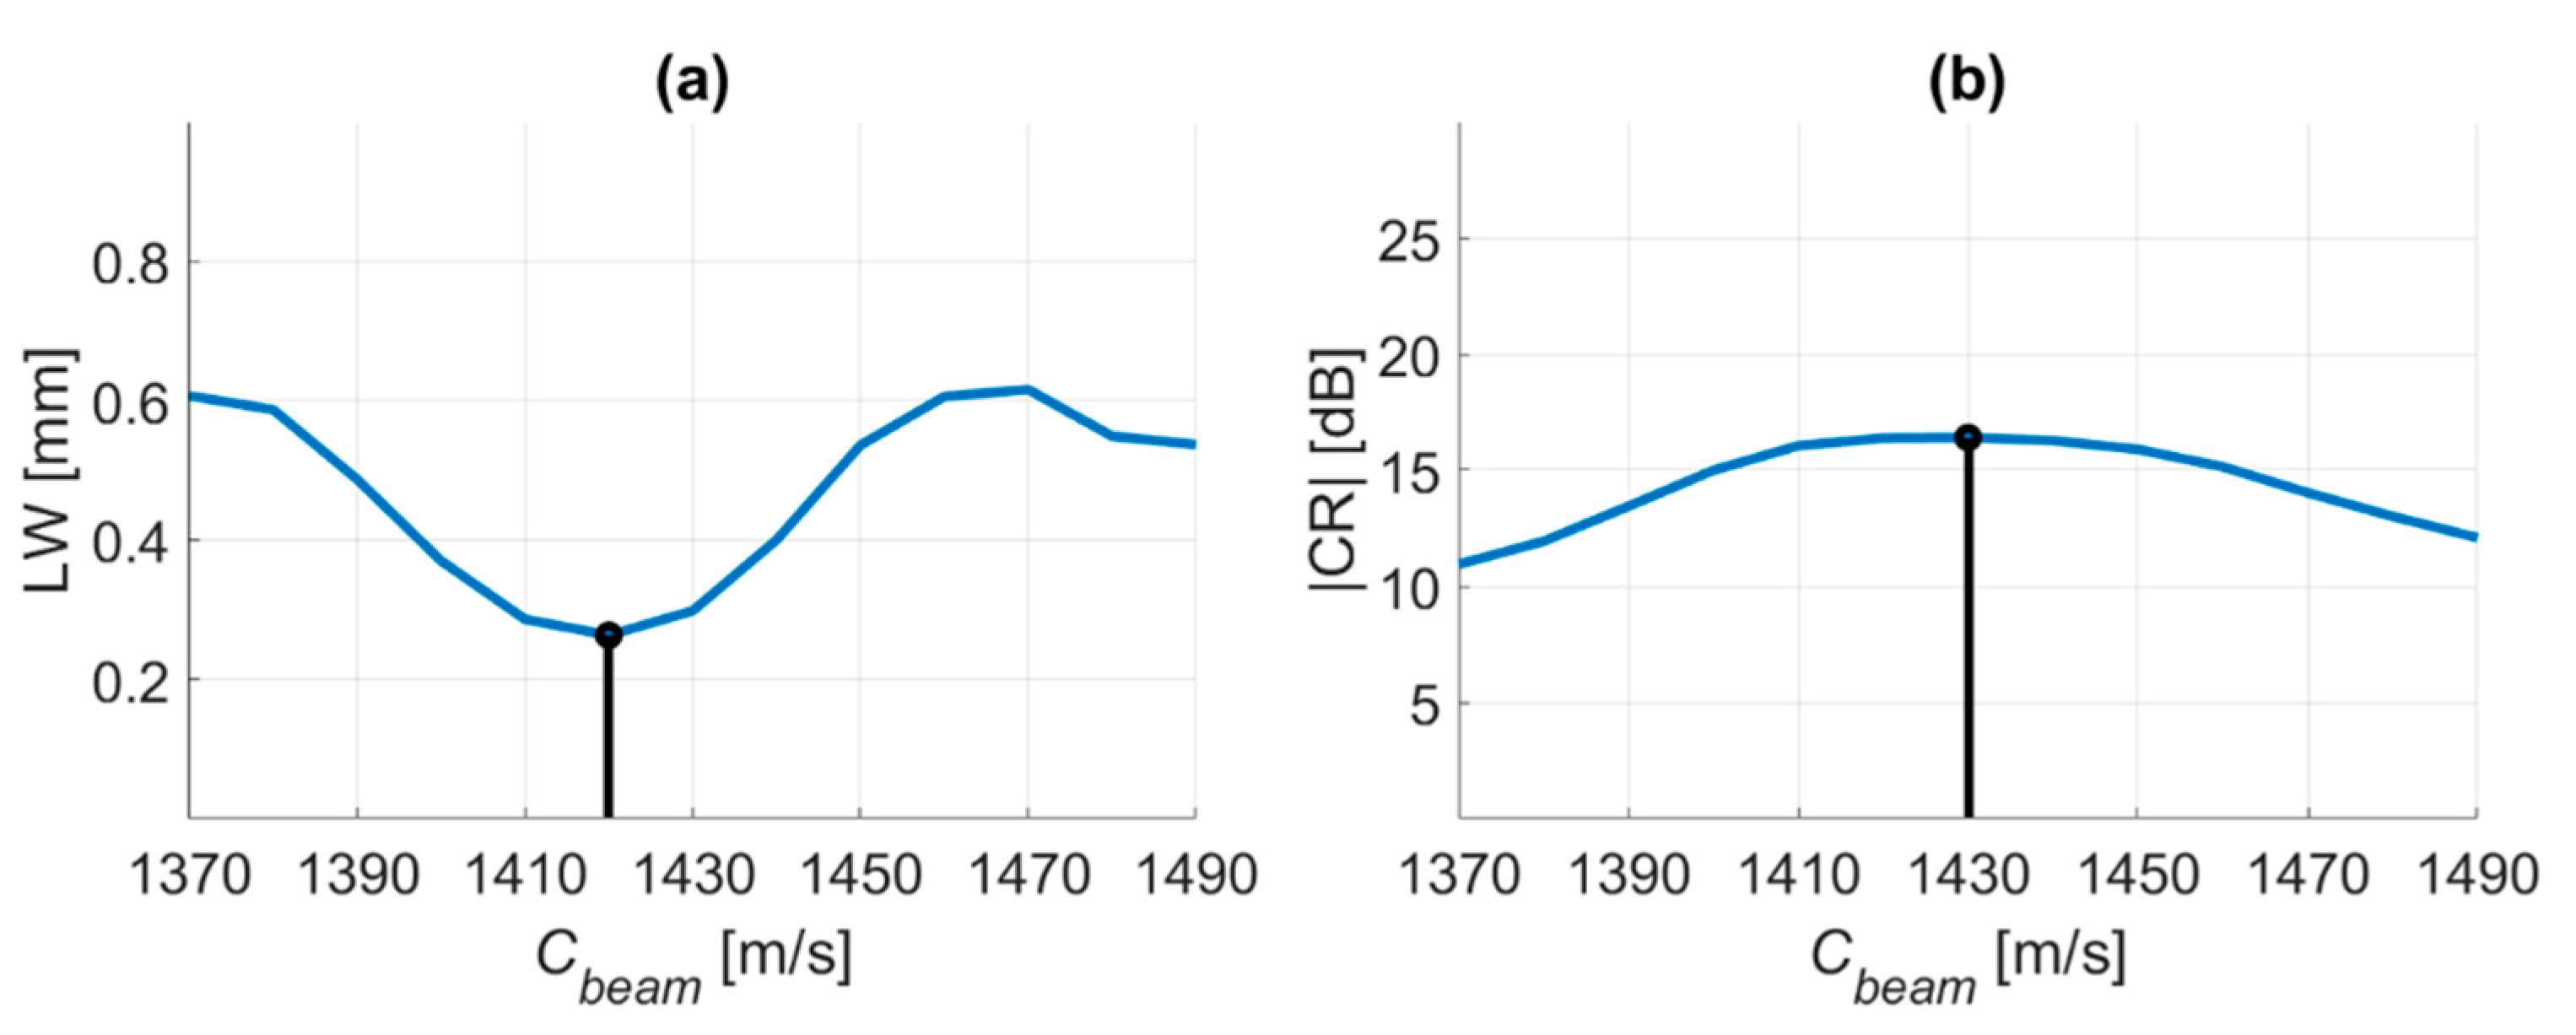
In the aforementioned PICMUS experimental data, our estimated tissue SOS of 1570 m/s does not agree with the nominal SOS of 1540 m/s for the experimental phantom. Since the SOS of any tissue mimicking material has a temperature coefficient, the actual tissue SOS will vary with ambient temperature so that the nominal SOS may not be necessarily the actual SOS at the time of measurement [28]. To validate whether or not the SOS estimated by the proposed DCF method is consistent with the actual SOS of the experimental phantom, another dataset was acquired in our own lab using Prodigy ultrasonic imaging system while the tissue SOS of the phantom has been concurrently measured to be 1427 m/s using pulse-echo method as described in the Method section. Figure 10 shows the minimal −6-dB LW and the maximal CR as a function of Cbeam for the Prodigy dataset. For the Prodigy dataset, the Cbeam with the maximal image quality is respectively 1420 m/s and 1430 m/s from −6-dB LW and CR analyses, which is close to the actual tissue SOS of 1427 m/s within an estimation error of 10 m/s. Note that the estimation error is inevitably quantized by the increment value of Cbeam in Equation (9).
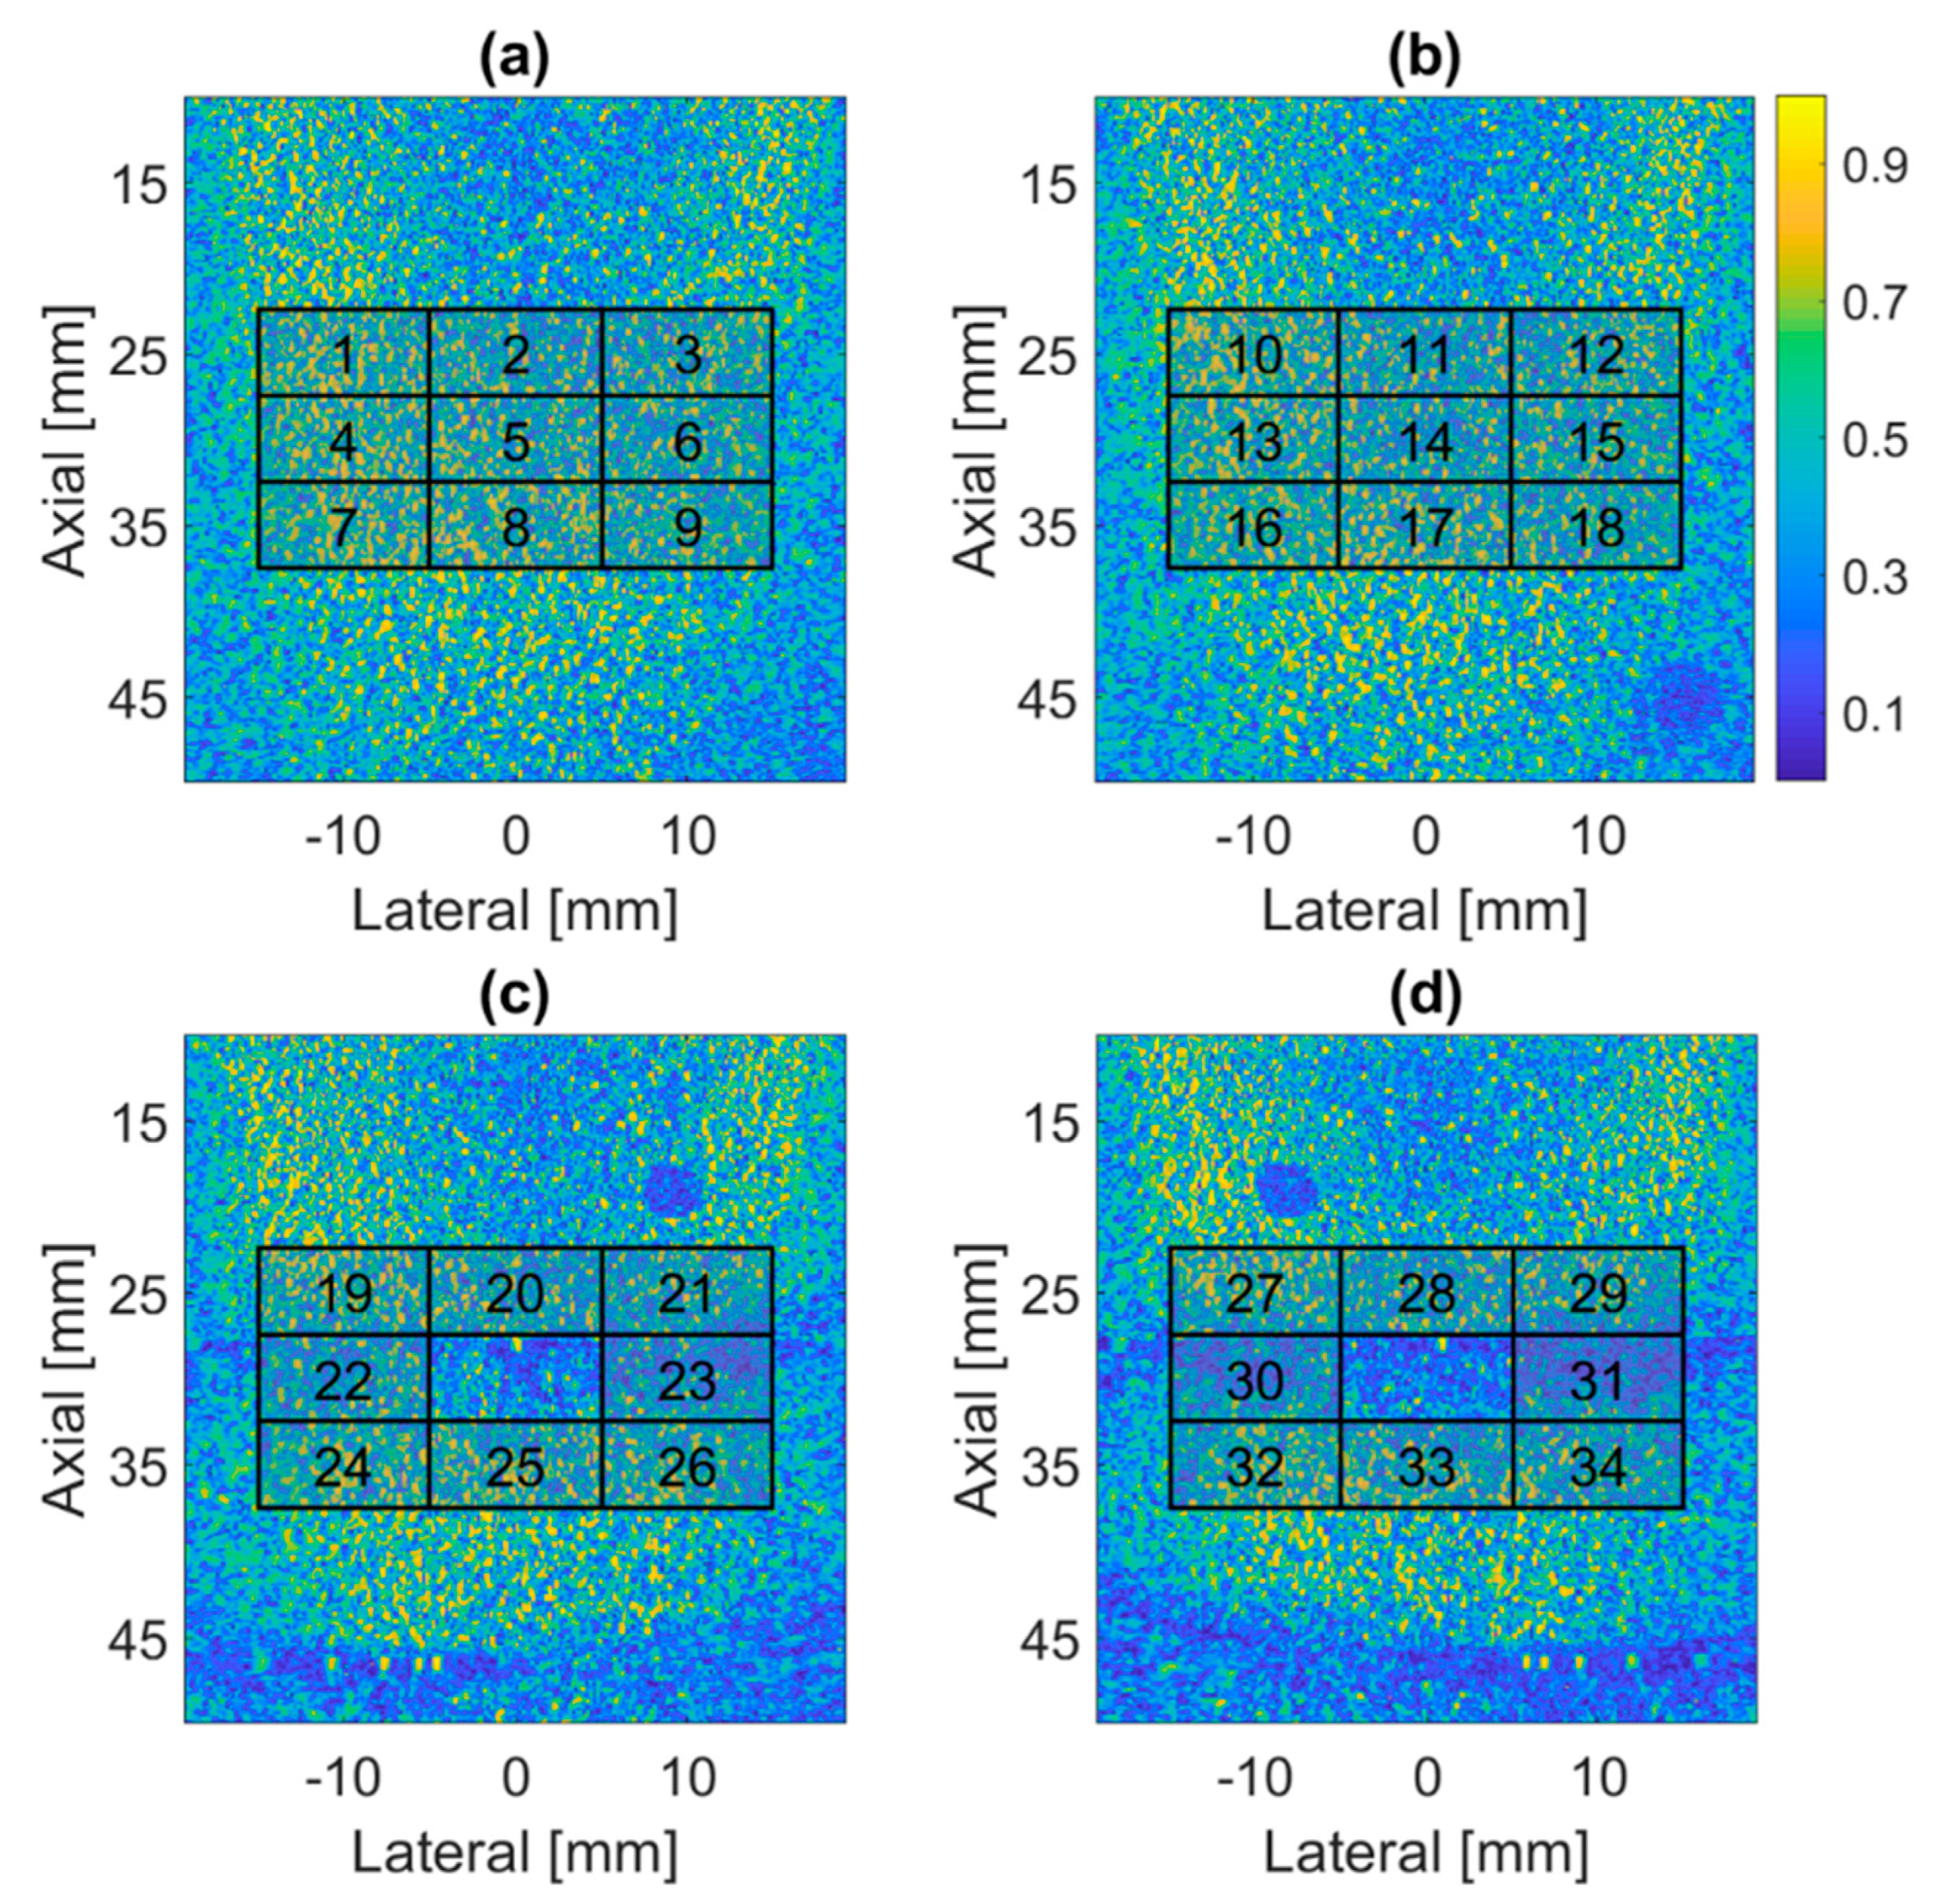
Figure 11 shows the DCF maps of Tx-DMAS beamforming for each FOVs in the Prodigy dataset and the corresponding ROIs at elevational focal depth for tissue SOS estimation. Note that two ROIs containing the wire reflectors has been excluded in the SOS estimation due to the obvious dark-region artifacts in DCF map. For the remaining 34 ROIs, the resultant average value and standard deviation of the tissue SOS estimation is 1426 ± 6 m/s, which is close to the actual SOS of 1427 m/s for the Prodigy dataset.

4.4. PICMUS In-Vivo Dataset

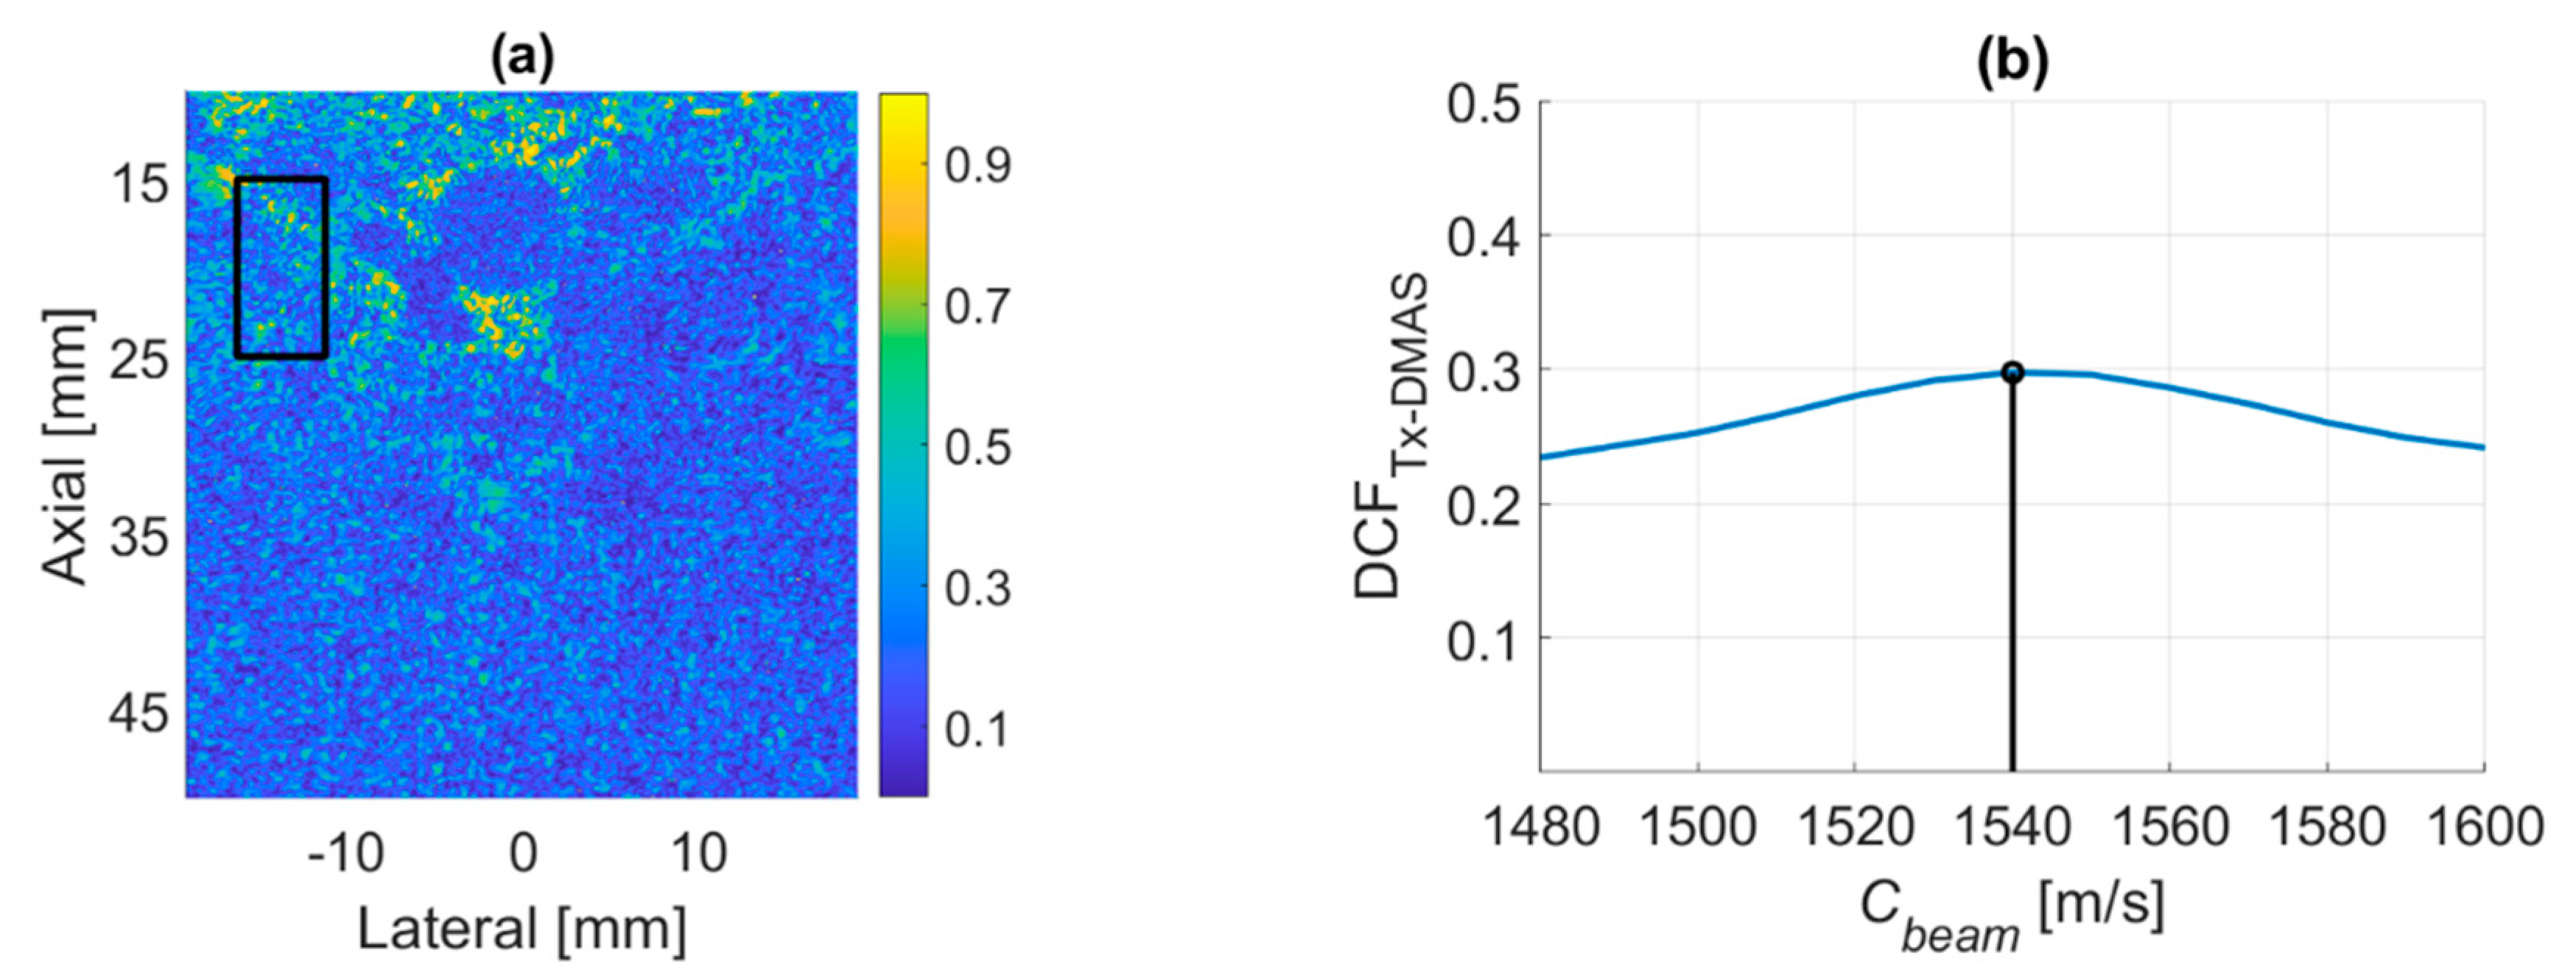
The proposed DCF method is also tested using in-vivo carotid dataset on the PICMUS platform. Figure 12a demonstrates the DCF map of Tx-DMAS beamforming with Cbeam of 1540 m/s in the carotid dataset, where the black rectangular ROIs are used for estimation of tissue SOS. Figure 12b shows the averaged DCF value within the ROI of Figure 12a as a function of Cbeam. The results indicate that the tissue SOS estimated by the proposed DCF method is 1540 m/s which agrees with the suggested Cbeam for the carotid dataset on the PICMUS platform.

5. Discussion and Conclusions

This paper combines multi-angle PW imaging and DMAS beamforming for tissue SOS estimation. In this study, the magnitude ratio of the image pixel value between DMAS beamforming and traditional CPWC is defined as the DCF of the pixel. When there is a mismatch between Cbeam and tissue SOS, the signal coherence degrades and the corresponding DCF value also decreases. Therefore, by calculating the DCF at different Cbeam, the Cbeam with the largest DCF is the optimal Cbeam (i.e., Copt) that matches the tissue SOS. Compared to other methods, the proposed DCF method not only considers the signal coherence among RxCh but also the signal coherence among TxEt. In the computational complexity, the DCF method only needs pixel-to-pixel division of the multi-angle PW DMAS image by the traditional CPWC image, and does not need to additionally retain the channel signal to calculate the signal coherence. Note that Cbeam in this study is only used to adjust the time delay in the receive beamforming while the transmit delay for PW transmit steering is determined by the constant nominal SOS. In other words, the transmit delay ( τ T X ) for PW steering angle ( θ ) is designed by using the nominal SOS as CTX in τ T X = x sin θ / C T X where x represents the lateral position of transmit element in the array. When the CTX mismatches the actual tissue SOS, PW transmit angle will deviate from its designed value. For example, when CTX is larger than the actual tissue SOS, it is expectable that the actual PW transmit angle will be smaller than the designed value such that the maximal PW transmit angle for SOS estimation is reduced. A supplementary experiment has been performed to study the robustness of the proposed DCF method in the presence of mismatch between the CTX and the actual tissue SOS. Specifically, two sets of channel waveforms from Model 042 phantom are acquired using the Prodigy system with different CTX. Results in Figure 13 indicate that both DCF curves peak at the same value of Cbeam regardless of the setting of CTX. In other words, the proposed DCF method will suggest a robust tissue SOS even with significant deviation of the CTX. Noted that the estimated tissue SOS in Figure 13 is different from that in Figure 11 possibly due to the change of ambient temperature in this two separate experiments.
However, since PW imaging does not have transmit focusing, our method generally relies on the ROI at the elevational focal depth for DCF calculation. This is because the signal coherence is better maintained when the received echoes come from a smaller sample volume (e.g., the transmit focal zone). Therefore, it is expectable that the signal coherence among both receive channel and transmit event could improve by selecting the ROI at the elevational focal depth. At depth away from the elevational focus, the proposed method will introduce larger estimation error and thus may not be applicable to deep tissues. The possible solution is to use a 1.5D/2D array to provide elevational focusing at the region of depth.
By using different Rx aperture sizes, channel SNR, beamforming methods, and p values in the PICMUS simulation data, the effect of the proposed DCF method for tissue SOS estimation are evaluated in this study. Results indicate that, when the Rx aperture size becomes larger and the channel SNR increases, the estimation results of tissue SOS will be more accurate. Compared to either Rx-DMAS or 2D-DMAS imaging methods, results also show that Tx-DMAS generally provides better performance in tissue SOS estimation when considering noise. The superiority of Tx-DMAS beamforming in tissue SOS estimation should come from the fact that its DCF calculation is based on signals with higher SNR. Assuming that the imaging depth for SOS estimation is about 20 mm and the channel SNR is −20 dB, Tx-DMAS first performs coherent summation along the RxCh direction and thus improves the signal SNR for DMAS calculation. Specifically, since the number of RxCh will be about 67 when the RxFn is 1 at imaging depth of 20 mm, the equivalent SNR for DMAS beamforming in the direction of the TxEt is −20 + 20log10(67) = 16.52 dB. For Rx-DMAS beamforming, on the other hand, it first performs coherent summation along the TxEt direction (i.e., 21 PWs in this study), and the equivalent SNR for DMAS beamforming in the RxCh direction is −20 + 20log10(21) = 6.44 dB. Note that the 2D-DMAS doesn’t perform any coherence summation and thus its SNR for DMAS beamforming in both directions of RxCh and TxEt remains at −20 dB. Consequently, since the signal of Tx-DMAS has the highest SNR for DMAS calculation, Tx-DMAS can use a smaller receiving aperture to provide the best tissue SOS estimation with smallest deviation and standard deviation, especially in the scenario of low channel SNR. On the contrary, 2D-DMAS usually has the worst tissue SOS estimation due to its lowest SNR for DMAS calculation. In addition, performance of the proposed SOS estimation will noticeably degrade when the p value in DMAS beamforming is smaller than 2. Note that a smaller p value reduces the degree of signal coherence in DMAS beamforming. Therefore, it is expectable that the calculation of DCF value may fail when the degree of signal coherence is insufficient.
Using Tx-DMAS beamforming in the experiments, our results show that the Copt estimated by the proposed DCF method does have the best image quality for the PICMUS experimental dataset. For the Prodigy dataset, the estimated tissue SOS is 1426 ± 6 m/s which is very close to the actual tissue SOS of 1427 m/s. The estimated SOS also corresponds to the Copt with the minimal −6-dB LW and the maximal CR within an error of 10 m/s. For comparison, both 2D-DMAS and Rx-DMAS are also applied to the Prodigy dataset and the corresponding tissue SOS is estimated to be 1428 ± 4 m/s for both methods. In the experiments, the channel SNR can be estimated from the magnitude difference in power spectrum between the received channel signal and noise at PW angle of 0°. Since the channel SNR in the Prodigy dataset is estimated to be about 20 dB, it is expectable that all three DMAS beamforming methods can provide comparable estimation of the tissue SOS in this high SNR condition. Nonetheless, it should be noted that Tx-DMAS has the lowest computational complexity since it does not need to retain the complete channel signal of each TxEt as in Rx-DMAS or to do p-root magnitude scaling for every entry in the 2D echo matrix as in 2D-DMAS. In fact, Tx-DMAS beamforming can be easily implemented in current PW imaging system by adopting DMAS processing instead of the conventional coherent summation of low-resolution sub-images. Therefore, the DCF method with Tx-DMAS beamforming should also outperform the Rx-DMAS and 2D-DMAS counterparts in terms of computational complexity.
Note that 2D-DMAS would degenerate to Rx-DMAS when the number of PW involved in the DCF calculation reduces to 1. Since there is no synthetic transmit focusing in single PW imaging, the received echoes actually come from the unfocused PW transmission. In this case, the estimated Copt of Prodigy imaging system dataset for Rx-DMAS method is 1474 ± 31 m/s which evidently over-estimates the actual SOS of the imaged phantom. This is because, when the received channel data comes from a large sample volume due to unfocused transmission, the corresponding phase curve would have a reduced curvature due to the superimposition of several diffuse scatterers in the lateral direction [29]. This phenomenon is in agreement with other pre-beamforming SOS estimation methods such as in [15,16,17].
For now, the accuracy of the proposed DCF method for tissue SOS estimation is determined by the increment of Cbeam (i.e., 10 m/s in this study). However, due to fairly smooth curve of DCF as a function of Cbeam, curve interpolation can be a possible solution to further improve the accuracy of the proposed DCF method for tissue SOS estimation. Moreover, iterative strategy similar to that in [22] to find the maximum of DCF value without a full search of Cbeam is also potential to improve the computational efficiency of tissue SOS estimation in this study. Both aforementioned methods will be considered in the future work of this study.

Author Contributions

C.-C.S. is the supervisor of this research who proposes the idea of tissue SOS estimation using DMAS beamforming. K.-L.T. performs the simulations and the experiments to validate the efficacy of the proposed method. All authors have read and agreed to the published version of the manuscript.

Funding

This research was funded by Ministry of Science and Technology of Taiwan under Grant No. 108-2221-E-011-072-MY3 and 108-2221-E-011-071-MY3.

Conflicts of Interest

The authors declare no conflict of interest.

References

  1. Montaldo, G.; Tanter, M.; Bercoff, J.; Benech, N.; Fink, M. Coherent plane-wave compounding for very high frame rate ultrasonography and transient elastography. IEEE Trans. Ultrason. Ferroelectr. Freq. Control. 2009, 56, 489–506. [Google Scholar] [CrossRef] [PubMed]
  2. Matrone, G.; Savoia, A.S.; Caliano, G.; Magenes, G. The delay multiply and sum beamforming algorithm in ultrasound b-mode medical imaging. IEEE Trans. Med. Imaging 2014, 34, 940–949. [Google Scholar] [CrossRef] [PubMed]
  3. Matrone, G.; Ramalli, A.; Savoia, A.S.; Tortoli, P.; Magenes, G. High frame-rate, high resolution ultrasound imaging with multi-line transmission and filtered-delay multiply and sum beamforming. IEEE Trans. Med. Imaging 2016, 36, 478–486. [Google Scholar] [CrossRef] [PubMed]
  4. Matrone, G.; Ramalli, A.; Tortoli, P.; Magenes, G. Enhanced ultrasound harmonic imaging using the filtered-delay multiply and sum beamformer. In Proceedings of the 2017 IEEE International Ultrasonics Symposium (IUS), Washington, DC, USA, 6–9 September 2017. [Google Scholar]
  5. Matrone, G.; Ramalli, A.; D’Hooge, J.; Tortoli, P.; Magenes, G. Performance of F-DMAS beamforming with adjustable maximum spatial lag in multi-line transmission ultrasound imaging. In Proceedings of the 2018 IEEE International Ultrasonics Symposium (IUS), Kobe, Japan, 22–25 October 2018. [Google Scholar]
  6. Shen, C.C.; Hsieh, P.Y. Ultrasound baseband delay-multiply-and-sum (BB-DMAS) nonlinear beamforming. Ultrasonics 2019, 96, 165–174. [Google Scholar] [CrossRef]
  7. Park, J.; Jeon, S.; Meng, J.; Song, L.; Lee, J.S.; Kim, C. Delay-multiply-and-sum-based synthetic aperture focusing in photoacoustic microscopy. J. Biomed. Opt. 2016, 21, 36010. [Google Scholar] [CrossRef]
  8. Mozaffarzadeh, M.; Mahloojifar, A.; Orooji, M.; Adabi, S.; Nasiriavanaki, M. Double-Stage Delay Multiply and Sum Beamforming Algorithm: Application to Linear-Array Photoacoustic Imaging. IEEE Trans. Biomed. Eng. 2017, 65, 31–42. [Google Scholar] [CrossRef] [Green Version]
  9. Kirchner, T.; Sattler, F.; Gröhl, J.; Maier-Hein, L. Signed real-time delay multiply and sum beamforming for multispectral photoacoustic imaging. J. Imaging 2018, 4, 121. [Google Scholar] [CrossRef] [Green Version]
  10. Jeon, S.; Park, E.Y.; Choi, W.; Managuli, R.; Lee, K.J.; Kim, C. Real-time delay-multiply-and-sum beamforming with coherence factor for in vivo clinical photoacoustic imaging of humans. Photoacoustics 2019, 15, 100136. [Google Scholar] [CrossRef]
  11. Go, D.; Kang, J.; Yoo, Y. A new compounding method for high contrast ultrafast ultrasound imaging based on delay multiply and sum. In Proceedings of the 2018 IEEE International Ultrasonics Symposium (IUS), Kobe, Japan, 22–25 October 2018. [Google Scholar]
  12. Matrone, G.; Savoia, A.S.; Caliano, G.; Magenes, G. Ultrasound plane-wave imaging with delay multiply and sum beamforming and coherent compounding. In Proceedings of the 2016 38th Annual International Conference of the IEEE Engineering in Medicine and Biology Society (EMBC), Orlando, FL, USA, 17–20 August 2016. [Google Scholar]
  13. Shen, C.C.; Hsieh, P.Y. Two-dimensional spatial coherence for ultrasonic DMAS beamforming in multi-angle plane-wave imaging. Appl. Sci. 2019, 9, 3973. [Google Scholar] [CrossRef] [Green Version]
  14. Anderson, M.E.; Trahey, G.E. The direct estimation of sound speed using pulse–echo ultrasound. J. Acoust. Soc. Am. 1998, 104, 3099–3106. [Google Scholar] [CrossRef]
  15. Yoon, C.; Lee, Y.; Chang, J.H.; Song, T.K.; Yoo, Y. In vitro estimation of mean sound speed based on minimum average phase variance in medical ultrasound imaging. Ultrasonics 2011, 51, 795–802. [Google Scholar] [CrossRef] [PubMed]
  16. Shen, C.C.; Yang, H.-C. Adaptive optimization of ultrasound beamforming sound velocity using sub-aperture differential phase gradient. Ultrasonics 2017, 79, 52–59. [Google Scholar] [CrossRef] [PubMed]
  17. Shen, C.C.; Hsiao, S.H.; Lin, Y.C. Synthetic transmit aperture beamforming for sound velocity estimation using channel-domain differential phase gradient—A phantom study. Ultrasonics 2019, 94, 183–191. [Google Scholar] [CrossRef] [PubMed]
  18. Imbault, M.; Faccinetto, A.; Osmanski, B.F.; Tissier, A.; Deffieux, T.; Gennisson, J.L.; Vilgrain, V.; Tanter, M. Robust sound speed estimation for ultrasound-based hepatic steatosis assessment. Phys. Med. Biol. 2017, 62, 3582–3598. [Google Scholar] [CrossRef]
  19. Napolitano, D.; Chou, C.H.; McLaughlin, G.; Ji, T.L.; Mo, L.; Debusschere, D.; Steins, R. Sound speed correction in ultrasound imaging. Ultrasonics 2006, 44, e43–e46. [Google Scholar] [CrossRef] [PubMed]
  20. Yoon, C.; Seo, H.; Lee, Y.; Yoo, Y.; Song, T.K.; Chang, J.H. Optimal sound speed estimation using modified nonlinear anisotropic diffusion to improve spatial resolution in ultrasound imaging. IEEE Trans. Ultrason. Ferroelectr. Freq. Control. 2012, 59, 905–914. [Google Scholar] [CrossRef]
  21. Qu, X.; Azuma, T.; Liang, J.T.; Nakajima, Y. Average sound speed estimation using speckle analysis of medical ultrasound data. Int. J. Comput. Assist. Radiol. Surg. 2012, 7, 891–899. [Google Scholar] [CrossRef]
  22. Shin, H.C.; Prager, R.; Gomersall, H.; Kingsbury, N.; Treece, G.; Gee, A. Estimation of average speed of sound using deconvolution of medical ultrasound data. Ultrasound Med. Biol. 2010, 36, 623–636. [Google Scholar] [CrossRef]
  23. Rindal, O.M.H.; Rodriguez-Molares, A.; Austeng, A. The dark region artifact in adaptive ultrasound beamforming. In Proceedings of the 2017 IEEE International Ultrasonics Symposium (IUS), Washington, DC, USA, 6–9 September 2017. [Google Scholar]
  24. Camacho, J.; Romero, M.P.; Fritsch, C. Phase Coherence Imaging. IEEE Trans. Ultrason. Ferroelectr. Freq. Control 2009, 56, 958–974. [Google Scholar] [CrossRef]
  25. Cruza, J.; Camacho, J.; Fritsch, C. Plane-wave phase-coherence imaging for NDE. NDT E Int. 2017, 87, 31–37. [Google Scholar] [CrossRef]
  26. Ali, R.; Dahl, J.J. Distributed phase aberration correction techniques based on local sound speed estimates. In Proceedings of the 2018 IEEE International Ultrasonics Symposium (IUS), Kobe, Japan, 22–25 October 2018. [Google Scholar]
  27. Liebgott, H.; Rodriguez-Molares, A.; Cervenansky, F.; Jensen, J.A.; Bernard, O. Plane-wave imaging challenge in medical ultrasound. In Proceedings of the 2016 IEEE International Ultrasonics Symposium (IUS), Tours, France, 18–21 September 2016. [Google Scholar]
  28. Browne, J.E.; Ramnarine, K.V.; Watson, A.J.; Hoskins, P.R. Assessment of the acoustic properties of common tissue-mimicking test phantoms. Ultrasound Med. Biol. 2003, 29, 1053–1060. [Google Scholar] [CrossRef] [Green Version]
  29. Flax, S.W.; O’Donnell, M. Phase-aberration correction using signals from point reflectors and diffuse scatterers: Basic principles. IEEE Trans. Ultrason. Ferroelectr. Freq. Control. 1988, 35, 758–767. [Google Scholar] [CrossRef]
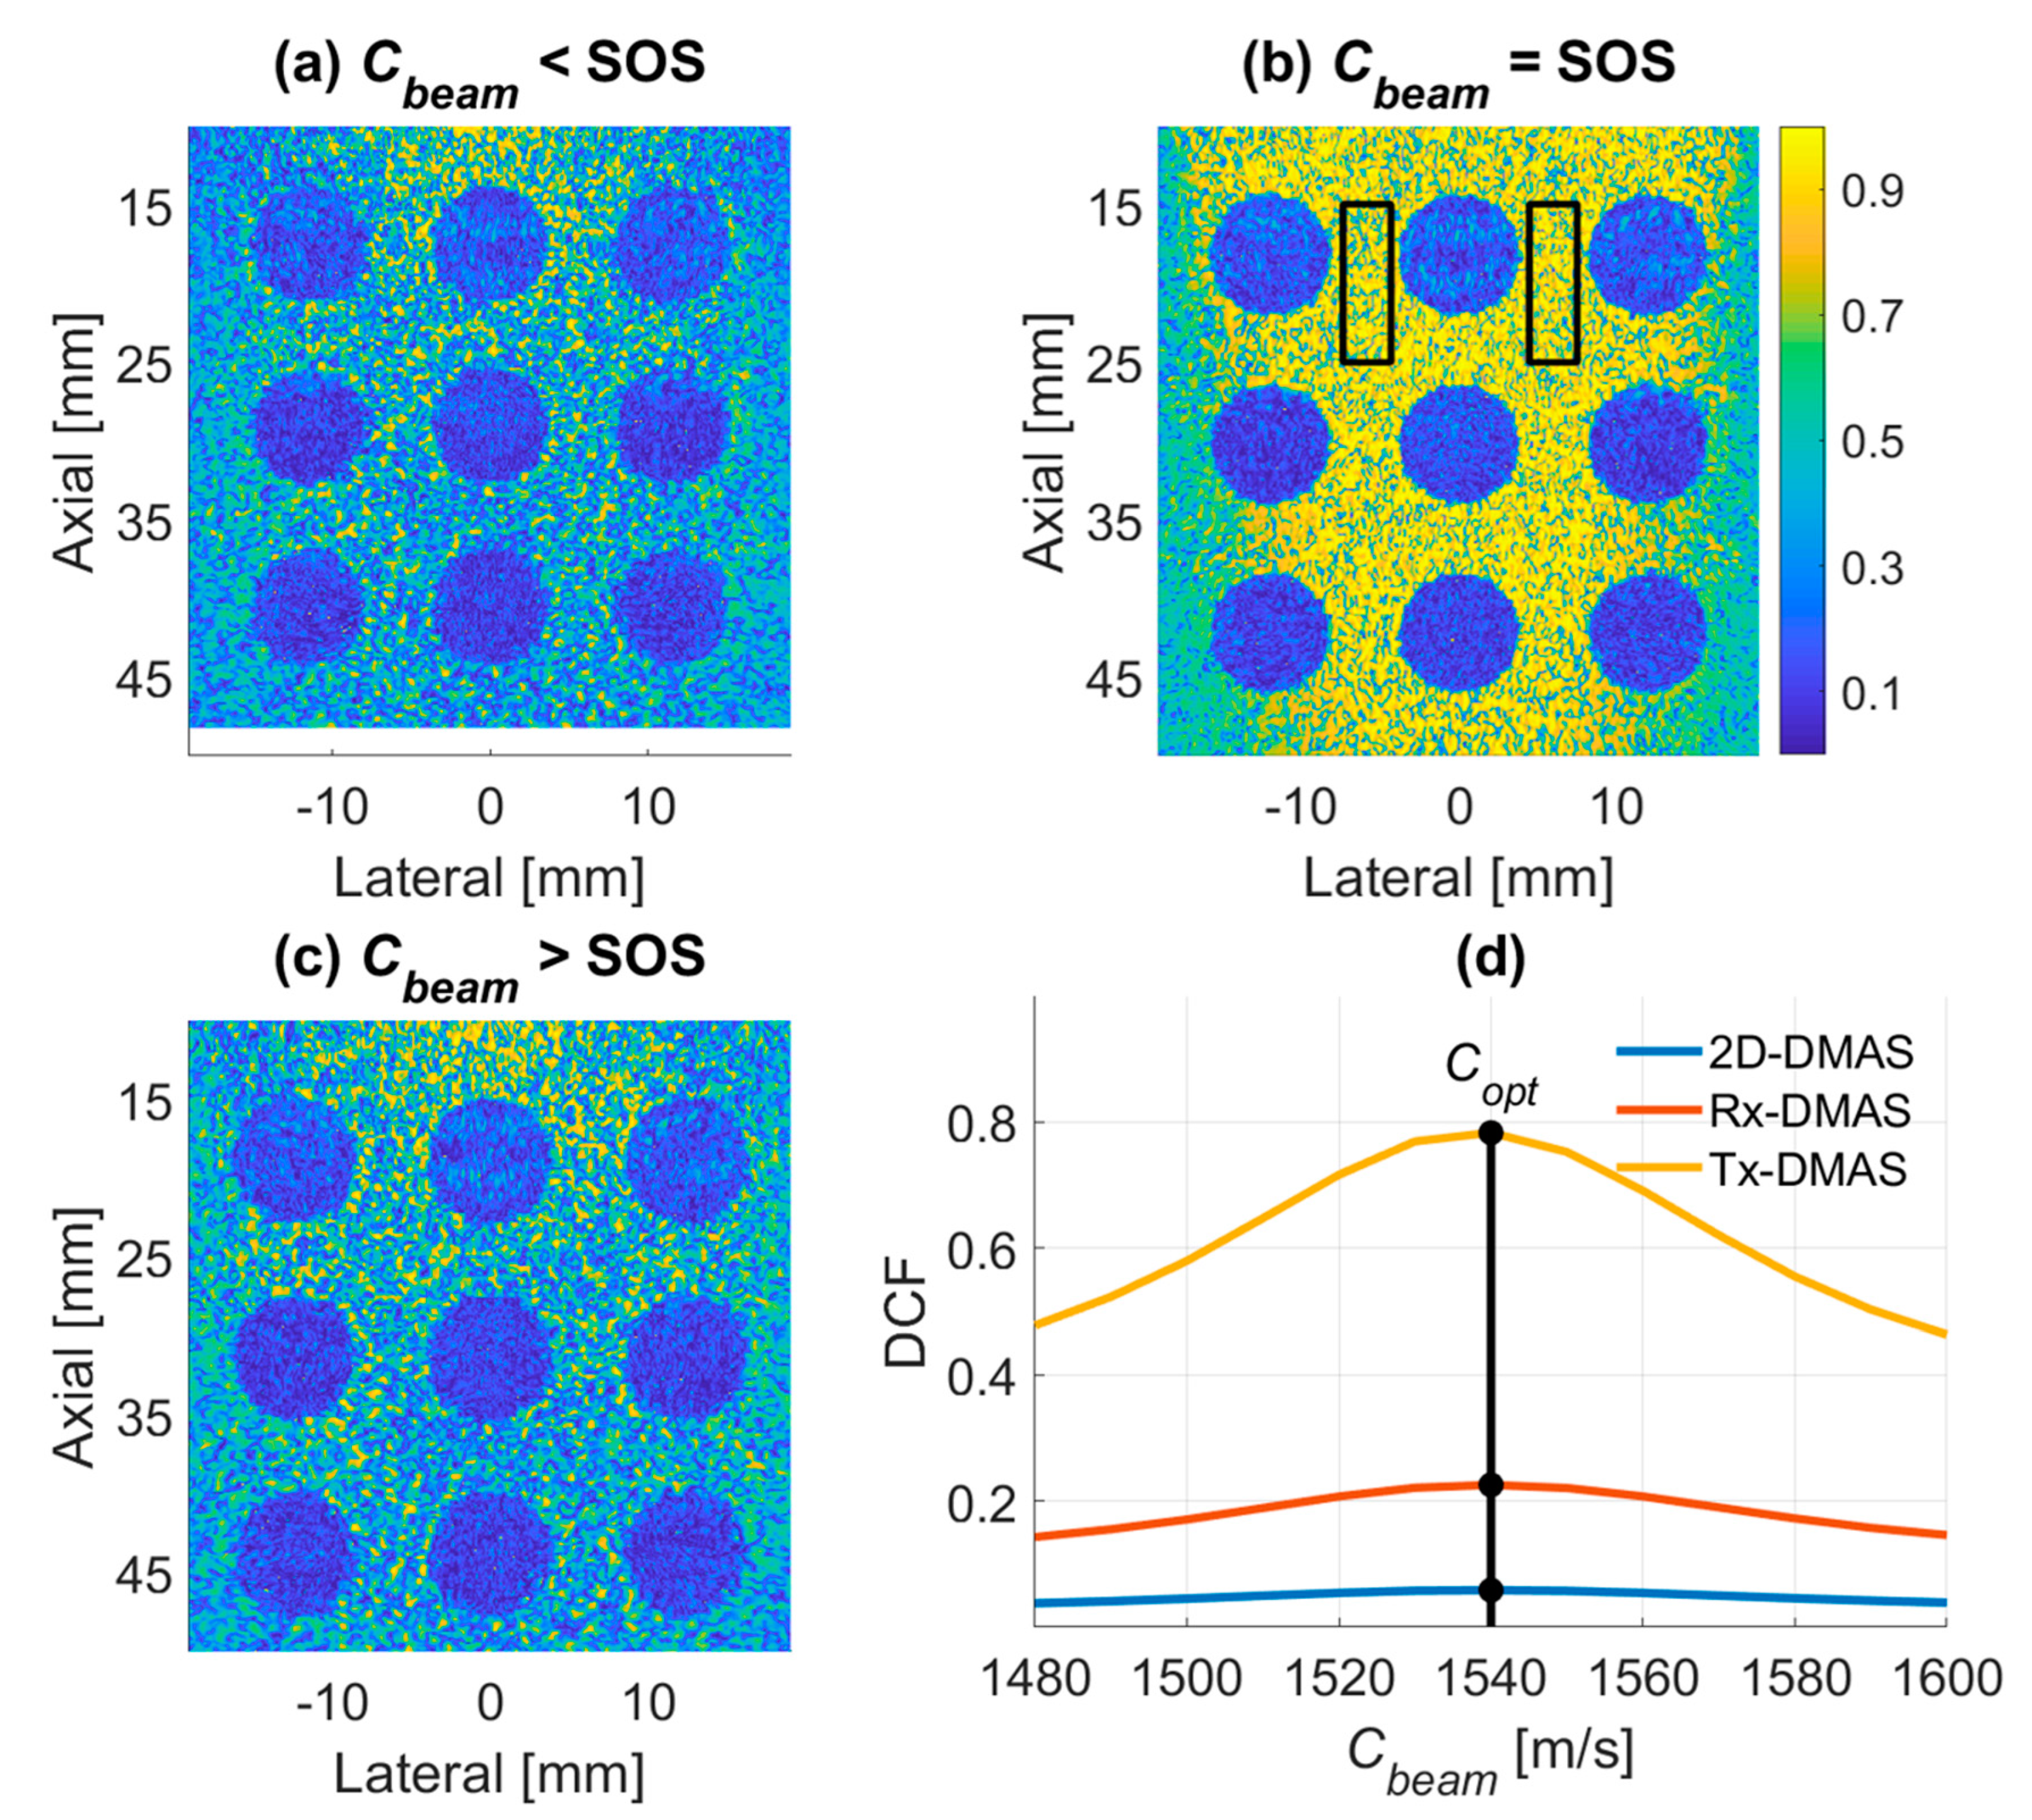
Figure 1. (ac) Typical DCF maps of the simulation phantom for Cbeam greater than, equal to and less than the actual SOS, respectively. (d) Plot of average DCF value as a function of Cbeam in different DMAS beamforming methods.
Applsci 10 06298 g001
Figure 2. B-mode images of PICMUS dataset for measurement of image quality metrics. (a,b) Two simulation phantoms for wires and anechoic cysts in speckle background, respectively. (c,d) Two different field of views (FOVs) of the same experimental phantom.
Applsci 10 06298 g002
Figure 3. B-mode images of Prodigy dataset for measurement of image quality metrics. (a,b) Two different FOVs of the same experimental phantom.
Applsci 10 06298 g003
Figure 4. Plot of Copt in different DMAS methods as a function of RxFn and channel SNR.
Applsci 10 06298 g004
Figure 5. Plot of DCF value in Tx-DMAS method as a function of number of PW.
Applsci 10 06298 g005
Figure 6. Plot of Copt in Tx-DMAS method with different p values as a function of channel SNR.
Applsci 10 06298 g006
Figure 7. Plot of −6-dB LW (a) and CR (b) as a function of Cbeam for the PICMUS dataset.
Applsci 10 06298 g007
Figure 8. (a,b) DCF map of Tx-DMAS beamforming for two different FOVs of PICMUS experimental phantom. (c,d) Respective plot of averaged DCF value in (a,b) as a function of Cbeam.
Applsci 10 06298 g008
Figure 9. DCF maps of Tx-DMAS beamforming with Cbeam of 1540, 1570 and 1600 m/s of PICMUS experimental phantom.
Applsci 10 06298 g009
Figure 10. Plot of -6-dB LW (a) and CR (b) as a function of Cbeam for the Prodigy dataset.
Applsci 10 06298 g010
Figure 11. (ad) DCF map of Tx-DMAS beamforming for four different FOVs of Prodigy experimental phantom. The black rectangular ROIs labeled from 1 to 34 are used for SOS estimation.
Applsci 10 06298 g011
Figure 12. (a) DCF map of Tx-DMAS beamforming for in-vivo carotid dataset on the PICMUS platform. (b) Plot of averaged DCF value in (a) as a function of Cbeam.
Applsci 10 06298 g012
Figure 13. (a) DCF map of Tx-DMAS beamforming for the supplementary dataset to test the effect of mismatch between CTX and tissue SOS. (b) Plot of averaged DCF value in (a) as a function of Cbeam for different CTX.
Applsci 10 06298 g013
Table 1. The parameter of PICMUS dataset.
PICMUS Imaging System
Pitch0.3 mm
Number of elements128
Elevation focus20 mm
Sampling frequency20.832 MHz
PICMUS Transmit Pulse
Center frequency5.208 MHz
Excitation2.5 cycles
Number of Tx angle21 (−16°~+16°)
Simulation Phantom
Nominal SOS1540 m/s
Phantom20 wires
Speckle with 9 cysts
Experimental Phantom
Nominal SOS1540 m/s
PhantomCIRS Model 040GSE
In-vivo Data
Suggested SOS1540 m/s
TissueCarotid
Table 2. The parameter of Prodigy ultrasonic imaging system dataset.
Prodigy Imaging System
Pitch0.3 mm
Number of elements128
Elevation focus30 mm
Sampling frequency25.6 MHz
Prodigy Transmit Pulse
Center frequency6.4 MHz
Excitation2 cycles
Number of Tx angle21 (−16°~+16°)
Experimental Phantom
Nominal SOS1430 m/s
PhantomCIRS Model 042
Table 3. Cbeam with the best image quality
Cbeamwith the Minimal −6-dB LW
RxFn0.7511.251.5
Copt [m/s]1540154015401530
Cbeamwith the Maximal CR
RxFn0.7511.251.5
Copt [m/s]1540154015401540