Article

Experimental and Numerical Study on Performance Enhancement by Modifying the Flow Channel in the Mechanical Chamber Room of a Home Refrigerator

Division of Mechanical Engineering, Tongmyong University, 428 Sinseon-ro, Nam-gu, Busan 48520, Korea
Appl. Sci. 2020, 10(18), 6284; https://doi.org/10.3390/app10186284
Submission received: 6 July 2020 / Revised: 5 September 2020 / Accepted: 8 September 2020 / Published: 9 September 2020
(This article belongs to the Special Issue Experimental and Numerical Modeling of Fluid Flow)

Abstract

:

Featured Application

Design of high performance refrigerator.

Abstract

Recently, many refrigerators of high have been designed so as to improve the performance of the refrigerator and to economize on energy. There are many methods of improving the total efficiency of the refrigerators using a methodological approach. In this experimental and numerical study, three methods—namely, modifying the flow channel and the operating conditions and changing the positions of the fan at the mechanical chamber room (MCR)—are used to analyze the performance improvement of the refrigerator. These methods of changing the flow channel in an MCR of a refrigerator are, in many ways, used as a regulation of the upper flow region of the condenser, especially in this research. Modifying the refrigerators’ MCR is carried out by changing the shape of the cover back machine (CBM). We compute the fluid flow in a refrigerator MCR by computational fluid dynamics (CFD) techniques. The commercial code ANSYS CFX 16.2 is used for this computation. The regulation flow region shows a reduction in power consumption of about 0.75% per month. The result of the operating conditions of the fan at MCR is relative to the flow rate for reducing power consumption. The changing positions are also relative to the length of the reducing power consumption. Moreover, with the results obtained by CFD, we understand the flow structure in a refrigerators’ MCR for various types of CBM. The results also show that the efficiency of the refrigerator is improved by 1.2%.

1. Introduction

Some of the common household appliances are refrigerators, washing machines, clothes dryers, electric ovens, etc. [1]. Among the household appliances, the refrigerator is the most common one due to its indispensable nature and hence, is the most manufactured [1,2]. Currently, there are over a billion domestic refrigerators worldwide [2]. The energy consumption of household appliances increases in proportion to its usage. Among these appliances, the refrigerator is one of the most energy-consuming devices [2]. It is estimated that more than 45% of the world food production would go waste if not for the refrigerators’ cold storage and distribution [2]. Thus, improving their energy efficiency, efficient energy consumption, and prolonged life becomes imperative [1,2]. There are different mechanisms to increase the efficiency of the refrigerator, namely, by improving the compressor performance, thermal isolation, heat exchanger design, implementation of optimum control in refrigerator operation [2], improvements in cabinets (such as insulation, improved gaskets), improvement in refrigeration systems (such as fan motors, high efficiency compressors), improved heat exchangers, advanced defrost mechanisms, etc. [1].
Environmental problems, such as global warming, have precipitated a large number of studies—on various factors—that affect the power consumption of a refrigerator to improve their efficiency [3]. On the evaluation of the efficiency and performance of refrigerators, Dmitriyev and Pisarenko investigated the change in the performance of a refrigeration system using a Phase-change Material (PCM) cooling agent [4]. Laguerre et al. investigated the change in the temperature of freezing and refrigeration chambers in a food storage refrigeration system according to its storage temperature and usage frequency in an empirical manner [5]. Sergio Ledesma and J M Belman-Flores mathematically studied the thermal effect of the fresh food compartment with a change in glass shelve locations in a domestic refrigerator. The moving variance and the finite difference approximation were used to analyze the thermal distribution and the temperature change rate, respectively, in their study. The results showed that the use of thermal maps to analyze the mean and variance of the temperature was an important tool to assess a good combination of shelf locations [6]. M Rasti et al. experimentally studied the energy efficiency enhancement of a domestic refrigerator by replacing R134a with R436A without any mechanical alteration. The results showed that by replacing the R436A, the On time and energy consumption was reduced by 13% and 5.3%, respectively, for a day, and the optimum charge for R436A was reduced to 48% when compared to the charge of R134a [7]. Shikalgar and Sapali experimentally studied the energy and exergy analysis of a domestic refrigerator by comparing the hot-wall air-cooled (HWAC) and box type shell and tube water-cooled (BCTWC) condensers. The results showed that the coefficient of performance and the exergy efficiency of BCTWC was increased by 18–20% and 6.89–9.13%, respectively, when compared to the HWAC. In addition, the energy consumption of the BCTWC was reduced by 17% in comparison to HWAC [8]. Belman-Flores et al. experimentally and numerically studied the temperature stratification of the fresh food and freezer compartments of the domestic refrigerator with bottom mount configuration. The results showed that the proposed design had a good distribution of airflow and hence, uniform temperature at the fresh food compartment. Furthermore, in comparison to the original design, the new design showed less ON stages for the compressor [9]. Antonio and Afonso conducted a comparison study between the computational fluid dynamics (CFD) and Artificial Neural Network (ANN) modeling of the air temperature fields inside the refrigerator cabins. The results showed that the ANN model produced a low absolute error of 0.8 K in comparison to 1 K of the CFD model. Moreover, the temperature field obtained with the ANN model was more refined in comparison to the CFD model [10]. A review of advances in domestic refrigerators can be had from [1,2,11]. However, there are very few studies on the improvement in refrigeration performance according to the internal structure of a refrigeration chamber and its conditions that affect the performance of a refrigerator [12,13,14,15].
The purpose of this study is to improve the total efficiency of the refrigerator by maintaining the temperature inside the mechanical chamber room (MCR) at a constant level or by decreasing it—based on the improvement of the flow line and the operating condition of the cooling fans—experimentally. In addition, to optimize the flow line inside the MCR by changing the shield shape of the cover back machine (CBM) based on computational flow analysis.

2. Factors Affecting the Efficiency of the Refrigerator

The refrigerator consists of a front and rear (F and R) MCR. This chamber is called as a cover back machine (CBM). The MCR is installed at the rear of the refrigerator. Figure 1 shows the component arrangement of the MCR in the refrigerator. It consisted of a compressor, condenser, suction pipe, discharge pipe, cooling fan, guide fan, fan motor, capillary tube, a dryer. The suction pipes were installed at the entrance of the compressor, where a cooling agent moved. The discharge pipes were installed at the exit of the compressor.
In general, the F and R chambers were maintained at an inner temperature of −18 °C and +3 °C, respectively, where and they showed differences in the outer temperature as 48 °C and 27 °C, respectively, for an ambient temperature of +30 °C [16]. As a normal operation in a refrigerator, the compressor is operated as an On/Off control, and the cooling fan is operated at the same time. A cover back machine (CBM) is installed to prevent the inflow of mechanical noise and other foreign objects into the internal space. The cooling fan is used to cool down the condenser. The cooling fan causes an internal flow inside the refrigerator.
The operational losses, additional device (parasitic) losses, load losses in insulation used to isolate the inflow of external air, input losses in the On/Off control cycles, thermal load losses in the fan motors, input losses in the On/Off control of a compressor, heat exchange efficiency in a condenser, pressure decrease in the pipeline, loss in an evaporator for removing frosts are some of the factors that lead to the inefficiency of a refrigerator [16,17,18,19]. In addition, within the MCR, the heat source generated from the compressor, condenser, fans, and motors influence the decrease in the efficiency of the whole cycle of the refrigerator. Moreover, if the heat release is less than the heat released from within the MCR, the temperature of the system will be increased, leading to a decrease in the efficiency of the refrigerator. Thus, a cooling process is applied to the surface of the condenser using cooling fans, and the flow line in the MCR is rearranged to decrease the temperature. However, it is necessary to improve such a flow line to increase the efficiency as there are lots of resistant factors in the chamber due to the complicated flow line.
The internal flow inside the refrigerator caused by a cooling fan is discharged to each vent of the CBM through the forced convection generated by the fan as the compressor condenses refrigerant vapor. The performance of heat transfer inside the MCR caused by such forced convection affects its co-efficient of performance (COP). The COP is the refrigeration effect of a compression work, and it can be calculated as follows [4,14].
COP =   Cooling   Efficiency Compressor   work =   Q L AW
As the vent temperature of a compressor and the condensation temperature of a condenser are decreased at a p-h diagram to improve the COP [18,19,20], the refrigerant condensed by the condenser may improve the refrigeration effect of COP due to the pressure reduction by an expansion valve. Furthermore, in a convectional heat transfer, by cooling the fan, the heat transfer coefficient of h depends on the internal temperature of the MCR and the air temperature around the vent of the CBM near the cooling fan. Because an effective shield in the vent of the CBM at the front of each major component significantly affects the COP, the convectional heat transfer coefficient, and power consumption, it becomes an important factor in the flow inside the MCR and its flow line [3,13].

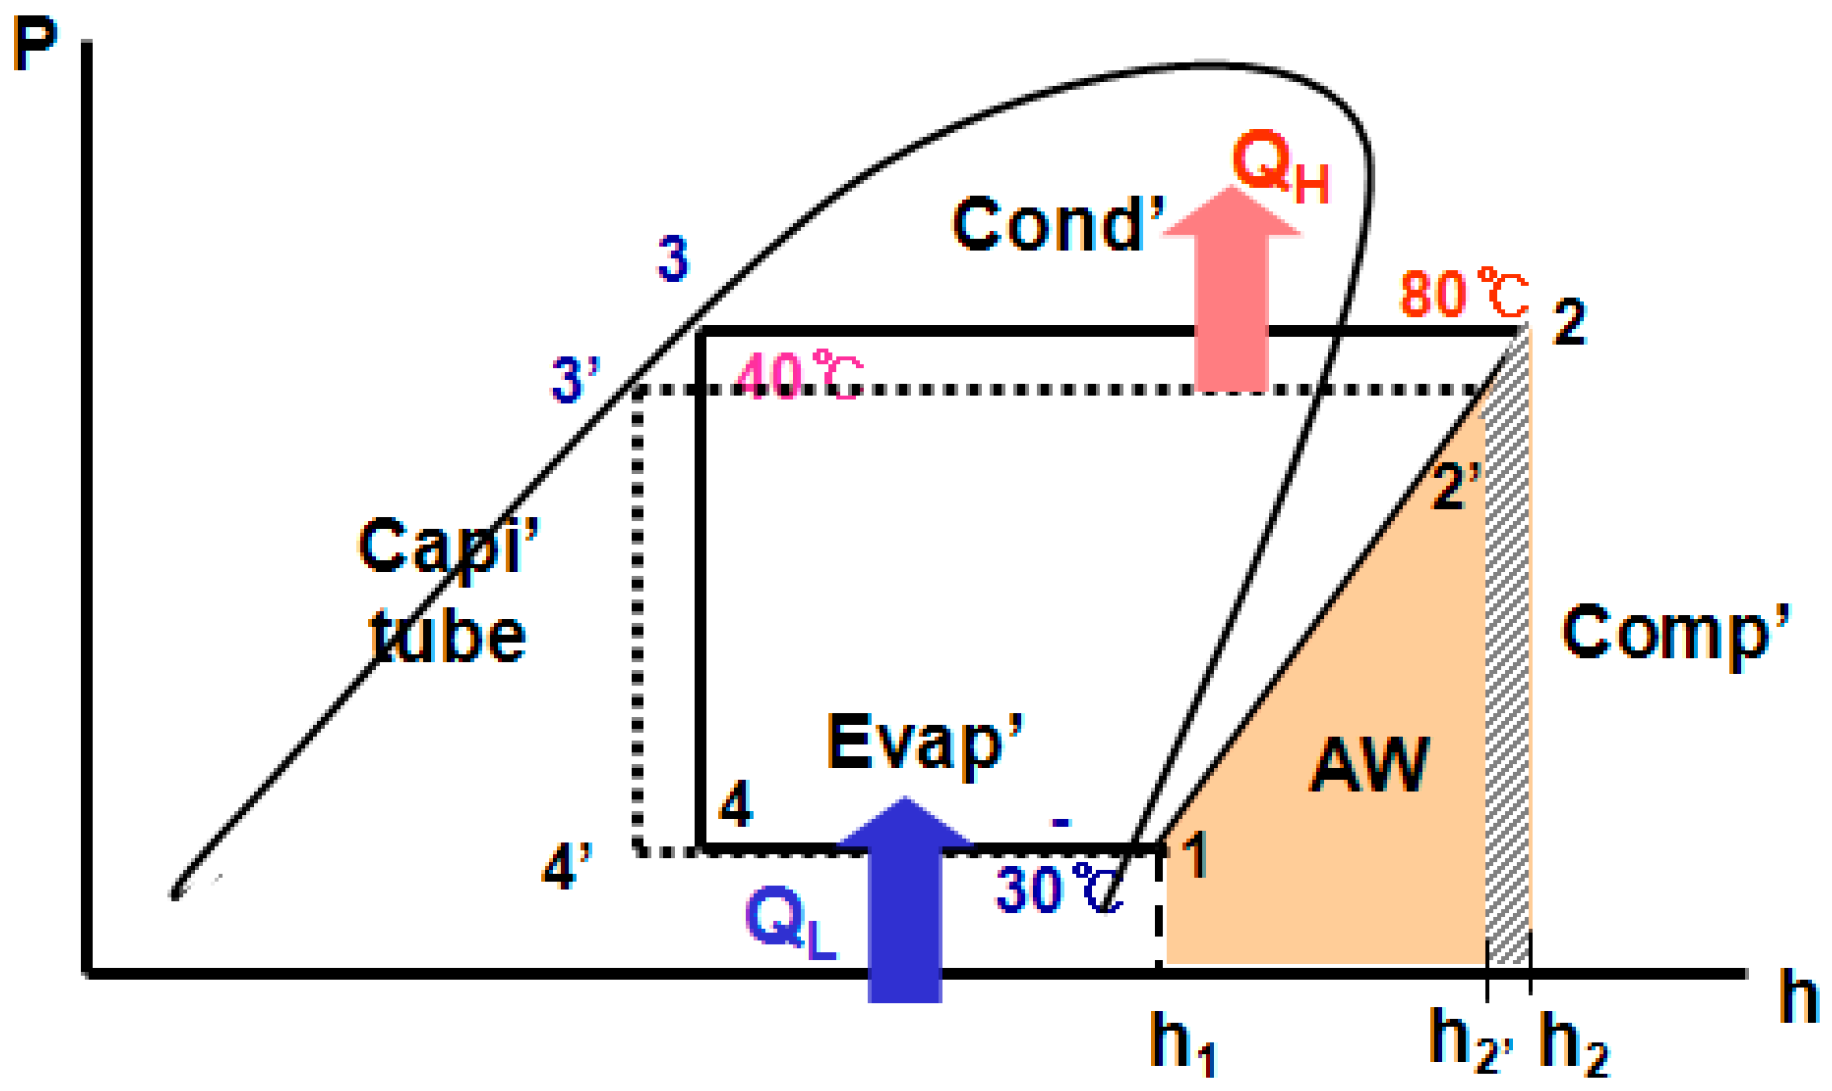
3. Background Theory

The Carnot cycle applied to a refrigerator consists of an isentropic process that corresponds to the work of a compressor, static pressure heat release process in a heat exchanger, expansion process in a capillary tube, and static pressure heat suction process in an evaporator [21]. In general, the static pressure heat release and heat suction process are reversible processes that show a decrease in its efficiency as the temperature difference between high and low temperature regions in a heat exchange process. In addition, it plays a role in decreasing the refrigeration capacity due to the increase in the compression rate of the compressor and the decrease in volume efficiency.
Regarding the solution for solving these problems, although an expansion for the section of heat exchanges is to be recommended, it represents significant difficulties in the structure of the MCR and the space for installing this chamber for the present refrigerator [22]. Therefore, it is the most ideal way to improve the efficiency of a refrigerator by decreasing the temperature in an heat exchanger through changing the flow line using cooling fans, increasing the surface heat transfer coefficient, and decreasing the compression rate of a compressor.
Figure 2 shows the schematic of the reverse Carnot cycle. In the figure, h is enthalpy; h 1 and h 2 are the initial and final enthalpy state of the compressor, respectively. The numbers 1 ,   2 ,   3 , and 4 denote the initial enthalpy state of the compressor. The numbers 1 ,   2 ,   3 , and 4 denote the improved enthalpy state of the compressor. h 2 is the improved enthalpy state of the compressor. P is the pressure. AW   ( = h 2 h 1 ) is the difference between the two enthalpy states. Q H and Q L are the high and low heat flux, respectively. Thirty   degrees denotes the low temperature of the system, and 40   ° C ; 80   ° C denotes the high temperature of the system. In the operating condition, as shown in Figure 2, the amount of heat transfer and COP can be obtained using the following equations:
COP = Cooling   Efficiency   of   Evaporator Power   Consumption   of   Compressor   = Q L W ,
Q C = KA T = m ref h ,
Q L = h 2 h 1   h 2 h 1 ,
The equations above are used to investigate changes in the efficiency of the whole system through improving the heat transfer performance by reducing the temperature difference between high and low temperature regions [23].

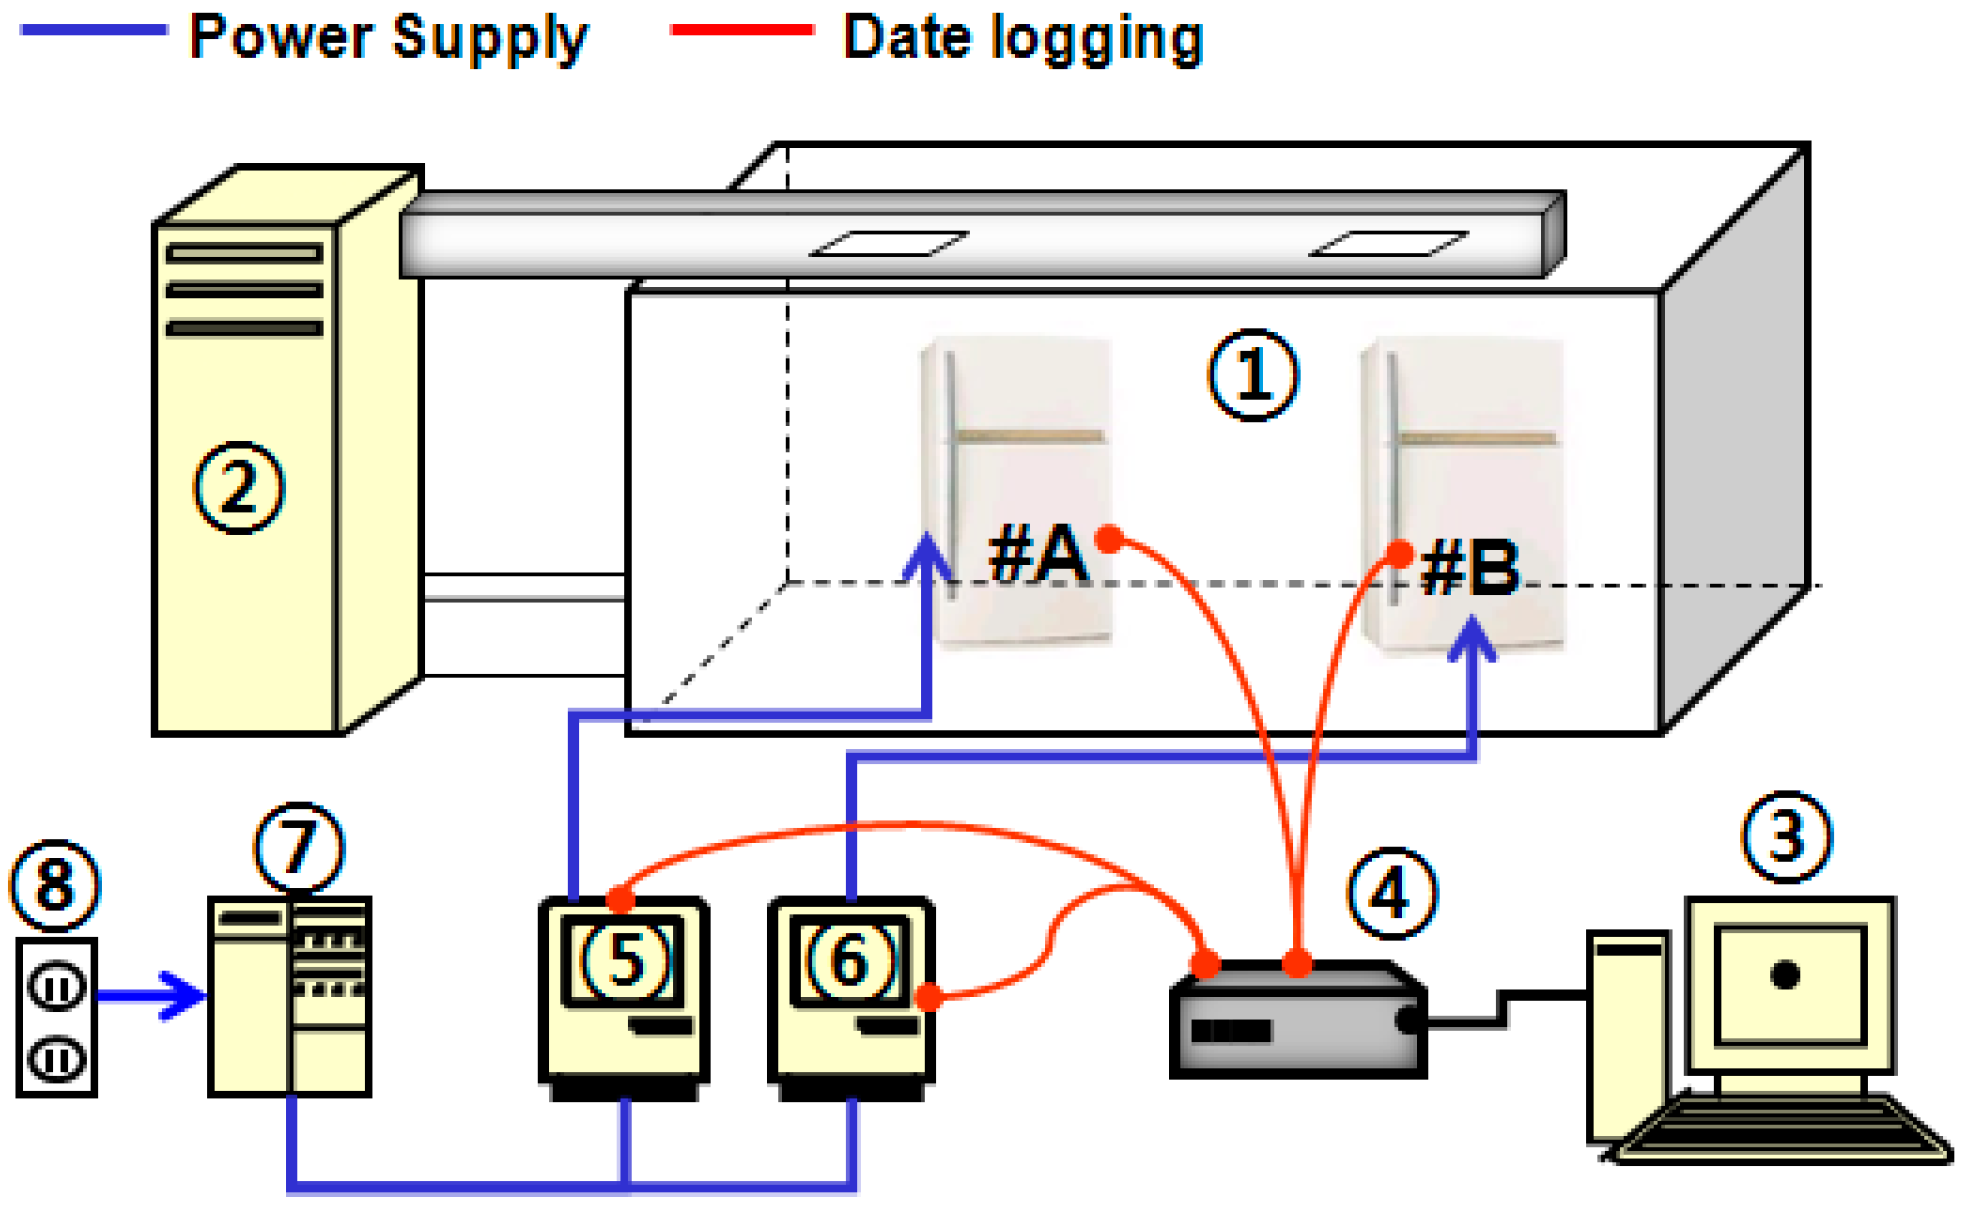
4. Experimental Conditions

Figure 3 shows the arrangement of the experimental apparatus used in this study. The experiment was carried out in a constant temperature and humidity chamber to maintain uniform conditions. Two specimens, #A and #B, were used under the same room conditions to ensure the accuracy of the experiment. In addition, the system consisted of a logger that configures 60 channels for measuring the temperature inside the MCR and the surface temperature of the compressor and condenser, a power meter that measures the power of these specimens, and a static voltmeter that was able to provide a uniform voltage [21].
The specification of the constant temperature and humidity chamber and instruments are presented in Table 1. In the experimental conditions, the temperature inside the constant temperature, and humidity chamber and relative humidity were configured as a specific range based on the standard for the test of a refrigerator. Furthermore, a T-Type thermocouple was connected to the logger, the surfaces of the compressor and condenser installed inside the refrigeration chamber and MCR, and inside the MCR to measure the temperature [22,23].
In addition, the power that was applied to each specimen was measured using a voltmeter in which the output port of the voltmeter was directly connected to the logger. Figure 4 shows the compressor On/Off cycle of the defrost state of the refrigerator. From the figure, it can be seen that the defrost peak occurred twice. The first peak occurred initially at 1 h, and the second peak occurred during the 15th h. The figure also shows the temperature of the refrigerator ranging from 0   ° C to 20   ° C . As shown in Figure 4, the internal temperature of the MCR and the surface temperature and power of the compressor and condenser were measured by configuring a stable region between the processes for removing frost. The measurement was repeated five times for each condition and determined as an ensemble average.

5. Numerical Analysis

5.1. Governing Equations and Numerical Solutions

This study was performed under the assumption that the fluid flow type inside the MCR represents a three-dimensional steady state, incompressible, and turbulent flow. The physical properties of the working fluid were kept at a constant level for temperature and pressure for numerical calculation. Due to the disturbance of the fluid by the cooling fan, the flow in the machine room will behave in a complex manner. Therefore, the standard k ε turbulence model that represents excellent estimation performance in an internal flow analysis that has been widely adopted was used to perform flow analysis in the refrigerator machine room [9,10,24]. The governing equations were composed of the continuous equation, the momentum equation, the turbulent kinetic energy equation, and the turbulent kinetic energy dissipation rate equation, and are as shown in the following Equations (5)–(10) [25]:
u i x i = 0 ,
u i t + u j u i x j = 1 ρ p x j + ν 2 u i x 2 j ,
ν t = C μ k 2 ε ,
where ν t is the turbulent viscosity, C μ is the constant. k and ε can be obtained from the following equations for turbulent kinetic energy and turbulent dissipation rate, respectively
u j k x j = x j { ( ν + ν t σ k ) k x j } + P k ε ,
u j k x j = x j { ( ν + ν t σ ε ) ε x j } + ε k ρ ( C ε 1 P k C ε 2 ε ) ,
Here, C ε 1 , C ε 2 , σ ε , and σ k are model constants. P k is the turbulence generation term according to viscosity and buoyancy and is defined as follows:
P k = ν t u i x j ( u i x j + u j x i ) ,
where the coefficients were defined as follows.
C μ = 0.09 , σ k = 1.0 , C ε 1 = 1.44 , C ε 2 = 1.92 ,

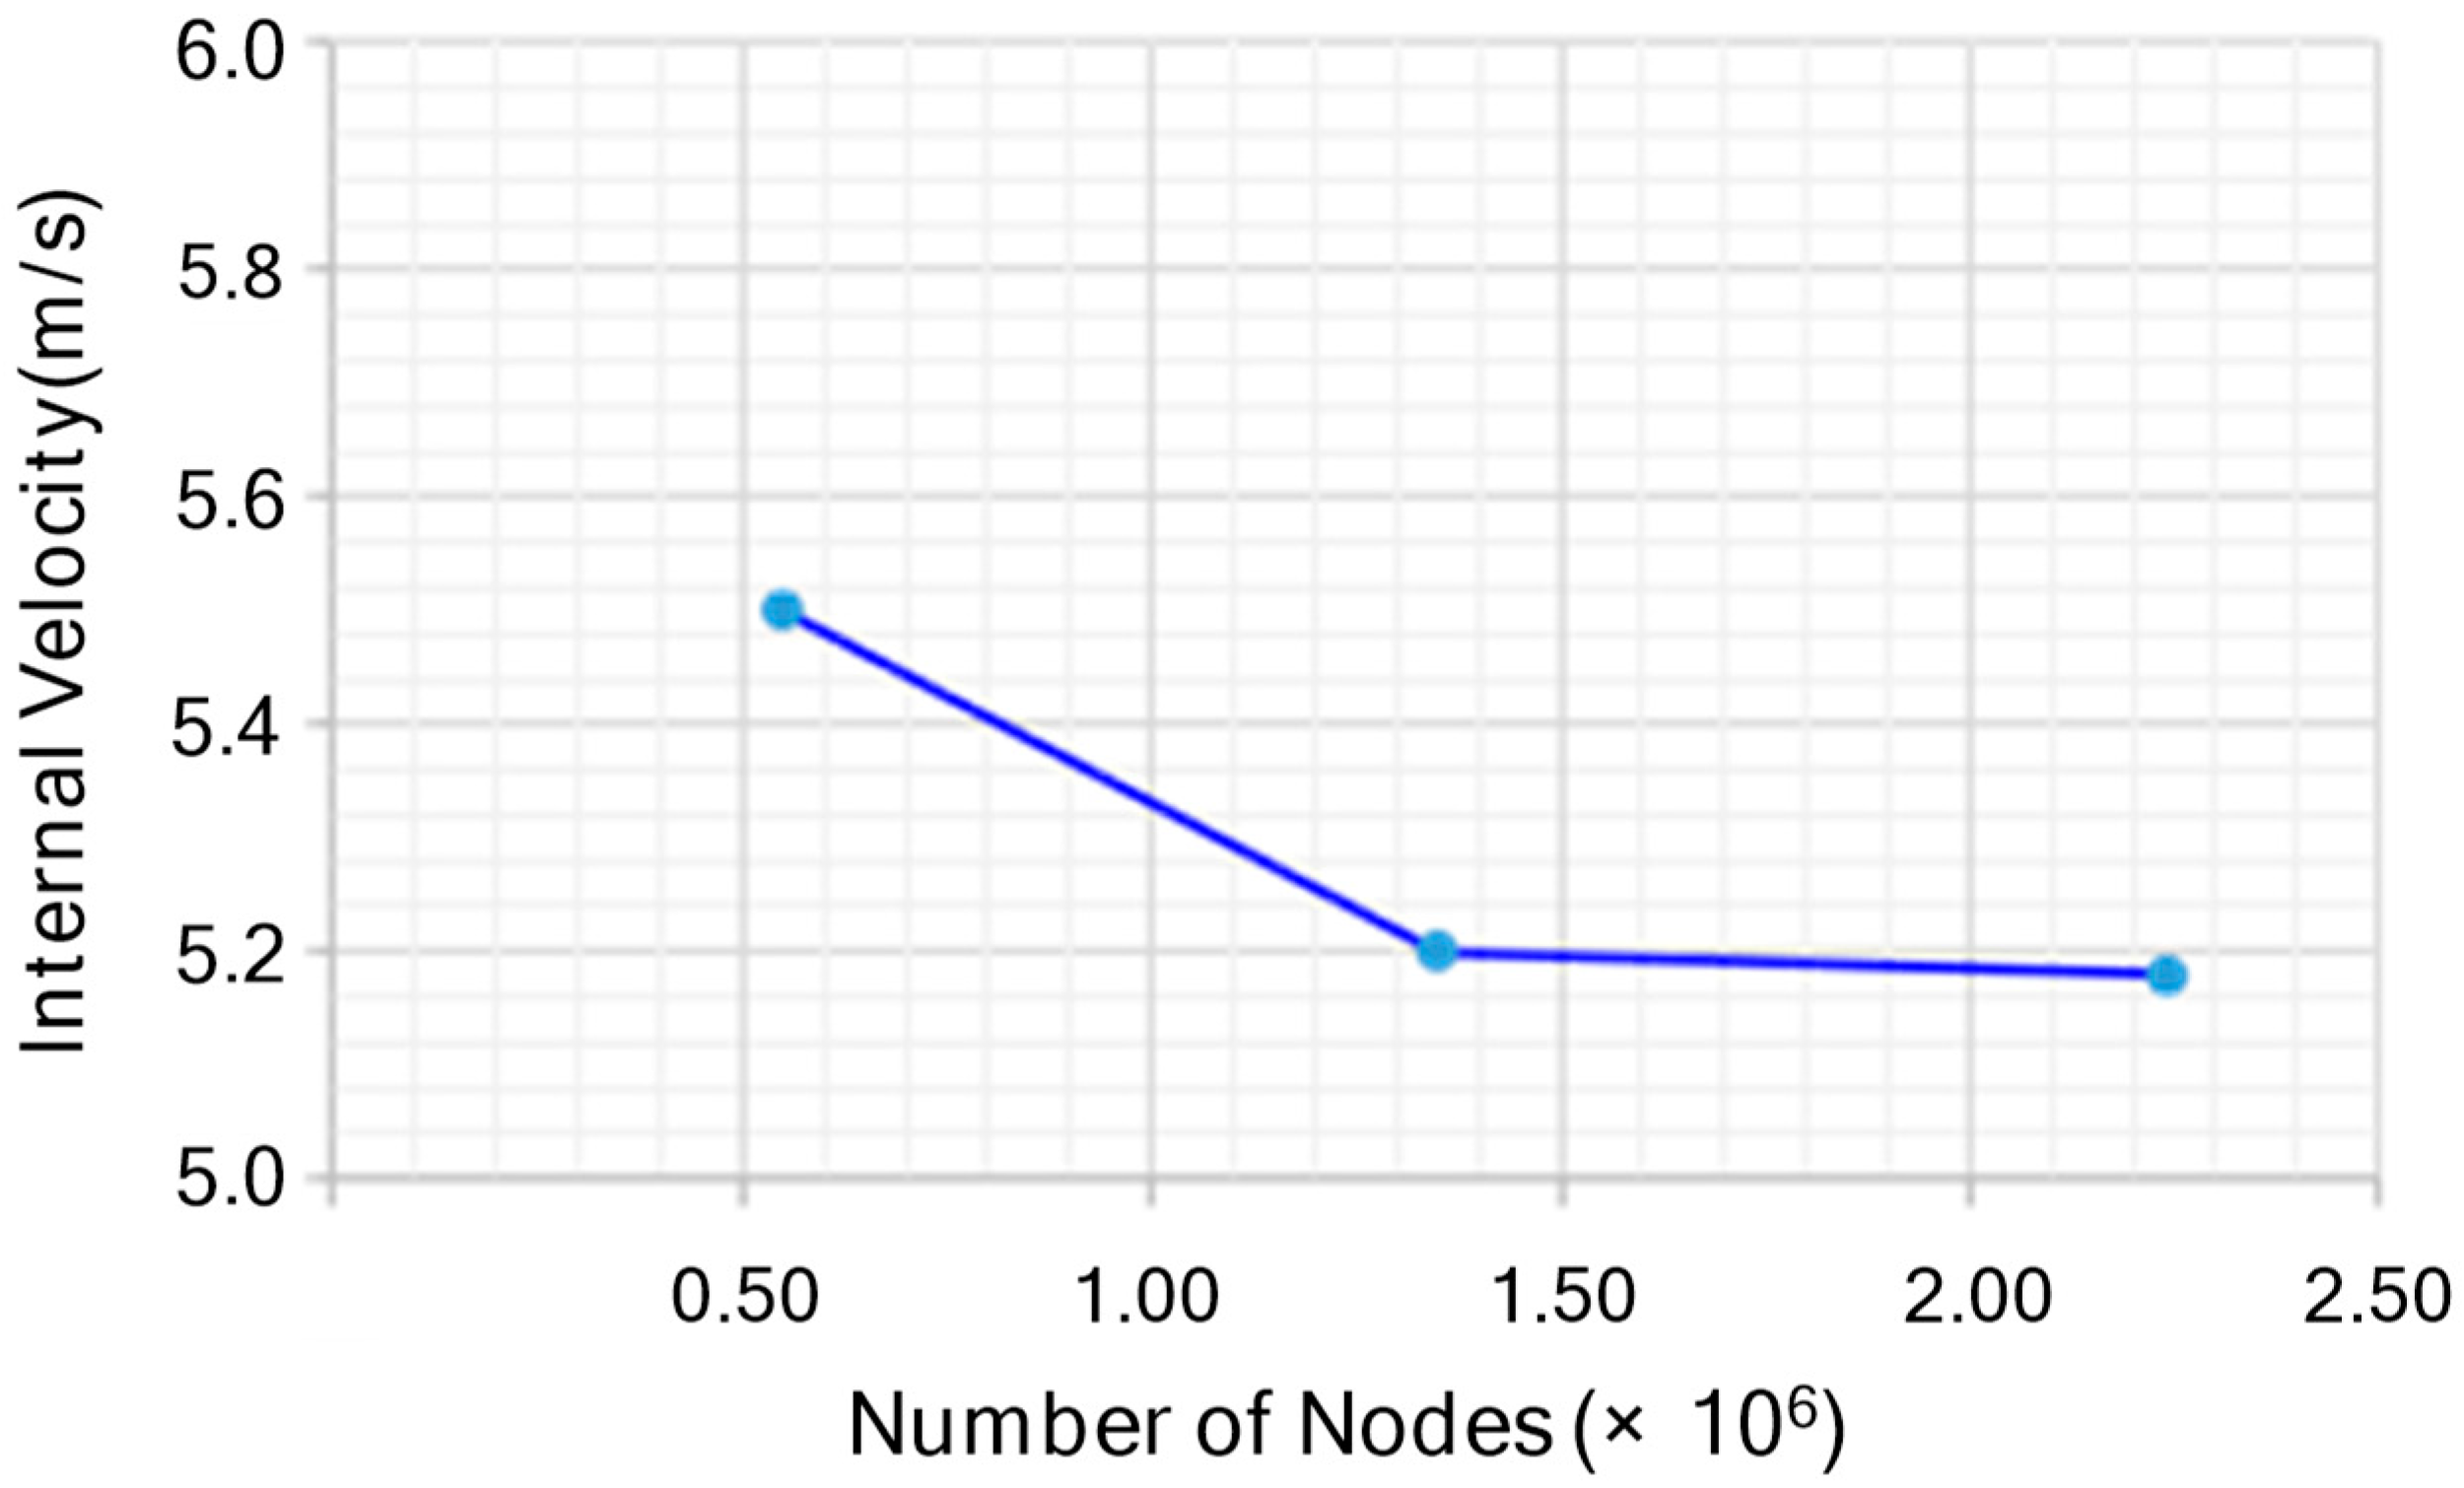
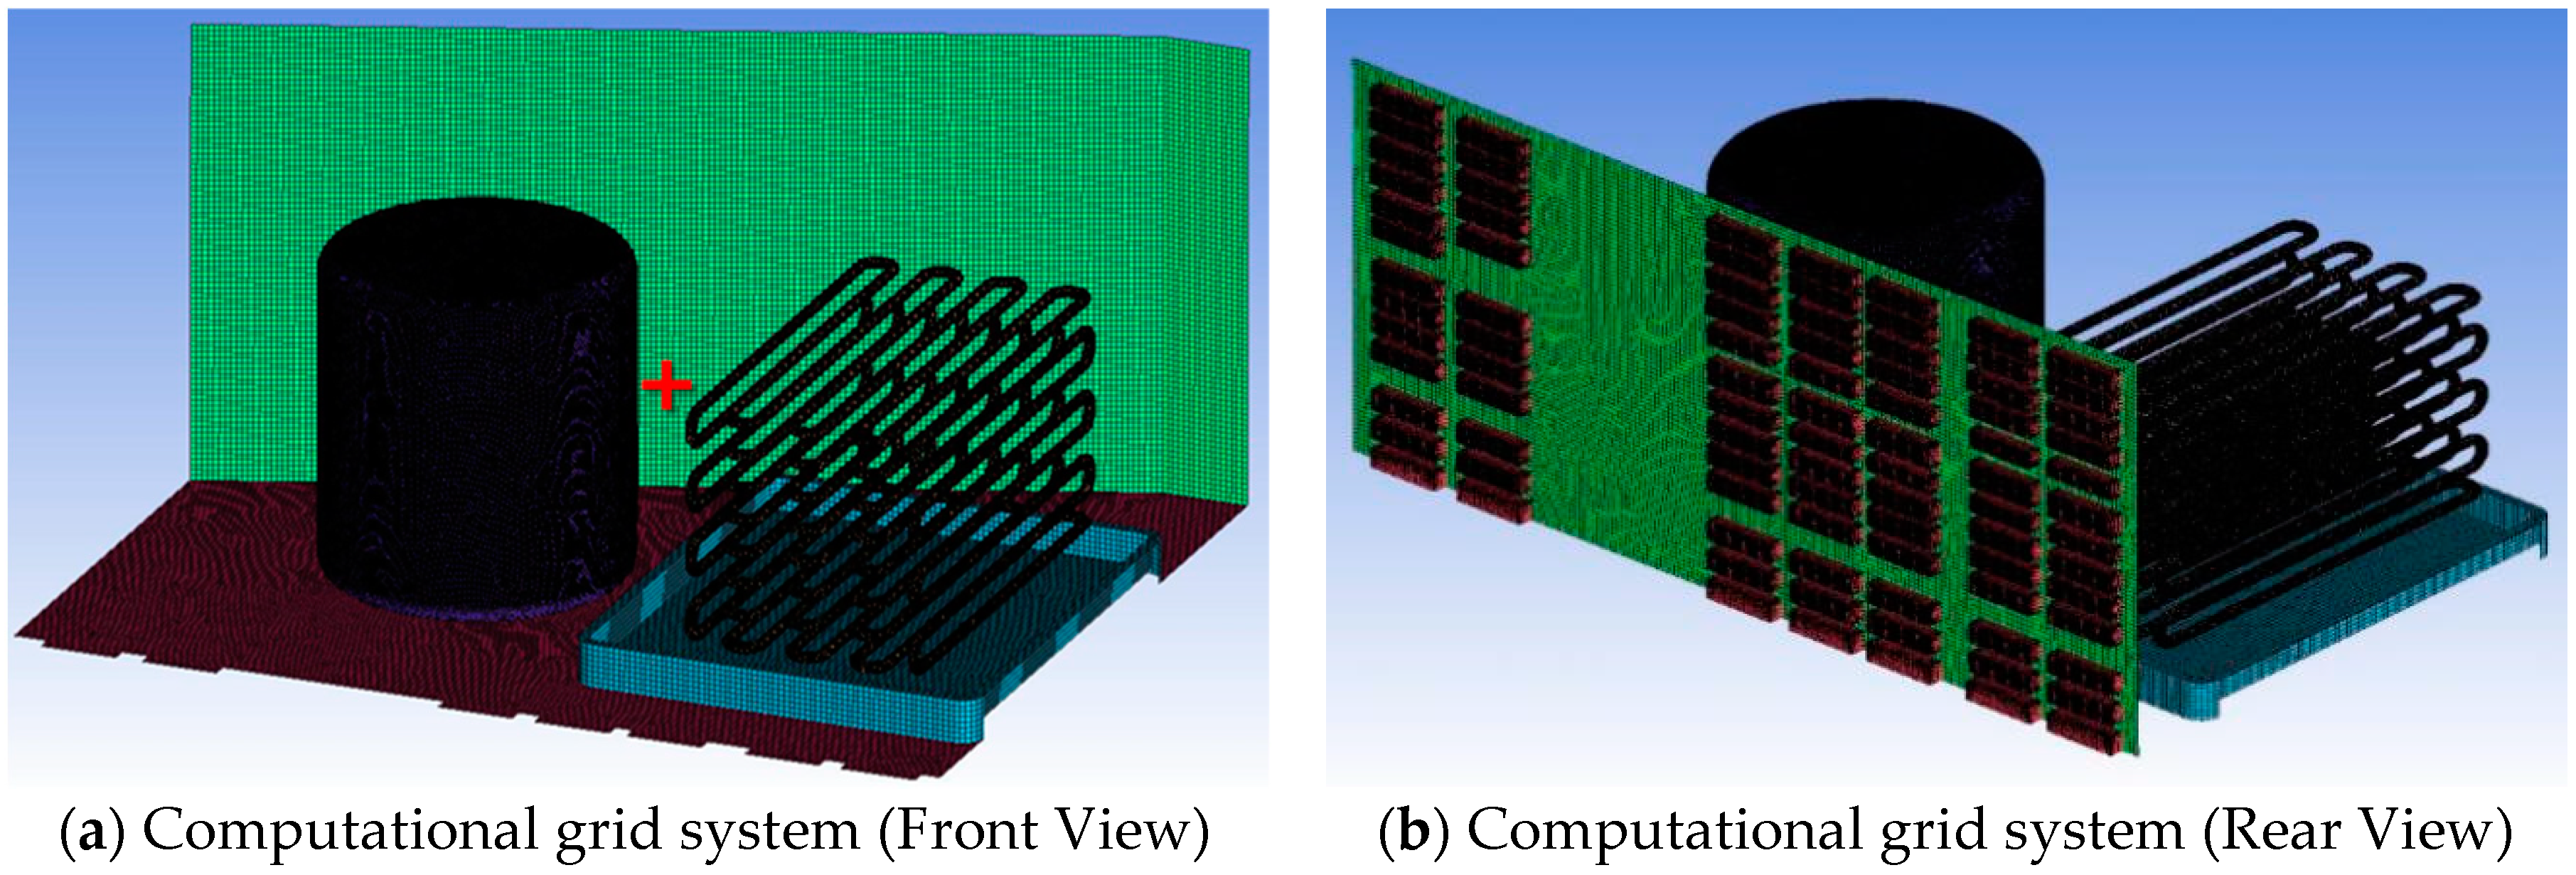
5.2. Computational Domain and Grid System

In this study, the total number of grid elements was 1,350,000. To investigate the change in the result value according to the number of grids, the grid elements were gradually increased from a small number. In the case of 551,000 grid systems, changes in flow distribution trends and internal velocity values in the fan and condenser were reduced (grid number 1,350,000), and changes in numerical calculation values, such as flow and velocity, became constant in more than 2,239,250 grid elements. Therefore, 1,350,000 grid systems were adopted in this study, as shown in Figure 5. Figure 6a,b shows the front and rear view of a computational grid system of the MCR. From Figure 6a,b, the arrangements of the compressor, condenser, and the CBM can be visualized. The internal velocity was measured between the compressor and condenser, as shown in Figure 6a.
The governing equations were a type of continuously composed governing equations and were analyzed using the commercial CFD software ANSYS-CFX 16.2 [26,27]. The elements used in the calculation were a type of hexahedral elements, about 1,350,000, as shown in Figure 6. Moreover, a type of non-staggered grid system that determines pressure and velocity at different points was used to perform a linked calculation in pressure and velocity [5]. The CFX integrated coupled solver (pressure and velocity) was used as the solution method in this study.

5.3. Boundary Condition

The discharge from the MCR was configured as an atmospheric condition, and the inflow by air through a fan was applied to the calculation by transforming the components measured using laser Doppler velocimetry (LDV), such as the velocity components of the fan along the axial, rotational, and radial directions of a cooling fan into X, Y, and Z components, respectively, in the Cartesian coordinate system [12,28]. The ideal air gas model was used in this study. The root mean square (RMS) convergence criterion was set to 10−4. The following equations are approximate equations for each test point using the velocity components calculated by using the LDV. The equation can be used to calculate the velocity for each point of the fan.
V ( a ) = 145232 X 3 + 880.56 X 2 + 11.54 X   0.35 ,
V ( θ ) = 45170 X 3 + 4474 X 2   38.64 X   +   0.49 ,
V ( r ) =   64420 X 3 1775.73 X 2   29.55 X +   0.69 ,
where V ( a ) is the velocity component along the axial direction, V ( θ ) is the velocity component along the circumferential direction, and V ( r ) is the velocity component along the radial direction, and they correspond to X, Y, and Z components, respectively, in the Cartesian coordinate system.

6. Experimental Results and Discussion

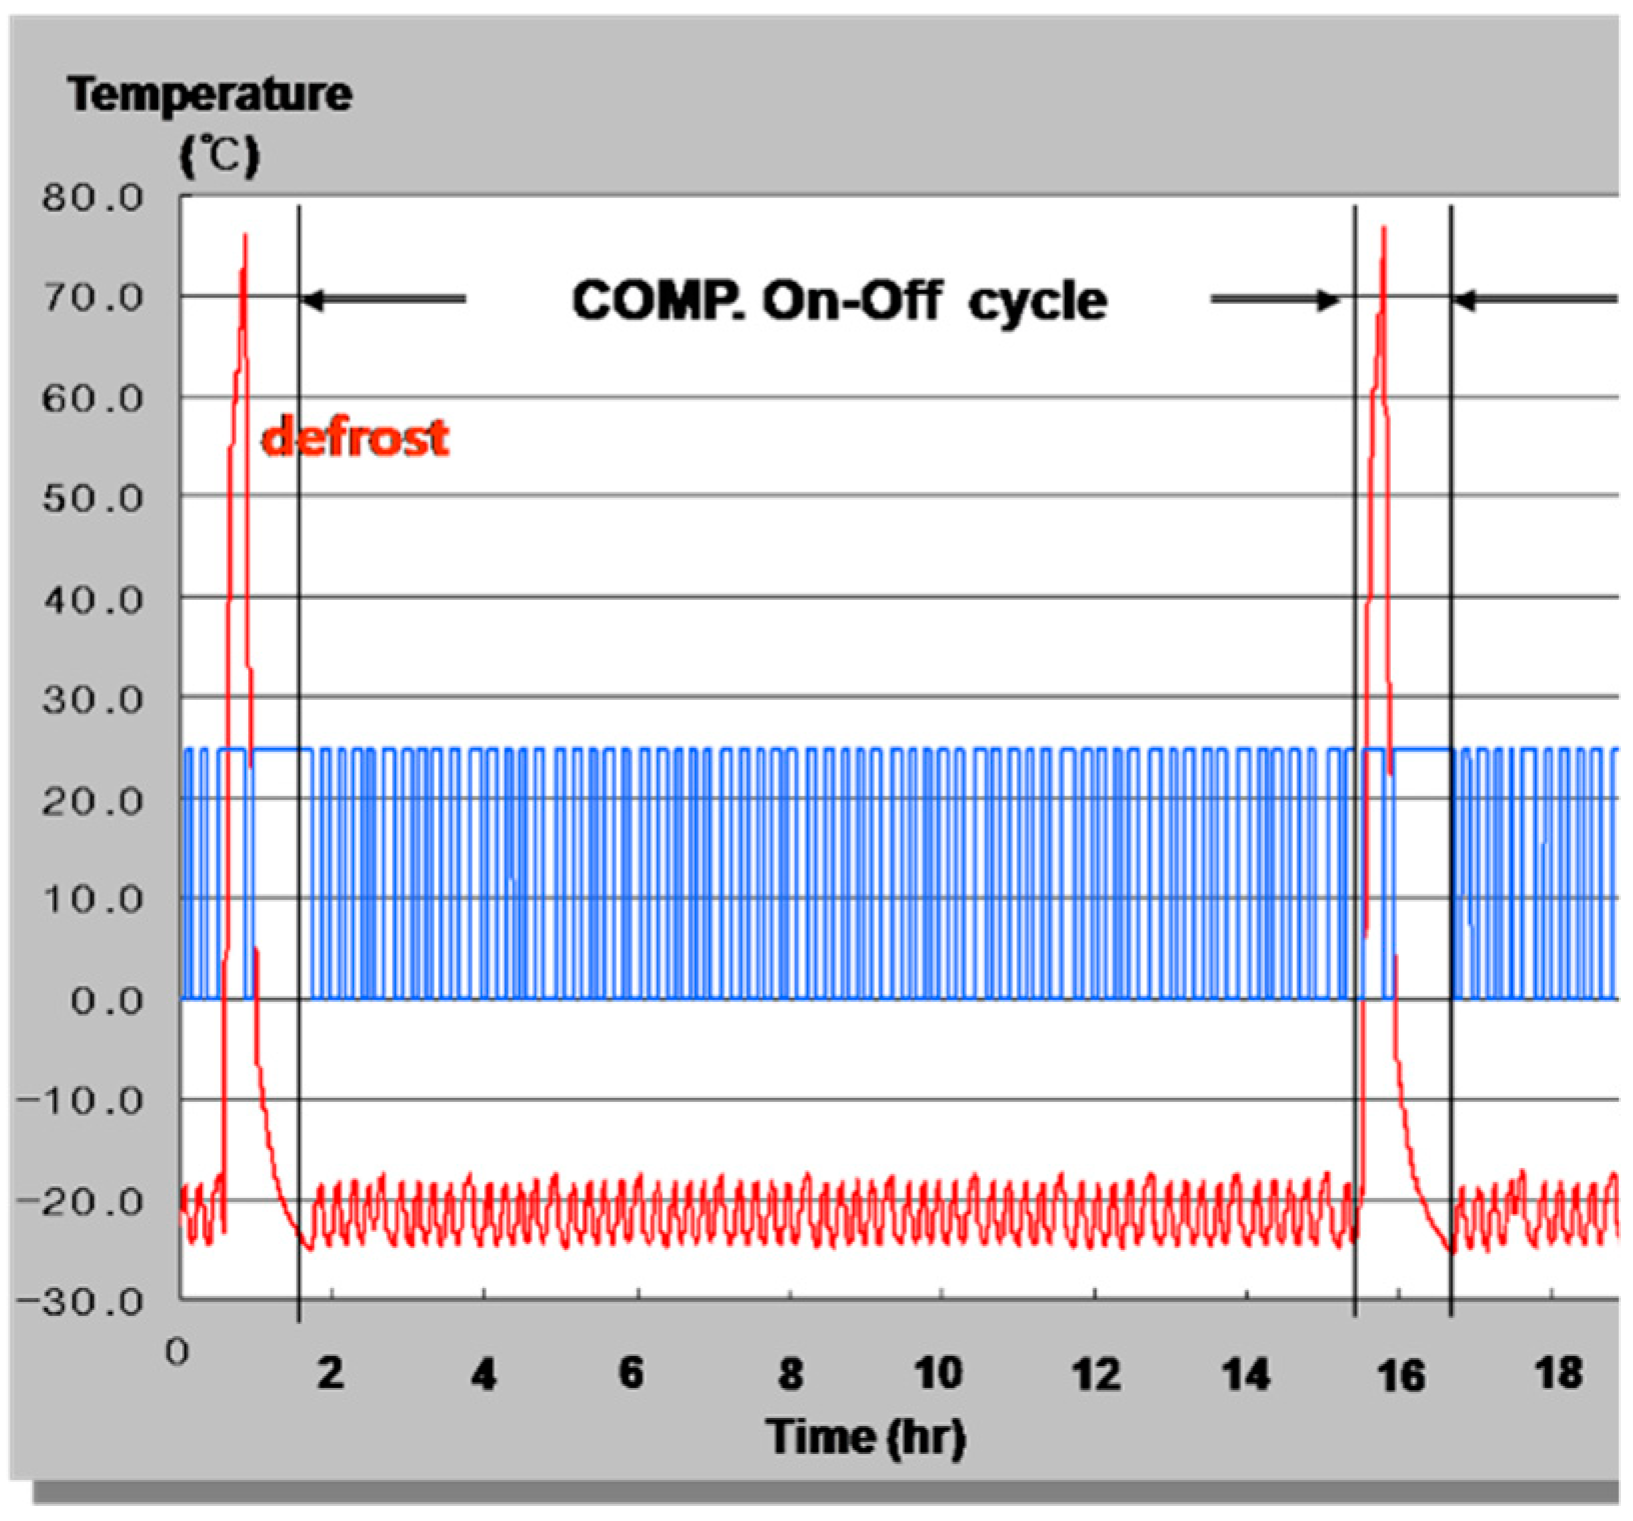
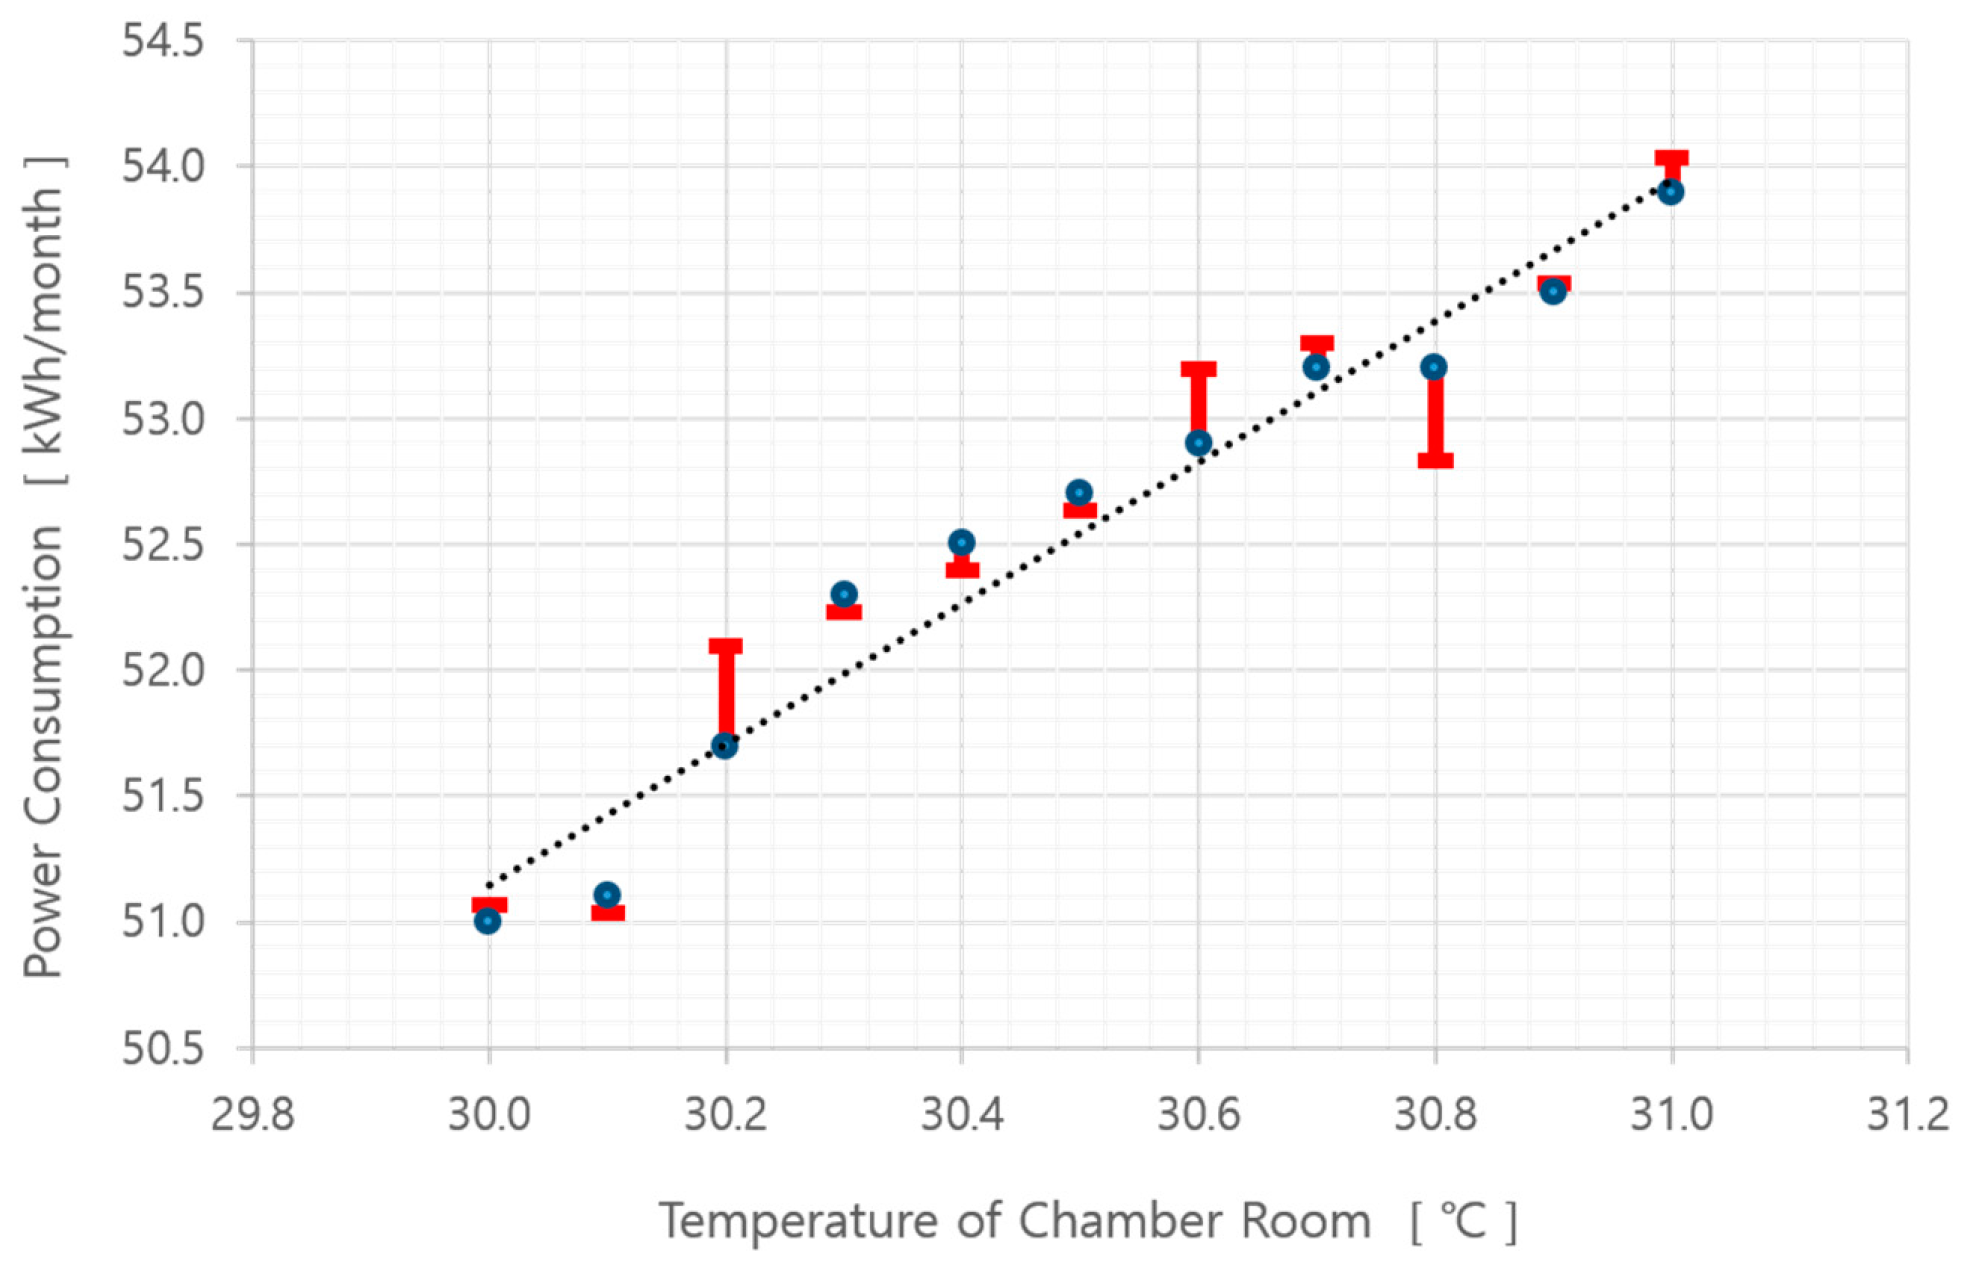
6.1. Power Consumption and Inner Temperature of Chamber Room

Figure 7 shows the power consumption for various temperature conditions of standard KS C 9305. From the Figure, it can be seen that the cause of an increase in power consumption was due to the increase in the chamber room temperature. As the temperature was raised by 1 °C, the power consumption was increased by 2 kW/month. The value of the power consumption can be calculated using the linear fitting function Equation (15).
y = 2.06 x 12.67 ,

6.2. Improvement of MCR Flow Line

The characteristics of the MCR will cause heat transfer due to the forced convection if the flow line in the chamber is improved. By improving the flow line, it was possible to ensure more wind was received by the condenser by adjusting the flow line of the upper space of the condenser. In the improvement in the flow line, as shown in Figure 8, a box was attached to the upper wall of the MCR in which a 15 mm gap was left on the upper side of the condenser to avoid contact with it not to generate an insulation effect on its surface. Furthermore, the space between the compressor and the condenser where the flow finally passes through was configured as a curved surface to present a smooth flow.
The temperature of the compressor and condenser installed inside the MCR for the original model was 53.9 ° C and 43.2 ° C , respectively. The temperature of the compressor and condenser for the improved model was 53.7 ° C and 43.0 ° C , respectively. Regarding the distribution of the average temperature of the specimens #1 and #2 inside the MCR in the improved model compared to that of the conventional model, the condenser showed a decrease in the temperature of 0.2 °C, and the compressor represented a decrease in the temperature of 0.2 °C. Thus, it represented an effect that decreased the monthly power consumption by 0.2 kWh, in which the reduction rate was 0.4%. By improving the internal flow line, it showed a decrease in the temperature of the whole surface of the condenser. Moreover, it is expected that the exit of the compressor that corresponds to discharge pipes also represented a decrease in the temperature. It is due to the fact that the flow, which had a high-speed element, progressed to the compressor via the condenser, except for the flow that intermittently passed through it in the resistance determined by the shape of the condenser by optimizing its upper space for the flow that progresses to the compressor. In addition, it was verified that the temperature in the condenser and compressor decreased due to the improvement of the flow line inside the MCR. Table 2 shows the reduction in power for the modified model when compared to that of the original model.

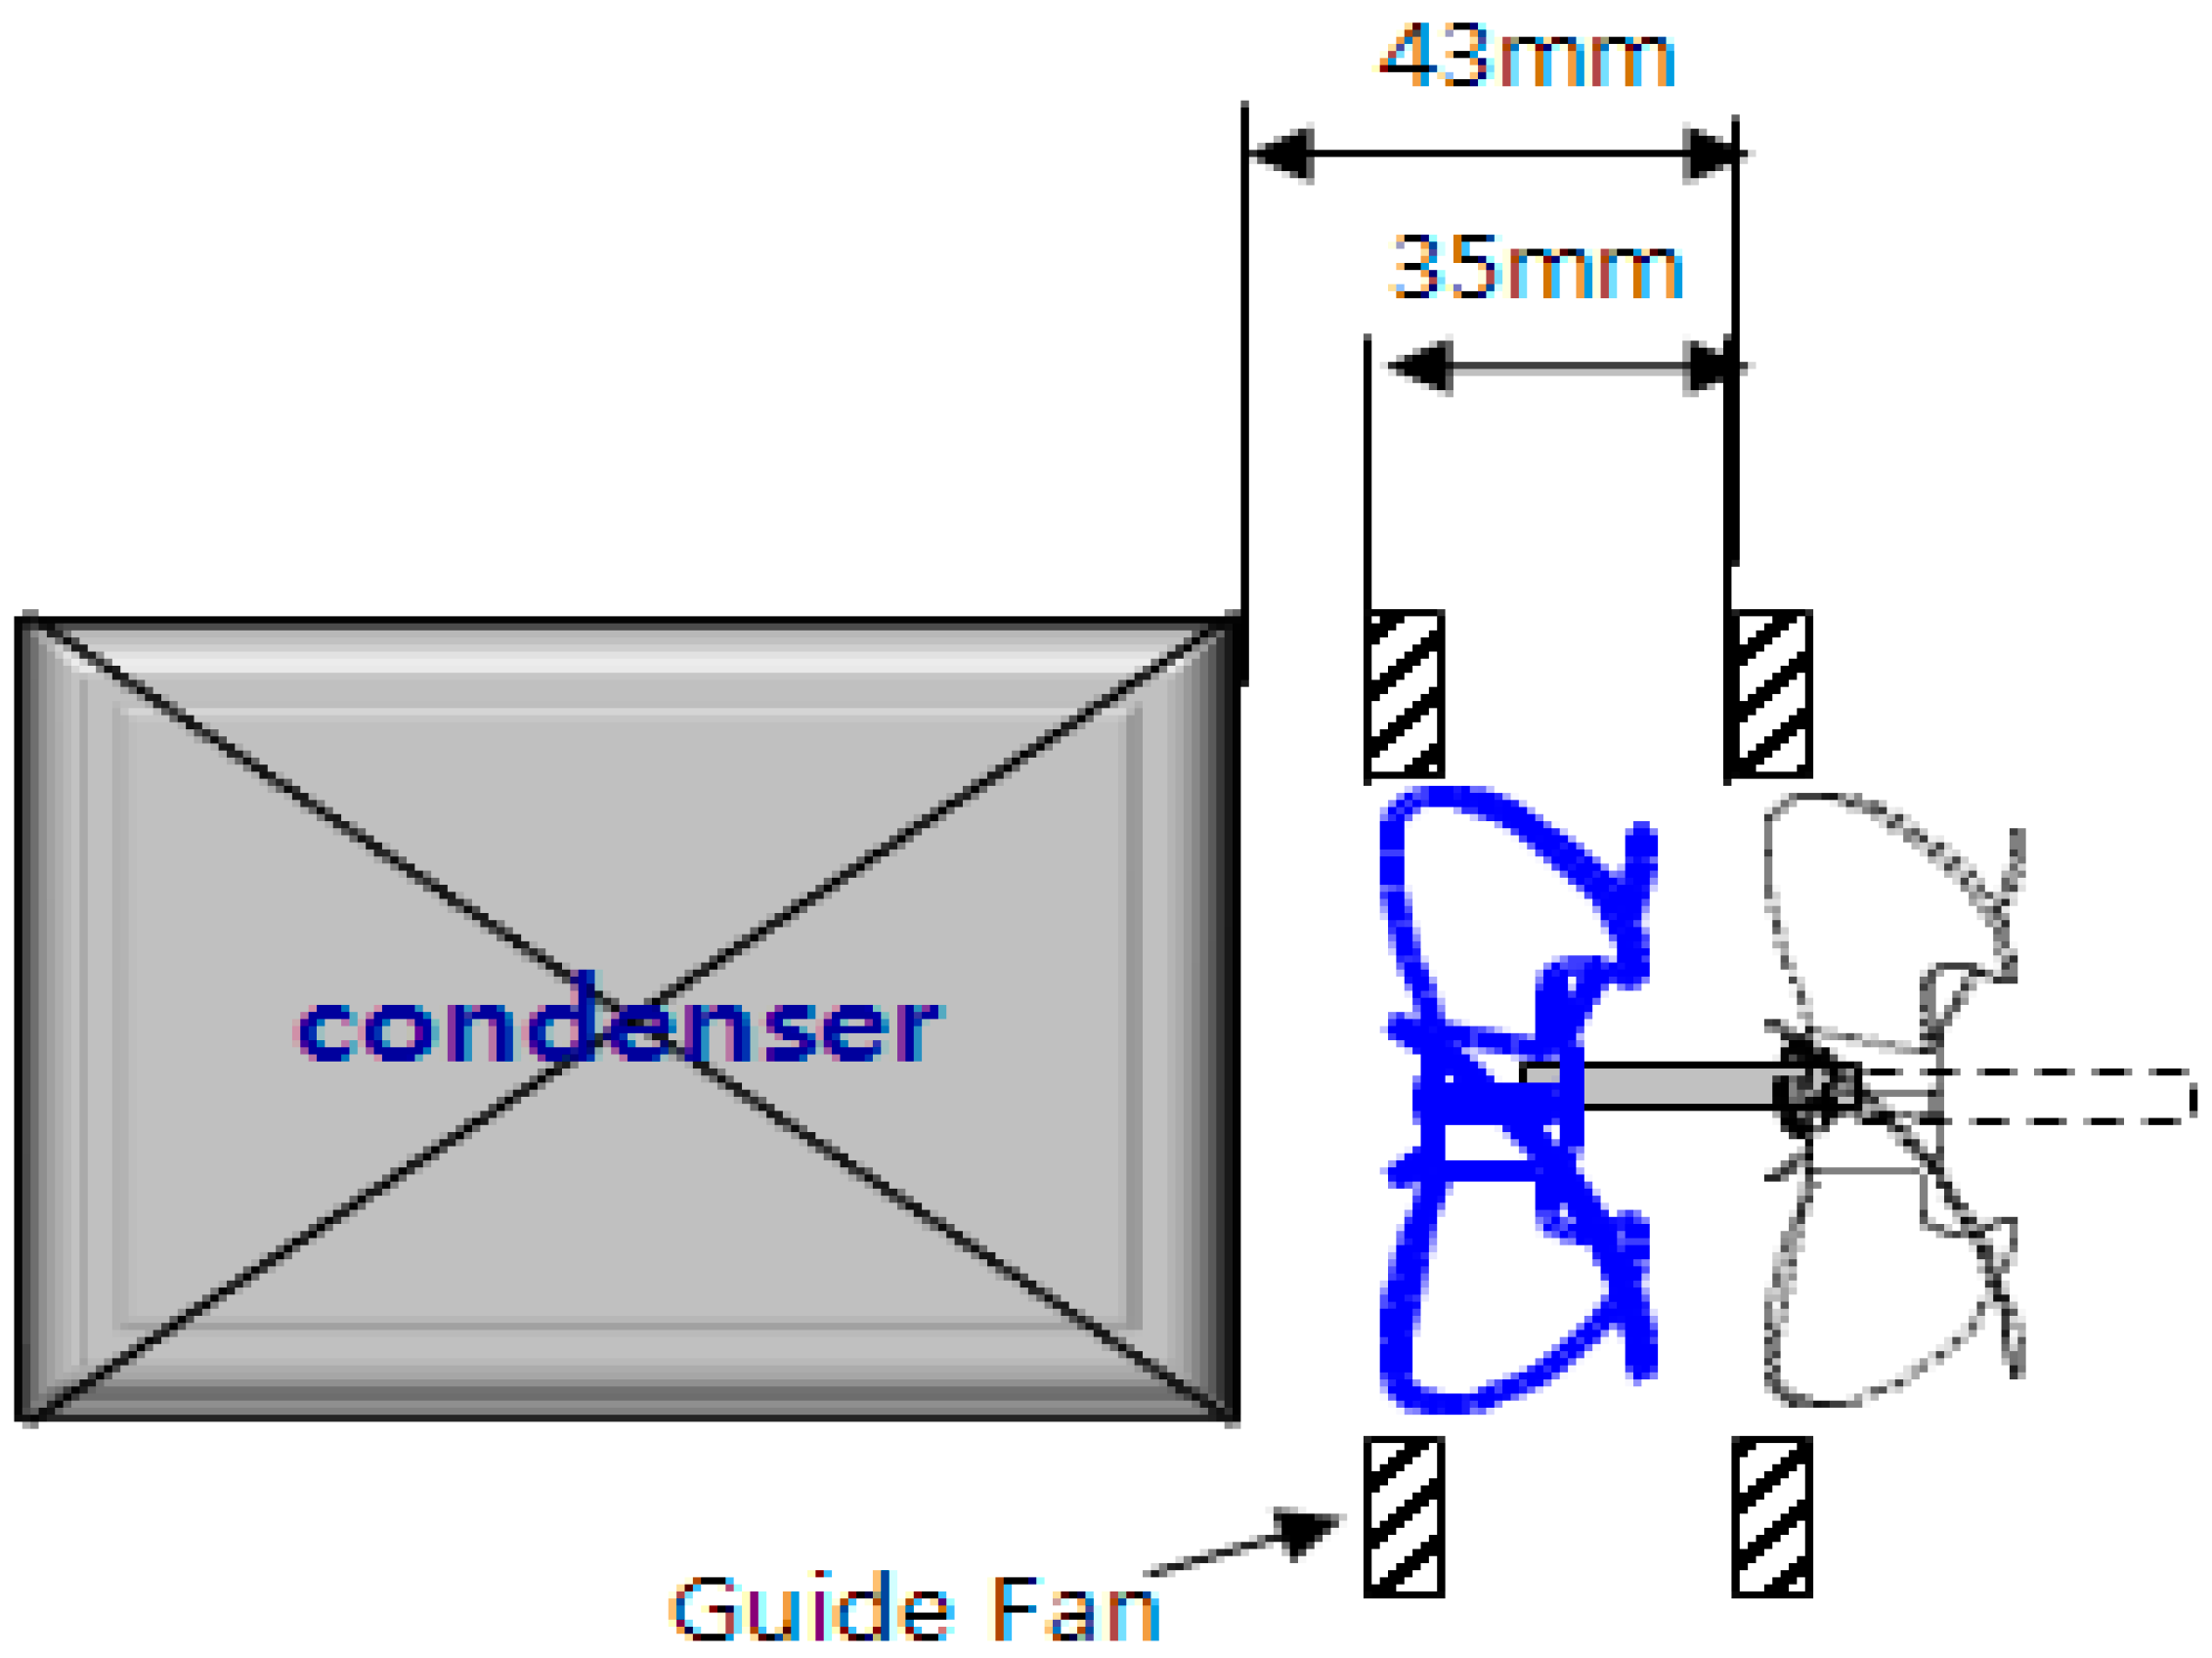
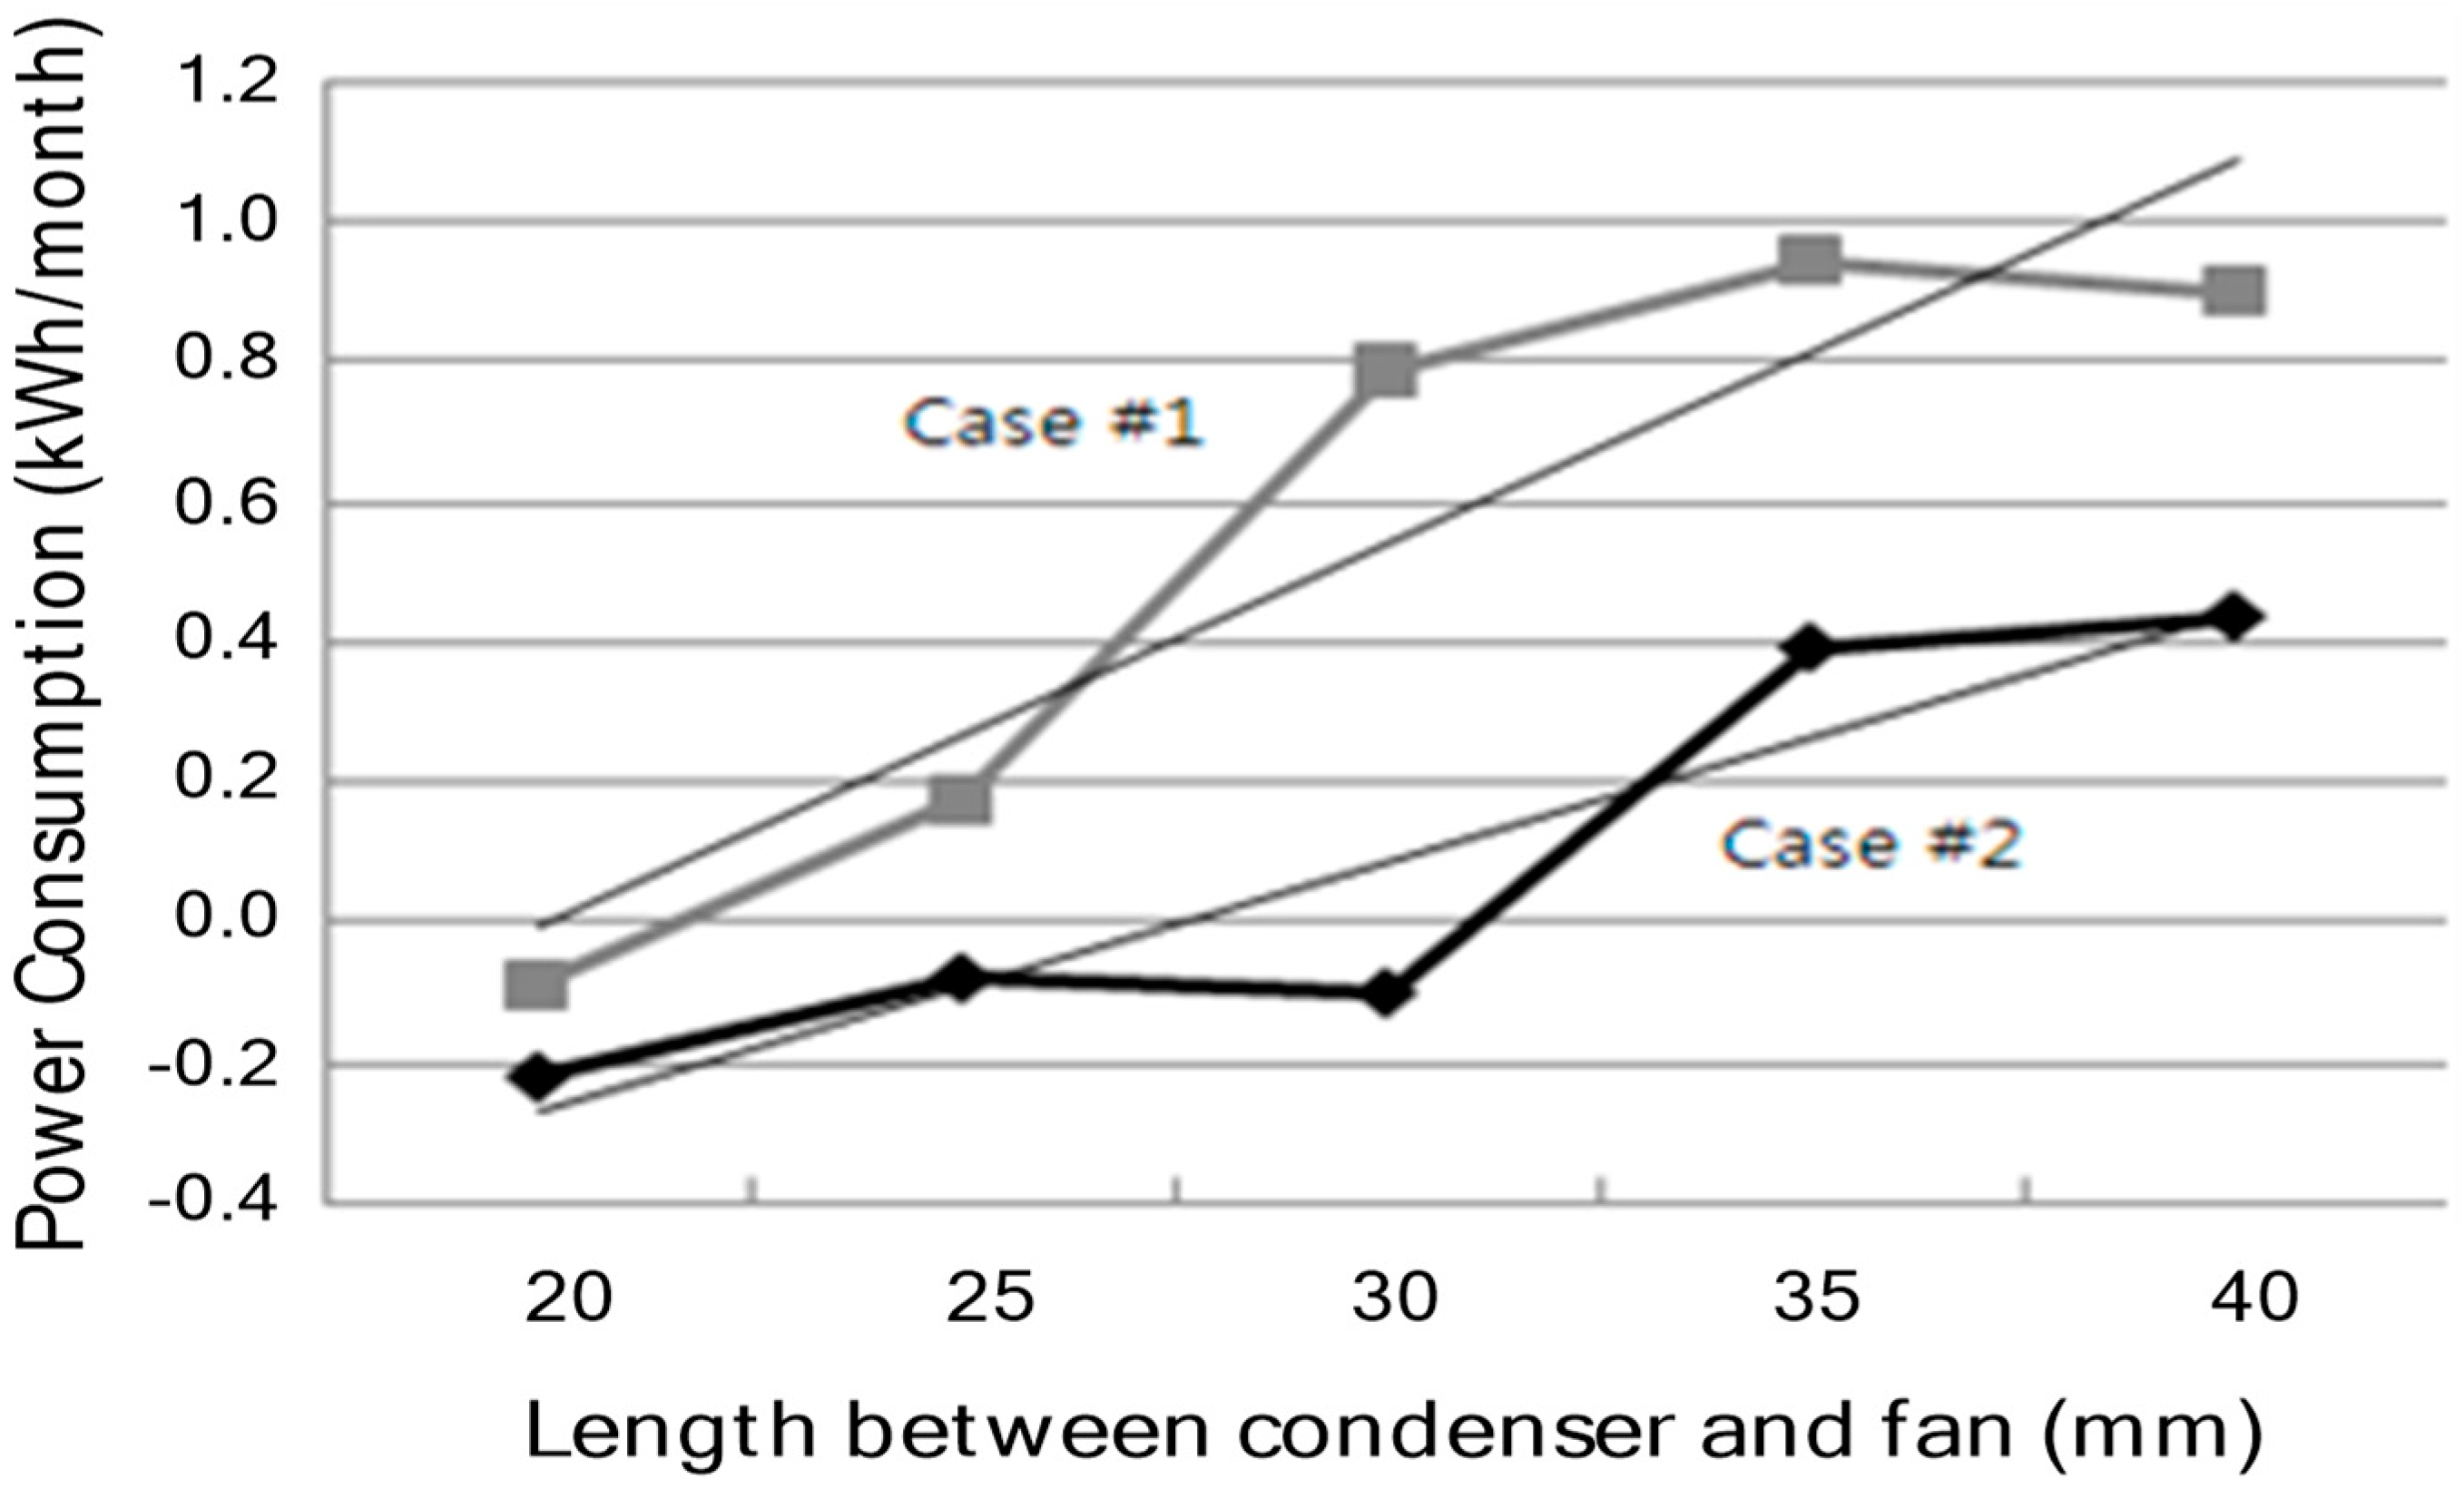
6.3. Change in Position of the Cooling Fan

The hot air in the MCR is discharged using a cooling fan. Thus, the airflow and internal flow rate can be varied according to the position of such a cooling fan, and this leads to present a difference in the heat transfer performance. As illustrated in Figure 9, the experiment was performed by adjusting the position of the cooling fan from a maximum of 40 mm to a minimum of 20 mm, with an interval of 5 mm referenced on the condenser.
In the experimental results of the monthly power consumption, as shown in Figure 10, the power consumption decreased when the position of the fan was closer to the condenser. Thus, it can be seen that the interval determined by 20 mm represented the highest efficiency. However, it is necessary to configure the position of the fan by considering the structure of the MCR as it is not possible to reduce the distance due to its structure excessively.

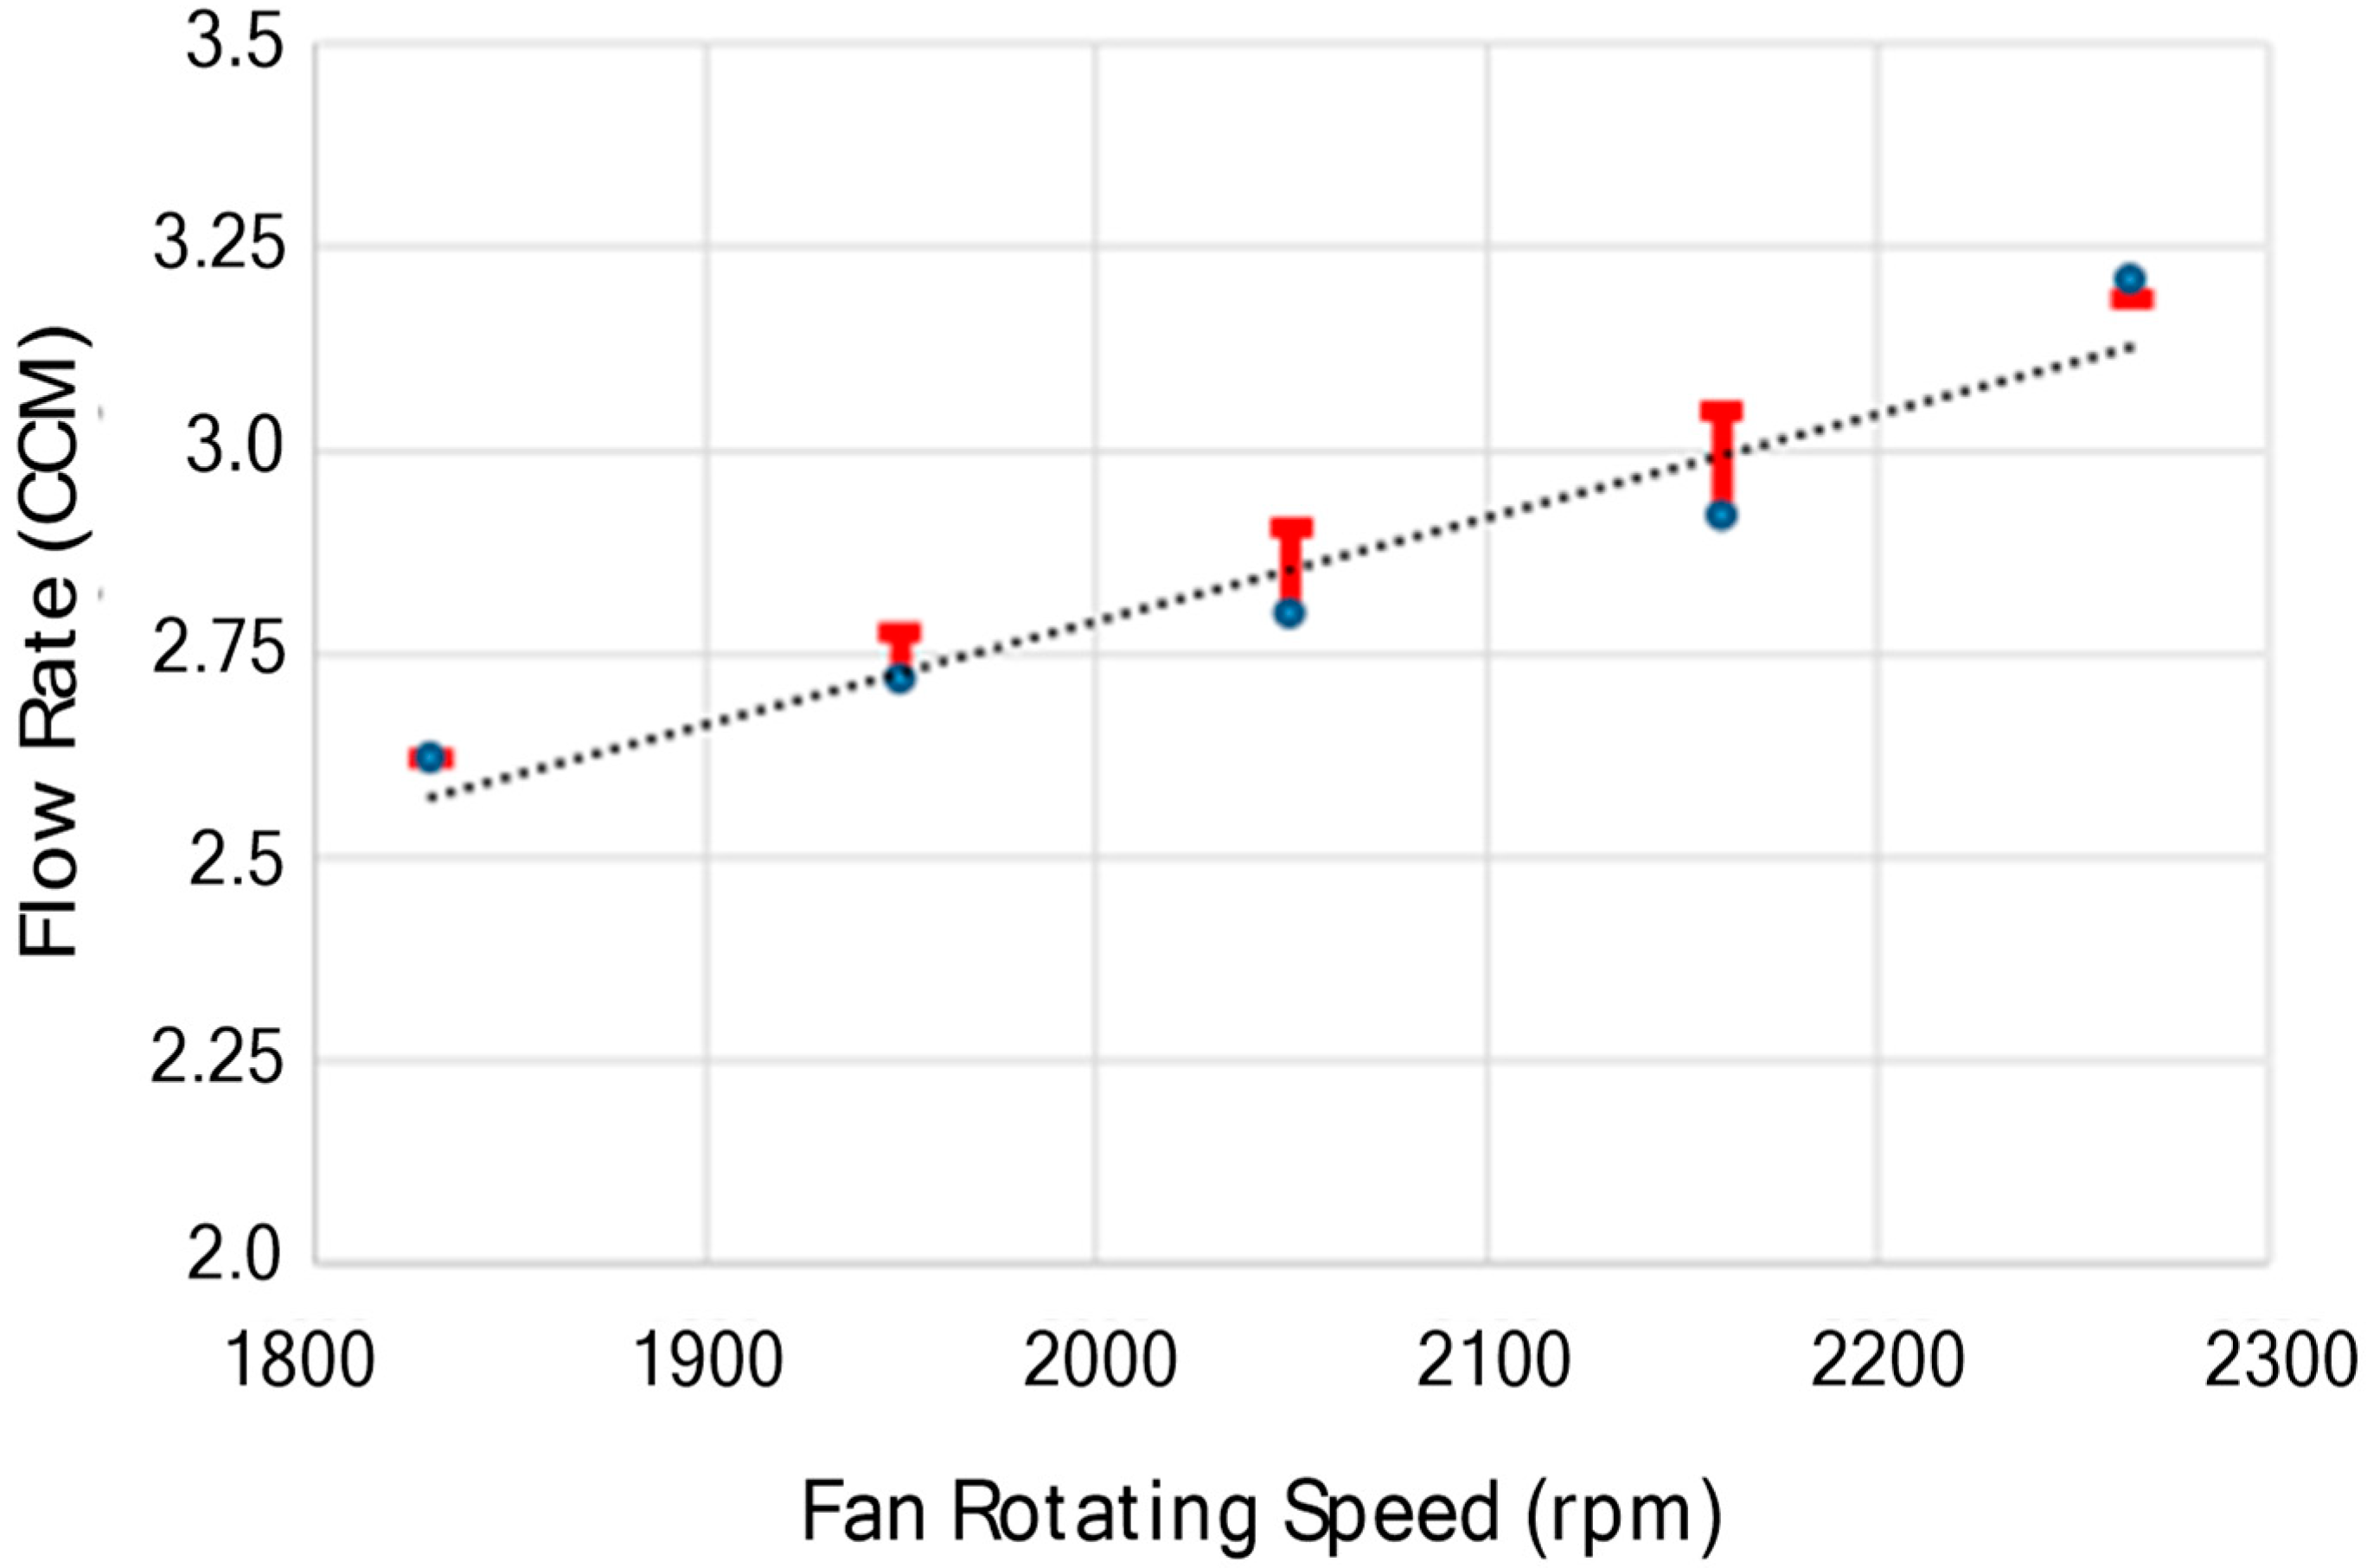
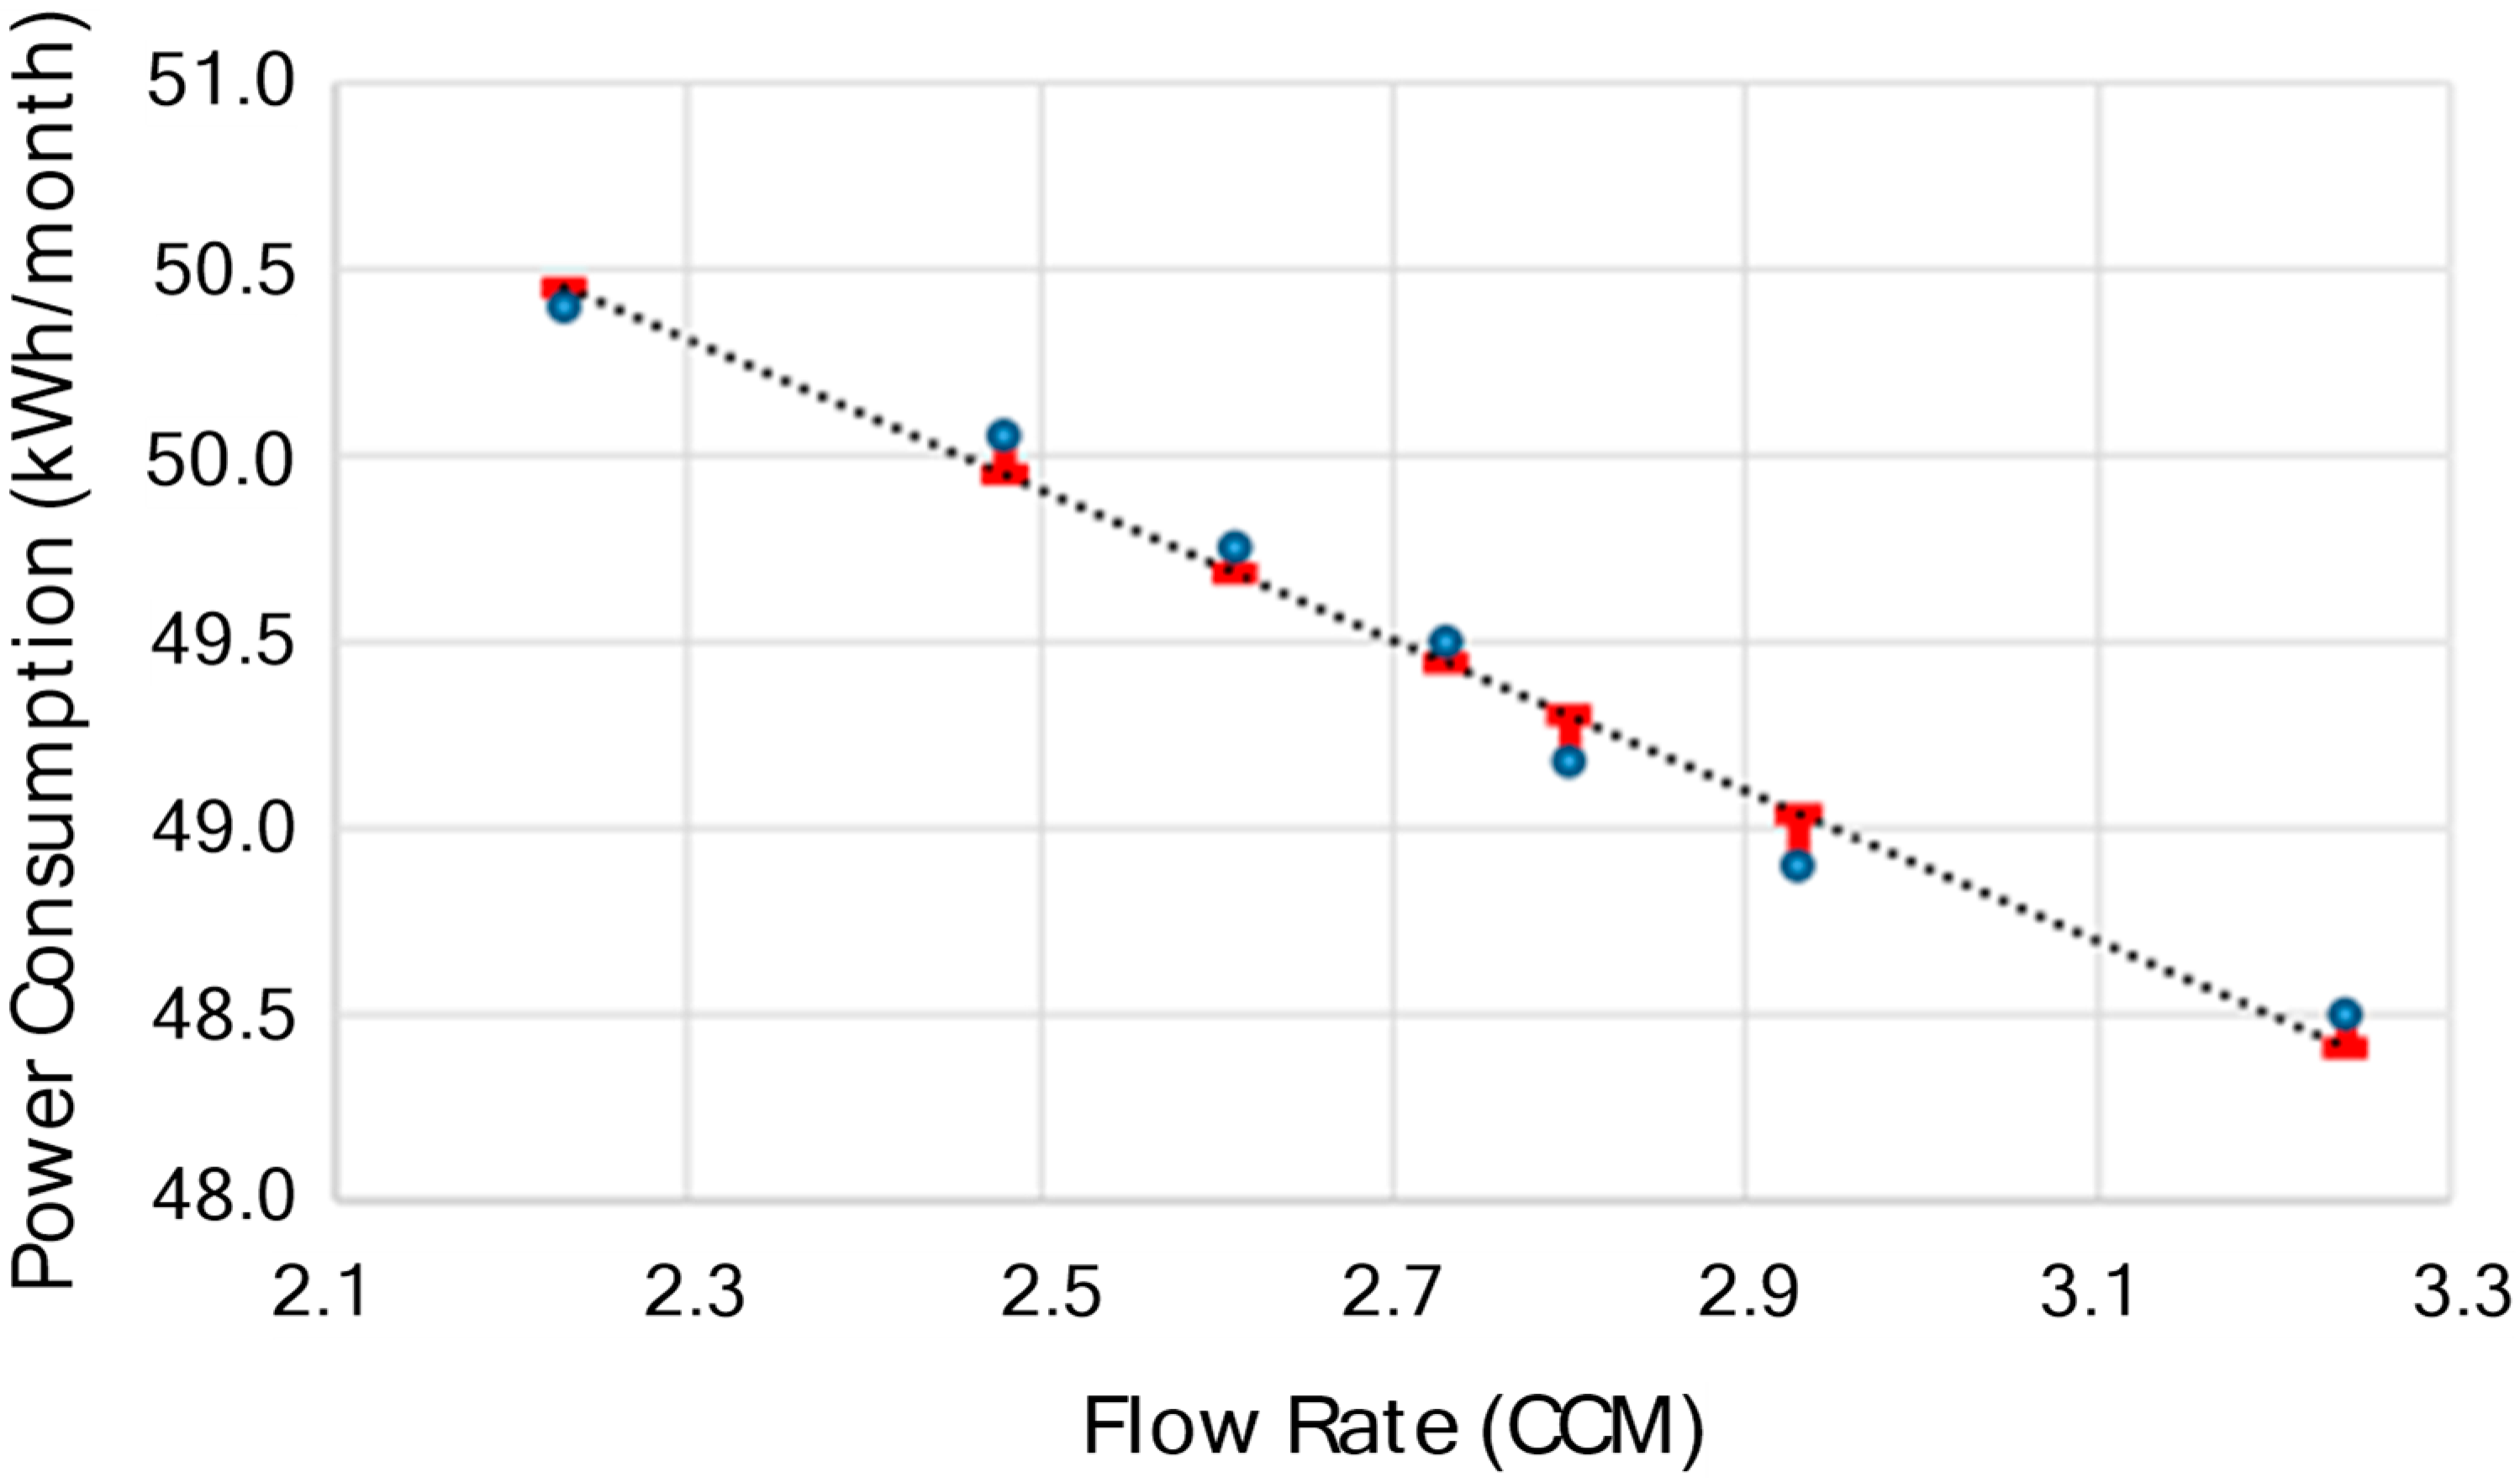
6.4. Optimization of Fan Flow Rate

The airflow discharged from the fan inside the MCR becomes an essential factor for determining the performance of the whole heat transfer. In addition, the determination of an optimum condition for the fan operation is very important to improve the whole efficiency of the refrigerator because the power consumption operated by the fan according to the airflow represents large differences.
The airflow of the fan was obtained under the same conditions for a single product/system. The measurement method of the airflow for a single product/system was measured after adjusting motor revolutions per minute (RPM) of the motor. The RPM could be adjusted by controlling the frequency and voltage of the motor. This study applied a voltage-controlled adjusting method. The airflow of the fan was measured according to the position of each fan as an average value in which 20 points were determined for measuring the airflow. Furthermore, the airflow converted as the measured value was presented, as shown in Figure 11.
Figure 12 illustrates the results of the measurement of power consumption according to the airflow of the fan. The power consumption decreased as the airflow of the fan increased. It brought a decrease in the temperature of the compressor and condenser inside the MCR due to the increase in the airflow of the fan. Moreover, the decrease in such temperature increased the efficiency of the whole system. It can be seen that the results agree with the decrease in the temperature of the compressor and condenser as presented in the above two subsections that increased the efficiency of the refrigerator.

7. Numerical Results and Discussion

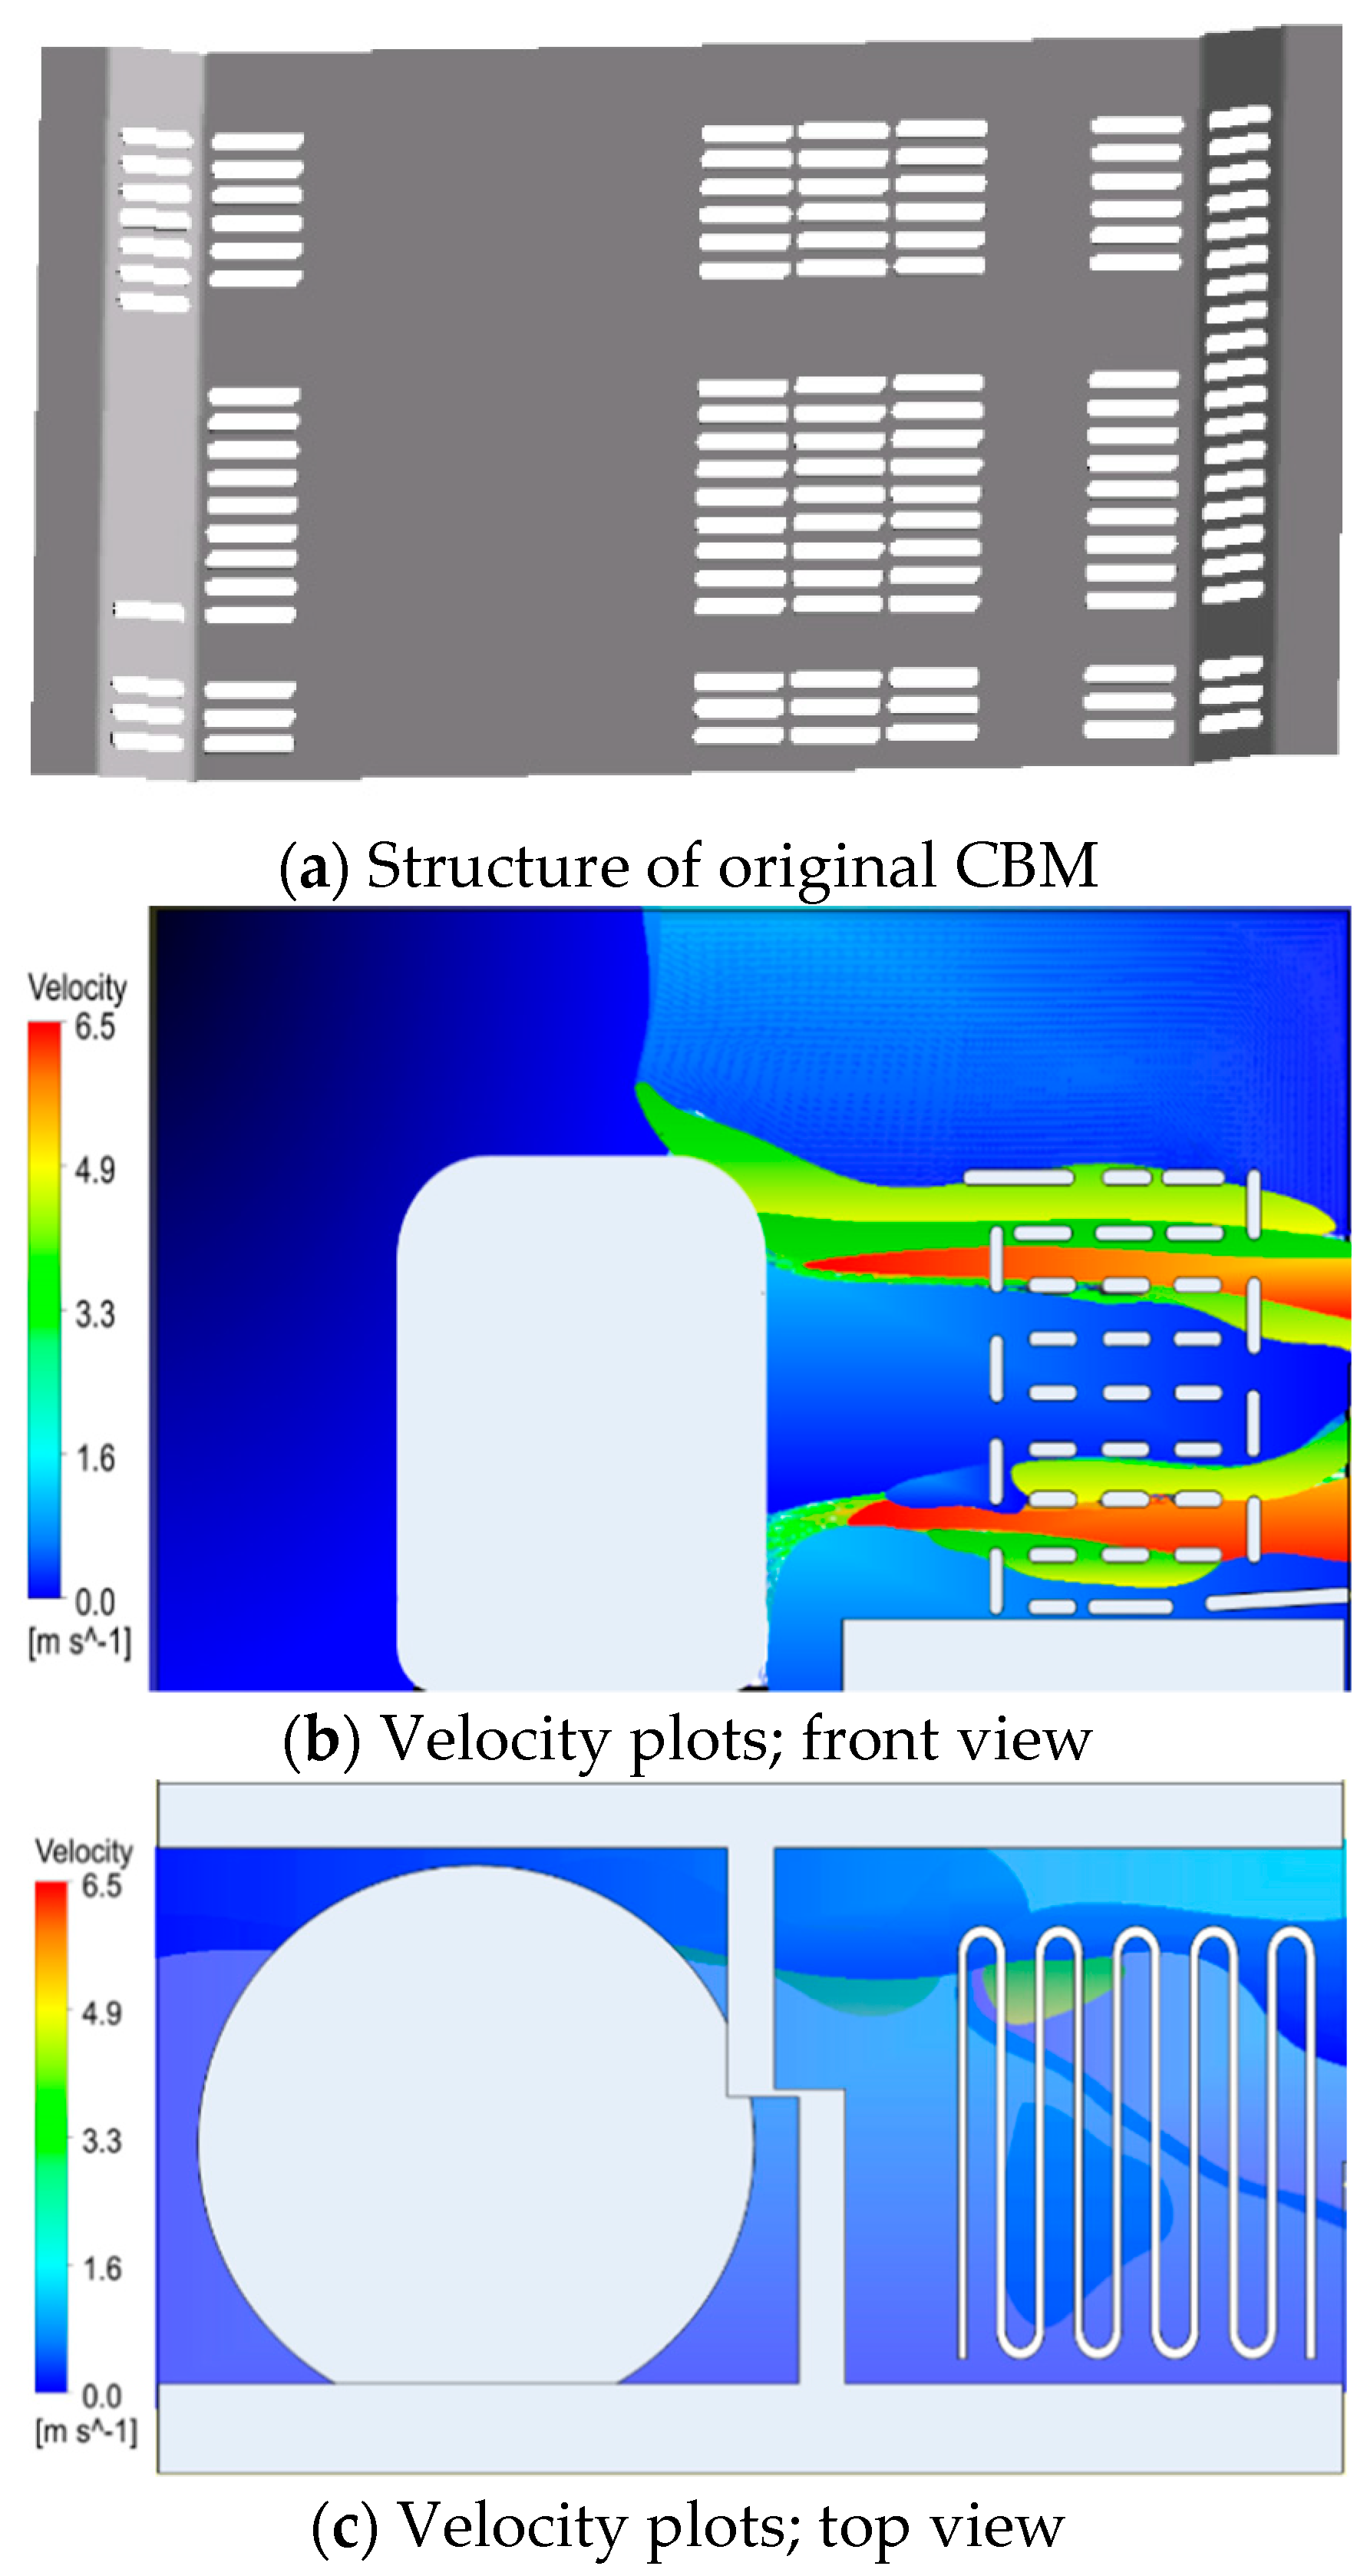
7.1. Flow Patterns of Existing Refrigerator

Figure 13a–c show the original CBM and the flow pattern of a model that applied conventional CBM. In the flow pattern, the internal air that cannot be discharged through the left vent of the compressor moved up to the upper section of the compressor and circulated to the upper section of the condenser. Then, the internal air was discharged to the upper left vent of the compressor according to the rise in the circulated air that moved up to the uppermost section.
In the flow pattern at the space between the compressor and the condenser, the air passed from the condenser collided to the right side of the compressor, and that generated the circulated flow to the upper section of the condenser, and a whirlpool-like circulation was formed. As a result, it caused an increase in temperature at the entrance line of the condenser.

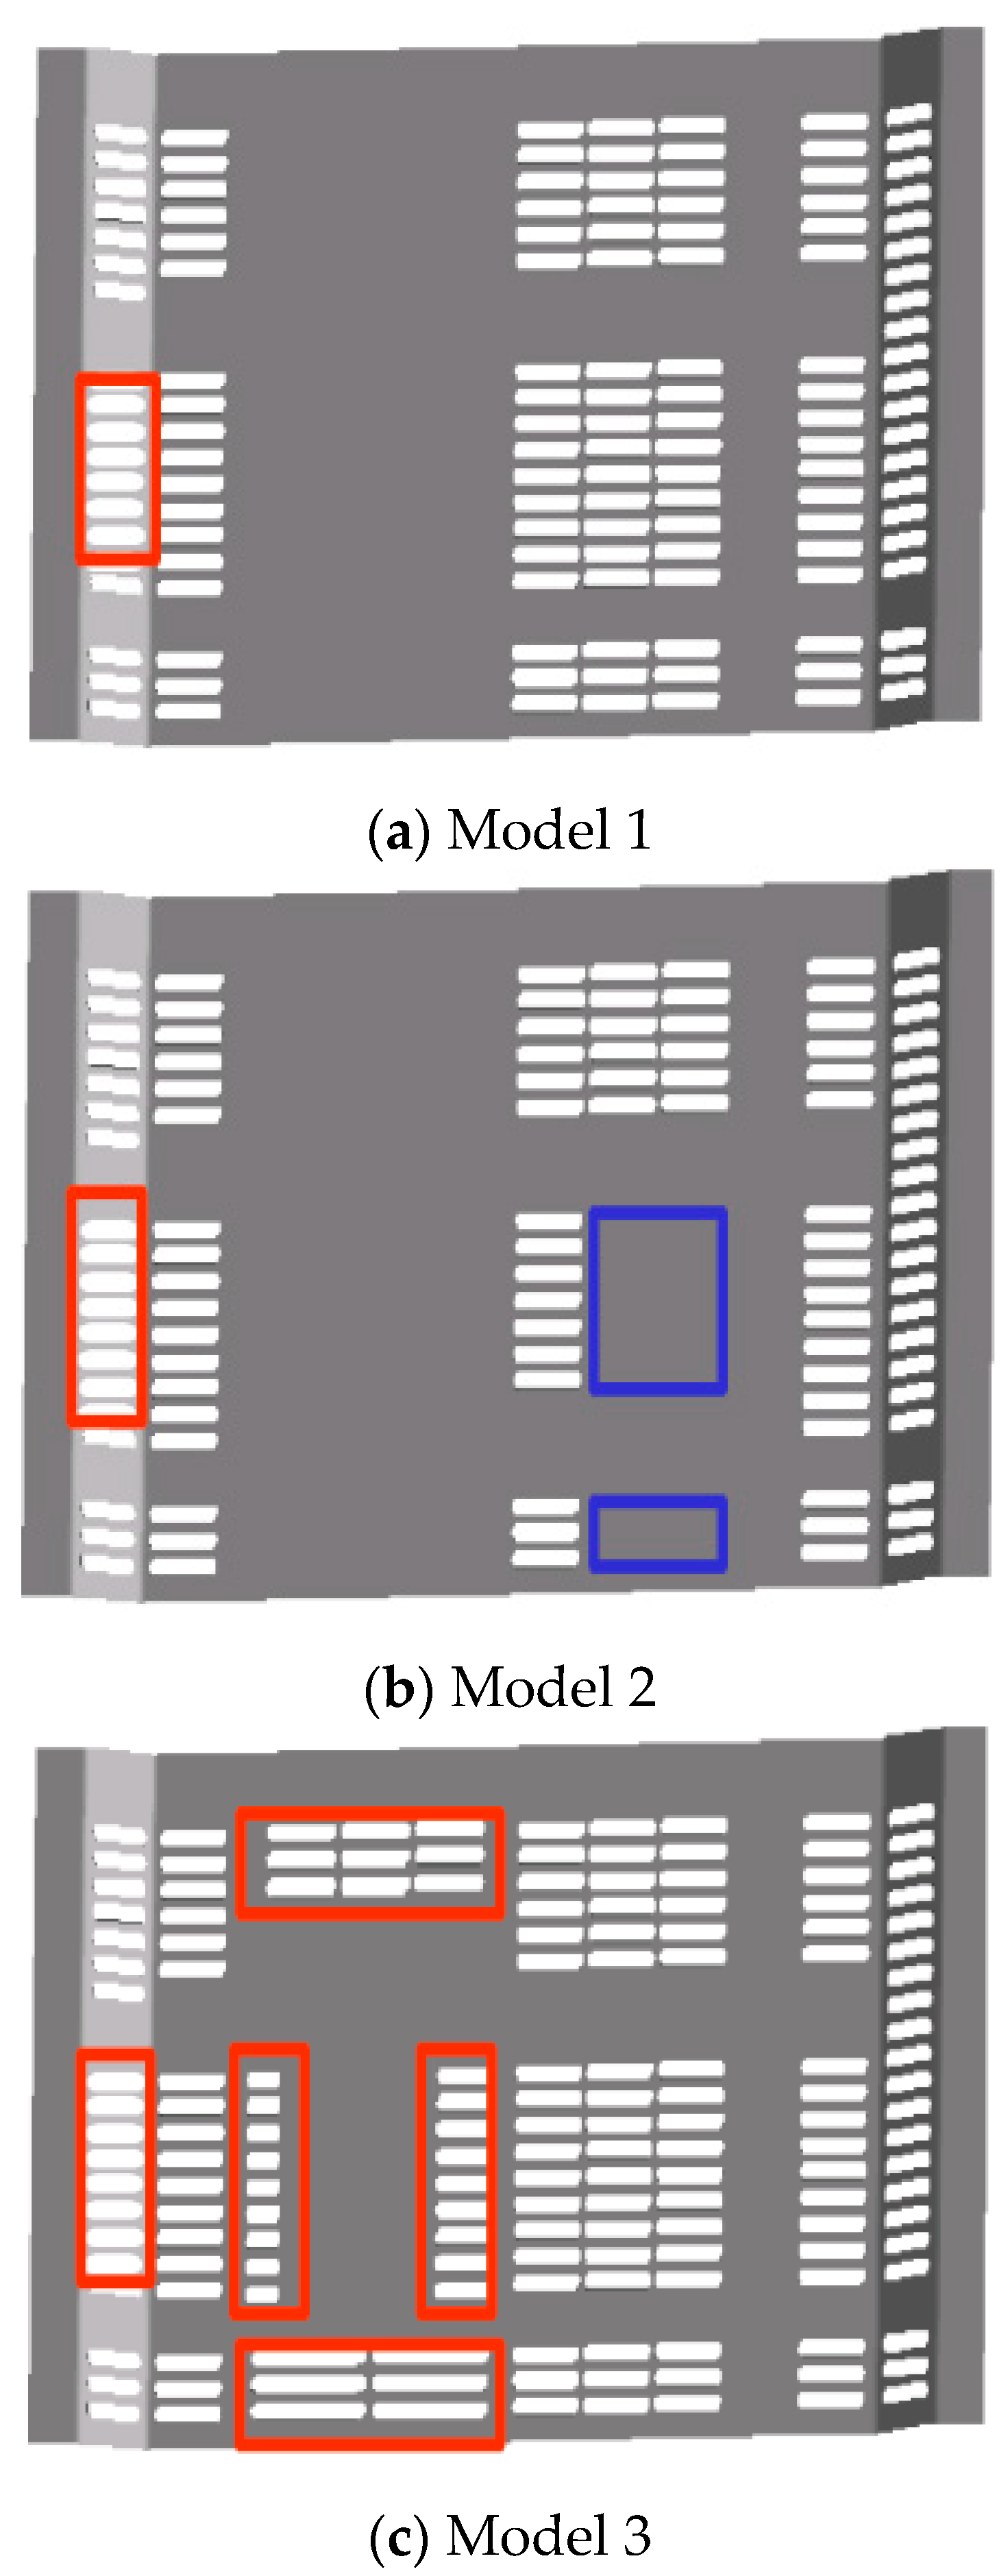
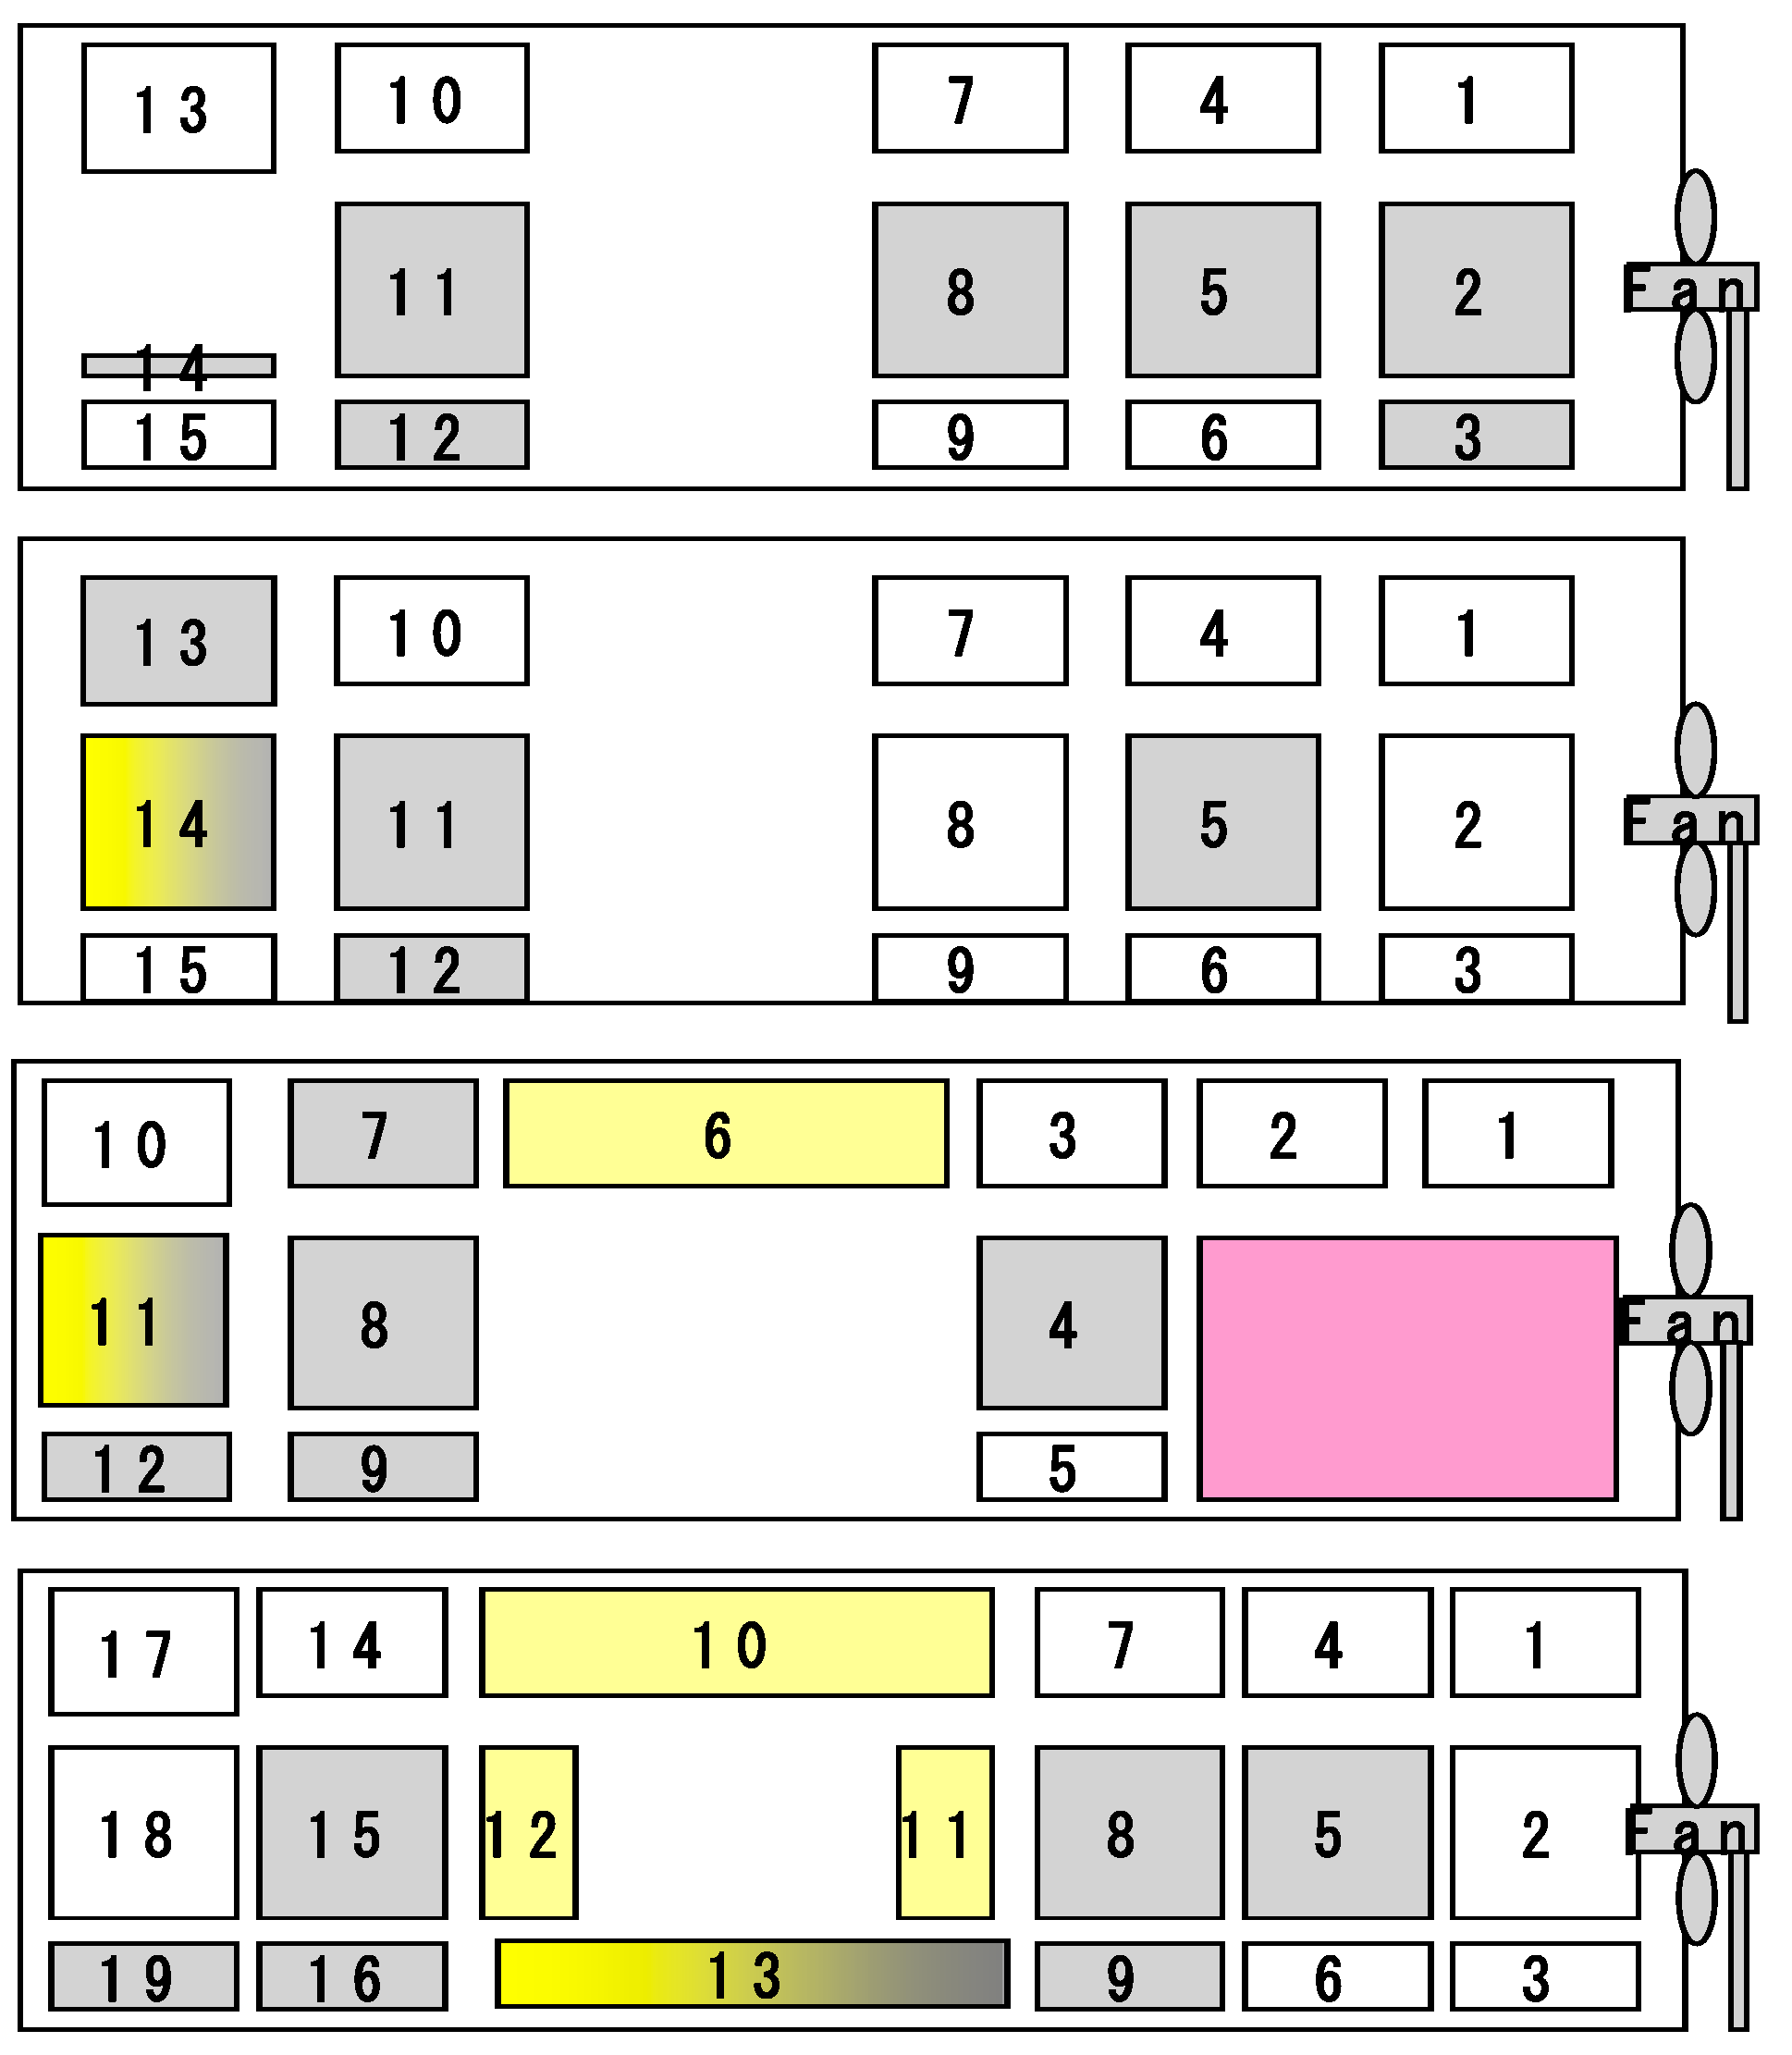
7.2. Selection of Modification Models

In the results of the flow analysis for the existing models, it was necessary to ensure that the left vent for the flow that circulates at the left section of the compressor, the upper vent for the upper flow circulation, and the vent for the whirlpool and flow circulated due to the wall at the space between the compressor and the condenser. In addition, the vent was to be cut-off due to the internal flow from around the condenser to the compressor. The modified models were selected, as shown in Figure 14.

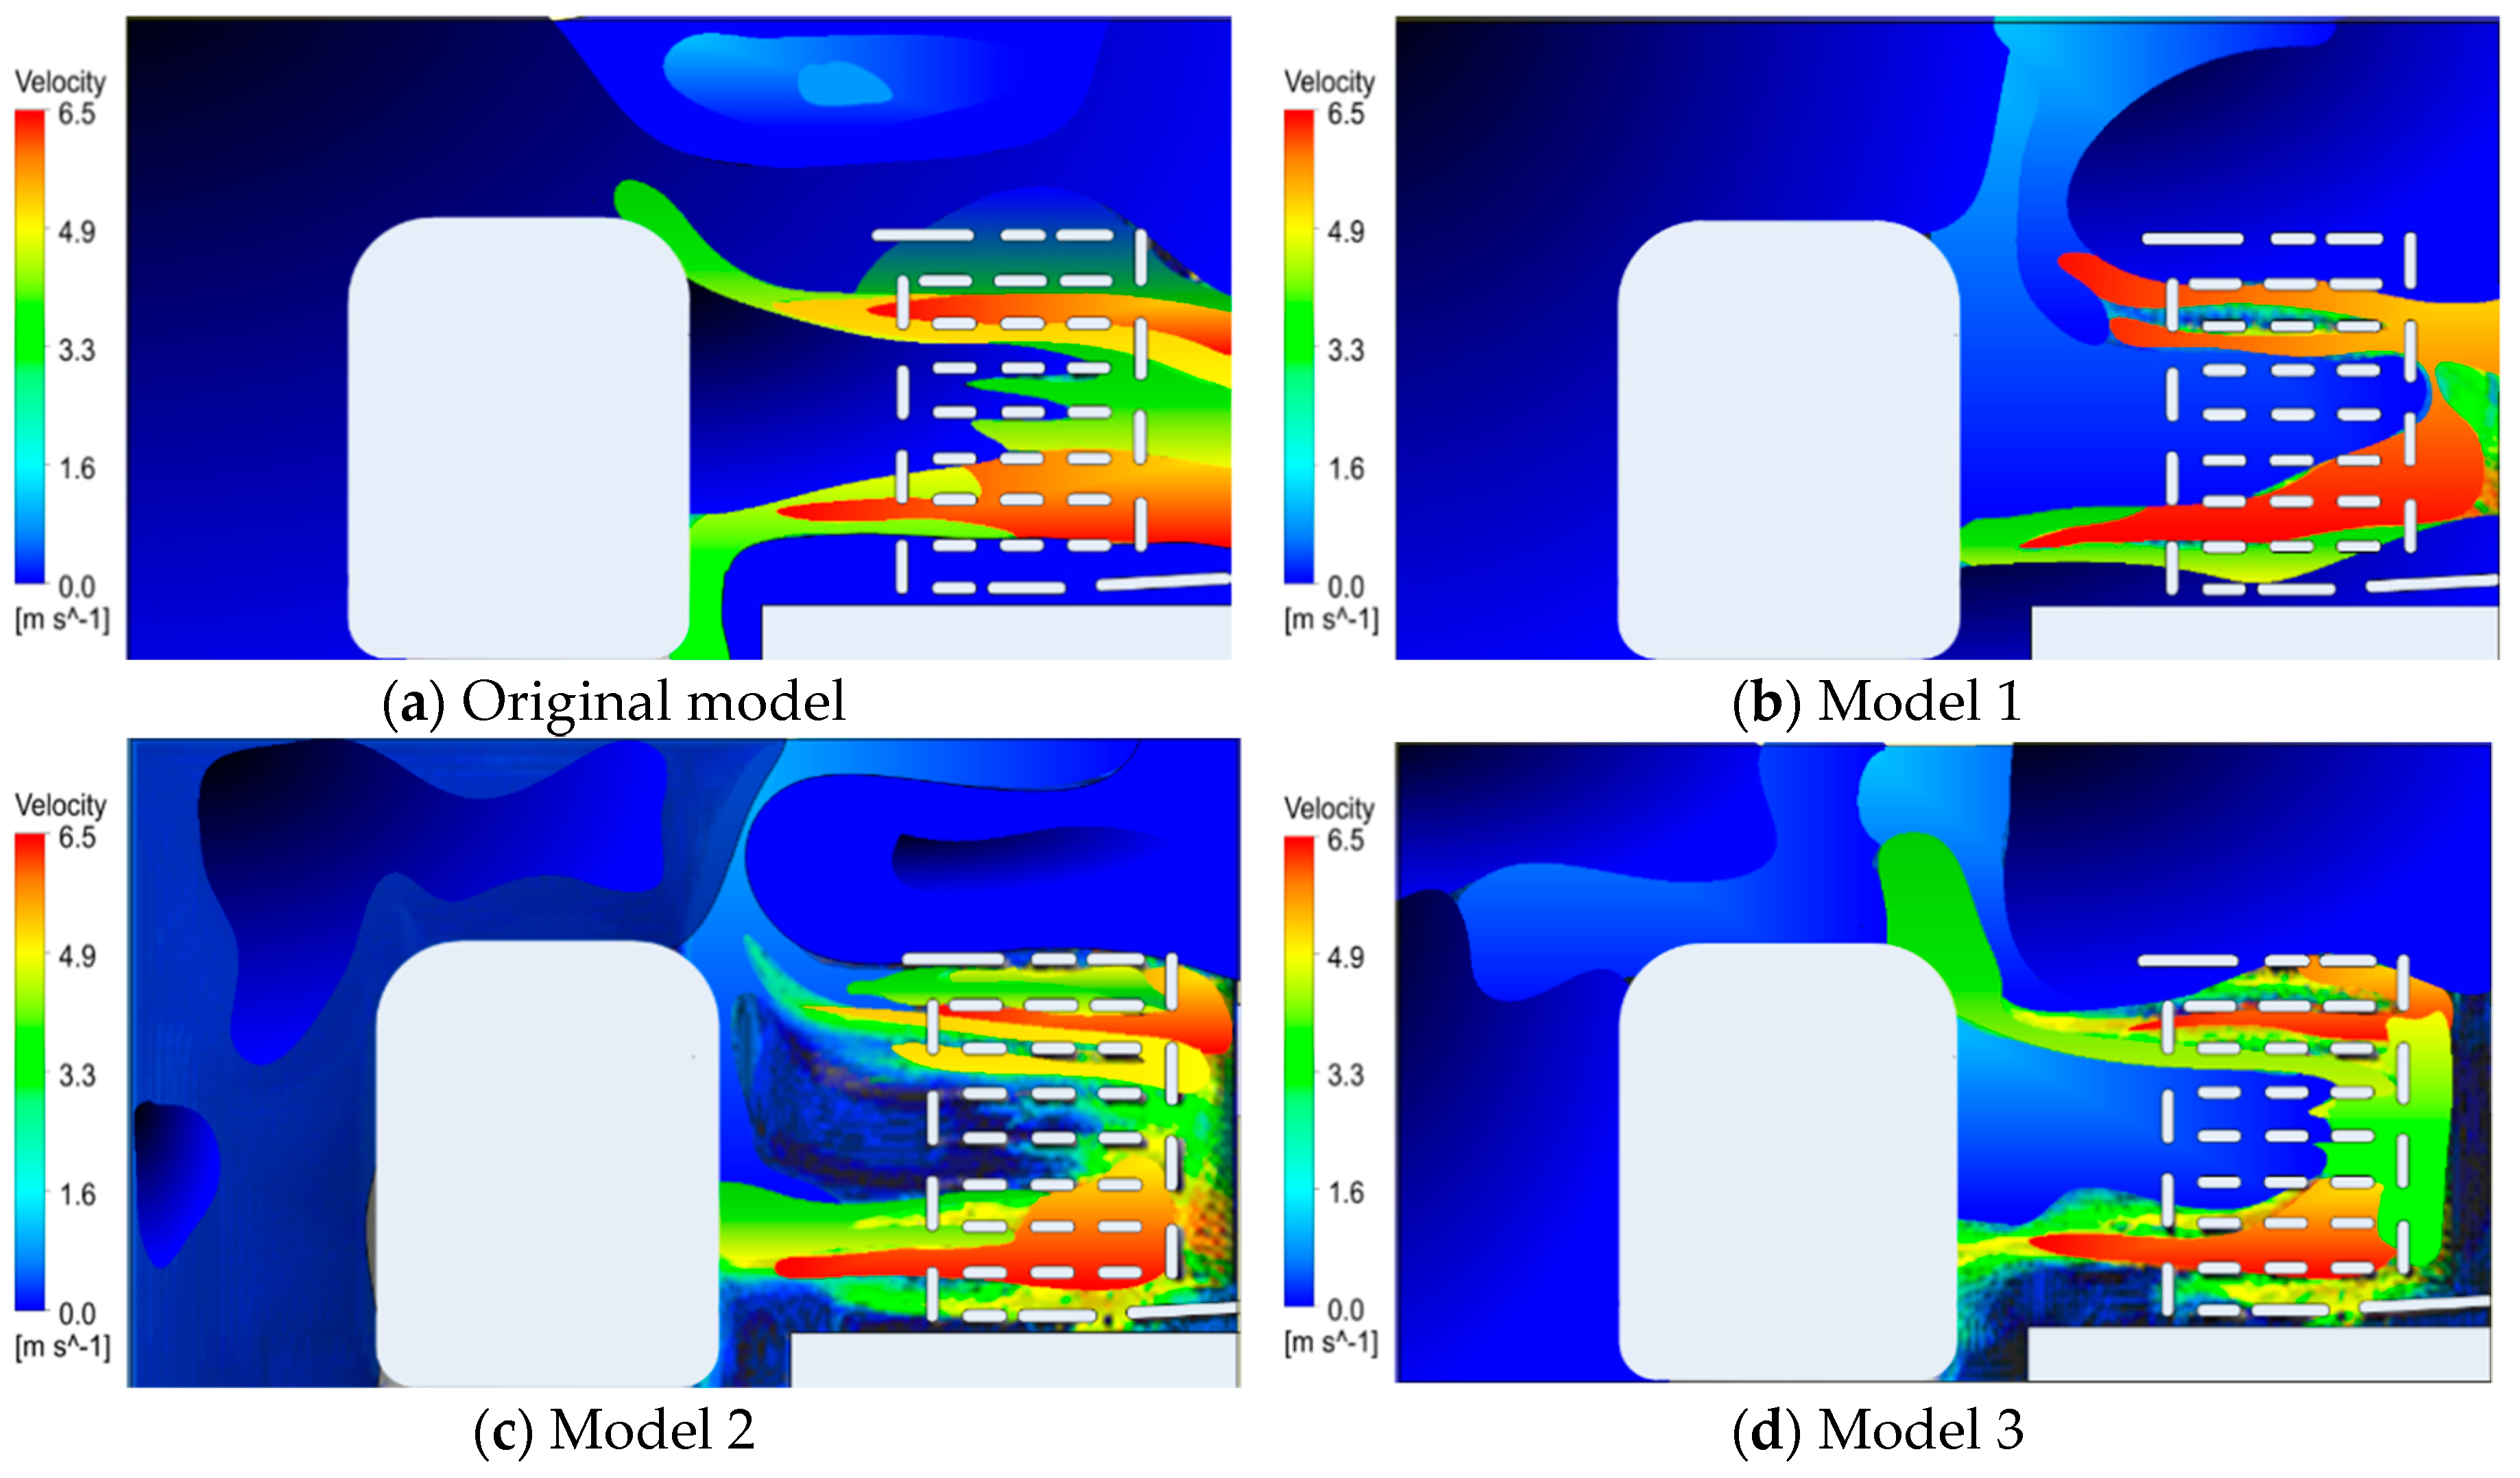
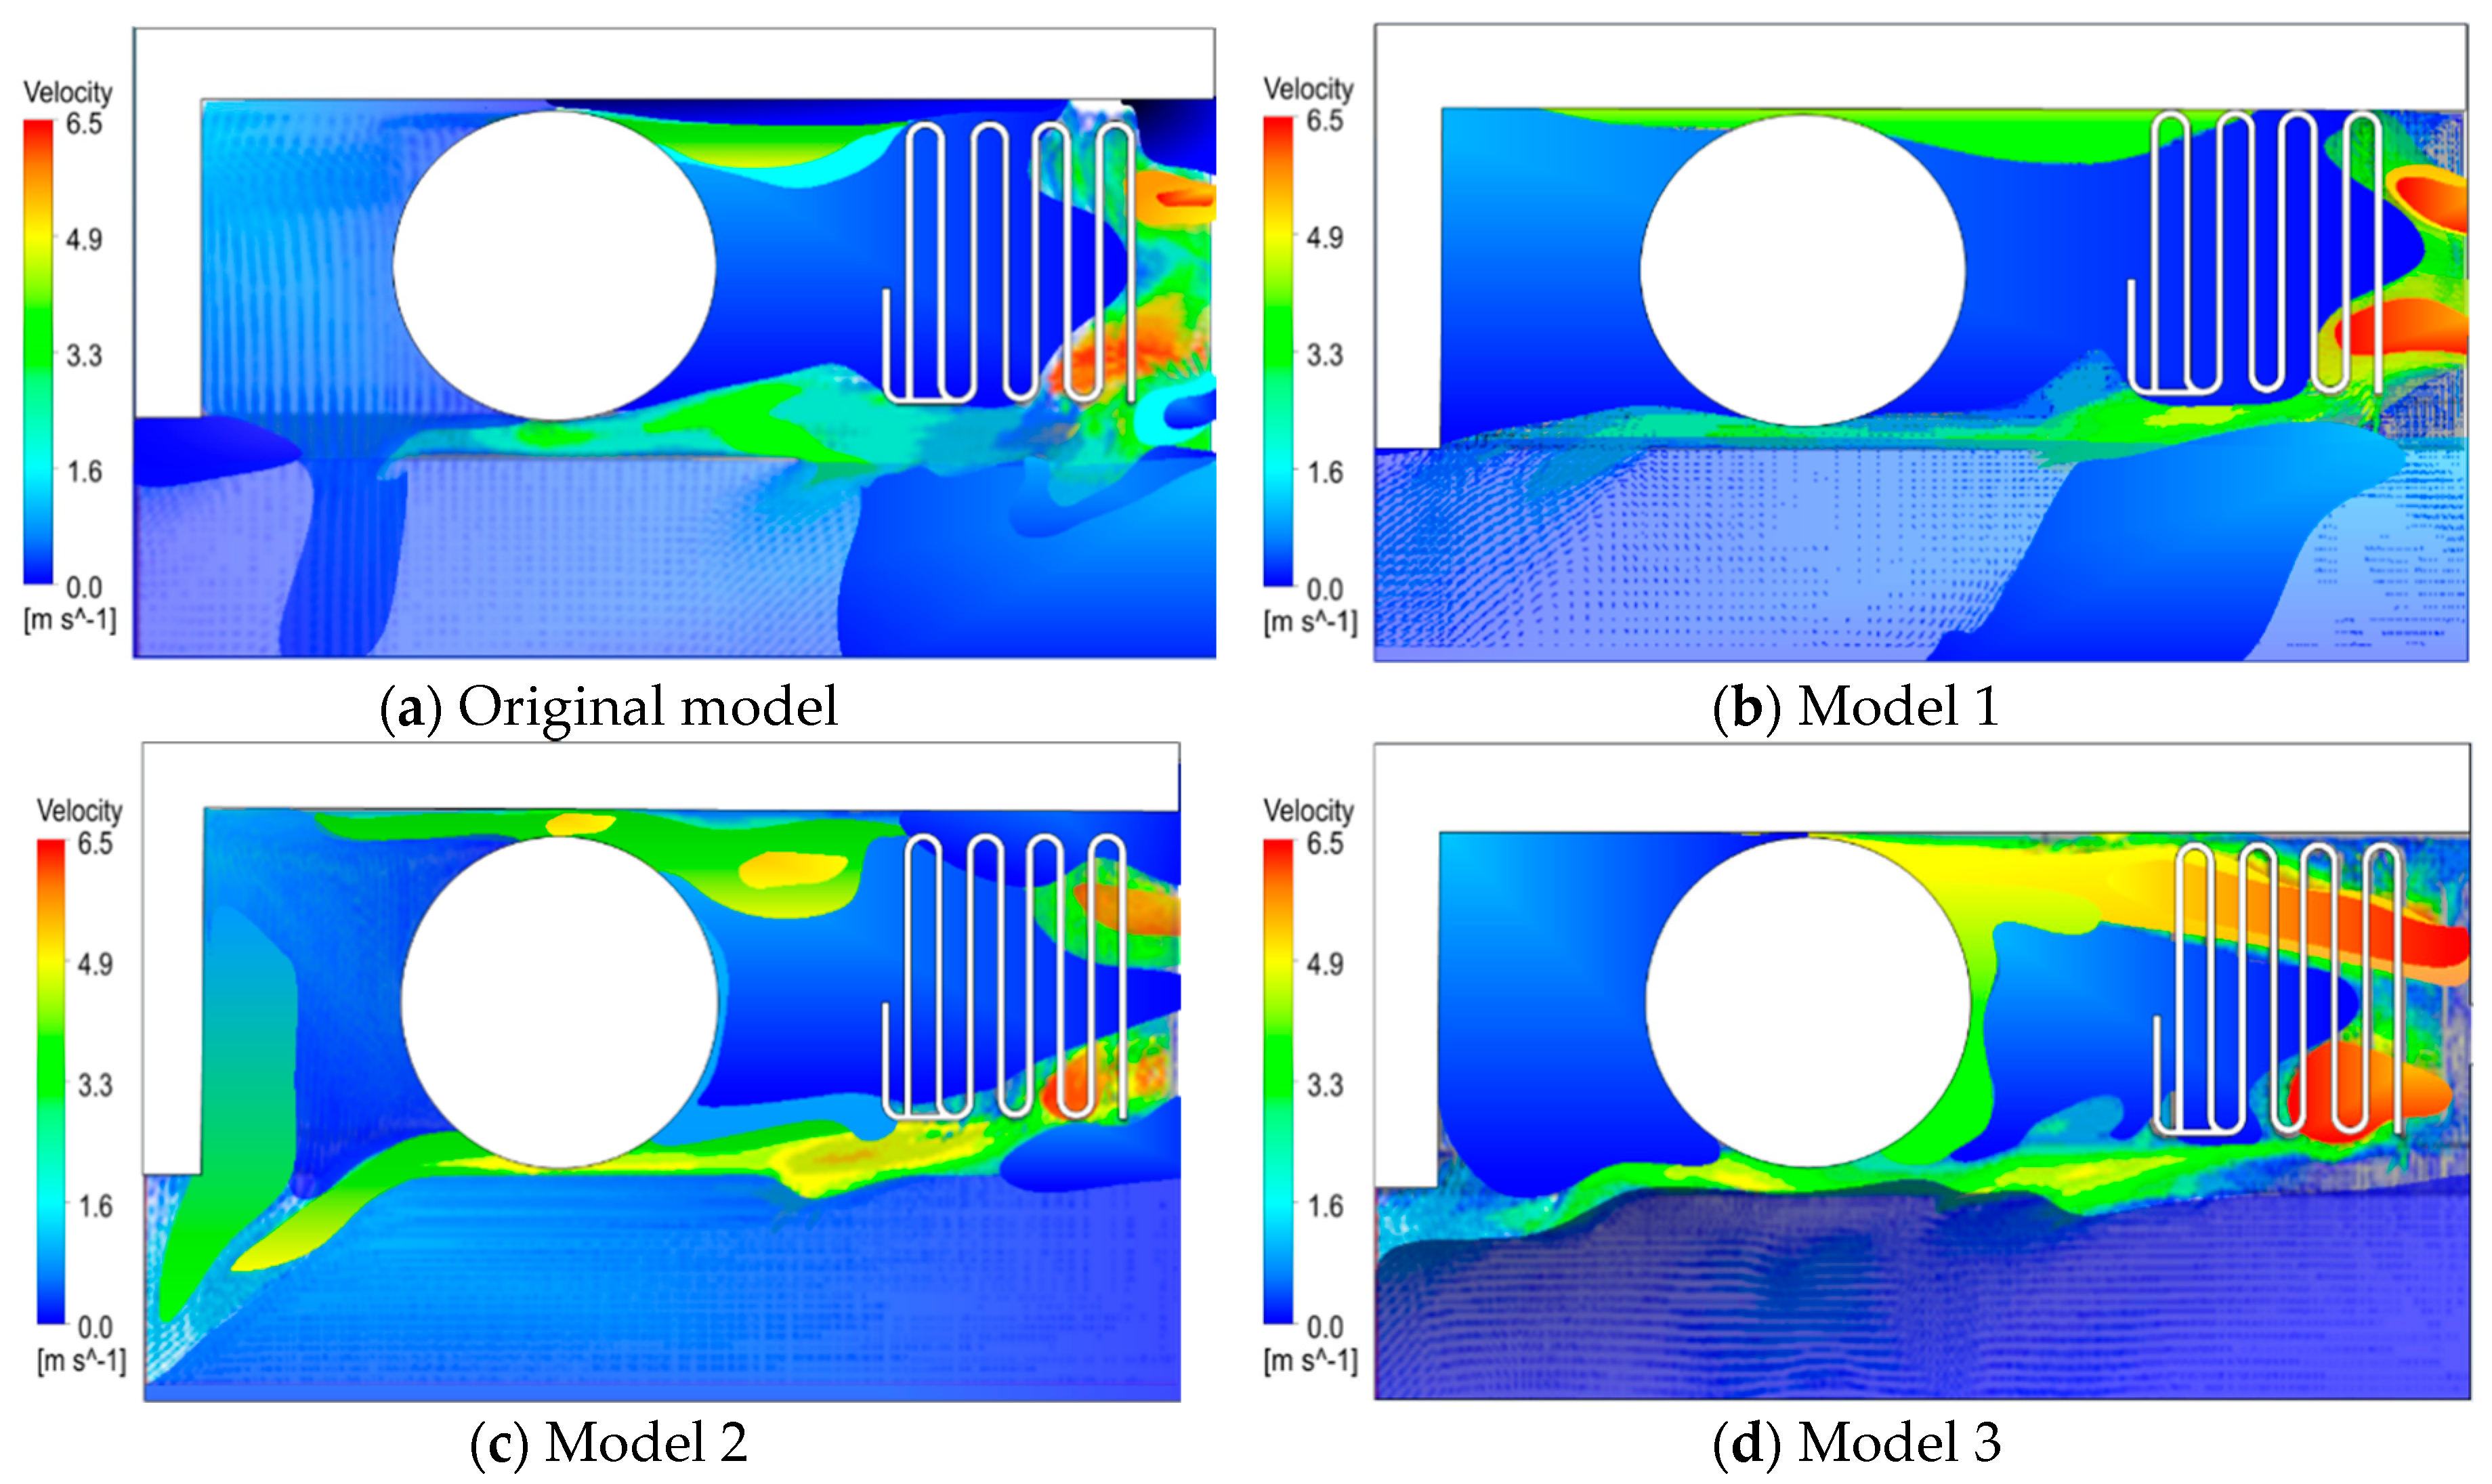
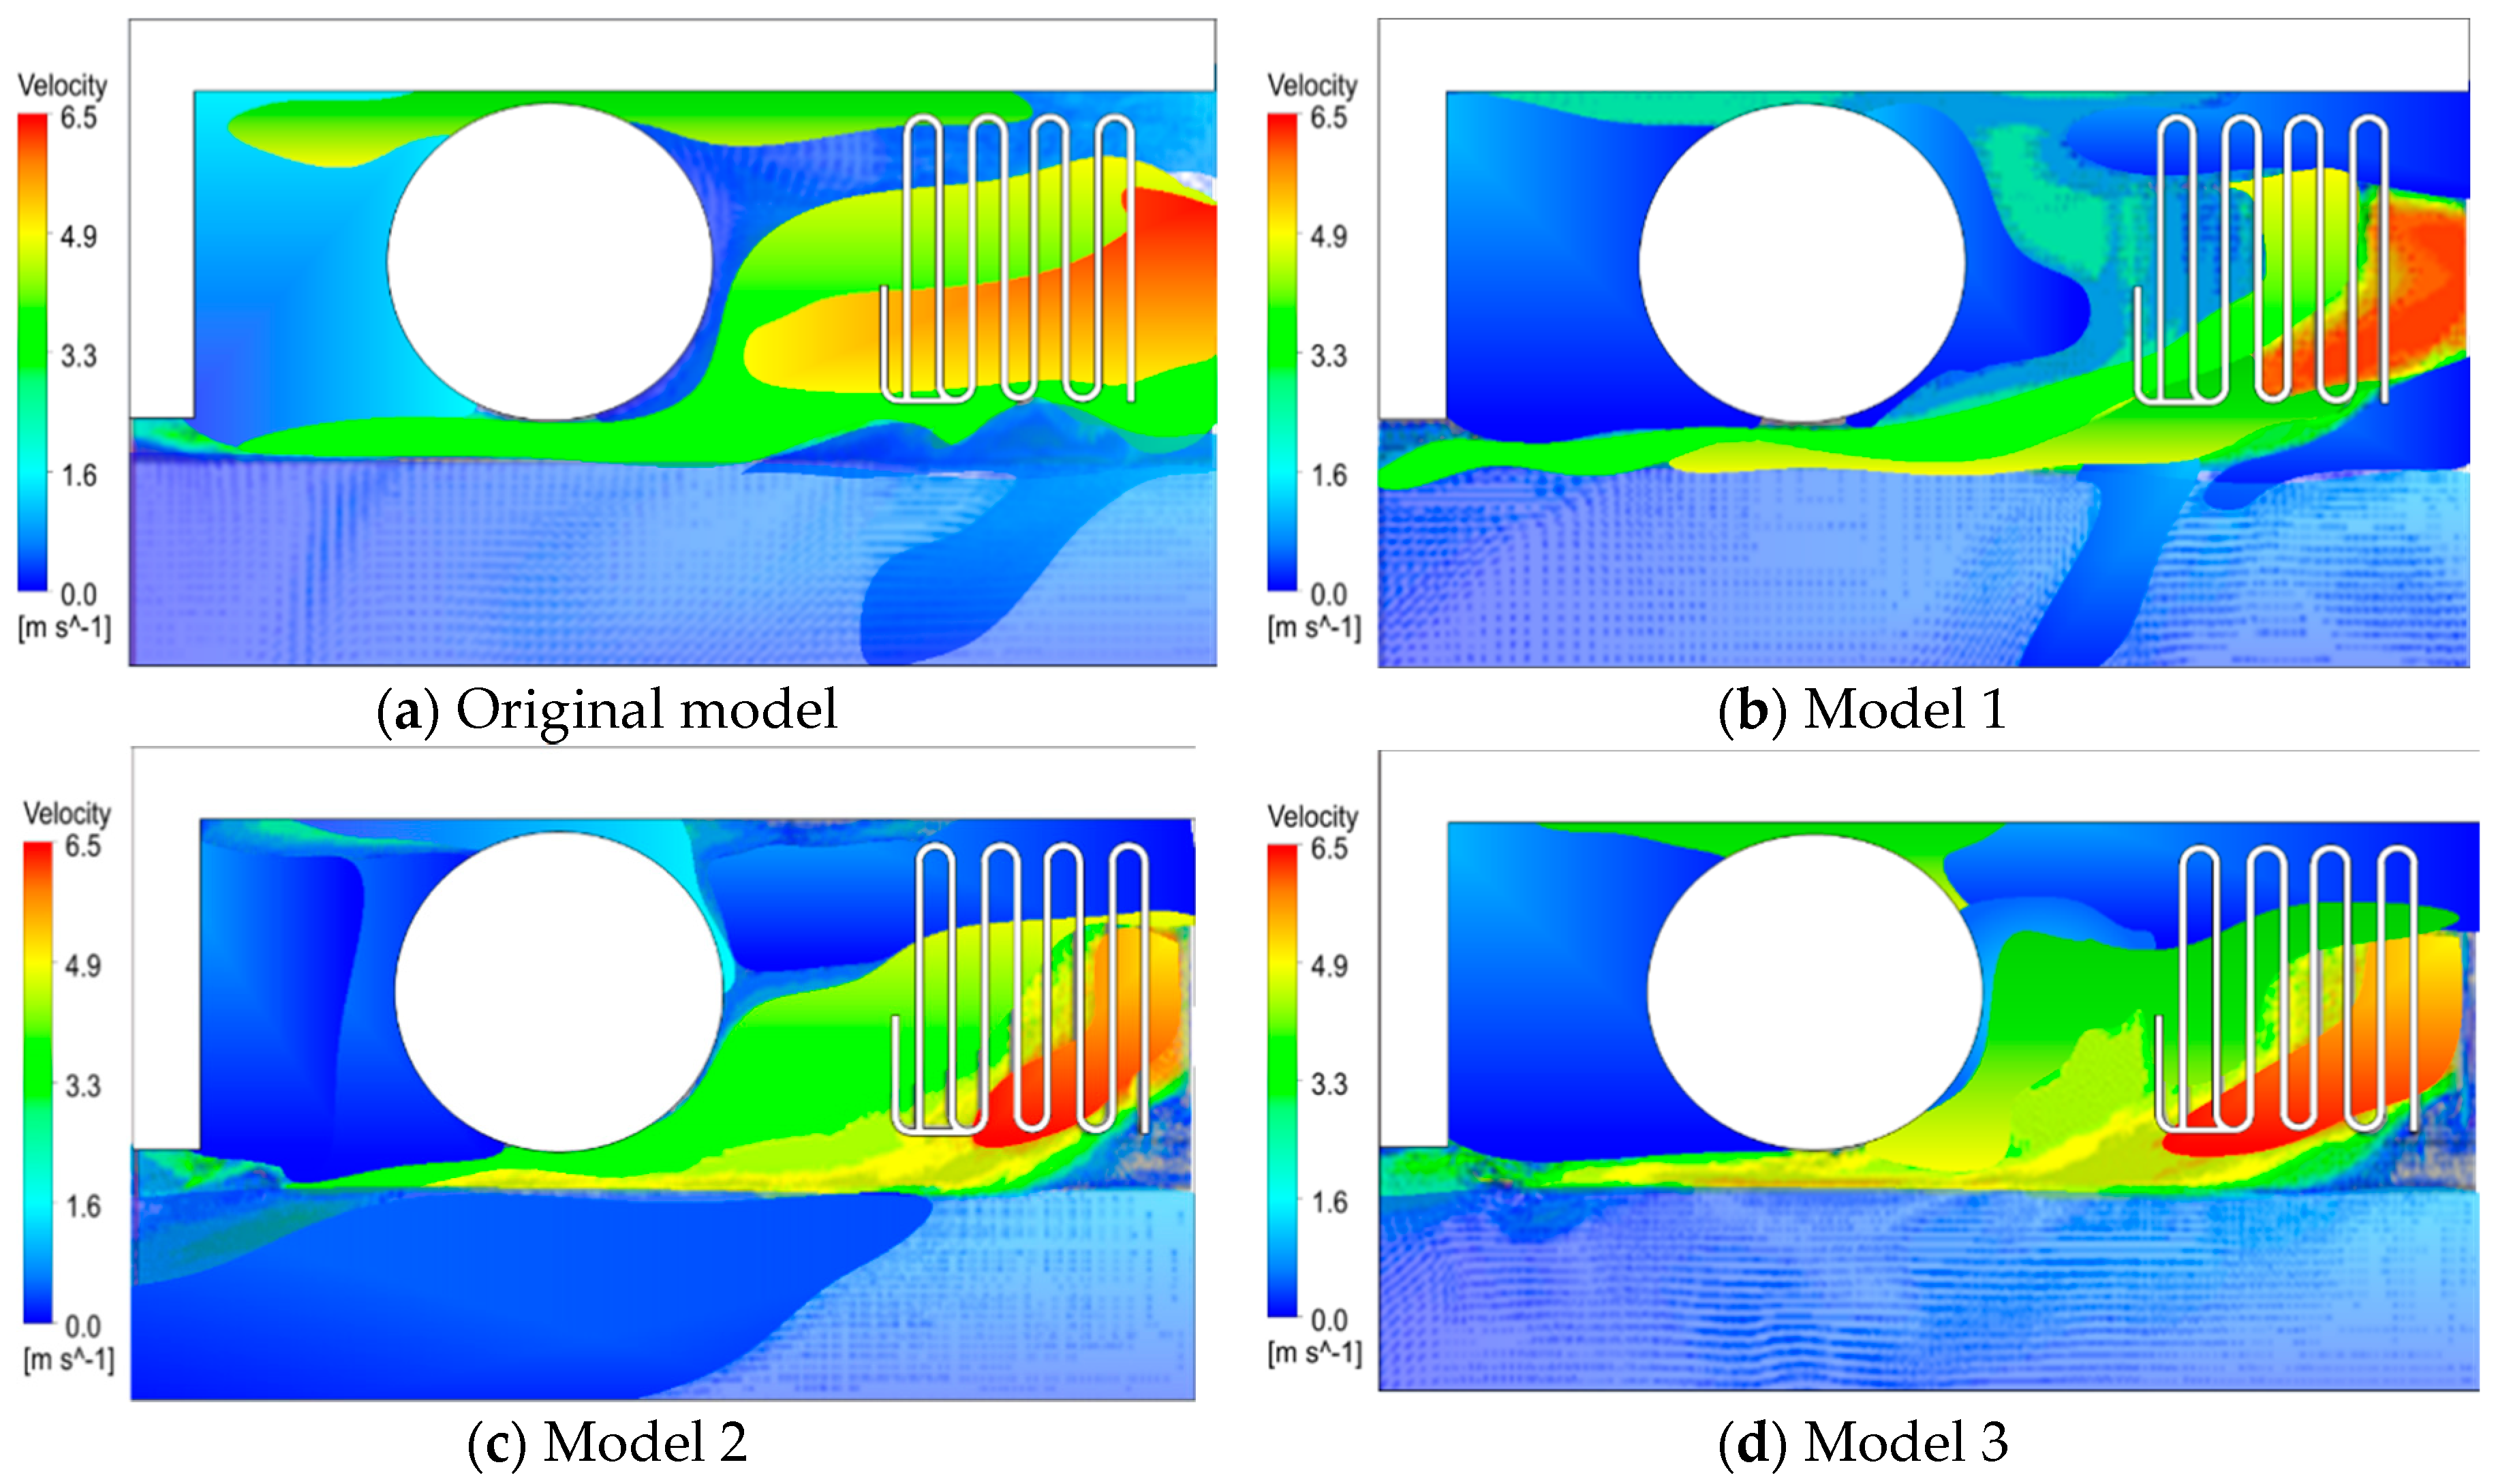
7.3. Numerical Simulation of the Modification Models

Figure 15 illustrates the velocity field at a vertical section of +40 mm to the CBM referenced around the cooling fan. From the Figure, it can be seen that there was a smooth flow around the compressor in the modified model (c) due to the presence of a vent at the rear of the compressor when compared to models (a) and (b). In addition, it can be seen that the flow passed through the upper section of the compressor due to the fact that the flow stopped up at the vent of the condenser. In addition, model (d) shows lots of flows at the upper and lower sections of the compressor according to the installation of vents at the rear and around the compressor when compared with the model (c). In addition, there were smooth flows due to the discharge of flow that was generated at the space between the compressor and the condenser and was congested at the upper section of the compressor.
Figure 16 illustrates the velocity field at a vertical section of −20 mm to the CBM around the cooling fan. As shown in the figure, regarding the models (b–d) that ensure the vents at the left section of the compressor, it can be seen that the flow progressed around the compressor, whereas model (d) represents the most active movement. This shows that all modified models represented smooth flow around the compressor when compared to the original model.
Figure 17 illustrates the velocity field at a horizontal section of +20 mm to the CBM around the cooling fan. From the Figure, it can be seen that the models (b–d) showed the discharge of flows to the lower section of the compressor, whereas model (c) showed the flow that progressed to the compressor due to the cut-off of the vent of the condenser. Moreover, it can be seen that in model (d), flow was generated at the upper section due to the influence of the right upper vent of the compressor.
Figure 18 illustrates the velocity field at a horizontal section of −40 mm to the CBM around the cooling fan. From the Figure, it can be seen that the flow was discharged to the left section of the compressor. In the case of model (d), the flow was discharged as a vent was determined at the lower section of the compressor. In addition, because the horizontal sections in Figure 17 and Figure 18 were not a normal symmetry but an axial symmetry, the sign of + to the horizontal center of the cooling fan and the—sign inside the MCR can be considered as the flow to the CBM.
Figure 19 and Table 3 represents a mass flow rate for the original and modified CBMs. Models 1 and 2 CBMs showed a high mass flow rate as the vent was generated at the left side of the compressor, and Model 3 CBM showed a high mass flow rate at the section of the compressor. Thus, it can be considered that the flow around the compressor is actively generated when compared to that of the existing models.
Since the modified models represented more smooth flows around the compressor when compared with the existing models, the decrease in the temperature at the compressor could be estimated. The temperature of the compressor and condenser installed inside the MCR for the original model was 54.5 ° C and 43.5   ° C , respectively. The temperature of the compressor and condenser for the improved model 3 were 52.0 ° C and 42.7 ° C , respectively. The temperature of the modified model 3 showed a decrease of about 2.5 ° C and 0.8 ° C at the compressor and condenser, respectively. As noted in Table 4, according to the decrease in the temperature, the power consumption of the refrigerator decreased by about 1.2% when compared to that of the existing models. Thus, the improvement in the flow line by modifying it in the MCR increases the efficiency of power consumption.

8. Conclusions

An experimental and numerical study was carried out to analyze the performance improvement of a domestic refrigerator. In the results of the measurement of power consumption under the conditions of flow line control in the MCR and fan operation, the following conclusions can be summarized as follows:
The improvement of the flow line decreased the power consumption by 0.4% due to the decrease in the temperature of the compressor and condenser inside the MCR. The power consumption decreased in proportion to the distance between the fan inside the MCR and the condenser. Because the decreased power consumption was larger than the increase in the power consumed by the operation of the fan according to the airflow, the power consumption proportionally decreased according to the increase in the airflow.
For the modified Model 3 that improved the flow line around the compressor, it showed a smooth flow due to the lowest congested section. In the calculation of the mass flow rate for the existing and modified CBMs, the mass flow rate at the vent showed a high level in the model that vents around the compressor. In the smooth airflow inside the MCR in the modified CBM, it decreased power consumption by about 1.2% due to a decrease in the temperature of the section of the compressor (shell).

Funding

This research was funded by the Tongmyong University Research Grants 2017.

Acknowledgments

This research was supported by the Tongmyong University Research Grants 2017(2017A017).

Conflicts of Interest

The authors declare no conflict of interest.

References

  1. Bansal, P.; Vineyard, E.; Abdelaziz, O. Advances in household appliances—A review. Appl. Therm. Eng. 2011, 31, 3748–3760. [Google Scholar] [CrossRef]
  2. Belman-Flores, J.; Barroso-Maldonado, J.M.; Rodríguez-Muñoz, A.P.; Camacho-Vázquez, G. Enhancements in domestic refrigeration, approaching a sustainable refrigerator—A review. Renew. Sustain. Energy Rev. 2015, 51, 955–968. [Google Scholar] [CrossRef]
  3. James, S.J.; Evans, J. The temperature performance of domestic refrigerators. Int. J. Refrig. 1992, 15, 313–319. [Google Scholar] [CrossRef]
  4. Dmitriyev, V.; Pisarenko, V. Determination of optimum refrigerant charge for domestic refrigerator units. Int. J. Refrig. 1984, 7, 178–180. [Google Scholar] [CrossRef]
  5. Laguerre, O.; Ben Amara, S.; Moureh, J.; Flick, D. Numerical simulation of air flow and heat transfer in domestic refrigerators. J. Food Eng. 2007, 81, 144–156. [Google Scholar] [CrossRef]
  6. Ledesma, S.; Belman-Flores, J. Mathematical application to analyze the thermal behavior of a domestic refrigerator: Influence of the location of the shelves. Int. J. Refrig. 2017, 74, 362–370. [Google Scholar] [CrossRef]
  7. Rasti, M.; Hatamipour, M.S.; Aghamiri, S.F.; Tavakoli, M. Enhancement of domestic refrigerator’s energy efficiency index using a hydrocarbon mixture refrigerant. Measurement 2012, 45, 1807–1813. [Google Scholar] [CrossRef]
  8. Shikalgar, N.; Sapali, S. Energy and exergy analysis of a domestic refrigerator: Approaching a sustainable refrigerator. J. Therm. Eng. 2019, 5, 469–481. [Google Scholar] [CrossRef]
  9. Belman-Flores, J.; Gallegos-Muñoz, A.; Puente-Delgado, A. Analysis of the temperature stratification of a no-frost domestic refrigerator with bottom mount configuration. Appl. Therm. Eng. 2014, 65, 299–307. [Google Scholar] [CrossRef]
  10. António, C.C.; Afonso, C. Air temperature fields inside refrigeration cabins: A comparison of results from CFD and ANN modelling. Appl. Therm. Eng. 2011, 31, 1244–1251. [Google Scholar] [CrossRef] [Green Version]
  11. James, S.; Evans, J.; James, C. A review of the performance of domestic refrigerators. J. Food Eng. 2008, 87, 2–10. [Google Scholar] [CrossRef]
  12. Rouaud, O.; Havet, M. Computation of the airflow in a pilot scale clean room using K-ε turbulence models. Int. J. Refrig. 2002, 25, 351–361. [Google Scholar] [CrossRef]
  13. Kattakayam, T.A.; Srinivasan, K. Thermal performance characterization of a photovoltaic driven domestic refrigerator. Int. J. Refrig. 2000, 23, 190–196. [Google Scholar] [CrossRef]
  14. Jung, D.; Kim, C.-B.; Song, K.; Park, B. Testing of propane/isobutane mixture in domestic refrigerators. Int. J. Refrig. 2000, 23, 517–527. [Google Scholar] [CrossRef]
  15. Vineyard, E.A.; Sand, J.; Miller, W. Refrigerator-freezer energy testing with alternative refrigerants. NASA STI Recon Tech. Rep. N 1989, 89, 27037. [Google Scholar]
  16. Farley, K.; Alissi, M.S.; Schoenhals, R.J.; Ramadhyani, S. Effects of ambient temperature and control settings on thermal performance and energy consumption of a household refrigerator-freezer. ASHRAE Trans. 1987, 93, CONF-870620. [Google Scholar]
  17. 2009 ASHRAE Handbook of Fundamentals; American Society of Heating, Refrigerating and Air-Conditioning Engineers Inc.: Atlanta, GA, USA, 2009.
  18. Bejan, A. Convection Heat Transfer; John Wiley & Sons: Hoboken, NJ, USA, 2013. [Google Scholar]
  19. Cengel, Y.A.; Boles, M.A. Thermodynamics: An Engineering Approach 6th Editon (SI Units); The McGraw-Hill Companies Inc.: New York, NY, USA, 2007. [Google Scholar]
  20. Ashrae, P.C. ASHRAE Handbook of Fundamentals; American Society of Heating, Refrigeration and Air Conditioning Engineers Inc.: Atlanta, GA, USA, 2005. [Google Scholar]
  21. Amara, S.B.; Laguerre, O.; Charrier-Mojtabi, M.-C.; Lartigue, B.; Flick, D. PIV measurement of the flow field in a domestic refrigerator model: Comparison with 3D simulations. Int. J. Refrig. 2008, 31, 1328–1340. [Google Scholar] [CrossRef]
  22. Björk, E.; Palm, B. Performance of a domestic refrigerator under influence of varied expansion device capacity, refrigerant charge and ambient temperature. Int. J. Refrig. 2006, 29, 789–798. [Google Scholar] [CrossRef]
  23. Zhou, Q.; Pannock, J.; Radermacher, R. Development and testing of a high-efficiency refrigerator. ASHRAE Trans. 1994, 100, 1351–1358. [Google Scholar]
  24. Bayer, O.; Ruknettin, O.; Paksoy, A.; Aradag, S. CFD simulations and reduced order modeling of a refrigerator compartment including radiation effects. Energy Convers. Manag. 2013, 69, 68–76. [Google Scholar] [CrossRef]
  25. R. ANSYS. ANSYS CFX-Solver Theory Guide; Release 16.2; ANSYS Inc.: Canonsburg, PA, USA, 2015. [Google Scholar]
  26. Afonso, C.; Matos, J. The effect of radiation shields around the air condenser and compressor of a refrigerator on the temperature distribution inside it. Int. J. Refrig. 2006, 29, 1144–1151. [Google Scholar] [CrossRef] [Green Version]
  27. Fukuyo, K.; Tanaami, T.; Ashida, H. Thermal uniformity and rapid cooling inside refrigerators. Int. J. Refrig. 2003, 26, 249–255. [Google Scholar] [CrossRef]
  28. Hoang, M.L.; Verboven, P.; De Baerdemaeker, J.; Nicolai, B.M. Analysis of the air flow in a cold store by means of computational fluid dynamics. Int. J. Refrig. 2000, 23, 127–140. [Google Scholar] [CrossRef]
Figure 1. Component arrangement of the mechanical chamber room (MCR).
Applsci 10 06284 g001
Figure 2. Schematic diagram for the reverse Carnot cycle.
Applsci 10 06284 g002
Figure 3. Arrangement of experimental apparatus.
Applsci 10 06284 g003
Figure 4. Compressor On/Off cycle for defrost state.
Applsci 10 06284 g004
Figure 5. Grid dependency of flow at MCR.
Applsci 10 06284 g005
Figure 6. Computational grid system.
Applsci 10 06284 g006
Figure 7. Monthly power consumption for various temperatures in the chamber room.
Applsci 10 06284 g007
Figure 8. Original and modified model of the machine room.
Applsci 10 06284 g008
Figure 9. Displacement of the cooling fan position.
Applsci 10 06284 g009
Figure 10. Monthly power consumption for various lengths between the condenser and the fan.
Applsci 10 06284 g010
Figure 11. Fan flow rate for various fan rotating speeds.
Applsci 10 06284 g011
Figure 12. Power consumption for various flow rates of the cooling fan.
Applsci 10 06284 g012
Figure 13. Original cover back machine (CBM) and flow pattern in the machine room of the refrigerator.
Applsci 10 06284 g013
Figure 14. Modified structure of the CBM.
Applsci 10 06284 g014
Figure 15. Velocity plots of vertical section at +40 mm position from the center—front view.
Applsci 10 06284 g015
Figure 16. Velocity plots of vertical section at −20 mm position from the center—front view.
Applsci 10 06284 g016
Figure 17. Velocity plots of horizontal section at +20 mm position from the center—top view.
Applsci 10 06284 g017
Figure 18. Velocity plots of horizontal section at −40 mm position from the center—top view.
Applsci 10 06284 g018
Figure 19. Mass flow rates of the original and modified CBMs.
Applsci 10 06284 g019
Table 1. Specifications of the apparatus.
No.NameSpecifications
1Chamber roomTemperature 30 ± 1 ° C ,
Humidity 75 ± 5%
2Chamber controllerTemperature 10–35   ° C ,
Humidity 60–95%
3Computer Workstation, 16 Core, 128 Gb
4Data loggerDS-600 (YOGAWA 60 Channel),
Thermocouple (T-type)
5Power meter for #AWT-200 (YOKOGAWA)
6Power meter for #BWT-200 (YOKOGAWA)
7Automatic Voltage Regulator (AVR)3KVA, Output V: 220 V ± 2%
8Power supplyVoltage: 220 V, Frequency: 60 Hz
Table 2. Reduction in power of original and modified models.
ItemPower Original (kWh/Month)Power Modified (kWh/Month)Reduction (%)
Case
Case #150.149.70.8
Case #251.451.00.7
Table 3. Mass flow rate (kg/s) of the original and modified cover back machine (CBM).
Outlet.Existing ModelModel 1 Model 2Model 3
10.600.730.220.28
21.700.330.220.47
31.250.370.220.28
40.510.721.530.28
51.151.470.931.23
60.580.650.970.55
70.360.651.450.28
81.390.901.472.31
90.360.941.591.18
100.880.820.910.33
111.360.551.060.54
121.752.081.290.54
130.651.09 2.03
141.831.03 0.97
151.030.27 2.05
16 2.37
17 0.89
18 0.89
19 1.82
Table 4. Reduction in power for recent and modified models.
ItemPower Recent Model (kWh/Month)Power Modified Model (kWh/Month)Reduction (%)
Case
Case #149.949.31.3
Case #252.852.31.1

