Article

Automatic Detection of Airway Invasion from Videofluoroscopy via Deep Learning Technology

1
Department of Rehabilitation Medicine, College of Medicine, Dankook University, Cheonan 31116, Korea
2
Department of Computer Science and Engineering, Dankook University, Gyeonggi-do 16890, Korea
*
Author to whom correspondence should be addressed.
Appl. Sci. 2020, 10(18), 6179; https://doi.org/10.3390/app10186179
Submission received: 29 July 2020 / Revised: 1 September 2020 / Accepted: 3 September 2020 / Published: 5 September 2020
(This article belongs to the Special Issue Artificial Intelligence for Medical Image Analysis)

Abstract

:
In dysphagia, food materials frequently invade the laryngeal airway, potentially resulting in serious consequences, such as asphyxia or pneumonia. The VFSS (videofluoroscopic swallowing study) procedure can be used to visualize the occurrence of airway invasion, but its reliability is limited by human errors and fatigue. Deep learning technology may improve the efficiency and reliability of VFSS analysis by reducing the human effort required. A deep learning model has been developed that can detect airway invasion from VFSS images in a fully automated manner. The model consists of three phases: (1) image normalization, (2) dynamic ROI (region of interest) determination, and (3) airway invasion detection. Noise induced by movement and learning from unintended areas is minimized by defining a “dynamic” ROI with respect to the center of the cervical spinal column as segmented using U-Net. An Xception module, trained on a dataset consisting of 267,748 image frames obtained from 319 VFSS video files, is used for the detection of airway invasion. The present model shows an overall accuracy of 97.2% in classifying image frames and 93.2% in classifying video files. It is anticipated that the present model will enable more accurate analysis of VFSS data.

1. Introduction

Dysphagia can occur as a result of a wide variety of neurological, structural, or psychiatric disorders [1]. Dysphagia can lead to serious and life-threatening consequences, such as aspiration pneumonia or malnutrition, and has become a great concern in health care, especially among the aged population [2]. Comprehensive and objective evaluation of swallowing function is of vital importance for choosing appropriate measures to prevent or decrease the mortality and morbidity of patients with dysphagia [3]. The VFSS (videofluoroscopic swallowing study) procedure, also known as an MBS (modified barium swallowing) examination, is regarded as the gold standard for the evaluation of dysphagia and is the examination method that is most commonly used by clinicians for this purpose [3]. The VFSS is a radiographic procedure in which fluoroscopic images are acquired while the patient swallows boluses mixed with contrast media impenetrable to radiation beams [1]. The VFSS permits the direct visualization of bolus flow and the detection of the occurrence and timing of airway invasion, such as laryngeal penetration or aspiration, and it assists in identifying the physiological and often treatable causes of dysphagia [3]. Physicians and speech language pathologists usually review the recorded images, which are typically stored digitally as video files. However, the analysis of VFSS data is vulnerable to human bias because the swallowing process occurs in a very short time of less than a few seconds and includes several events occurring simultaneously, complicating the necessary judgments [4]. Intra-rater and inter-rater reliability have been reported to be only poor to fair (inter-rater k = 0.01∼0.56) and show wide variation [5,6,7,8]. The reviewing process frequently becomes time consuming and even exhausting because it requires repeated frame-by-frame or slow-motion examination [9]. As a result, VFSS analysis inevitably demands a high level of concentration and suffers from a considerable likelihood of error resulting from fatigue.
To increase the efficiency and reliability by overcoming the human errors, attempts have been made to develop computer-assisted analysis methods. The suggested advantages of computerized reading are as follows: (1) more objective and immediate analysis, (2) elimination of the need for high levels of training, and (3) provision of a platform for larger scale screening [10]. Chang et al. successfully reconstructed the three-dimensional pharyngeal bolus movement from the VHSvideos of normal subjects using a knowledge-based snake algorithm; however, its clinical usefulness has not been verified [11]. Aung et al. measured the oral and pharyngeal transit time by demarcation of anatomical landmarks using the user-steered delineation algorithm live-wire and straight-line annotators; although they demonstrated a higher correlation coefficient than that between human observers, anatomical landmarks had to be demarcated by users [12]. Aung et al. in another study attempted automatic demarcation of salient landmarks by applying a 16 point active shape model with high reliability; however, manual initialization was required to determine the co-ordinates of the reference points from the first frame of the video [10]. Hossain et al. attempted to track the motion of the hyoid bone semi-automatically by determining the region of interest using the Haar classifier, but manual identification of templates was required to increase accuracy [13]. Lee et al. developed MATLAB-based software for kinematic analysis of swallowing with high correlation and reliability, but specific events and target structures should be marked manually [14]. Most existing models use automatic tracking of the salient anatomical structures following human manual demarcation in the first few frames. The usefulness of the existing models is limited because they use obsolete semiautomated tracking and segmentation algorithms that still require tedious and time-consuming demarcation, no better than visual inspection in terms of efficiency [15,16].
Recently, advances in deep learning technology have dramatically improved the accuracy of image classification by computers to a level exceeding that of human eyes [17]. Moreover, deep learning models can classify objects in images without human intervention if appropriately trained on a sufficient amount of data. Due to the accuracy and capability of automation, deep learning is expected to reduce errors in reading medical images, including conventional radiography, MRI, and CT images [18,19,20]. VFSS analysis may be one of the best candidates for the application of deep learning models, considering its vulnerability to human fatigue and errors. Although deep learning models may provide a novel alternative to semiautomated methods that have been used till date with limited success, the applicability of deep learning in VFSS analysis has rarely been studied. Only two studies have been published in which fully automatic detection of the hyoid bone and pharyngeal phase has been attempted using a deep learning model [16,21], whereas the identification of abnormal findings in VFSS images using deep learning models has not previously been attempted.
The present study focuses on the detection of airway invasion (including the laryngeal penetration and aspiration) that has the utmost clinical importance in the analysis of VFSS images. Airway invasion is the main pathologic process that can cause pneumonia or asphyxia and should be clinically considered. To the best of the authors’ knowledge, machine-based identification of airway invasion from the VFSS images has not been tried or published yet, whether automatic or not. The aim of the present study was to develop a deep learning model that can detect airway invasion in a completely automated manner, without human intervention. If successfully developed, the model will be able to reduce the effort and fatigue of the clinicians, and thereby improve the reliability of the analysis of the VFSS, by providing screening information about the existence of airway invasion. Based on this model, the authors expect to develop a more comprehensive automatic analysis model for VFSS analysis.

2. Materials and Methods

2.1. Dataset

A total of 388 VFSS video files were collected randomly from among those stored by the Department of Rehabilitation Medicine, Dankook University Hospital. The files were acquired from 106 patients who complained of symptoms related to dysphagia between March 2015 and January 2018. All video files were reviewed and confirmed for the presence or absence of airway invasion by two physiatrists experienced in VFSS analysis. Only video files for which the two physiatrists agreed on the presence or absence of airway invasion were selected. Among these files, sixty-nine were excluded due to poor image quality; hence, three-hundred-nineteen files were ultimately included in the VFSS dataset. Airway invasion was evident in 127 of these files, and no evidence of airway invasion was found in the remaining 192 files. Airway invasion was defined as the occurrence of a bolus passing beyond the entrance of the laryngeal vestibule. By separating the video files into individual image frames, two-hundred sixty-seven thousand seven-hundred forty-eight image frames (15,335 with airway invasion and 252,413 without airway invasion) were obtained. Each image frame was labeled for the presence of airway invasion in the same way as the video files were reviewed (agreement between two physiatrists). The study protocol was approved by the Institutional Review Board of Dankook University Hospital (IRB No. 2018-10-028).

2.2. VFSS Protocol

The VFSS procedure was performed following the protocol described by Logemann [1], with minor modifications. Videofluoroscopic images were acquired via lateral projection and stored digitally at a speed of 24 fps (frames per second) while the patient swallowed boluses of various consistencies mixed with contrast medium in a seated position. Materials of different consistencies were swallowed in the following order: 3 mL each of thick liquid (water-soluble barium sulfate diluted to 70%), rice porridge, curd-type yogurt, and thin liquid (water-soluble barium sulfate diluted to 35%), followed by 5 mL of thin liquid from a cup. The study was suspended immediately when aspiration was evident.

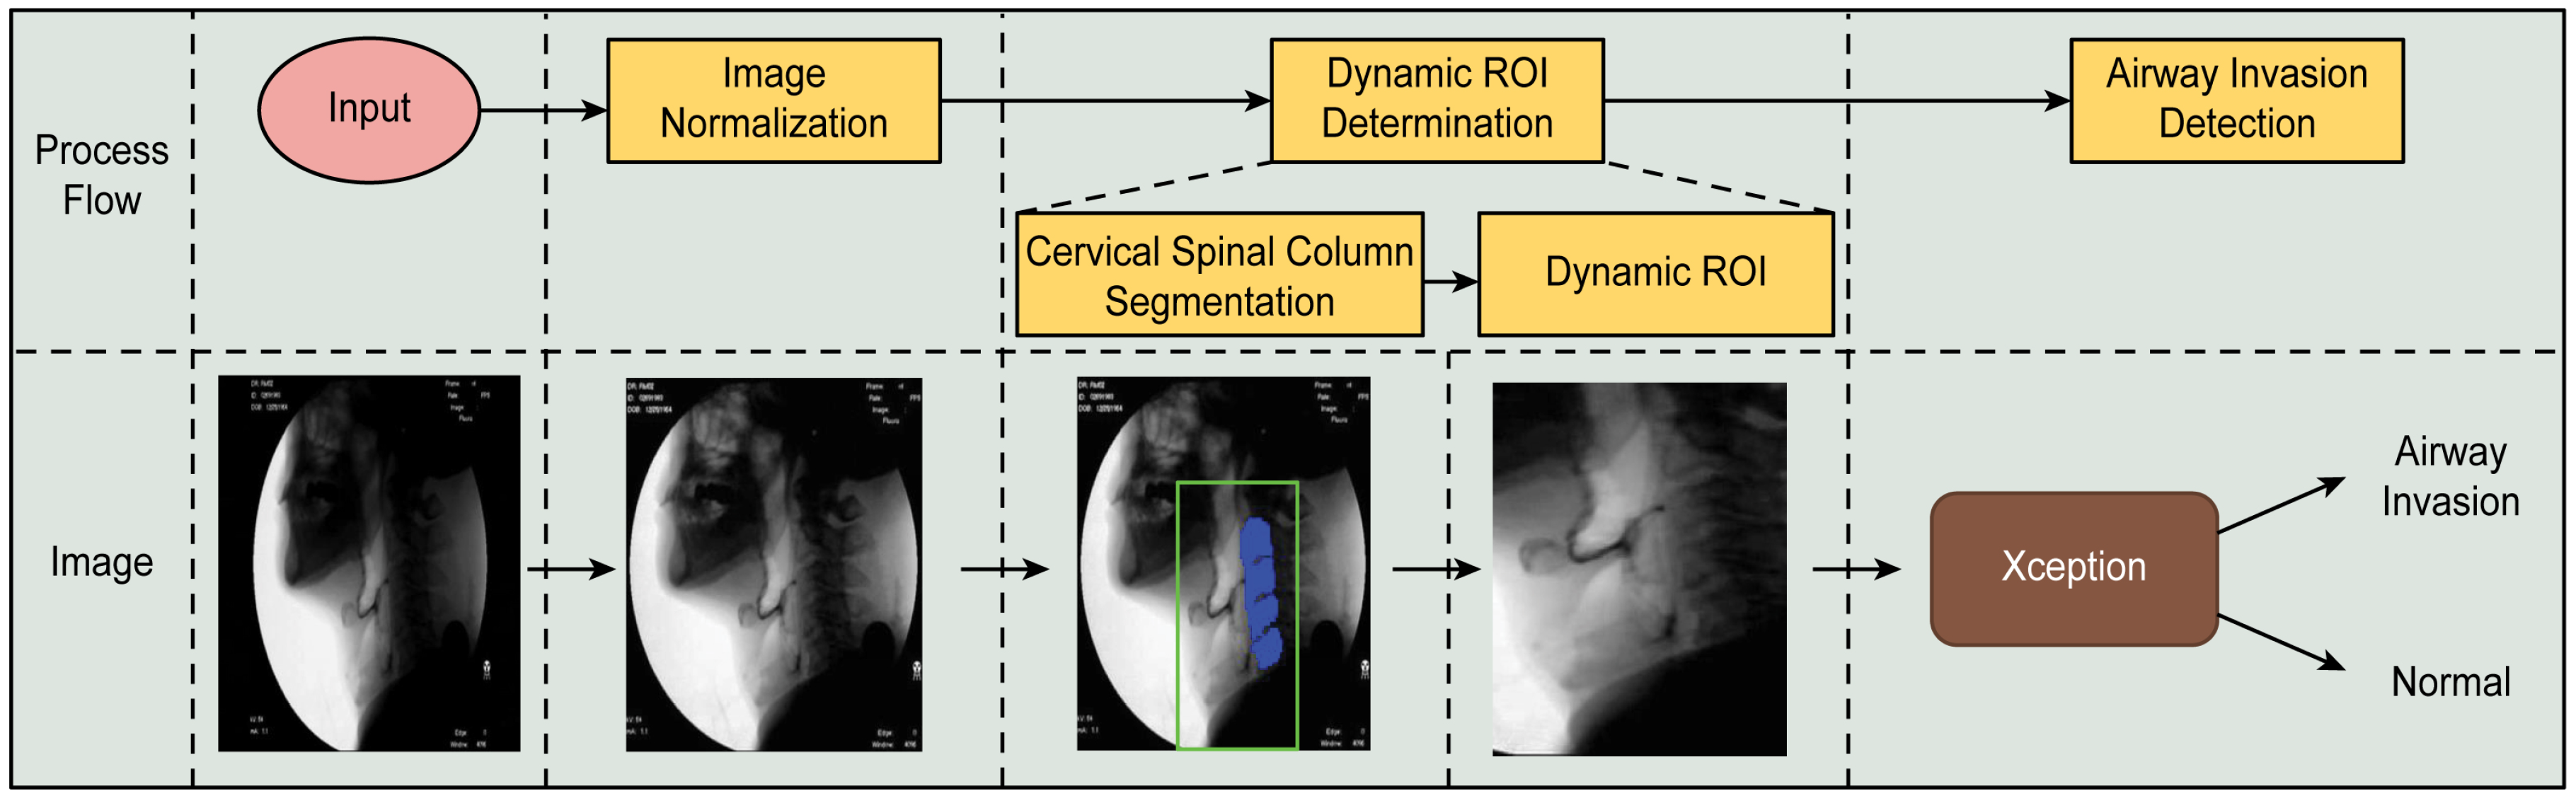
2.3. Proposed Model for the Detection of Airway Invasion

The proposed airway invasion detection model consists of the following stages: (1) dynamic ROI (region of interest) determination and (2) airway invasion detection. The overall process of the proposed method is illustrated in Figure 1.

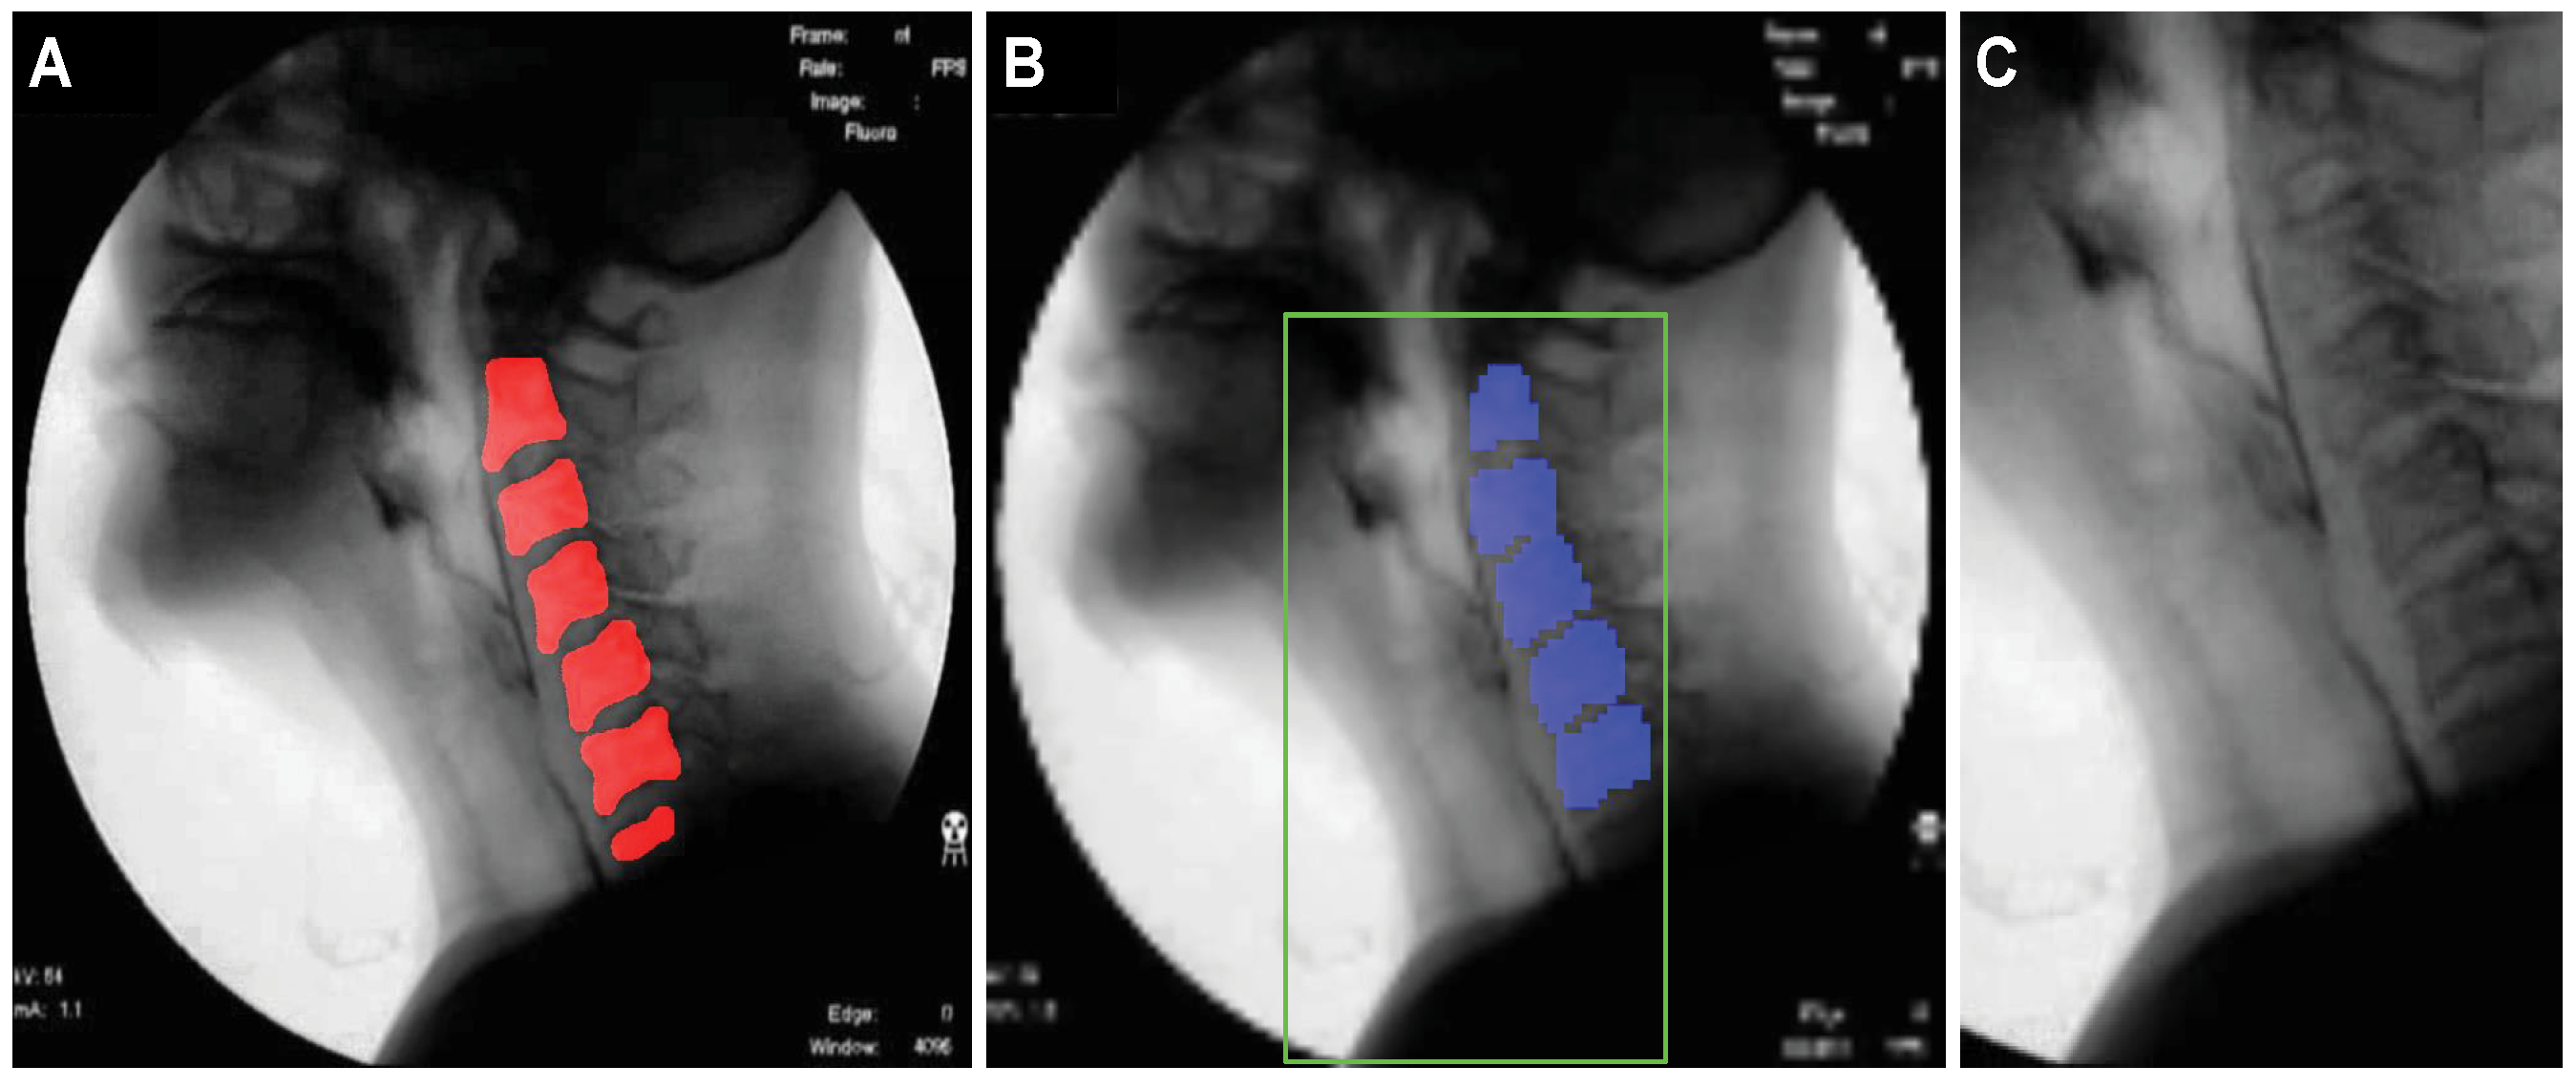
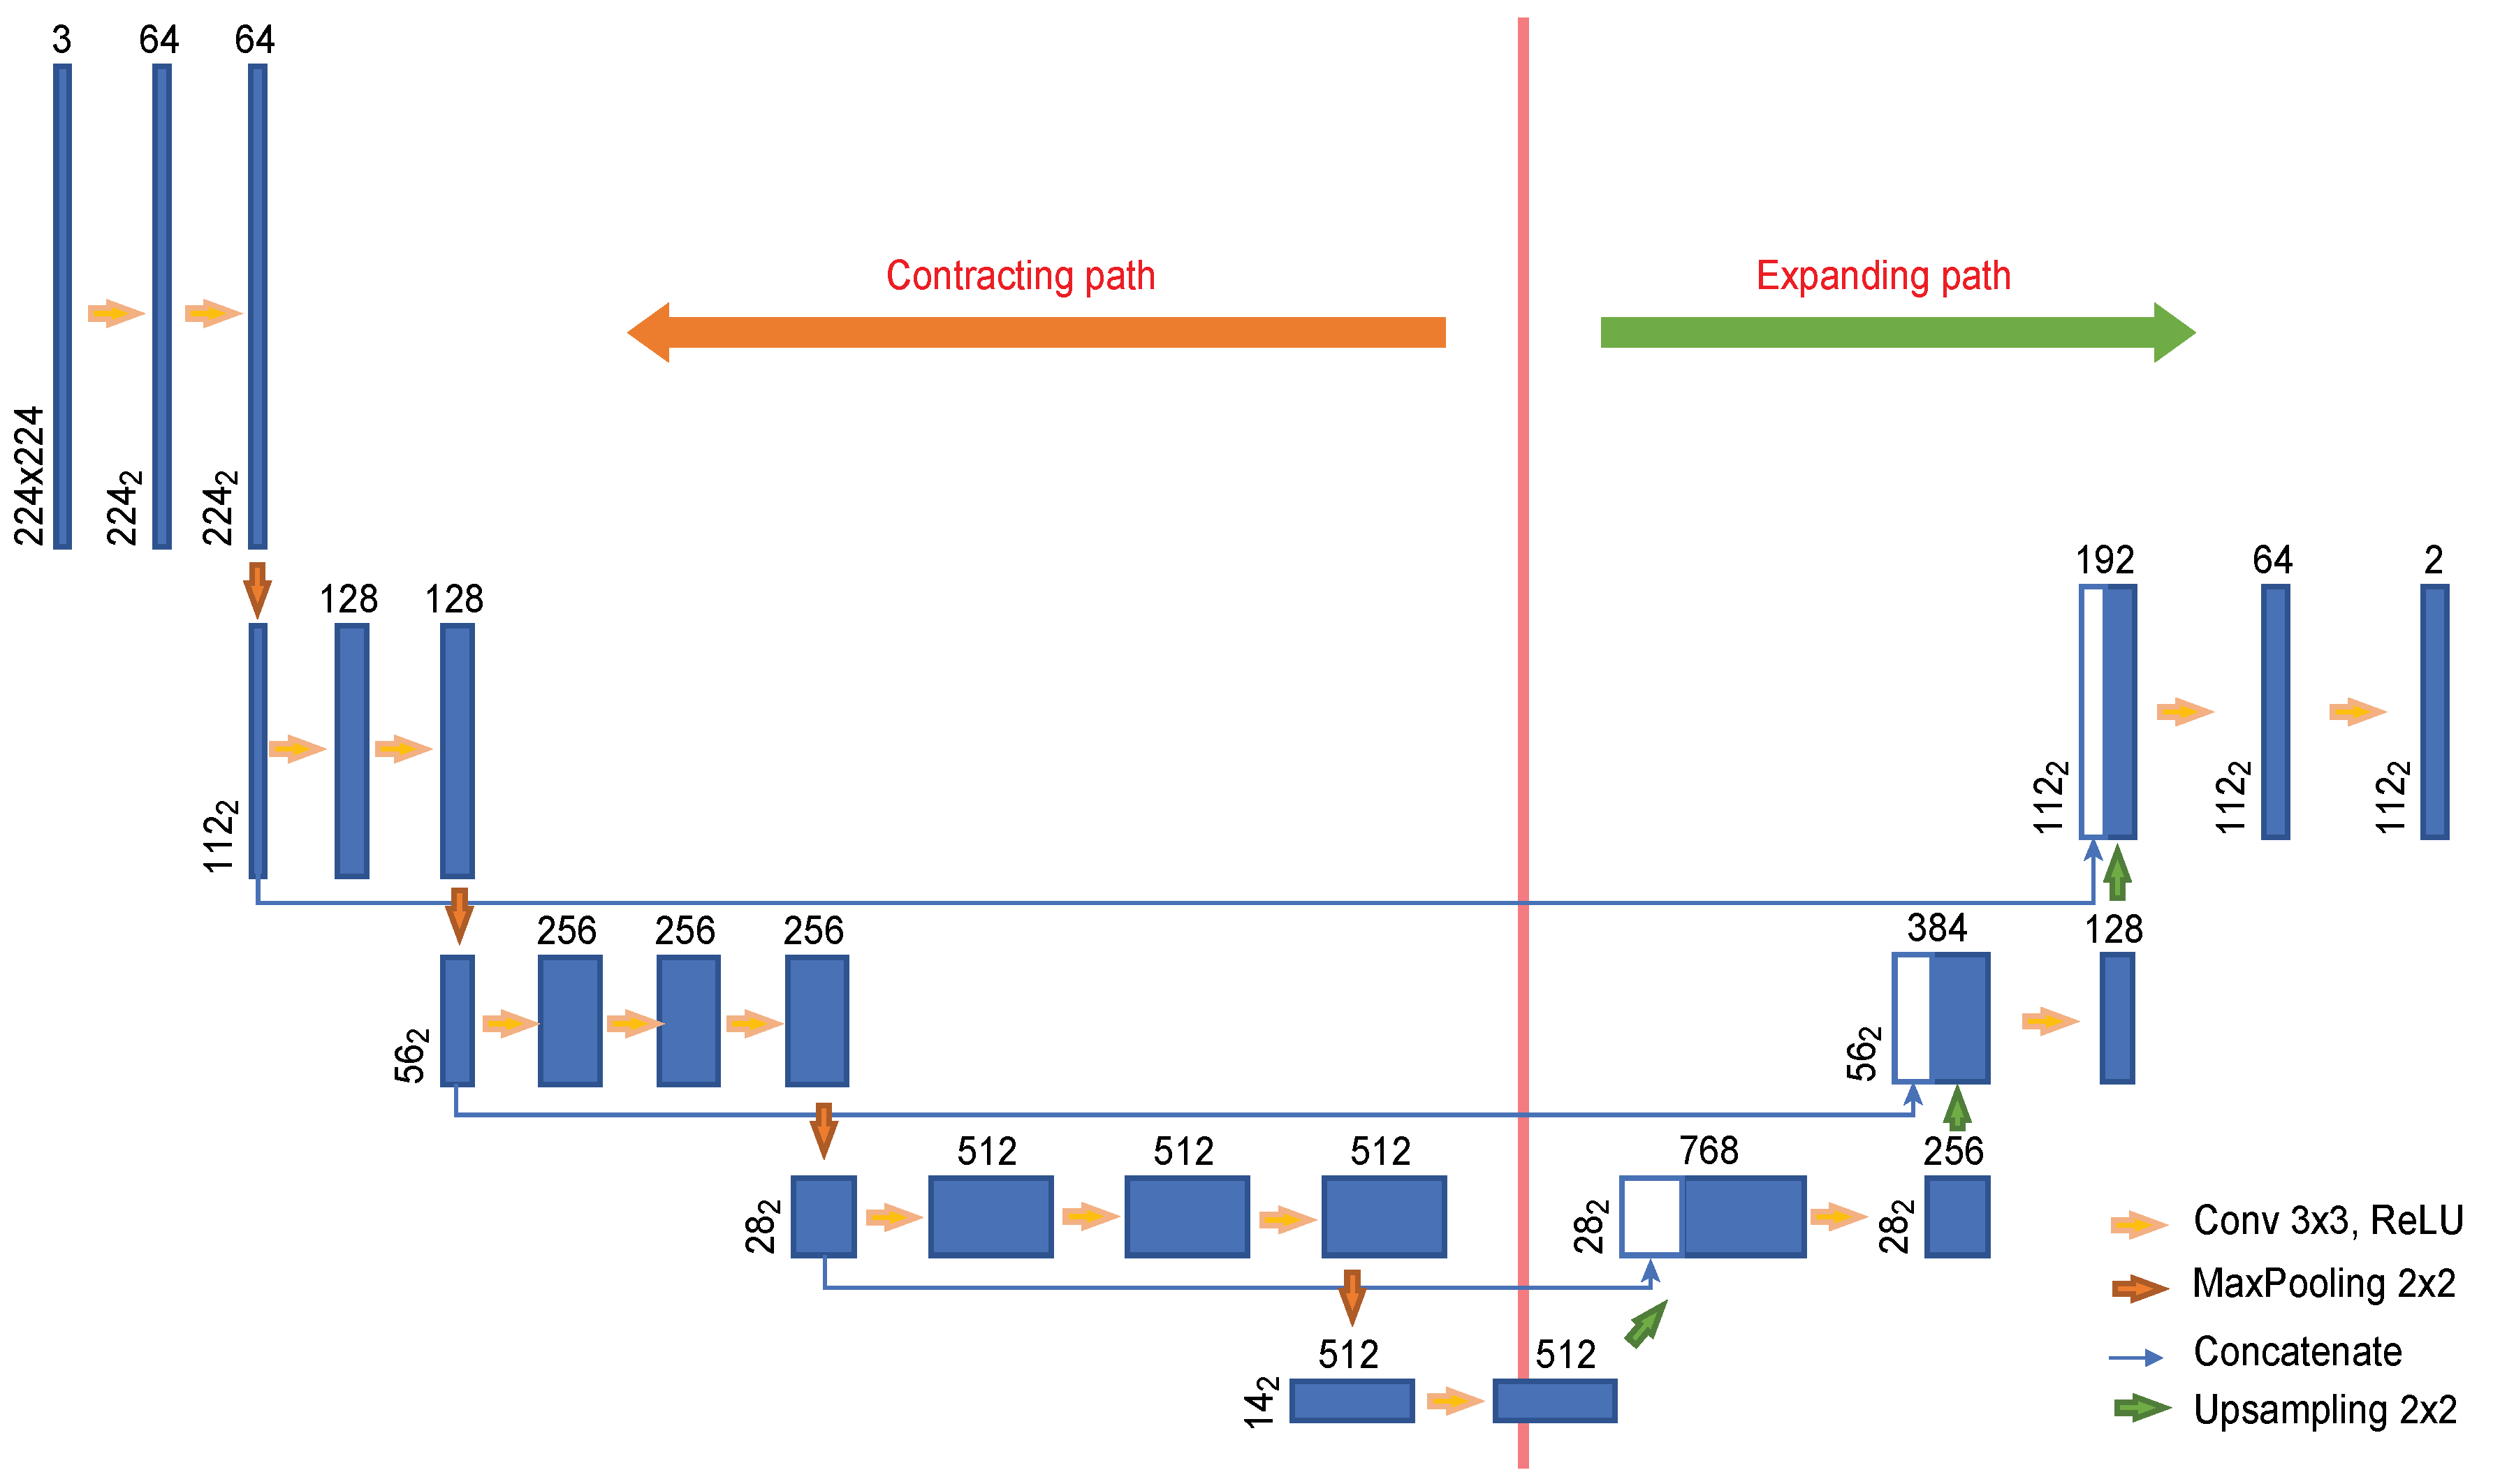
2.3.1. Creation of a Dynamic ROI Using Global Localization of the Cervical Spinal Column

In videofluoroscopic images, the brightness distribution of the pixels often tends to be concentrated in a specific region of the dynamic range, which makes it difficult to train a deep learning model. In addition, there may be a different set of X-ray images acquired with different settings for each person. Therefore, to ensure that all other conditions in all images are identical and that the convolution filters in the deep learning network are effectively trained, we first normalized all of the input images using CLAHE (contrast limited adaptive histogram equalization) [22]. After performing CLAHE, to increase the efficiency of the ROI detection process, we ensured that the X-ray projection area would fill the entire image in each case by removing unnecessary areas of each videofluoroscopic image and then cropped all images to the same size.
In a videofluoroscopic image, airway invasion always occurs in the vicinity of the larynx due to the structure of the throat; therefore, imaging in areas other than around the neck is unnecessary for airway invasion detection. In addition, the complex texture patterns seen in the skull and neck bones can cause difficulties in detecting the occurrence of airway invasion through the analysis of the paths of boluses during swallowing. Therefore, considering the ROI separately is very effective for detecting airway invasion.
As seen from the area inside the green box in the fluoroscopic image presented in Figure 1, since the boluses that provide evidence of airway invasion are always found in front of the cervical spine, in the proposed method, the larynx and its adjacent area are selected as the ROI for effective airway invasion detection. However, since the head and neck move every time a patient swallows while participating in the VFSS procedure, rather than fixing the ROI to a specific area of the image, it is necessary to create a so-called dynamic ROI that adaptively moves in accordance with the patient’s movement. To this end, in the proposed method, a cervical spinal column showing large and structurally prominent features is found for each fluoroscopic image and used as a reference point for defining the ROI.
To locate the cervical spinal column in each fluoroscopic image, we chose to use U-Net [23], which is widely used for the segmentation of biomedical images. U-Net is an end-to-end FCN (fully connected network)-based model consisting of a convolutional encoder and a convolutional decoder connected by skip connections [24]. The U-Net architecture is particularly suitable for our purposes because a network with this architecture can be successfully trained on a small amount of data.
To train the U-Net model, one-hundred sixty-two videos, corresponding to approximately 50% of the 319 total video files, were randomly selected, and a single image frame with a clear view of the cervical spinal column in each video file was selected for inclusion in the training set. The test set consisted of 157 image frames, one from each of the remaining 157 video files that were not used for training. The pixels in the cervical spinal column region, corresponding to the red region in Figure 2A, were labeled as positive, and based on these labels, the localization performance of the U-Net model was evaluated.
To effectively train the network on a small amount of data, we used the transfer learning [25] technique. Since VGG-16 [26] pretrained on ImageNet is utilized as the convolutional layers in the U-Net encoder, the input images were resized to dimensions of 224 × 224. Figure 3 shows the U-Net architecture used in this experiment. The encoder is composed of eleven convolutional layers, and four convolutional layers are used in the decoder. Each image with dimensions of 224 × 224 provided as input is passed through the convolutional encoder to extract a feature with dimensions of 14 × 14. This feature is used to find the cervical spinal column in an image reduced to dimensions of 112 × 112 as it passes through the convolutional encoder. As seen in the U-Net structure, the features extracted by the encoder are passed to the convolutional decoder to obtain better segmentation results. However, because our goal is to locate the cervical spinal column, not to perform segmentation, the network was constructed with an output stride of 2.
Based on the localization results for the cervical spinal column, the ROI is set to a rectangular shape that includes the larynx, the cervical spine, and adjacent areas. The center coordinates of the pixels corresponding to the cervical spinal column are used as the reference point to specify the ROI. The blue pixels in Figure 2B represent the pixels classified as belonging to the cervical spinal column by U-Net. If the number of pixels classified as belonging to the cervical spinal column is N, then the coordinates of the reference point for the ROI are ( μ x , μ y ), where μ x = 1 N i = 1 N x i and μ y = 1 N j = 1 N y j . Here, x i and y j ( i ,   j   =   1 ,   2   ,   ,   N ) denote the coordinates of each pixel in the ROI when the upper left corner of the image is the origin. The bottom of the ROI is set to coincide with the bottom of the image, and the coordinates of the upper left and upper right corners are determined heuristically based on ( μ x ,   μ y ) to be ( μ x 0.7 R ,   μ y 0.5 R ) and ( μ x + 0.3 R ,   μ y 0.5 R ) , respectively, where R = 299 .
The green box in Figure 2B represents the ROI that is automatically defined using the proposed method, and Figure 2C shows the image resized to dimensions of 299 × 299 .

2.3.2. Design of the Airway Invasion Detector

The occurrence of airway invasion is detected by judging the characteristics of the movement of a bolus when swallowed, that is whether the bolus is moving toward the airway rather than toward the esophagus. Since it is impossible to predict when airway invasion will occur for each person in a video file that is approximately 2 to 104 s long, we first determine whether airway invasions are evident in individual image frames, and based on the results, we finally determine whether airway invasions have occurred in the corresponding video file using context information.
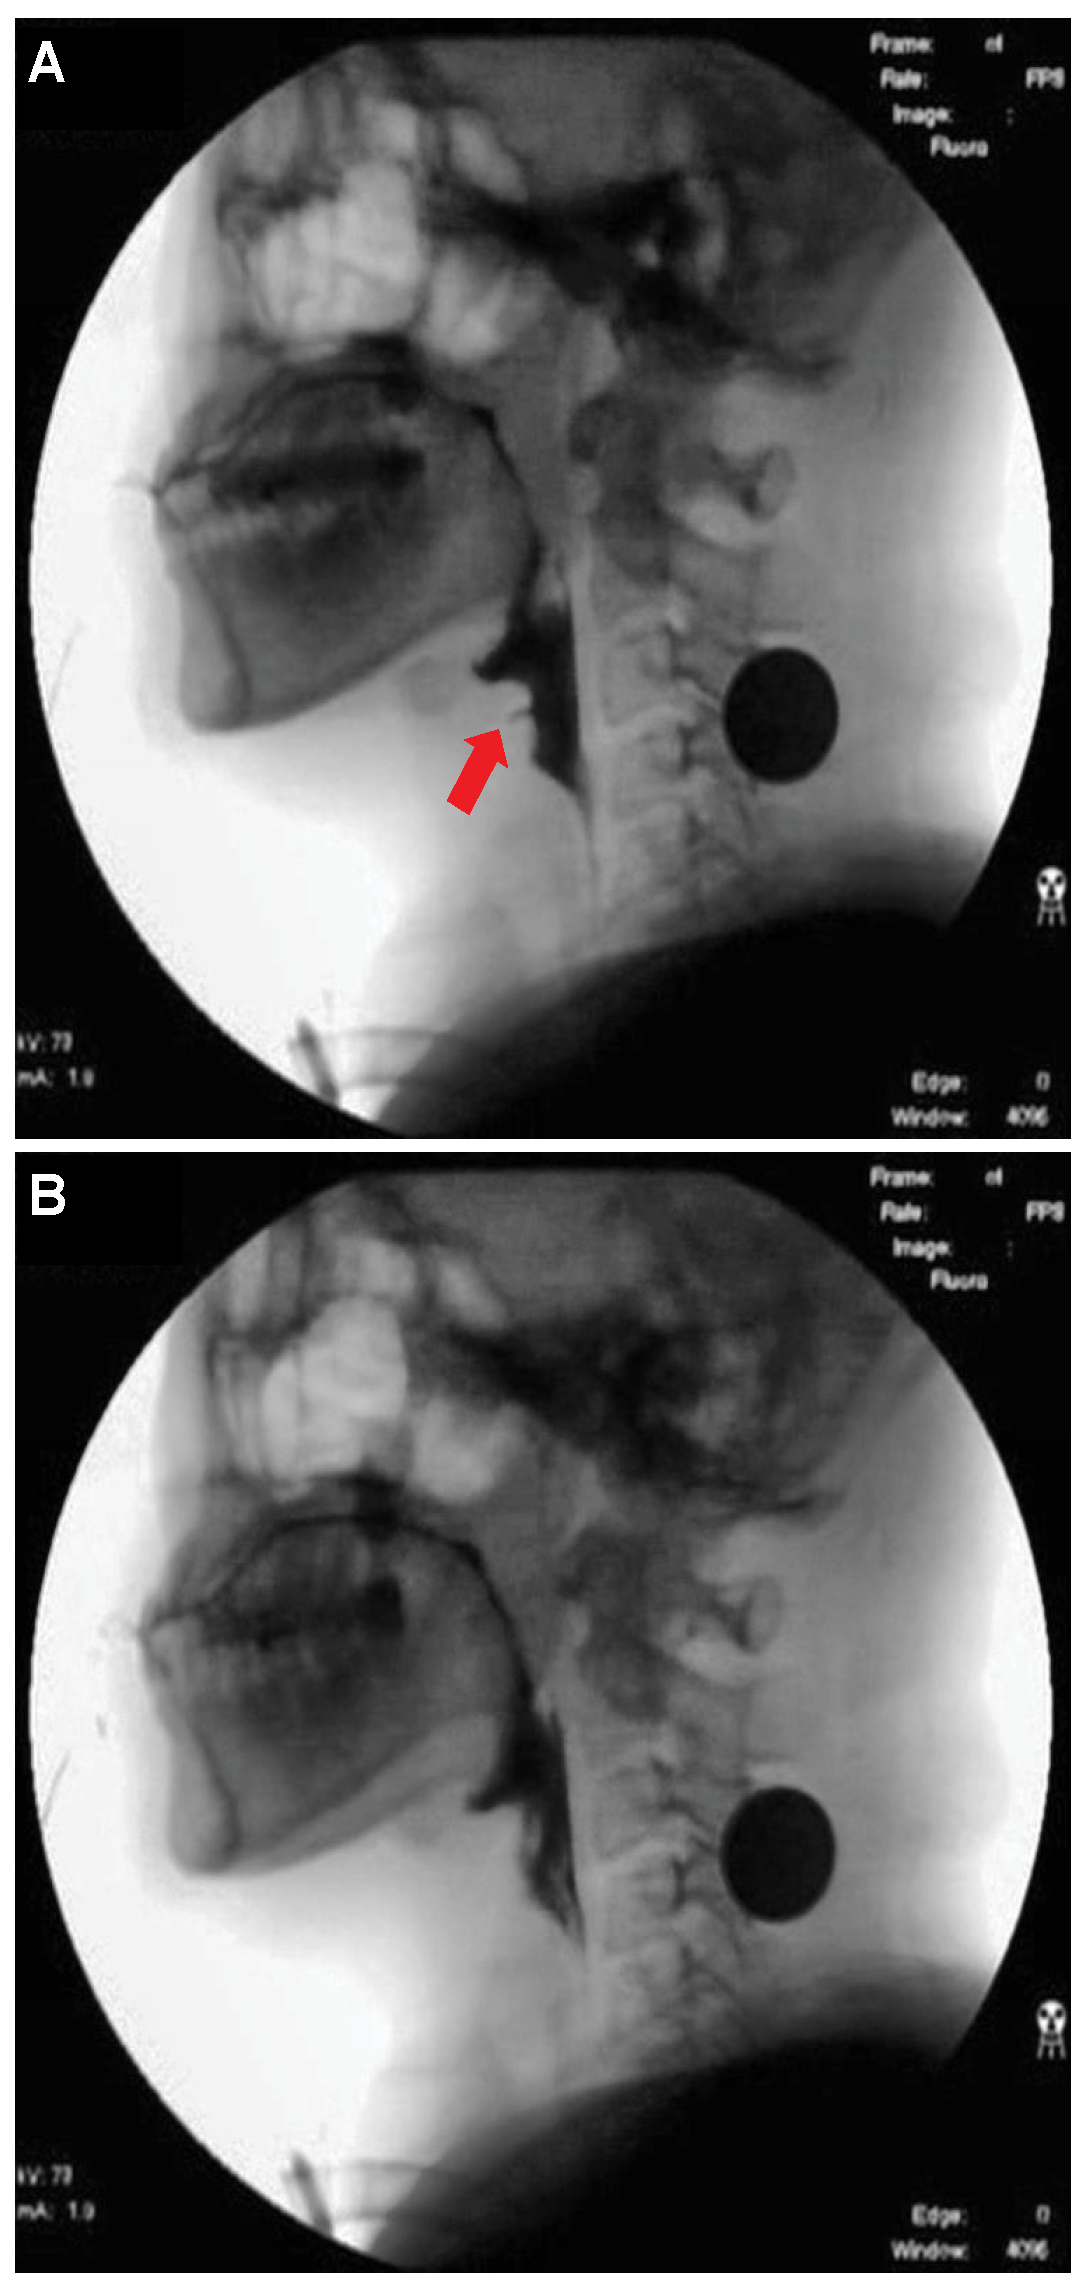
  • Deep neural network for the detection of airway invasion:
    As described in Section 2.3.1, the ROI image (Figure 2C) specified using U-Net is used as the input image for airway invasion detection. To identify the occurrence of airway invasion in individual image frames, we designed a DCNN (deep convolutional neural network)-based classifier. Based on the position and shape of the bolus in the image, the classifier distinguishes whether the bolus is passing normally through the esophagus (normal swallowing action) or whether airway invasion has occurred.
    A deep neural network contains numerous connections between neurons, and a weight is assigned to each connection. The deeper the network is, the greater the number of weights to be learned, where this increase scales exponentially; consequently, sufficient data are needed to prevent overfitting. Therefore, among the models that can be effectively trained on limited data, in this paper, we choose a CNN based on an Xception module [27]. The Xception architecture not only reduces the number of parameters to be learned by performing convolution on each channel of the image, but also has the advantage of efficiently utilizing spatial and cross-channel correlations in the image (Figure 4). Additionally, by means of residual connections, the degradation problems that can occur as the network deepens can be avoided. In the Xception architecture, data are processed through three flows, namely (1) the entry flow, (2) the middle flow, and (3) the exit flow, and this architecture consists of convolutional layers with a total of 36 3 × 3 filters. All common convolutional and separable convolutional layers are followed by batch normalization [28].
    For airway invasion detection, we defined the image frames corresponding to instances of airway invasion as the positive class (Figure 5A) and the remaining image frames as the negative class (Figure 5B) and designed a CNN classifier using the Xception architecture with a binary output. Among the 15,335 positive image frames and 252,413 negative image frames included among all 319 video files, seventy percent of the videos in each class were used as training data, and ten percent were used for the validation of the trained network. The remaining 20% of the videos were used as test data to evaluate the final performance of the proposed classifier. Table 1 shows the total number of image frames used in the experiment and the numbers of frames in each class used for training, validation, and testing.
    In this study, we used an Xception module [27] pretrained on ImageNet and fine-tuned through transfer learning [25] on videofluoroscopic image data (Figure 4). The pretrained Xception module takes an image with 3 channels and dimensions of 299 × 299 as the input, whereas a video fluoroscopic image is a grayscale image with a single channel. Therefore, we used the same grayscale ROI image resized to 299 × 299 as the input to each of the three channels. The transfer learning procedure increased the validation accuracy by approximately 5% compared to training from scratch.
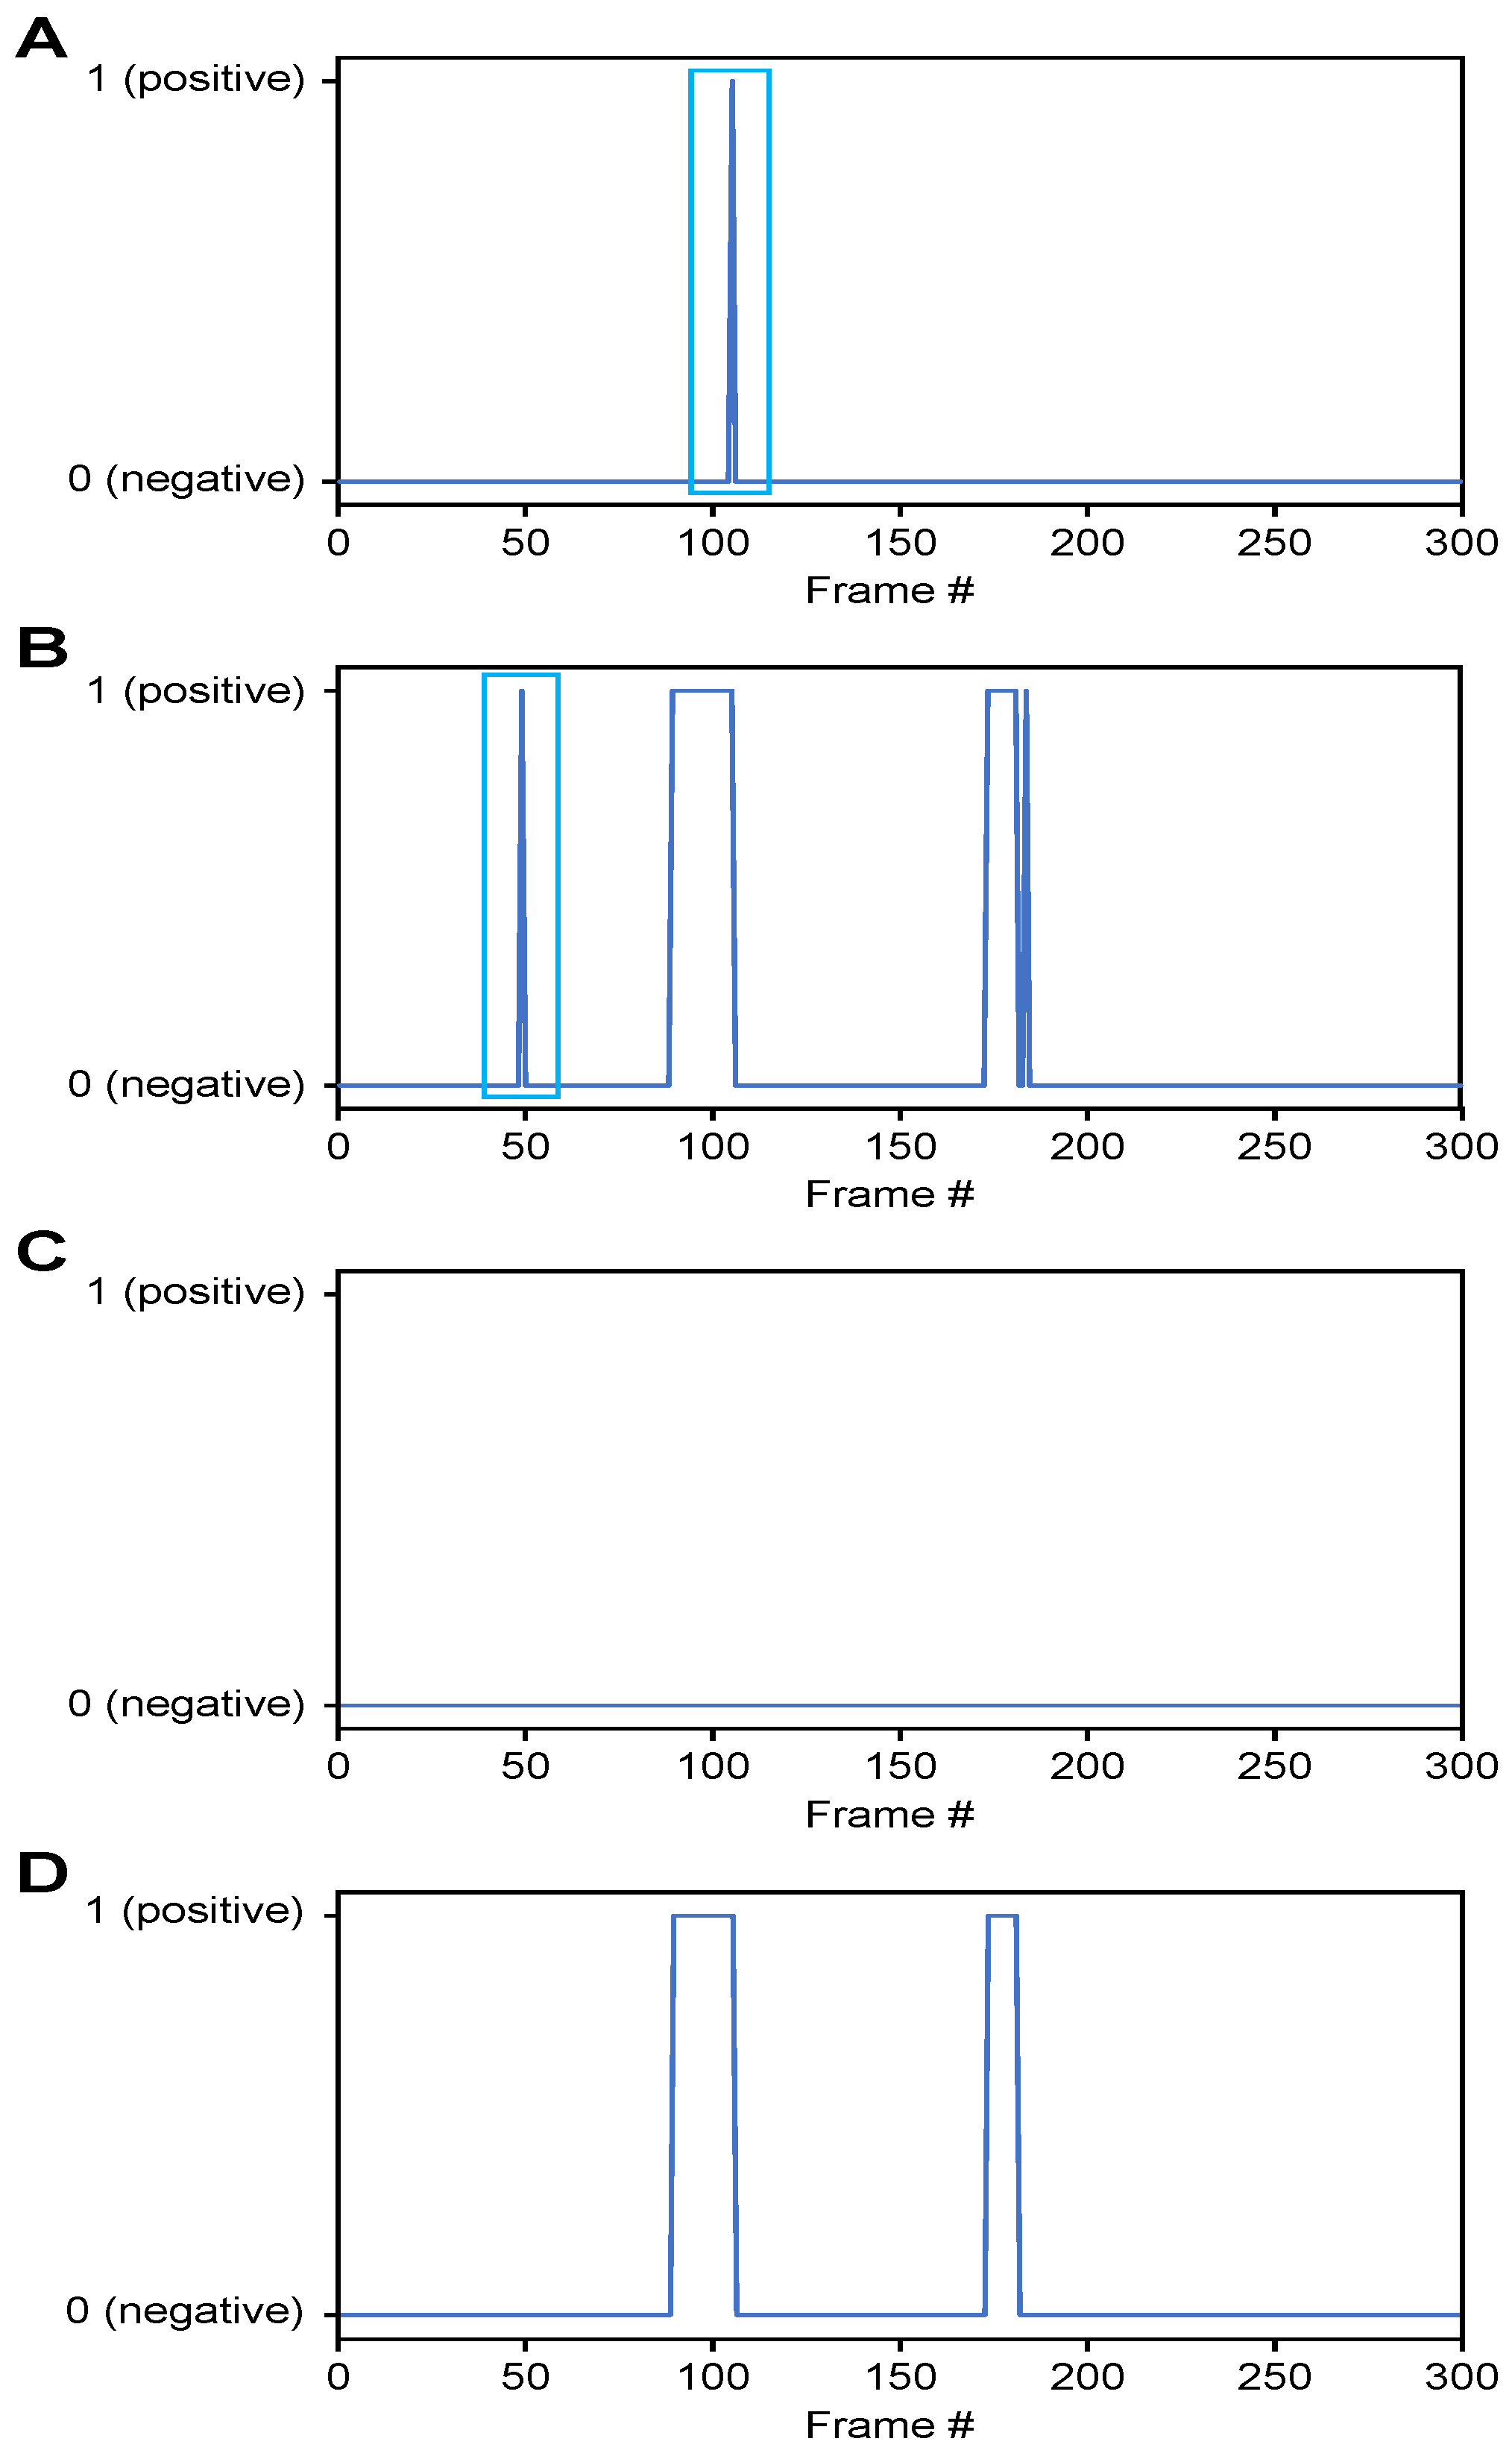
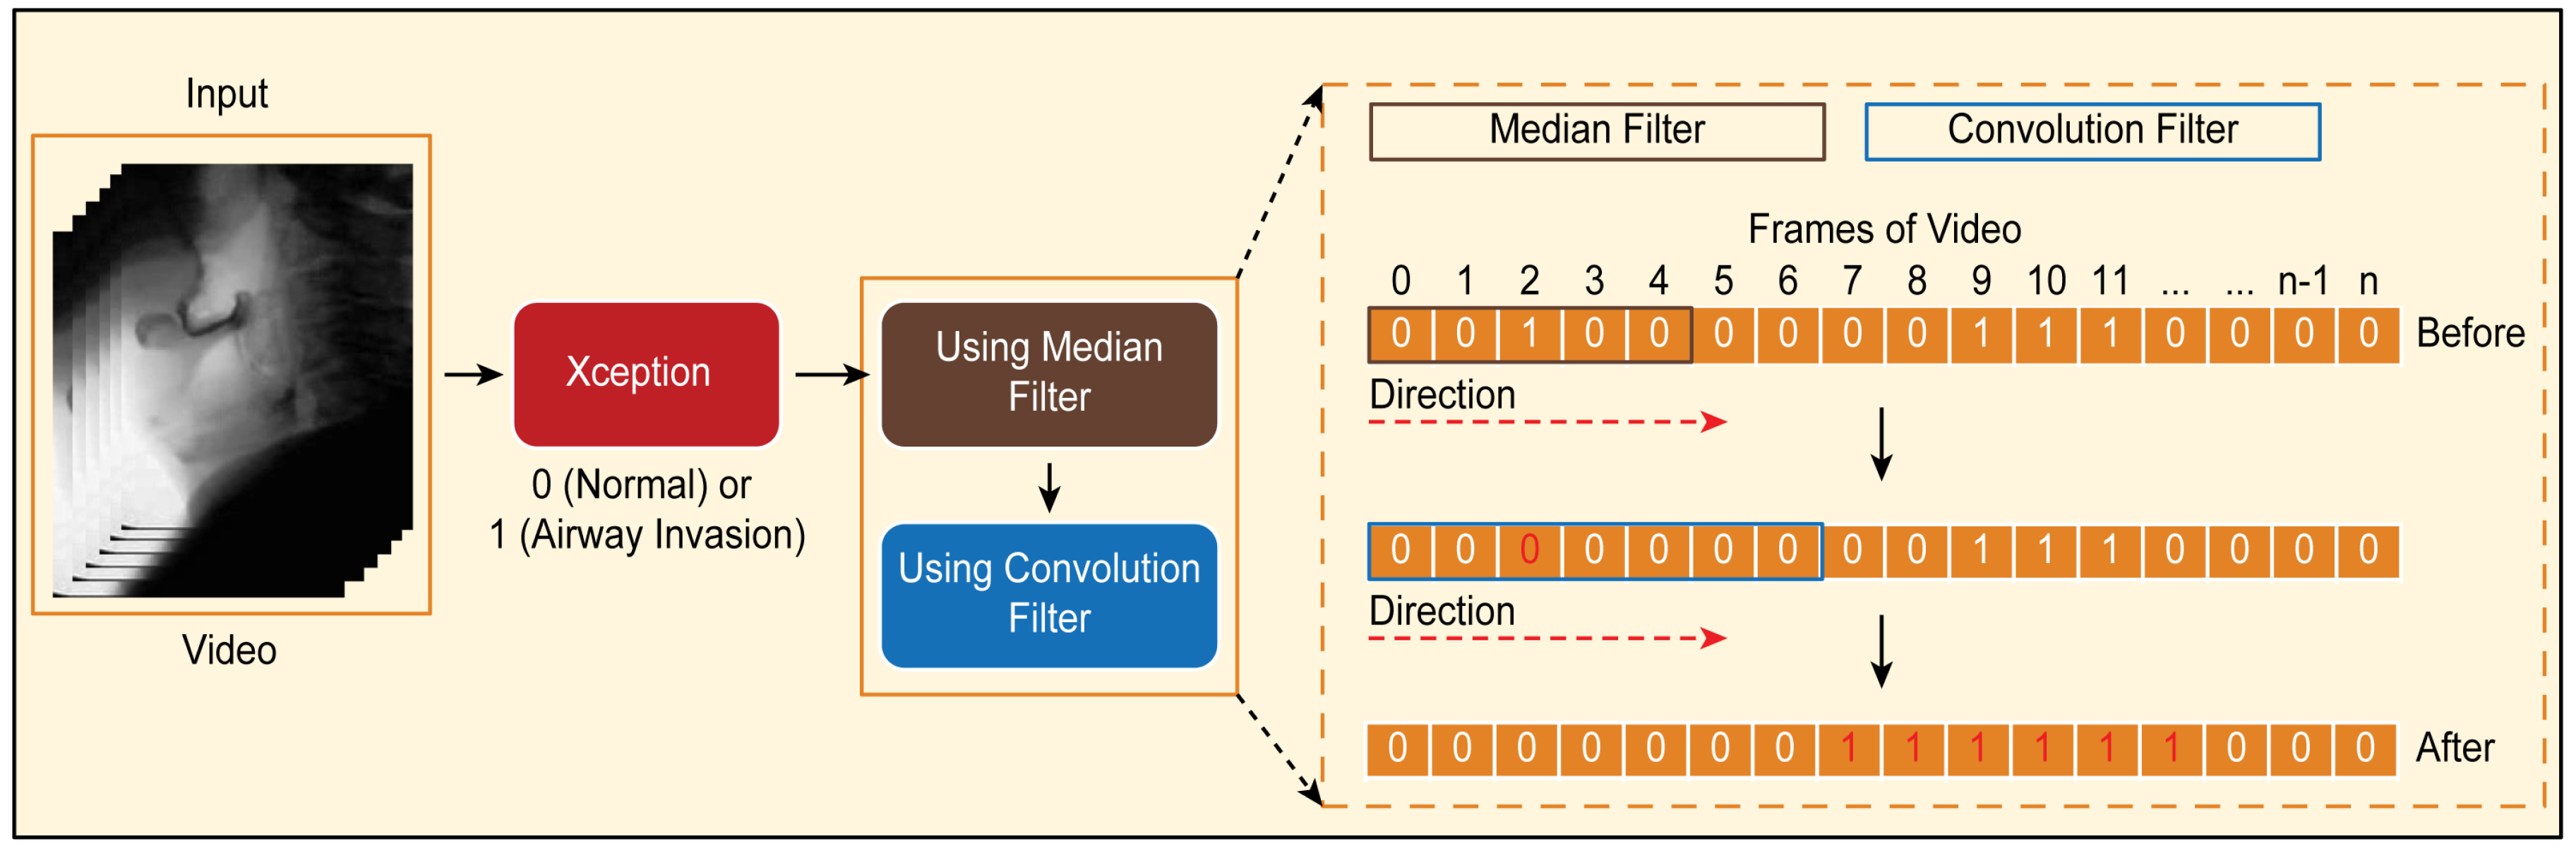
  • Classification of airway invasion for a whole video:
    Figure 6 shows the classification results of the Xception module-based CNN for each image frame included in the videos from two subjects participating in the VFSS procedure (Figure 6A: results for a person with normal swallowing; Figure 6B: results for a patient). In Figure 6, the horizontal axis shows the acquisition time index of the image frames, and the vertical axis shows the classification result for each image frame. A value of 1 appears for a frame that is classified as positive, and a value of 0 indicates a negative classification.
    Based on the classification results for the individual image frames as shown in Figure 6, we can finally determine whether airway invasion occurred in a particular video of a subject participating in the VFSS. Since the bolus-swallowing motion is a continuous motion, the images acquired during a true instance of airway invasion should be classified as positive samples continuously along the time axis. To capture the temporal context of each video in the final decision on whether airway invasion has occurred, we applied two types of filters, namely a median filter [29] and a convolution filter, to the classification results for the individual images, as shown in Figure 6.
    First, since the video files we used were recorded at 24 fps, it is reasonable to regard positive samples generated in the form of intermittent impulses, as indicated by the blue boxes in Figure 6A,B, as false positives. Therefore, we chose to correct the classification results for such samples to negative results using a median filter with a length of 5. From a similar perspective, we determined that airway invasion can be considered to have occurred only when two or more of the classification results for seven consecutive image frames are classified as positive samples. Formally, let the vector r R l contain the classification results (Figure 6) for all image frames of a video composed of l frames. We consider that airway invasion has occurred only when the following F r is two or more:
    F r = i = 1 l k r ( k ) f ( i k )
    Here, f is a convolution filter of length 7 with a value of 1 for all components (Figure 7).

3. Results

3.1. Network Training

User parameters that can be considered when designing a deep learning network are the learning rate, batch size, and network size. Since there is no general rule for determining the batch size, we empirically set the batch size. When we experimented with the batch sizes of 16 and 32 in the case of U-Net, the result of 32 was better; in the case of exception-based CNN, when the batch size was experimented with 2, 4, and 8, the result of eight was the best. To effectively train a deep neural network, if the batch size is large, the learning rate should be set to a high value, whereas when the batch size is small, a low learning rate should be set to mitigate the influence of defective data that may exist in each individual batch. Therefore, we set the learning rate to 0.1 b / 256 by using the linear scaling learning rate method [30] to determine the learning rate in accordance with the batch size (b is 32 for the U-Net model in Section 2.3.1 and eight for the Xception module in Section 2.3.2).
Since airway invasion occurs for only a short period of time during the entire run time of a video file, as shown in Table 1, there are more image frames classified as negative than image frames classified as positive. To alleviate the problem of data imbalance between these classes, we used the focal loss function [31]. The focal loss function assigns lower losses to classes that include many samples, and thus can be classified relatively frequently, in order to concentrate more on learning the characteristics of more difficult classes (with fewer samples) by increasing the corresponding loss updates. In both the global localization of the cervical spinal column (Section 2.3.1) and the CNN-based detection of airway invasion (Section 2.3.2), finding a positive sample can be considered a relatively difficult task compared to finding a negative sample. Therefore, instead of the cross-entropy loss used in general classification problems, we trained the network using the following focal loss function ( F L ):
F L ( p t ) = ( 1 p t ) γ l o g ( p t )
Here, p t is the model’s estimated probability of the positive class, whereas 1 p t is the estimated probability of the negative class, and γ is empirically set to two.

3.2. Evaluation Metrics

Both the global localization of the cervical spinal column to define the dynamic ROI for each individual image frame and the classification of airway invasion occurrence in each ROI image are one-class classification problems. We evaluated the performance of the U-Net model for the global localization of the cervical spinal column and the Xception-based CNN for airway invasion detection on the basis of the receiver operating characteristic (ROC) curve, which is widely used in detection problems. The main metrics used for performance evaluation are as follows: (1) accuracy: the ratio of the number of correctly predicted observations to the total number of observations; (2) recall: the ratio of the number of correctly predicted positive observations to the total number of observations actually belonging to the positive class; (3) precision: the ratio of the number of correctly predicted positive observations to the total number of predicted positive observations; (4) F1-score: the weighted average of precision and recall, i.e., F1-score = 2 * (recall * precision)/(recall + precision); (5) negative predictive value (NPV): the ratio of the number of correctly predicted negative observations to the total number of predicted negative observations.

3.3. Performance Evaluation for the Global Localization of the Cervical Spinal Column

U-Net determines whether each pixel in an image is a positive or negative pixel. In our experiment, the pixels corresponding to the cervical spinal column were defined as positive.
Table 2 shows the results of detecting the cervical spinal column using U-Net. The performance was evaluated on 157 images that were not used to train the U-Net model, and the values presented in Table 2 were measured at the pixel level. For example, the recall refers to the ratio of the number of pixels predicted to belong to the cervical spinal column by the designed model with respect to the ground truth (pixels labeled as belonging to the cervical spinal column by human annotators). As shown in Table 2, our designed U-Net model detects the cervical spinal column very well, with 75.6% recall, 99.0% accuracy, 88.7% precision, and 94.8% average precision (Figure 8).
Figure 9A shows an example of the cervical spinal column (red area) detected by U-Net. For the 48∼2500 image frames included in one video, the standard deviation of the coordinates of the central point of the cervical spinal column in the 299 × 299 -sized images is 11 pixels, demonstrating that the localization performance of U-Net for the cervical spinal column is relatively stable. Figure 9B shows an ROI image obtained as described in Section 2.3.1 based on the detected center of the cervical spinal column. In Figure 9B, it can be seen that the ROI is effectively extracted to capture the vestibule and larynx without being affected by head and neck movements during recording.

3.4. Performance Evaluation for Airway Invasion Detection

The performance of airway invasion detection was evaluated in the following two ways: (1) airway invasion classification for individual image frames using the Xception module-based CNN and (2) airway invasion judgment for video clips containing swallowing motions using context information. The classification performance for individual image frames was evaluated on 76,797 frames, corresponding to 20% of all videos not used for network training, and the video-level accuracy was also evaluated on 82 video files not used for training. On average, two to three swallowing motions were recorded in one video file, and we evaluated a total of 179 swallowing motion videos by manually separating the parts of the videos corresponding to different swallowing motions. The accuracy, precision, recall, F1-score, and NPV were used as the evaluation metrics for both individual image frames and videos.
Table 3 and Figure 10 show the classification results and ROC curve, respectively, obtained for individual image frames using the CNN based on Xception. In Table 3, the recall refers to the ratio of the number of images classified as positive by the proposed detector to the number of images manually labeled as positive by the two physiatrists (where a positive label indicates that airway invasion was found). As shown in Table 3, the proposed detector achieves 74.2% recall, 97.2% accuracy, and 59.1% precision (Figure 10).
Table 4 shows the final airway invasion detection results obtained for complete videos by utilizing the context information (by means of Equation (1)) provided by the classification results for individual image frames. As seen from Table 4, the decision process for airway invasion during swallowing shows 91.2% recall, 93.2% accuracy, and 88.1% precision.

4. Discussion

In the present study, a deep learning model that can detect airway invasion from VFSS images without requiring any human effort was successfully developed. The entire procedure is accomplished in a fully automated manner, including image preprocessing, segmentation of the cervical spinal column, and finally, detection and reporting. As the deep learning network used in each module, we used U-Net developed for the segmentation of biomedical images and Xception module-based CNN for image classification. However, the specific type of deep learning network to be used for each module is optional. We used U-Net, which was developed for segmentation of biomedical image, for ROI determination, and other networks for segmentation [32,33] can be applied as well. Likewise, in addition to the Xception module-based CNN we used in this experiment, other networks [24,34] for image classification can be used. Among the many variables in the VFSS, airway invasion (laryngeal penetration and aspiration) was selected as the target of model development because it has the greatest clinical significance. The occurrence of airway invasion corresponds to food materials entering the larynx and possibly proceeding down to the trachea and bronchial trees, potentially resulting in pulmonary morbidity or even mortality. The present model classifies image frames showing airway invasion with an overall accuracy of 97.2%. To the authors’ knowledge, the fully automatic detection of any kind of abnormality from VFSS images has never previously been attempted. Most previous studies have used obsolete semiautomated identification and/or tracking algorithms [12,13,14,15], in which salient landmarks must first be demarcated by humans. Two previous studies have attempted fully automated analysis of VFSS images, but did not address pathological findings. One of those studies investigated the accuracy of a deep learning model for the automatic identification of the hyoid bone [16]. The other study examined the utility of a deep learning model for the automatic detection of the pharyngeal phase, which is the main concern in swallowing evaluations [21]. Both studies reported considerably high accuracy, proving the usefulness of deep learning in VFSS analysis, but they did not address any pathological changes.
One of the distinctive features of the present study is the creation of the “dynamic” ROI. A dynamic ROI is particularly important to avoid disturbances due to movements of the head and neck. During a VFSS examination, most patients will constantly move their head and neck to overcome their difficulties in swallowing. Identification and tracking of the boluses becomes difficult for both humans and machines when the position of the head and neck is changing among a set of VFSS images. A bolus travels from the oral cavity to the esophagus along a rather simple path that can be easily followed in VFSS images if the positions of the background structures are fixed. However, the passage of the bolus may appear irregular when the locations of the anatomical structures randomly change due to head and neck movements. To address this movement issue, a dynamic ROI generator was developed separately for application before airway invasion detection. The ROI is “dynamic” because its position moves in accordance with a detected reference point, which is chosen to be the center of the cervical spinal column. The cervical spinal column is located just behind the larynx and can be segmented using the U-Net segmentation network, with an overall accuracy of 99.0%. The distance and relative position between the larynx and the cervical spine usually remain constant even when an individual moves his or her head and neck. From the dynamic ROI obtained using the proposed method, more stable images can be obtained, with minimal movement of background objects, even when patients move their head and neck. Consequently, the task of airway invasion detection is considerably simplified, as the images can be classified based only on the position of the bolus. Consequently, with the consideration of a dynamic ROI, the accuracy of airway invasion detection is dramatically improved compared with the results of a pilot test, although these results are not shown in this article.
The performance of the model was tested in two ways: per frame and per swallow. The performance per frame was defined as the accuracy of classifying image frames with airway invasion among all 76,797 image frames in the test set only, regardless of the individual patient from whom each image frame was taken. Meanwhile, the performance per swallow was defined as the ability to classify the video clips containing the image frames showing airway invasion. The present model demonstrated an overall accuracy of 97.2% in classifying image frames. However, its recall, or sensitivity, was rather unsatisfactory (74.2%), and its precision was 59.1%. By contrast, the specificity and NPV were 98.0% and 99.0%, respectively, indicating that negative results are more reliable. The present model showed “more balanced” results in terms of the performance per swallow, with a slightly lower accuracy (93.2%), specificity (94.2%), and NPV (95.8%), but much higher recall (91.2%) and precision (88.1%). The performance per swallow can be considered more crucial for clinical applications because the occurrence of airway invasion in every swallowing event is one of the primary concerns in the analysis of VFSS data. The observed agreement of 93.2% can be recalculated to an inter-rater reliability (Cohen’s k coefficient) of 0.86 between the computer and the human raters. Given that the inter-observer reliability among human observers has been reported to be in the range of 0.3∼0.8 for judging the presence of penetration or aspiration, it can be considered that the present model shows very good agreement with the human raters, although the dataset was labeled based on agreement between only two human observers.
The present model is valuable for clinical practice in many respects. It can provide screening information to clinicians to allow them to identify the airway invasion more accurately and efficiently. Errors from human fatigue will be reduced because human observers only need to confirm the results provided by the machine. This model could be developed into a more comprehensive analysis program by combining with models to be developed for the analysis of other parameters of VFSS in the future. Incorporating the present model into the recording software of the VFSS may increase safety by generating real-time warnings to the medical personnel for the presence of airway invasion. The VFSS procedure would be paused to prevent further airway invasion. In the present study, more effort was made to reduce false negatives than false positives in the present study, as the goal of this study was to develop a basis for screening or assistance tools for human analysts. If the number of false negatives is negligible, only positive results need to be reviewed by human observers. Although this result was not presented in the previous section, the false negative rate in swallow classification was 0.9%. Specifically, the model failed to classify five out of 57 swallowing events with airway invasion. When all images missed by the model were reviewed, no aspiration was found to be misinterpreted as normal, and all false negative images showed penetration corresponding to a PAS (penetration aspiration score) of two, in which the bolus invades the laryngeal vestibule, but does not cross the true vocal folds and is expelled immediately after swallowing [35]. In most of the false negative images, the shadow of the penetrating bolus appeared less opaque, which can be explained by either a small volume of airway invasion or an insufficient amount of contrast medium. If a small penetration volume is the cause of such an error, it may not have clinical significance because a small amount of PAS two penetration can also be present in normal subjects. Regarding the contrast medium, an adequate and standardized amount is necessary for human inspection, as well as machine-based inspection. Thus, it is believed that in either case, the clinical significance of the false negatives generated by the present model should be minimal.
The present study has a few limitations. The size of the dataset was limited and consisted of randomly selected VFSS files. The distributions of various properties, such as gender, age, severity of dysphagia, image quality, bolus consistency, and amount of contrast medium, should have been taken into account. A larger, balanced dataset will be required to make the model more robust for general clinical application. In addition, the labeling of the dataset was reviewed and confirmed by only two physiatrists, which may not be sufficient. The reliability of the model should be examined with a larger number of human observers, preferably through a prospective controlled study. Finally, the sole target of model development was the detection of airway invasion, neglecting the many other variables that might also be valuable for the evaluation of dysphagia. Further studies are expected to reveal the utility of deep learning models for investigating other variables, including the time elapsed for food passage and the motions of various anatomical structures.

5. Conclusions

This study was the first attempt to identify airway invasion from VFSS images in a fully automated manner using image classification technology based on deep learning. The results show that a deep learning model can be used to detect laryngeal penetration or aspiration with significant accuracy. Further research will be required to improve the accuracy and generalizability of the results.

Author Contributions

Conceptualization, S.J.L. and S.-I.C.; methodology, S.J.L., J.Y.K., H.I.K., and S.-I.C.; software, H.I.K. and S.-I.C.; validation, S.J.L. and S.-I.C.; formal analysis, S.J.L., J.Y.K., H.I.K., and S.-I.C.; investigation, J.Y.K. and H.I.K.; resources, S.J.L. and J.Y.K.; data curation, J.Y.K. and H.I.K.; writing, original draft preparation, J.Y.K. and H.I.K.; writing, review and editing, S.J.L. and S.-I.C.; visualization, J.Y.K. and H.I.K.; supervision, S.J.L. and S.-I.C.; project administration, S.J.L.; funding acquisition, S.J.L. and S.-I.C. All authors read and agreed to the published version of the manuscript.

Funding

This work was supported in part by the National Research Foundation of Korea through the Korean Government (MSIT) under Grant 2018R1A2B6001400 and in part by the Basic Science Research Program through the National Research Foundation of Korea (NRF) funded by the Ministry of Education (Grant Number 2018R1D1A3B07049300).

Conflicts of Interest

The authors declare no conflict of interest.

References

  1. Logemann, J.A. Evaluation and treatment of swallowing disorders. Am. J. Speech-Lang. Pathol. 1994, 3, 41–44. [Google Scholar] [CrossRef]
  2. Sura, L.; Madhavan, A.; Carnaby, G.; Crary, M. Dysphagia in the elderly: Management and nutritional considerations. Clin. Interv. Aging 2012, 7, 287–298. [Google Scholar] [CrossRef] [PubMed] [Green Version]
  3. Martin-Harris, B.; Jones, B. The videofluorographic swallowing study. Phys. Med. Rehabil. Clin. N. Am. 2008, 19, 769–785. [Google Scholar] [CrossRef] [PubMed] [Green Version]
  4. Scott, A.; Perry, A.; Bench, J. A study of inter-rater reliability when using videofluoroscopy as an assessment of swallowing. Dysphagia 1998, 13, 223–227. [Google Scholar] [CrossRef] [PubMed]
  5. Kuhlemeier, K.; Yates, P.; Palmer, J. Intra- and inter-rater variation in the evaluation of videofluorographic swallowing studies. Dysphagia 1998, 13, 142–147. [Google Scholar] [CrossRef] [PubMed]
  6. McCullough, G.H.; Wertz, R.T.; Rosenbek, J.C.; Mills, R.H.; Webb, W.G.; Ross, K.B. Inter-and intrajudge reliability for videofluoroscopic swallowing evaluation measures. Dysphagia 2001, 16, 110–118. [Google Scholar] [CrossRef] [Green Version]
  7. Stoeckli, S.J.; Huisman, T.A.; Seifert, B.A.; Martin-Harris, B.J. Interrater reliability of videofluoroscopic swallow evaluation. Dysphagia 2003, 18, 53–57. [Google Scholar] [CrossRef]
  8. Kim, D.; Choi, K.; Kim, H.; Koo, J.; Kim, B.; Kim, T.; Ryu, J.; Im, S.; Choi, I.; Pyun, S.B.; et al. Inter-rater reliability of videofluoroscopic dysphagia scale. Ann. Rehabil. Med. 2012, 36, 791–796. [Google Scholar] [CrossRef]
  9. Baijens, L.; Barikroo, A.; Pilz, W. Intrarater and inter-rater reliability for measurements in videofluoroscopy of swallowing. Eur. J. Radiol. 2013, 82, 1683–1695. [Google Scholar] [CrossRef]
  10. Aung, M.; Goulermas, J.; Stanschus, S.; Hamdy, S.; Power, M. Automated anatomical demarcation using an active shape model for videofluoroscopic analysis in swallowing. Med. Eng. Phys. 2010, 32, 1170–1179. [Google Scholar] [CrossRef]
  11. Chang, M.W.; Lin, E.; Hwang, J.N. Contour tracking using a knowledge-based snake algorithm to construct three-dimensional pharyngeal bolus movement. Dysphagia 1999, 14, 219–227. [Google Scholar] [CrossRef]
  12. Aung, M.S.; Goulermas, J.Y.; Hamdy, S.; Power, M. Spatiotemporal visualizations for the measurement of oropharyngeal transit time from videofluoroscopy. IEEE Trans. Biomed. Eng. 2009, 57, 432–441. [Google Scholar] [CrossRef] [PubMed]
  13. Hossain, I.; Roberts-South, A.; Jog, M.; El-Sakka, M.R. Semi-automatic assessment of hyoid bone motion in digital videofluoroscopic images. Comput. Methods Biomech. Biomed. Eng. Imaging Vis. 2014, 2, 25–37. [Google Scholar] [CrossRef]
  14. Lee, W.H.; Chun, C.; Seo, H.G.; Lee, S.H.; Oh, B.M. STAMPS: Development and verification of swallowing kinematic analysis software. Biomed. Eng. Online 2017, 16, 120. [Google Scholar] [CrossRef] [Green Version]
  15. Natarajan, R.; Stavness, I., Jr.; William, P. Semi-automatic tracking of hyolaryngeal coordinates in videofluoroscopic swallowing studies. Comput. Methods Biomech. Biomed. Eng. Imaging Vis. 2017, 5, 379–389. [Google Scholar] [CrossRef]
  16. Zhang, Z.; Coyle, J.L.; Sejdić, E. Automatic hyoid bone detection in fluoroscopic images using deep learning. Sci. Rep. 2018, 8, 1–9. [Google Scholar] [CrossRef] [PubMed] [Green Version]
  17. Lundervold, A.S.; Lundervold, A. An overview of deep learning in medical imaging focusing on MRI. Z. Med. Phys. 2019, 29, 102–127. [Google Scholar] [CrossRef]
  18. Le, M.H.; Chen, J.; Wang, L.; Wang, Z.; Liu, W.; Cheng, K.T.T.; Yang, X. Automated diagnosis of prostate cancer in multi-parametric MRI based on multimodal convolutional neural networks. Phys. Med. Biol. 2017, 62, 6497. [Google Scholar] [CrossRef]
  19. Dong, Y.; Pan, Y.; Zhang, J.; Xu, W. Learning to read chest X-ray images from 16000+ examples using CNN. In Proceedings of the 2017 IEEE/ACM International Conference on Connected Health: Applications, Systems and Engineering Technologies (CHASE), Philadelphia, PA, USA, 17–19 July 2017; pp. 51–57. [Google Scholar]
  20. Song, Q.; Zhao, L.; Luo, X.; Dou, X. Using deep learning for classification of lung nodules on computed tomography images. J. Healthc. Eng. 2017, 2017, 8314740. [Google Scholar] [CrossRef] [Green Version]
  21. Lee, J.T.; Park, E.; Jung, T.D. Automatic detection of the pharyngeal phase in raw videos for the videofluoroscopic swallowing study using efficient data collection and 3D convolutional networks. Sensors 2019, 19, 3873. [Google Scholar] [CrossRef] [Green Version]
  22. Zuiderveld, K. Contrast limited adaptive histogram equalization. In Graphics Gems IV; Academic Press Professional, Inc.: Cambridge, MA, USA, 1994; pp. 474–485. [Google Scholar]
  23. Ronneberger, O.; Fischer, P.; Brox, T. U-Net: Convolutional networks for biomedical image segmentation. In International Conference on Medical Image Computing and Computer-Assisted Intervention; Springer: Cham, Switzerland, 2015; pp. 234–241. [Google Scholar]
  24. He, K.; Zhang, X.; Ren, S.; Sun, J. Deep residual learning for image recognition. In Proceedings of the IEEE Conference on Computer Vision and Pattern Recognition, Las Vegas, NV, USA, 27–30 June 2016; pp. 770–778. [Google Scholar]
  25. Pan, S.J.; Yang, Q. A survey on transfer learning. IEEE Trans. Knowl. Data Eng. 2009, 22, 1345–1359. [Google Scholar] [CrossRef]
  26. Simonyan, K.; Zisserman, A. Very deep convolutional networks for large-scale image recognition. arXiv 2014, arXiv:1409.1556. [Google Scholar]
  27. Chollet, F. Xception: Deep learning with depthwise separable convolutions. In Proceedings of the IEEE Conference on Computer Vision and Pattern Recognition, Honolulu, HI, USA, 21–26 July 2017; pp. 1251–1258. [Google Scholar]
  28. Ioffe, S.; Szegedy, C. Batch normalization: Accelerating deep network training by reducing internal covariate shift. arXiv 2015, arXiv:1502.03167. [Google Scholar]
  29. Arce, G.R. Nonlinear Signal Processing: A Statistical Approach; John Wiley & Sons: Hoboken, NJ, USA, 2005. [Google Scholar]
  30. He, T.; Zhang, Z.; Zhang, H.; Zhang, Z.; Xie, J.; Li, M. Bag of tricks for image classification with convolutional neural networks. In Proceedings of the IEEE Conference on Computer Vision and Pattern Recognition, Long Beach, CA, USA, 16–20 June 2019; pp. 558–567. [Google Scholar]
  31. Lin, T.Y.; Goyal, P.; Girshick, R.; He, K.; Dollár, P. Focal loss for dense object detection. In Proceedings of the IEEE International Conference on Computer Vision, Venice, Italy, 22–29 October 2017; pp. 2980–2988. [Google Scholar]
  32. Chen, L.C.; Papandreou, G.; Schroff, F.; Adam, H. Hartwig Rethinking atrous convolution for semantic image segmentation. arXiv 2017, arXiv:1706.05587. [Google Scholar]
  33. Zoph, B.; Ghiasi, G.; Lin, T.Y.; Cui, Y.; Liu, H.; Cubuk, E.D.; Le, Q.V. Rethinking pre-training and self-training. arXiv 2020, arXiv:2006.06882. [Google Scholar]
  34. Szegedy, C.; Vanhoucke, V.; Ioffe, S.; Shlens, J.; Wojna, Z. Rethinking the inception architecture for computer vision. In Proceedings of the IEEE Conference on Computer Vision and Pattern Recognition, Las Vegas, NV, USA, 27–30 June 2016; pp. 2818–2826. [Google Scholar]
  35. Rosenbek, J.; Robbins, J.; Roecker, E.; Coyle, J.; Wood, J. A penetration-aspiration scale. Dysphagia 1996, 11, 93–98. [Google Scholar] [CrossRef]
Figure 1. Overall process of the proposed airway invasion detection method.
Applsci 10 06179 g001
Figure 2. Images illustrating the localization of the cervical spinal column and the specification of the ROI for airway invasion detection: (A) ground-truth cervical spinal column, (B) pixels classified as belonging to the cervical spinal column by U-Net, and (C) ROI image with dimensions of 299 × 299 .
Applsci 10 06179 g002
Figure 3. U-Net architecture designed for the localization of the cervical spinal column.
Applsci 10 06179 g003
Figure 4. Xception module used for airway invasion detection.
Applsci 10 06179 g004
Figure 5. Visualization of the invasion of a bolus into the larynx in VFSS image frames: (A) image acquired during airway invasion (positive)and (B) image acquired during normal swallowing (negative).
Applsci 10 06179 g005
Figure 6. Classification results for airway invasion using the Xception module-based CNN: (A) results for a person with normal swallowing, (B) results for a patient, (C) results for a person with normal swallowing after correction using a median filter, and (D) results for a patient after correction using a median filter.
Applsci 10 06179 g006
Figure 7. Convolution filtering of r and f for the decision on airway invasion occurrence in a video.
Applsci 10 06179 g007
Figure 8. ROC curve for the detection of the cervical spinal column.
Applsci 10 06179 g008
Figure 9. Results of cervical spinal column localization: (A) cervical spinal column (red area) detected by U-Net, and (B) ROI image.
Applsci 10 06179 g009
Figure 10. ROC curve for detecting airway invasion in an image frame.
Applsci 10 06179 g010
Table 1. Statistics of videofluoroscopic swallowing study (VFSS) frame data.
TrainingValidationTestTotal
No-Invasion Images137,09541,32273,996252,413
Invasion Images10,5242010280115,335
Total147,61943,32276,797267,748
Table 2. Accuracy of detection of the cervical spinal column by the U-Net deep learning segmentation model.
Deep Learning AlgorithmAccuracyRecallPrecisionSpecificityNPVAverage Precision
U-Net99.0%75.6%88.7%99.7%99.3%94.8%
Table 3. Performance per frame for classifying airway invasion.
AccuracyRecallPrecisionSpecificityNPVF1-Score
97.2%74.2%59.1%98.0%99.0%0.658
Table 4. Performance for classifying complete videos containing image frames with airway invasion.
AccuracyRecallPrecisionSpecificityNPV
93.2%
(167/179)
91.2%
(52/57)
88.1%
(52/59)
94.2%
(115/122)
95.8%
(115/120)

