Article

Characterization and Prediction of Air Transport Delays in China

1
Institute for Cross-Disciplinary Physics and Complex Systems, Campus Universitat de les Illes Balears, E-07122 Palma de Mallorca, Spain
2
National Key Laboratory of Communication, Navigation and Surveillance/Air Traffic Management, Beihang University, Beijing 100191, China
3
Aviation Data Communication Corporation, No. 238 Baiyan Building, Beijing 100191, China
4
National Engineering Laboratory for Multi-Modal Transportation Big Data, Beijing 100191, China
5
Department of Computer Science, Humboldt-University Berlin, 10117 Berlin, Germany
*
Author to whom correspondence should be addressed.
Appl. Sci. 2020, 10(18), 6165; https://doi.org/10.3390/app10186165
Submission received: 3 August 2020 / Revised: 24 August 2020 / Accepted: 27 August 2020 / Published: 4 September 2020
(This article belongs to the Section Aerospace Science and Engineering)

Abstract

:
Air transport delays are a major source of direct and opportunity costs in modern societies, being this problem is especially important in the case of China. In spite of this, our knowledge on delay generation is mostly based on intuition, and the scientific community has hitherto devoted little attention to this topic. We here present the first data-driven systemic study of air transport delays in China, of their evolution and causes, based on 11 million flights between 2016 and 2018. A significant fraction of the delays can be explained by a few variables, e.g., weather conditions and traffic levels, the most important factors being the presence of thunderstorms and the season of the year. Remaining delays can often be explained by en-route weather phenomena or by reactionary delays. This study contributes towards a better understanding of delays and their prediction through a data-driven methodology, leveraging on statistics and data mining concepts.

1. Introduction

The air transport system of a country is a fundamental infrastructure for ensuring citizens’ long-distance mobility and an important part of the country’s economic growth. This is true particularly for an extensive country such as China, where it is infeasible to connect all parts of the country efficiently by ground transportation only. The rapid expansion of the air Chinese transportation system poses an inherent challenge: daily operations suffer from a limited availability of airspace resources, due to a combination of multiple factors [1], whose interactions have not been analyzed in the literature so far. This has a major impact on the passengers’ experience and social welfare [2], as it has been estimated that a 31.6 % of the flights were delayed in 2015 [3]. Except from the direct impact on passengers, there are also impacts on airlines, in terms of fines and operational costs [4,5], as well as the environment, in terms of increased fuel consumption or emissions of an inefficient system [5]. Accordingly, improving the understanding and prediction of delay is in the best interest of many stakeholders in air transportation, including air navigation service providers and network managers, as well as passengers. In light of the previous considerations, it is not surprising that a substantial number of research works have been focused on delay analysis. These can roughly be categorized in two groups: analysis of individual delays, and analysis of the resulting network effects. Within the former one, most works have focused on Europe (see, for instance, [6,7,8]) and US [9,10,11,12,13], mainly due to the larger data availability. On the other hand, the propagation of delays [14] is usually represented through networks of airports (see [15] for a review), in which links describe the circumstances/likelihood of propagation between pairs of airports [16,17,18,19]. Note that the picture is further made more complex by the presence of multiple definitions for delays, e.g., departure delay, en-route delay or arrival delays; additionally, delays can be estimated for aircraft or individual passengers [17]. Most studies, including the present one, focus on landing delays for flights, calculated as the difference between the actual and scheduled arrival time of a flight, as these are the most relevant from the passenger’s perspective.
When comparing the causes for air transportation delays throughout the world, China stands out as a special case, as here delays are mainly caused by a limited aerospace for civil aviation (as opposed to, for instance, airport capacity) [20]. While a few research works focusing on the study of delays can be found, e.g., [1,21,22,23], a framework for describing the evolution and causes of delays is hitherto missing in the literature, possibly due to a lack of public operational data sets. In addition, detailed aggregated information about the cause of delays, and in some cases about individual flights, are easily obtainable in Europe and US—respectively through the Eurocontrol’s Network Operations Portal and the US Bureau of Transportation Statistics’ RITA. Yet, this does not hold in China, for which only annual statistics are published by the Civil Aviation Administration of China (CAAC).
The objective of our research is to bridge this gap, and present a comprehensive study of the evolution of air transport delays in China between 1 May 2016 to 31 October 2018. Based on the operational data, we are interested in identifying the major factors driving delays in the Chinese domestic air transportation system. Our analysis is organized around two main topics. We firstly describe the temporal evolution of delay statistical metrics, in order to understand if and how much the system predictability has increased in the last year. Secondly, we further assess the presence of relationships between weather conditions and delays, by means of several statistical and data mining tests, to understand whether the former ones have a significant impact on the dynamics of the system. Through our data-driven experiments, we find that a considerable fraction of the delays can be predicted rather well, provided some input variables, such as weather conditions and traffic levels. Notably, the largest factors appearing with the occurrence of delays are the presence of thunderstorms and season of the year. This study contributes towards understanding the generation of delays and prediction of delays in air transportation systems and, eventually, should lead to novel strategies for improving passengers’ experience.
The remaining part of this study is structured as follows. Section 2 summarizes the state-of-the-art delay analysis in air transportation networks. Section 3 describes the flight data and methods used in our study for delay characterization and prediction. Section 4 presents statistical analysis on the flight data used in this study, with a focus on temporal evolution and identification of seasonality. Section 5 identifies the relevance of weather phenomena for the occurrence and predictability of delays in the Chinese air transportation system. Section 6 concludes our study and presents some directions for future work.

2. Literature Review

Many analytical models have been proposed to study flight delays. Reference [24] developed a delay tree to quantify the propagation of delays; this is based on the concept of delay multiplier, i.e., the ratio between the initial delay over the sum of all potential downstream delays. Reference [25] developed two models that measure the level of flight delays [18] to examine the delay propagation in different spatial and temporal terms. Reference [26] analyzed the data of departure and arrival for ten major airports in order to improve the accuracy of delay prediction. The distribution associated to delay time probability was modeled though different functions, among which the Poisson one showed a better performance than the normal distribution in modeling the departure delay. Reference [27] proposed a model for predicting the distributions of departure delays by studying the related factors. Inspired by the ideas of genetic algorithm, an improved expectation-maximization algorithm was developed. The experiments showed the good performance of the model on predictive capabilities and the robustness to the parameter selection. By considering both temporal (e.g., the hour of the day) and spatial (e.g., the status of the system at that time) variables, Reference [13] proposed a new group of models to predict flight delays. In addition to delay states of main airports and links (i.e., local variables), the global delay state was also characterized by new variables. Reference [28] proposed an approach to predict the flight delays using deep learning. Moreover, simulation-based models have also been proposed to study the delays [29]. Based on the simulation of service queue at airport and the itineraries of aircraft, Reference [30] enhanced the Approximate Network Delays (AND) model to study the local delay that occurs at airports (by a queuing engine) and the delay propagation through the airport network (by a delay propagation algorithm). Reference [31] proposed two multi-factor models to predict flight delays in fifteen-minute epochs for 34 airports in the US. In order to predict generated delays and absorbed delays, the piece-wise linear regressions and multi-adaptive regression splines were used. Finally, many studies estimate the impact of delays on social welfare and the environment. Reference [2] highlight that flight cancellations and missed connections can lead to substantial passenger delays, which are usually not captured in traditional flight delay statistics.

3. Data and Methods

This section gives an overview on the data and methods used in our study. Specifically, Section 3.1 describes the data set obtained by Aviation Data Communication Corporation of China. Section 3.2 describes the weather data obtained at a 30 min resolution, including features such as temperature, rain, visibility and thunderstorms, for the most important airports in this study. Section 3.3 introduces the data set for air quality in Chinese cities. Section 3.4 describes how these data sets are used for generation and evaluation of prediction models, using data mining techniques, including random forests and multi-layer perceptron.

3.1. Delay Data Set Description

The delay data set used in this study has been kindly provided by the Aviation Data Communication Corporation (http://www.adcc.com.cn), including information for all flights crossing the Chinese airspace in the 30-months period from 1 May 2016 to 31 October 2018. For each flight the information provided includes, among others:
  • ICAO (International Civil Aviation Organization) code of scheduled departure/arrival airport;
  • ICAO code of actual departure/arrival airport;
  • Unixtime (time in seconds since 1 January 1970) for scheduled departure/arrival time;
  • Unixtime (time in seconds since 1 January 1970) for actual departure/arrival time.
In this study, we focus on the arrival delay for domestic flights, calculated as the difference between the actual and scheduled arrival time; a positive number indicates that the flight arrived later than scheduled. A few instances in which the scheduled and actual arrival airports do not coincide have been discarded. Possible explanations for such flights are flight diversion or data inconsistencies. Moreover, we removed all flights with at least one airport not being located in China. After this data cleansing step, a total of 11 million domestic flights have been analyzed. These flights cover the air transportation activity between 277 Chinese airports, as shown in Figure 1. The majority of airports are located in the Eastern part of China, given the higher population density. Figure 2 further summarizes the top-ranked airport pairs, in terms of number of flights and delay statistics. Note that the routes with the highest cumulative delays (bottom left panel) form a connected structure around the top airports; on the other hand, routes with the largest delays per flight (bottom right panel) are disconnected and mainly involve secondary airports.

3.2. Weather Data Set Description

Data about the historical meteorological conditions at the top-8 airports have been obtained from the website www.wunderground.com. This website provides structured weather information that is decoded from official METAR (Meteorological Aerodrome Report) messages and suitably pre-processed. As for the original source, the temporal resolution of this data set is 30 min, yielding for each day in the period of our study a collection of 24*2 datapoints representing the temporal evolution of weather at a specific location of interest. Particularly, five variables have been considered in this study:
  • Temperature: air temperature in degrees Celsius.
  • Wind speed: speed of the main steady wind (i.e., not considering gusts) in knots.
  • Rain: fraction of times the word “rain” appears in the “WX” part (present weather phenomena) of the METAR message. A value of 0.5 thus indicates that rain was reported in 24 of the 48 messages available for one given day, i.e., for a total of 12 h.
  • Visibility: horizontal visibility measured in statute miles. Values higher than 10 have been rounded to 10.
  • Thunderstorms: similarly to the rain metric, fraction of times the word “thunderstorm” appears in the “WX” part (present weather phenomena) of the METAR message.

3.3. Air Quality Data Set Description

In addition to the weather information encoded in the METAR messages, we here further consider information about air quality, obtained from U.S. Department of State Air Quality Monitoring Program (http://www.stateair.net/web/historical/). Data are available with a one-hour resolution for the following four cities: Beijing (ZBAA), Shanghai (ZSPD), Guangzhou (ZGGG) and Chengdu (ZUUU). We have extracted the data from the CSV files and associated a value to each flight, corresponding to the air quality value temporally closest to the scheduled departure time.

3.4. Prediction Models

Beyond standard statistics analyses, the relevance of the aforementioned features is tested through data mining models—see Section 5.2. Three standard algorithms have been considered:
  • Random Forests (RF). Combinations of Decision Trees predictors, in which each tree is trained over a random subset of features and records; the final classification forecast is then calculated through a majority rule. Random Forests are especially appreciated for their precision and low tendency of overfitting [32].
  • Stochastic Gradient Descent (SGD): meta-algorithm in which multiple linear Huber loss functions are combined and optimized [33].
  • Multi-Layer Perceptron (MLP): based on the structural aspects of biological neural networks, MLPs are composed of a set of connected nodes organized in layers. Each connection has a weight associated to it, which is tuned through the learning phase [34]. When more than two layers are included in the model, it can be proven that MLPs can classify data that are not linearly separable, and in general approximate any non-linear function.
All three models have been implemented through the corresponding function of the Scikit-learn Python package [35]. Parameters used were: 2000 estimators for RF; a modified Huber loss and a maximum of 2000 iterations for SGD; and 3 layers with 40 neurons in the hidden one for MLP. Additionally, all presented results have been obtained through a Leave-One-Out Cross-Validation, in order to reduce the risk of overfitting [36]. This strategy involves selecting one single instance as test data, train the model using all remaining data, and evaluate the prediction on the initial instance; this process is finally repeated over all records, to obtain a final averaged score.

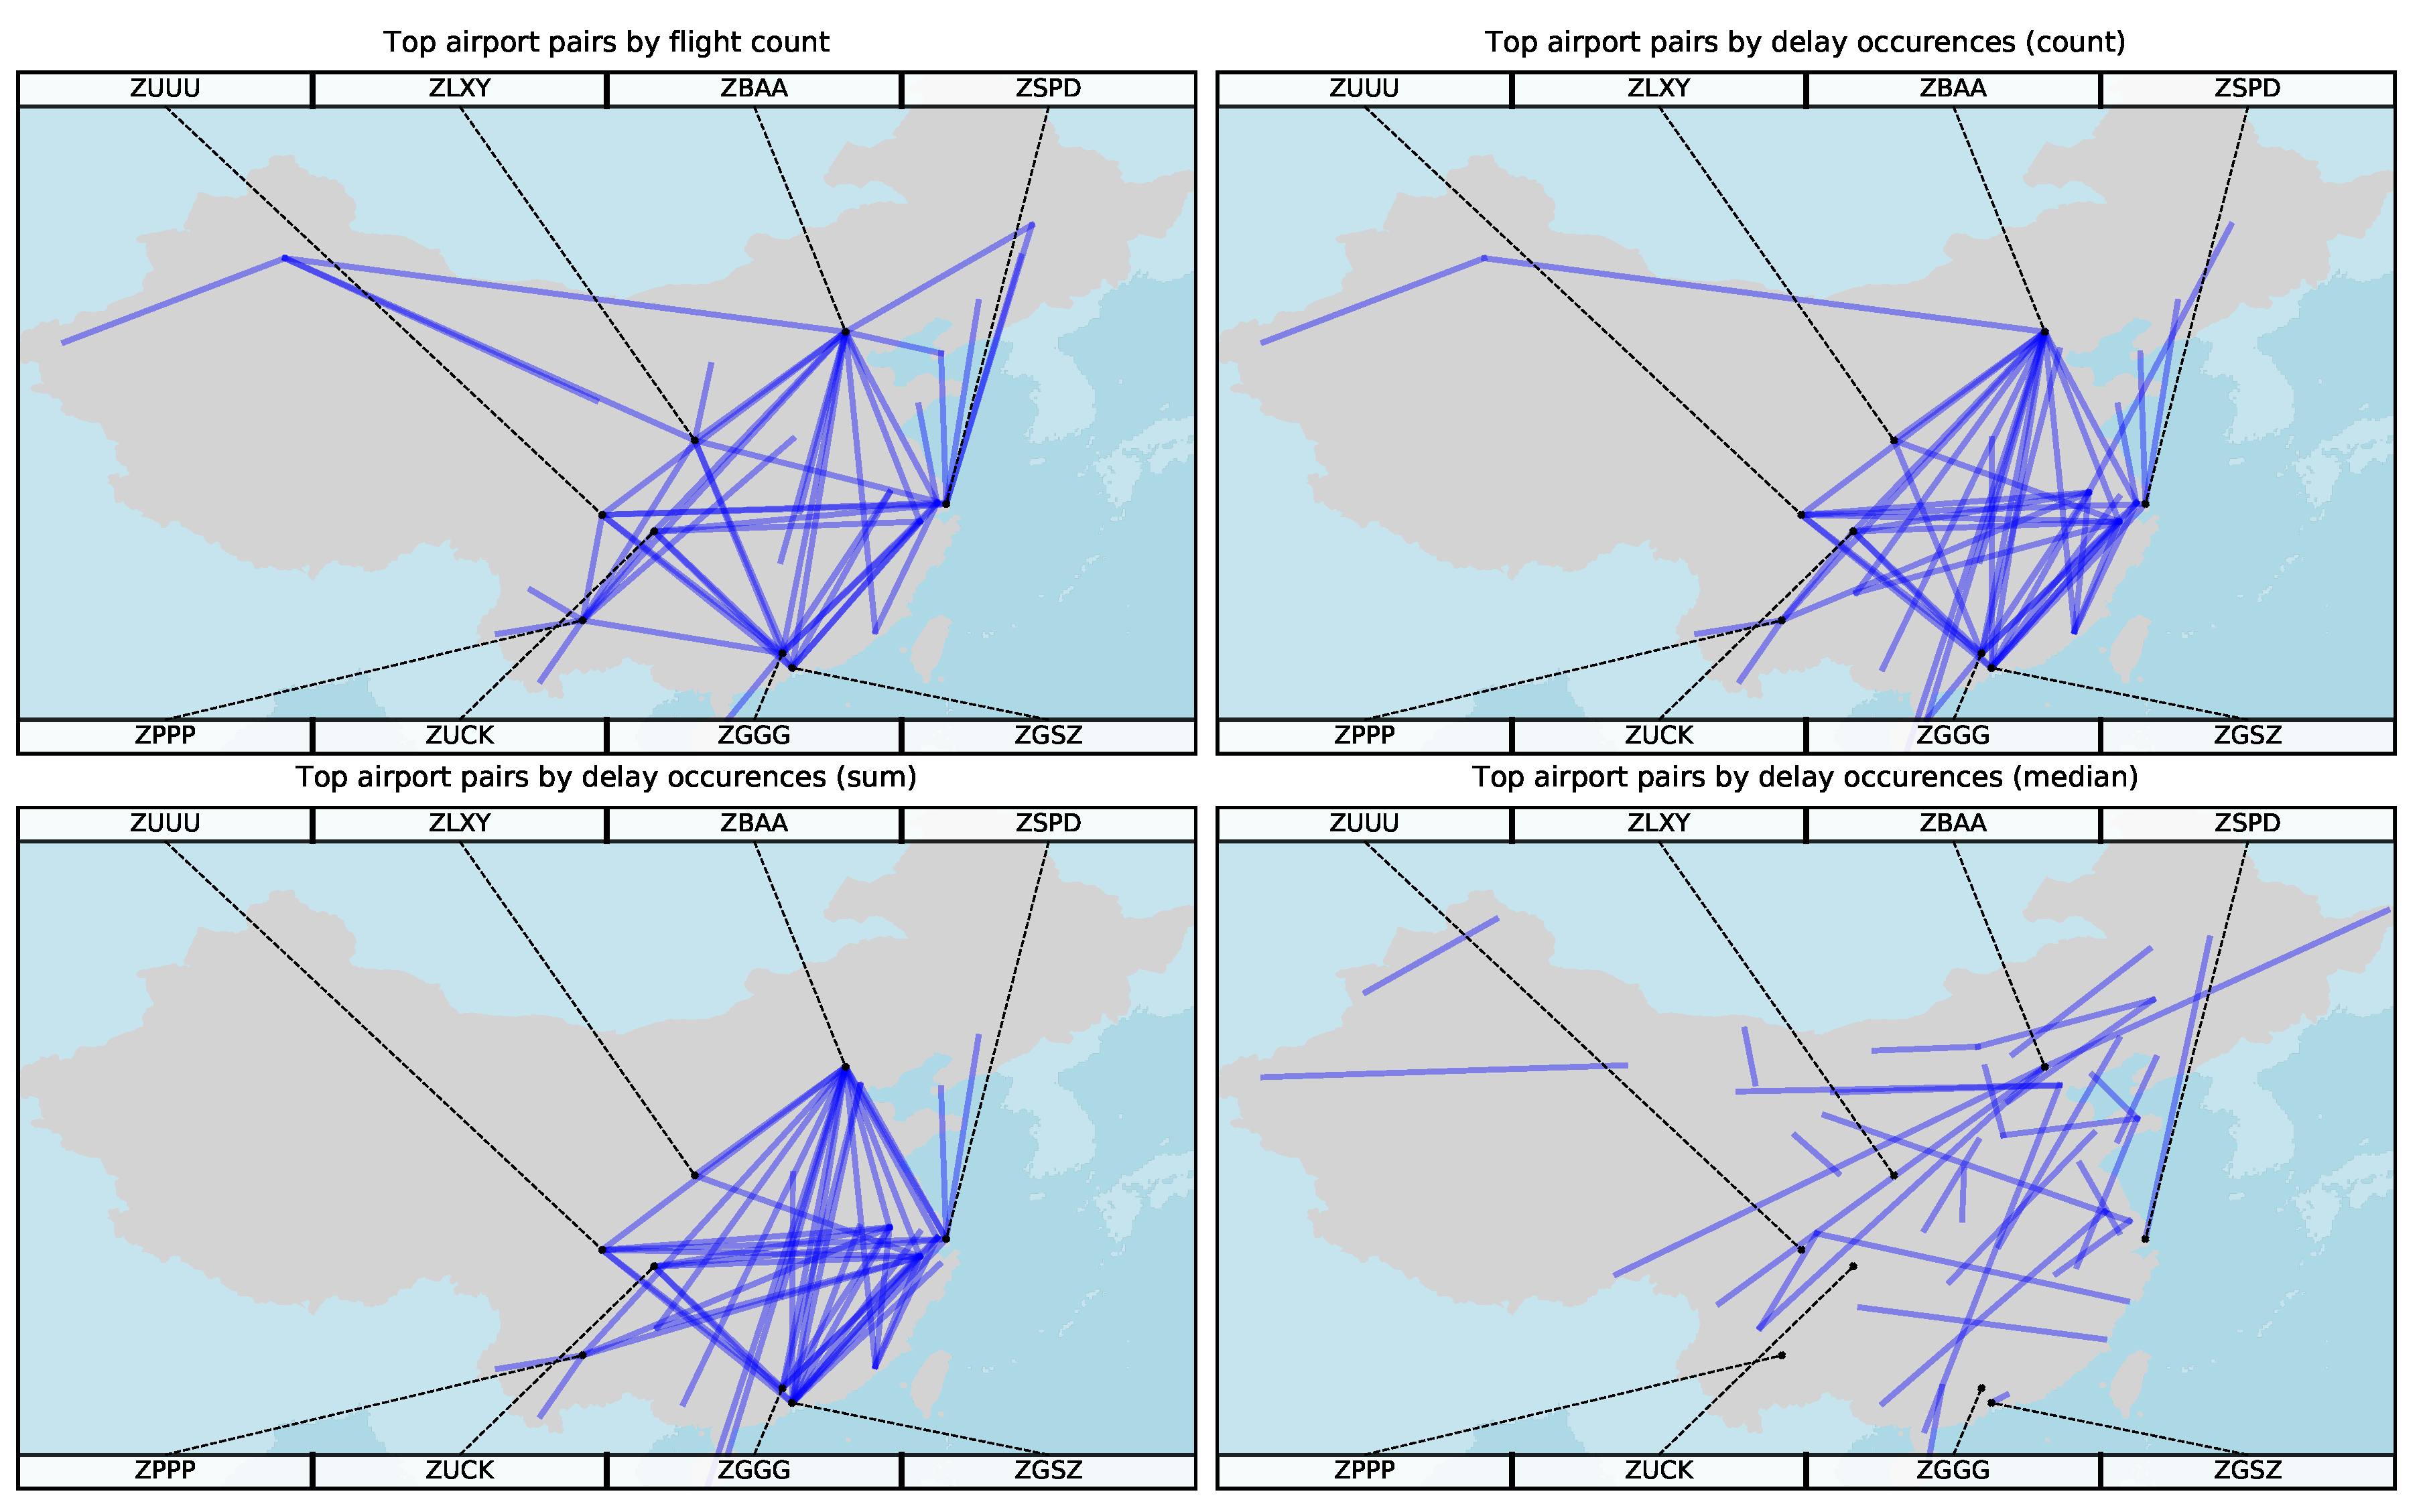
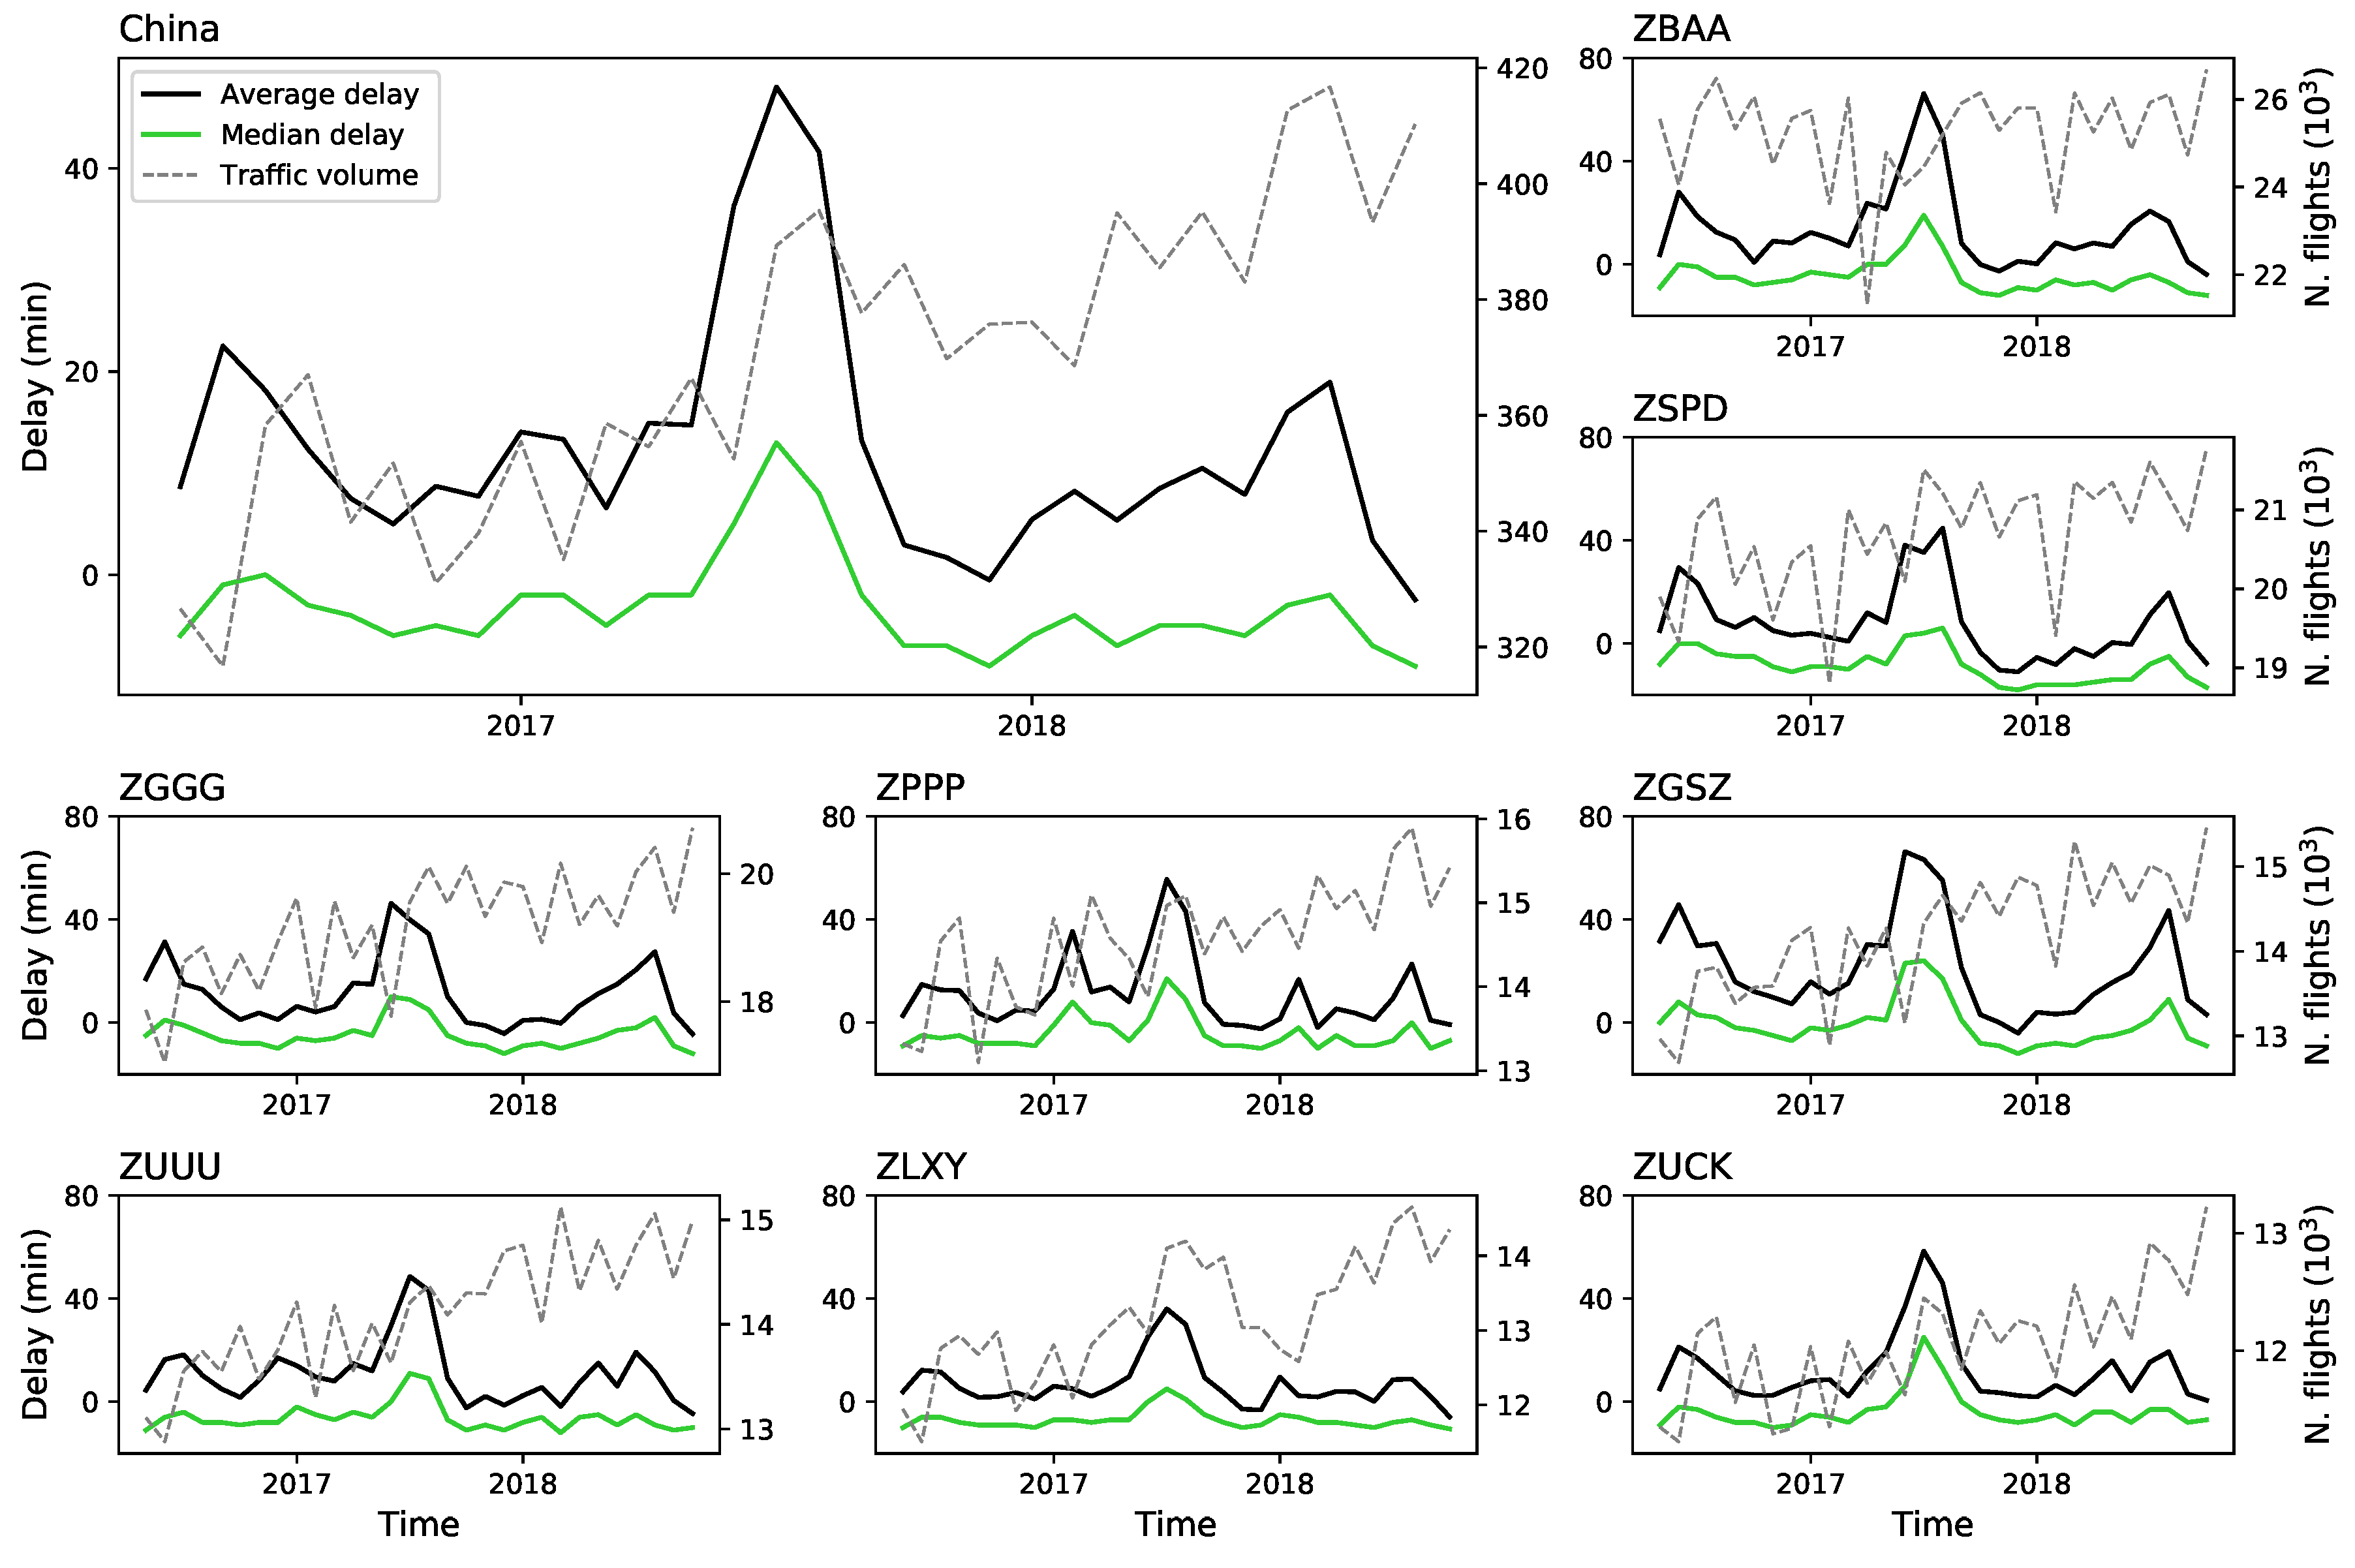
4. Statistical Analysis of Flight Delays in China

As a first step, we perform standard descriptive analyses on the evolution of the average delay. Specifically, Figure 3 depicts the evolution of the average monthly delay, both aggregated over the whole system (top left panel), and individually for the eight most important airports (sorted according to the total number of flights in the data set). Two important facts can be observed.
First of all, three peaks are present in the delay evolution, around July 2016–2018. While it may prima facie appear that they are due to the increased traffic usually observed during the summer, a weak correlation is actually present between both time series— R 2 = 2.82 × 10 4 for the aggregated time series, with a maximum of R 2 = 0.146 in the case of ZSPD (Shanghai Pudong International Airport). Considering the changes in traffic levels and delays between consecutive months (i.e., d ^ ( t ) = log 2 d ( t ) / d ( t 1 ) , with d ( t ) being the average delay at month t) yields a slightly higher correlation for the whole system ( R 2 = 7.99 × 10 3 ), but still not high enough to justify traffic as a major driver for delays.
Secondly, one may focus on the inter-year evolution, to check whether the average delay has reduced over time—see Table 1 for a synthesis. The peaks in the summer 2016 are always smaller than those of 2017; in turn, delays were again reduced during the summer of 2018, thus suggesting that the summer of 2017 was characterized by exceptional situations. On the other hand, a slight decrease in the mean level can be observed for the winter months, when compared with the previous year. Nevertheless, such decreases are seldom statistically significant. As can be seen in Table 2, which reports the p-values of a series of t-tests on the average delay for each pair of seasons, only ZSPD (Shanghai Pudong International Airport) presents a statistically significant decrease in the average delay between the two consecutive winters (significance level of α = 0.01 , effective α * = 3.72 × 10 4 with a Šidák correction for multiple testing).

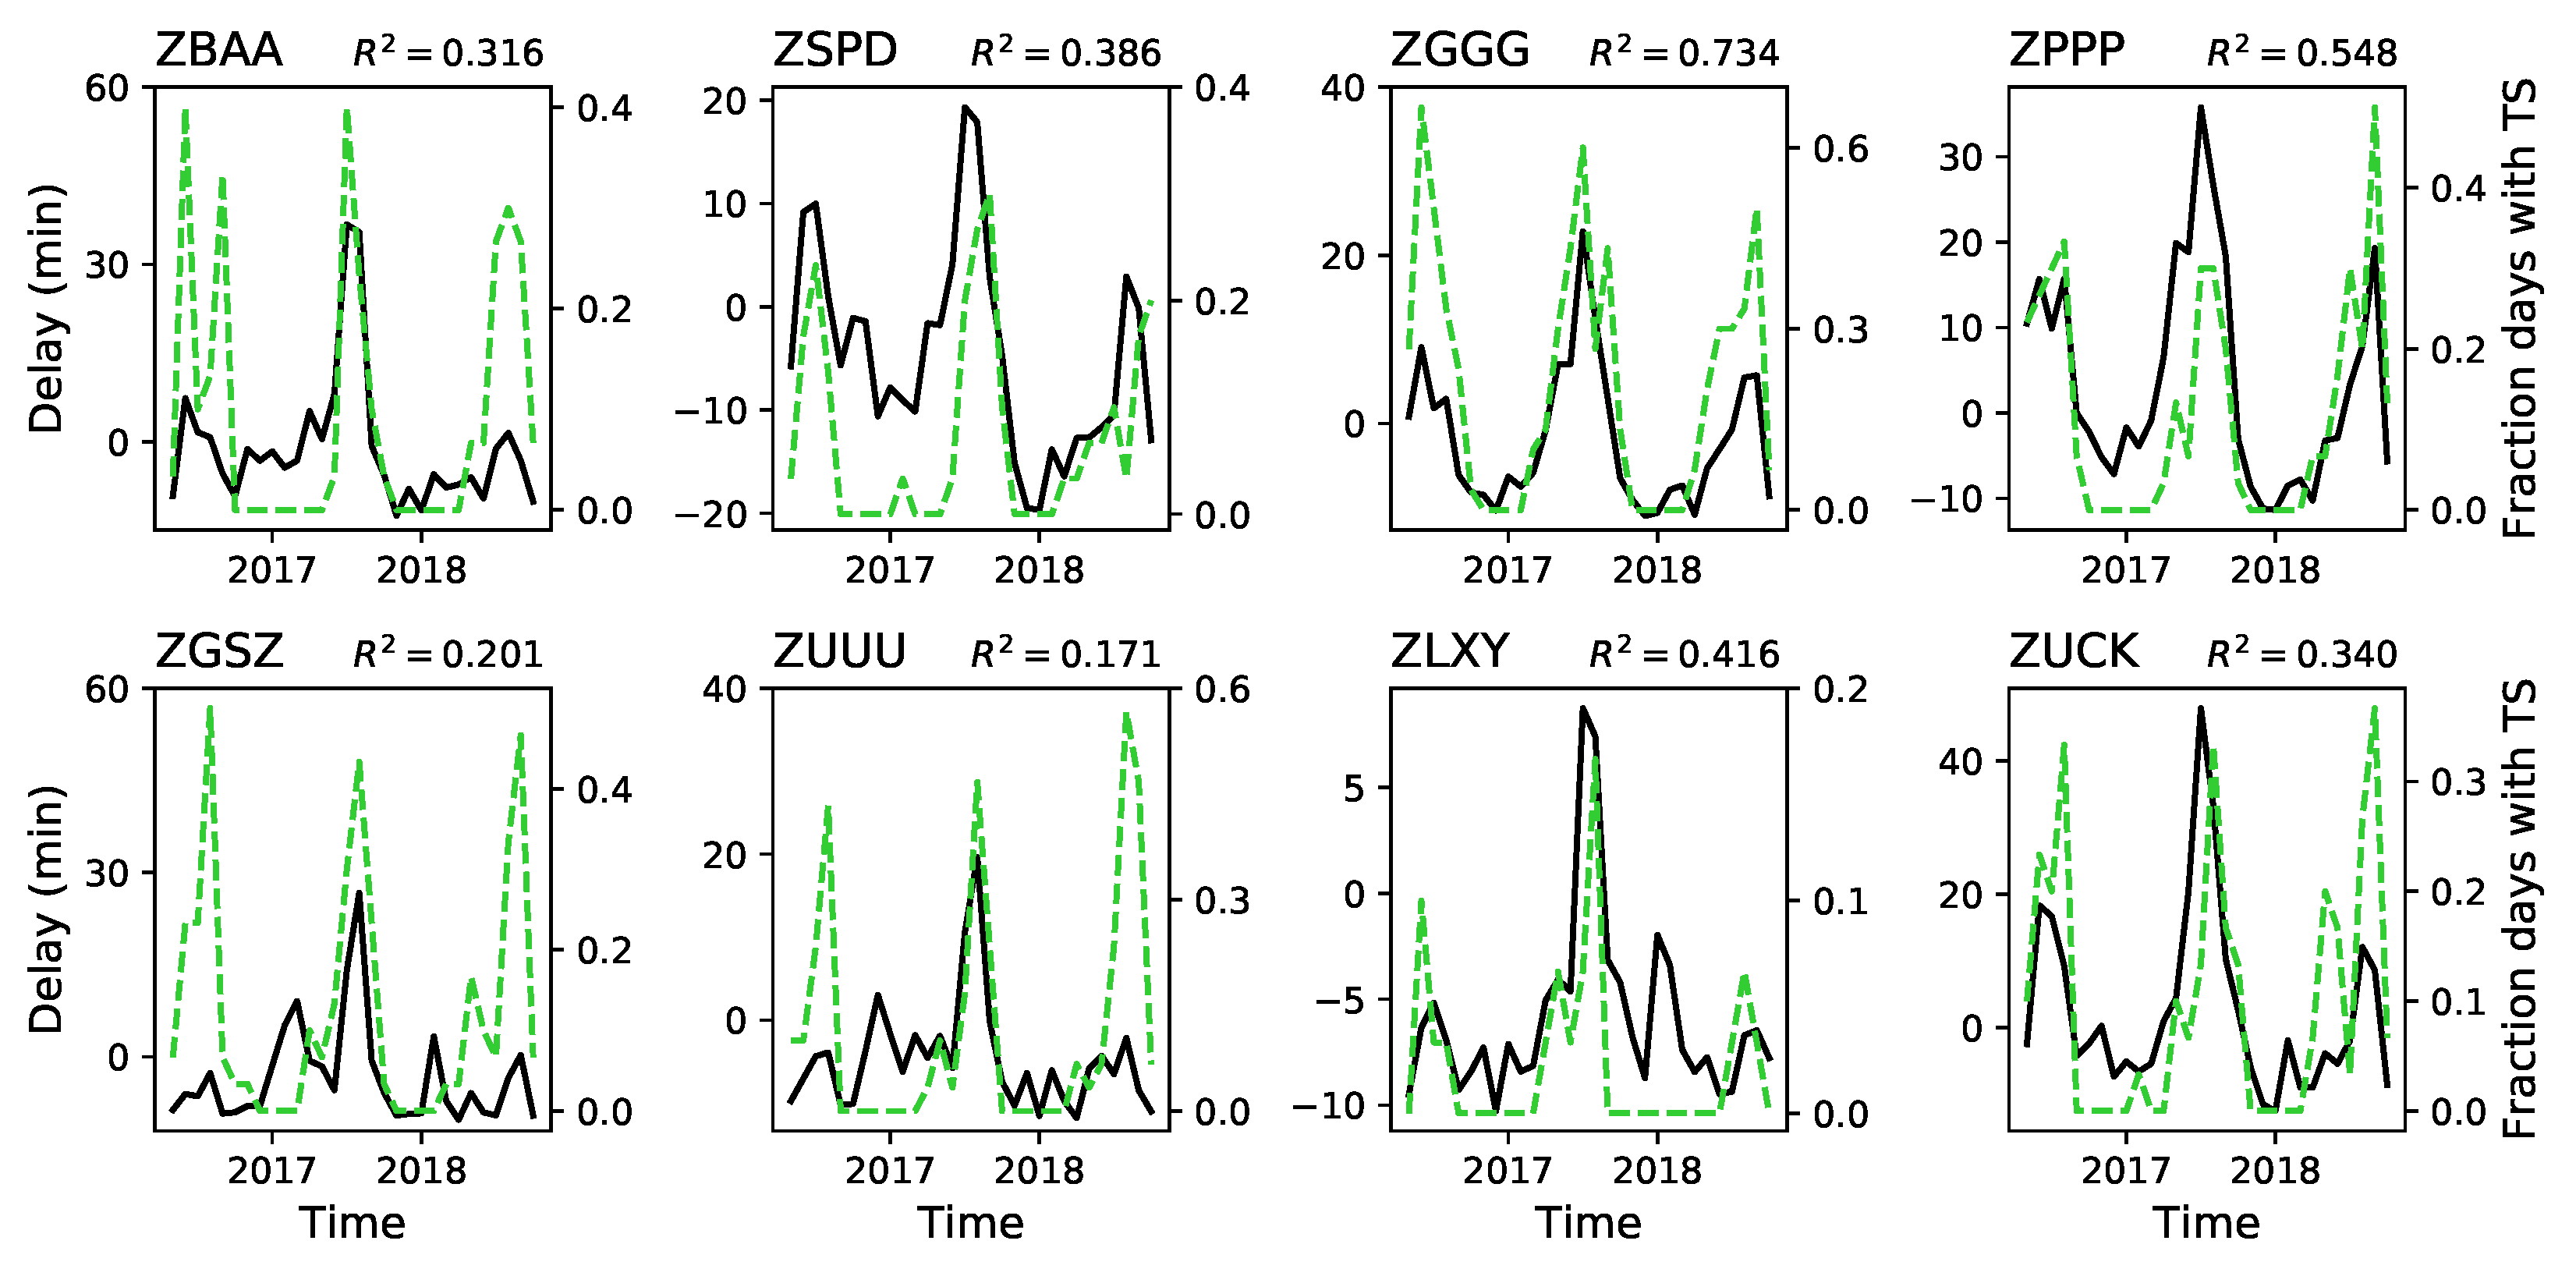
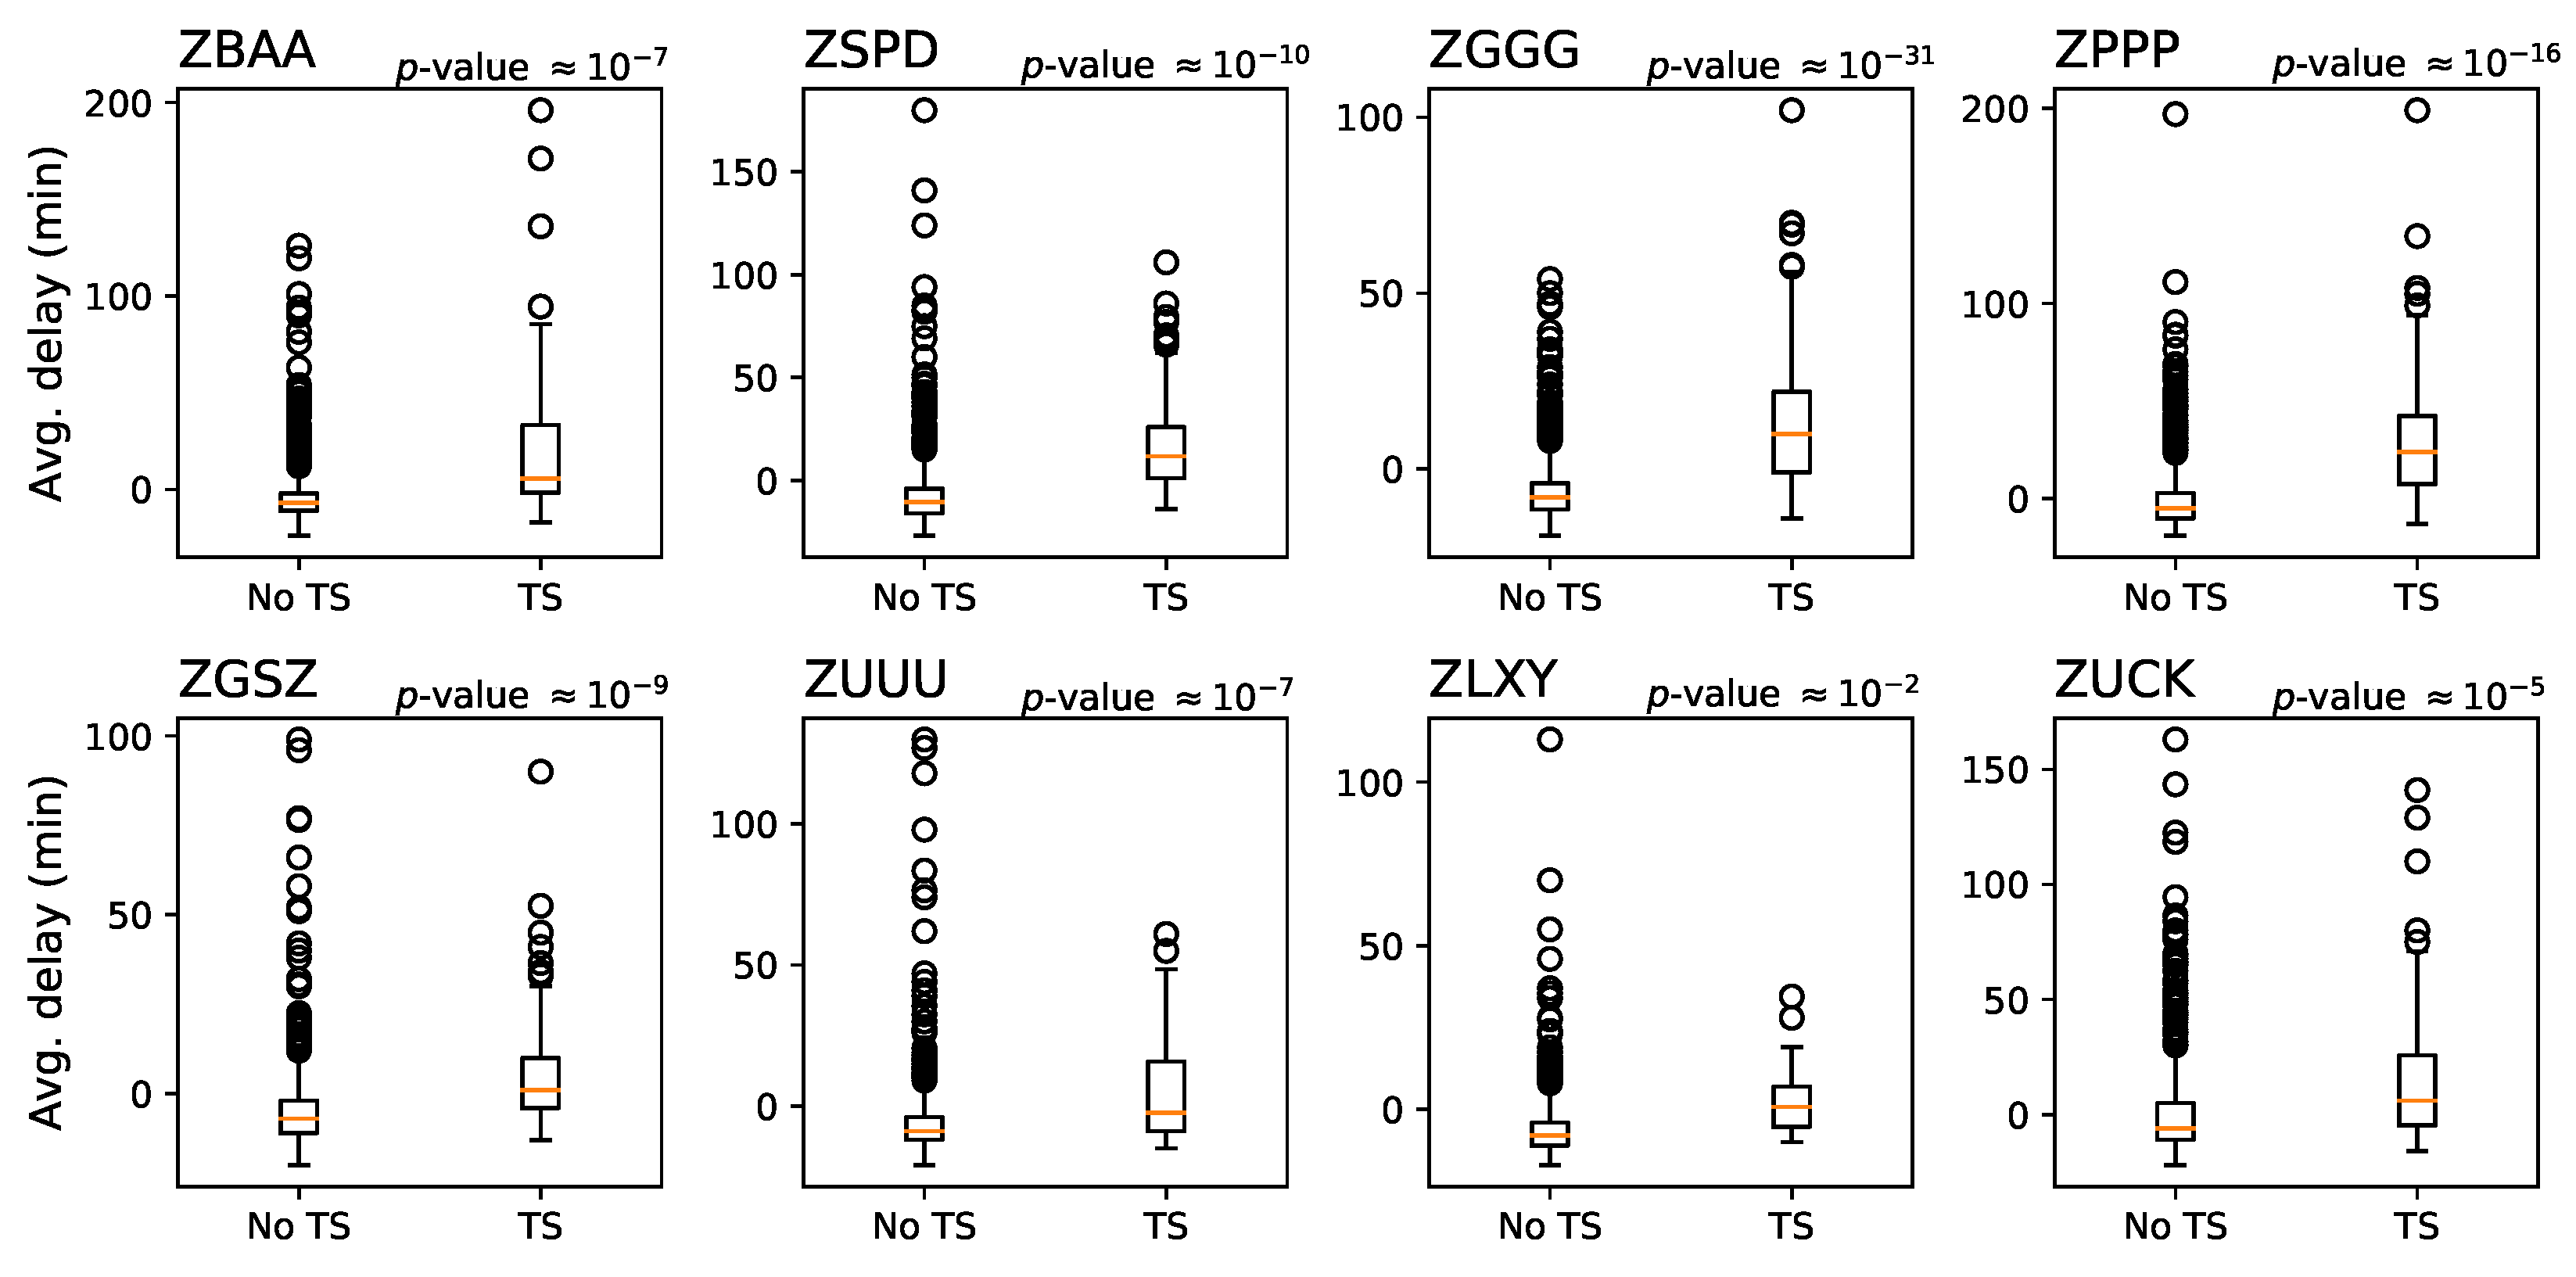
5. Effect of Weather on Delay Dynamics

Results in the previous section indicate that the average delay has not strongly been correlated with the traffic level; additionally, it presents a complex evolution, with a weak overall decrease, but with stronger peaks during the summer season. In order to understand if these peaks can be explained through the presence of exogenous factors, we here focus on identifying potential relationships between weather conditions and the appearance of abnormal delays.
Two complementary approaches are considered. Firstly, in Section 5.1, a standard statistical analysis is presented; afterwards, in Section 5.2, a machine learning model is constructed, aimed at forecasting the average level of delay observed for each day.
In order to simplify the test, and reduce the level of noise in the data, all variables (thus including the average delay and all weather metrics) have been binarized. Mathematically, this corresponds to the transformation:
v * = 0 , if v < M ( v ) 1 , otherwise
where v is the variable to be transformed, and M ( · ) is the median operator. To illustrate, let us suppose that the delay at day i is d i ; this value is transformed to 1 if d i is among the half largest observed delays, and 0 otherwise. A similar transformation is applied to all other weather metrics.

5.1. Statistical Analysis

The presence of relationships between the binarized daily delay level and the weather metrics described in Section 3.2 is here assessed by firstly constructing a contingency table, for each pair of delay-metrics; then applying a χ 2 test. The resulting p-values are reported in Table 3. If one considers a significance level of α = 0.01 ( α * = 2.28 × 10 4 with a Šidák correction for multiple testing), the second column of Table 3 indicates that the temperature and the presence of thunderstorms are almost always relevant factors. Additionally, the fourth and fifth columns of Table 3 suggest that airports can be divided in two groups: the largest five, whose delays have a high dependence on the presence of rain; and ZUUU, ZLXY and ZUCK, which are highly sensitive to visibility. Finally, ZBAA and ZSPD show a weak dependence on the AQI. Nevertheless, it has to be noted that this latter metric is correlated with the temperature ( σ = 0.167 ), the wind speed ( σ = 0.223 ) and rain ( σ = 0.054 ); its explanatory value may thus be limited.
The strong dependence of delays with the temperature, and also partly with the presence of rain, suggests that they may be proxies of the presence of some extreme adverse weather events. In order to confirm this, Figure 4 depicts the evolution of the average monthly delay at each airport (black solid line), along with the fraction of days in which thunderstorms were reported at or near the corresponding airport (green dashed lines). It can be observed that both metrics are strongly correlated, with coefficients of determination R 2 ranging from 0.171 and 0.734 . If one further compares the delay distributions corresponding to days with and without thunderstorms (see Figure 5), it is clear that delays are significantly higher in the latter case—all airports, except for ZLXY, yield a significant p-value in a Welch’s two-sample t-test, for α = 0.01 and with a Šidák correction for multiple testing.
Two conclusions can here be drawn. On one hand, the presence of thunderstorms strongly impact the dynamics of the system; this is not surprising, as such adverse events force aircraft to reroute, or even, if they are very close to an airport, to temporarily suspend operations. On the other hand, it can be appreciated from Figure 5 that thunderstorms are not enough to explain all extreme delays; on the contrary, in most cases the days with highest average delays correspond to the no-thunderstorms group. These results seem to suggest that thunderstorms are responsible for the global increase of delays observed during summer, but at the same time, that instances of extreme delays are independent from the weather condition.
We further tried to understand whether these dependencies are static, or have evolved over time. Table 4 reports the evolution of the χ 2 statistic, for each pair airport-metric, from the first to the second year of the data set—note that, being the degrees of freedom constant, the test statistic is proportional to the strength of the relationship. A clear trend is present in the temperature, for which the χ 2 statistics have become larger (and hence, the relationship stronger) through the end of 2017 and the beginning of 2018.
Taking into account that in 2017 the system has experienced a substantial increase in traffic levels (see Figure 3), this may indicate that existing operational buffers have reached a limit, and that the presence of thunderstorms has become an even more important factor.

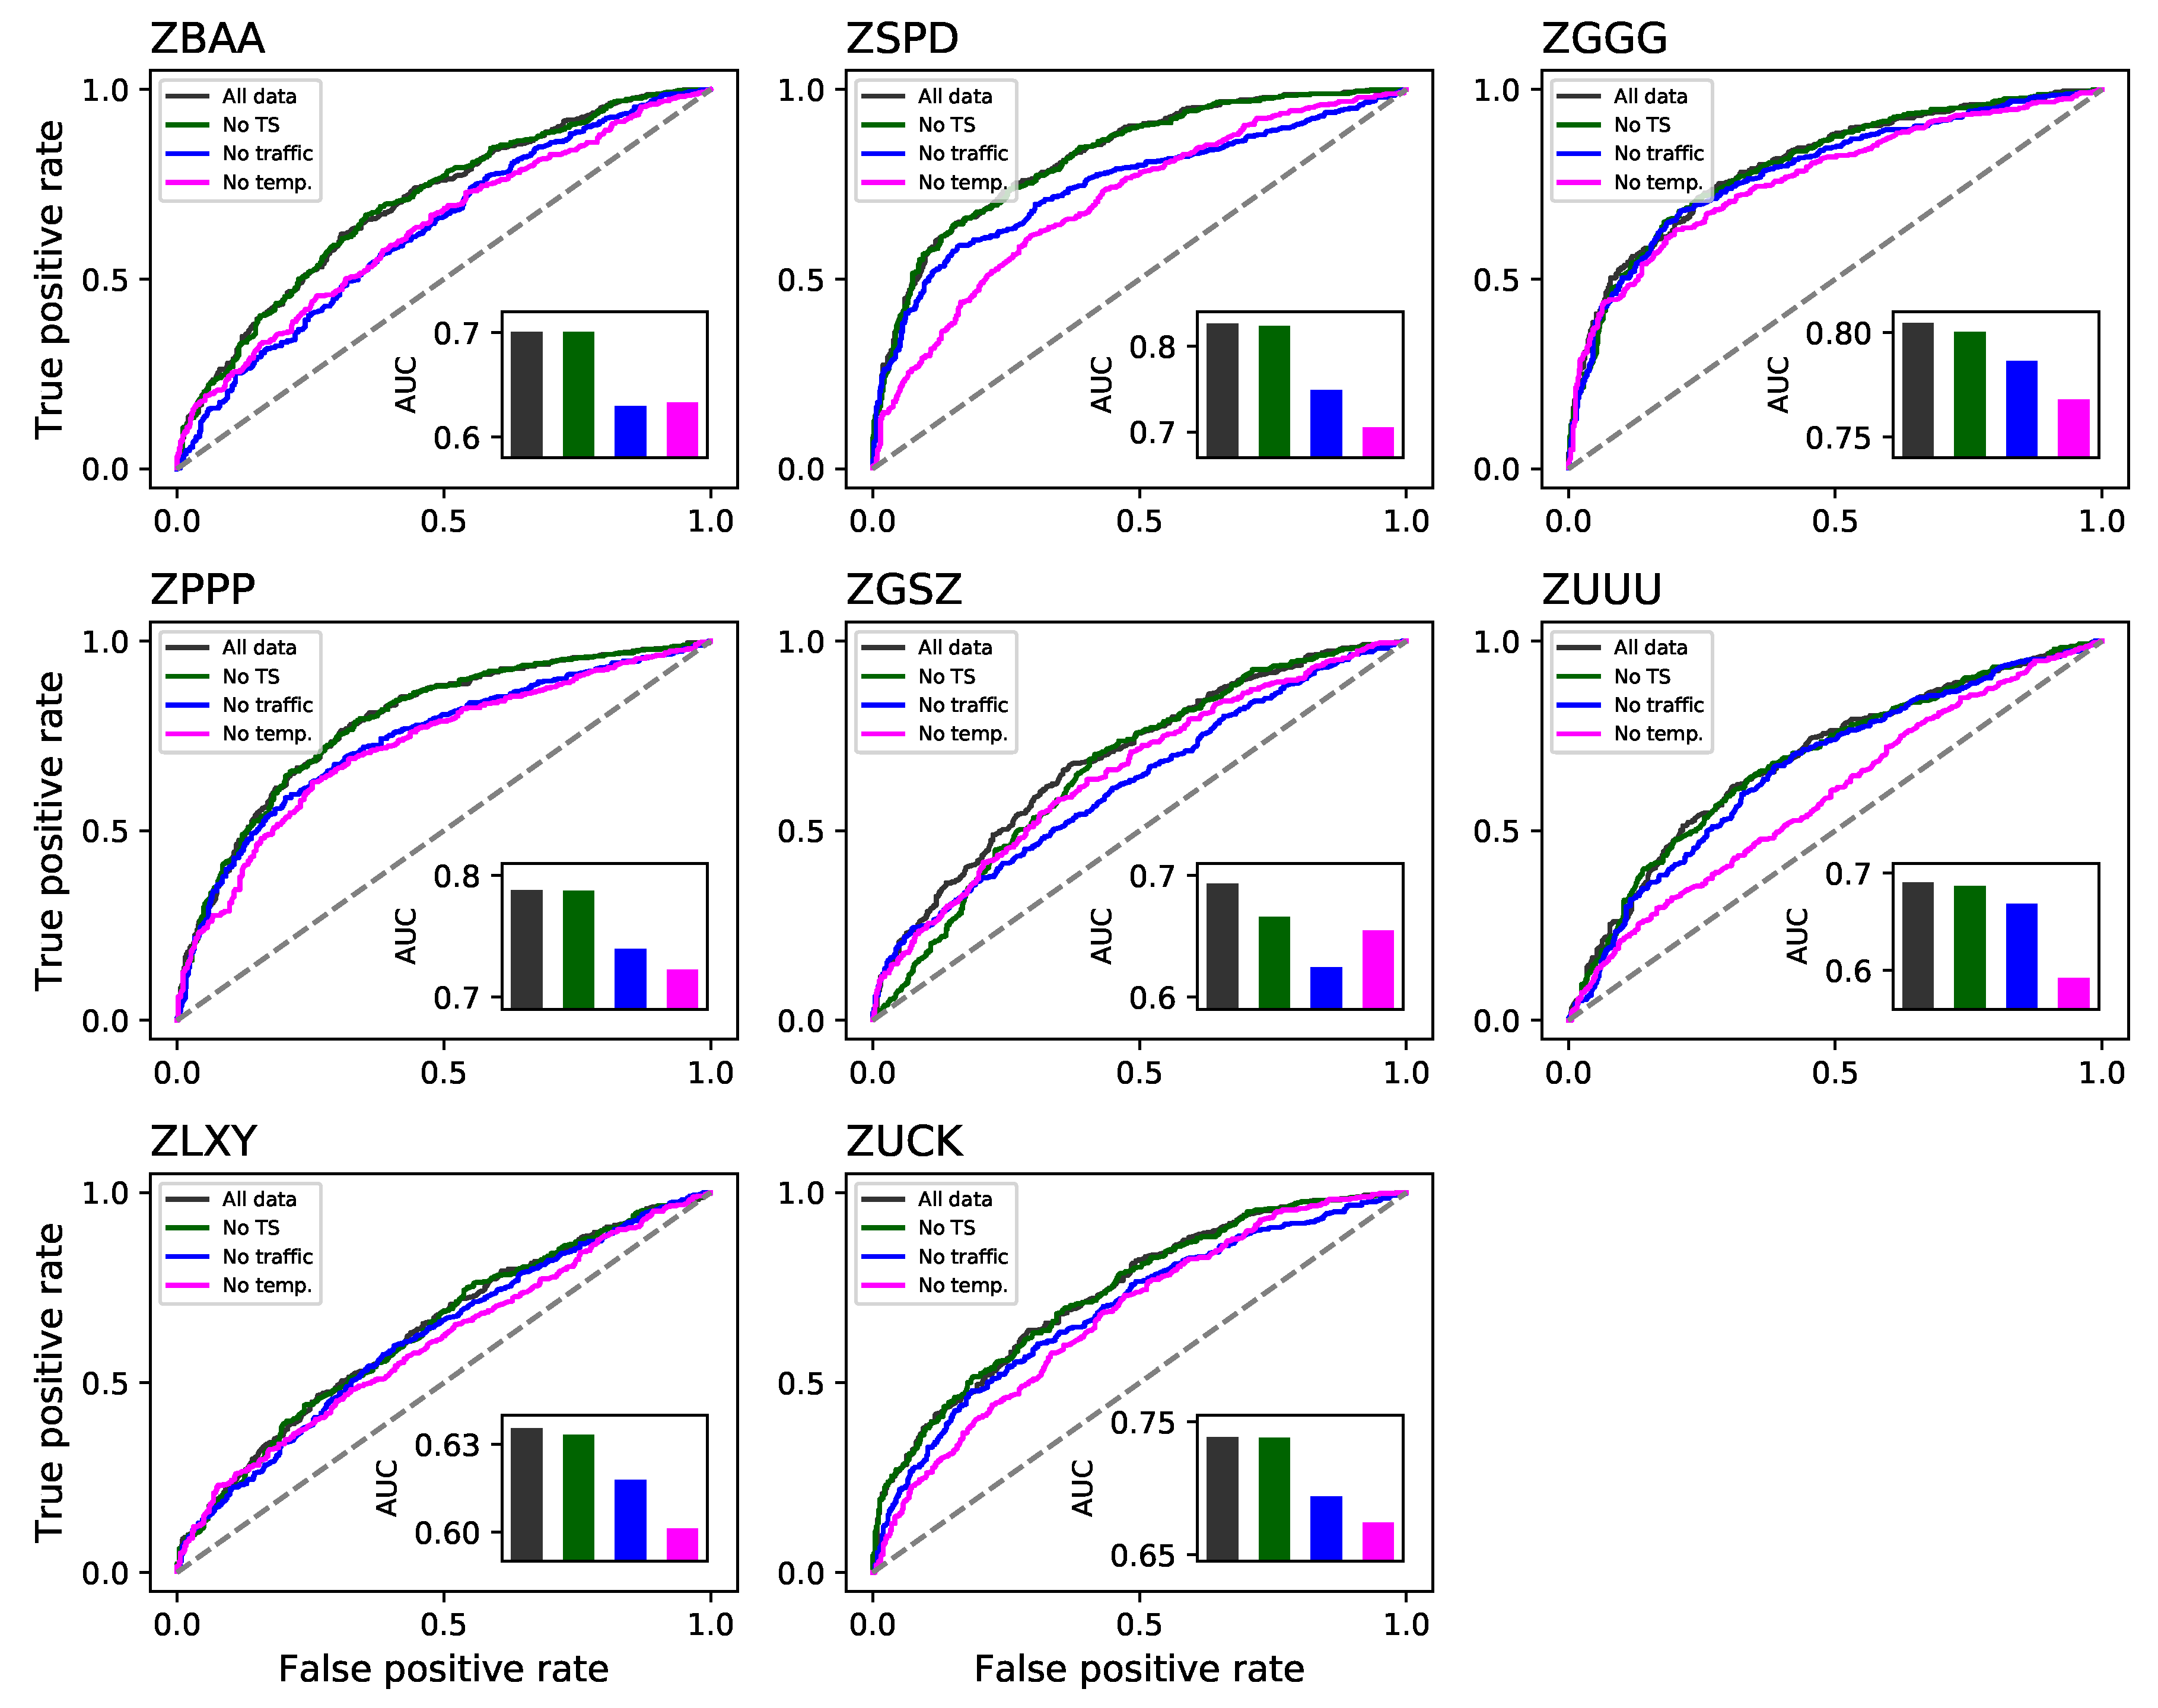
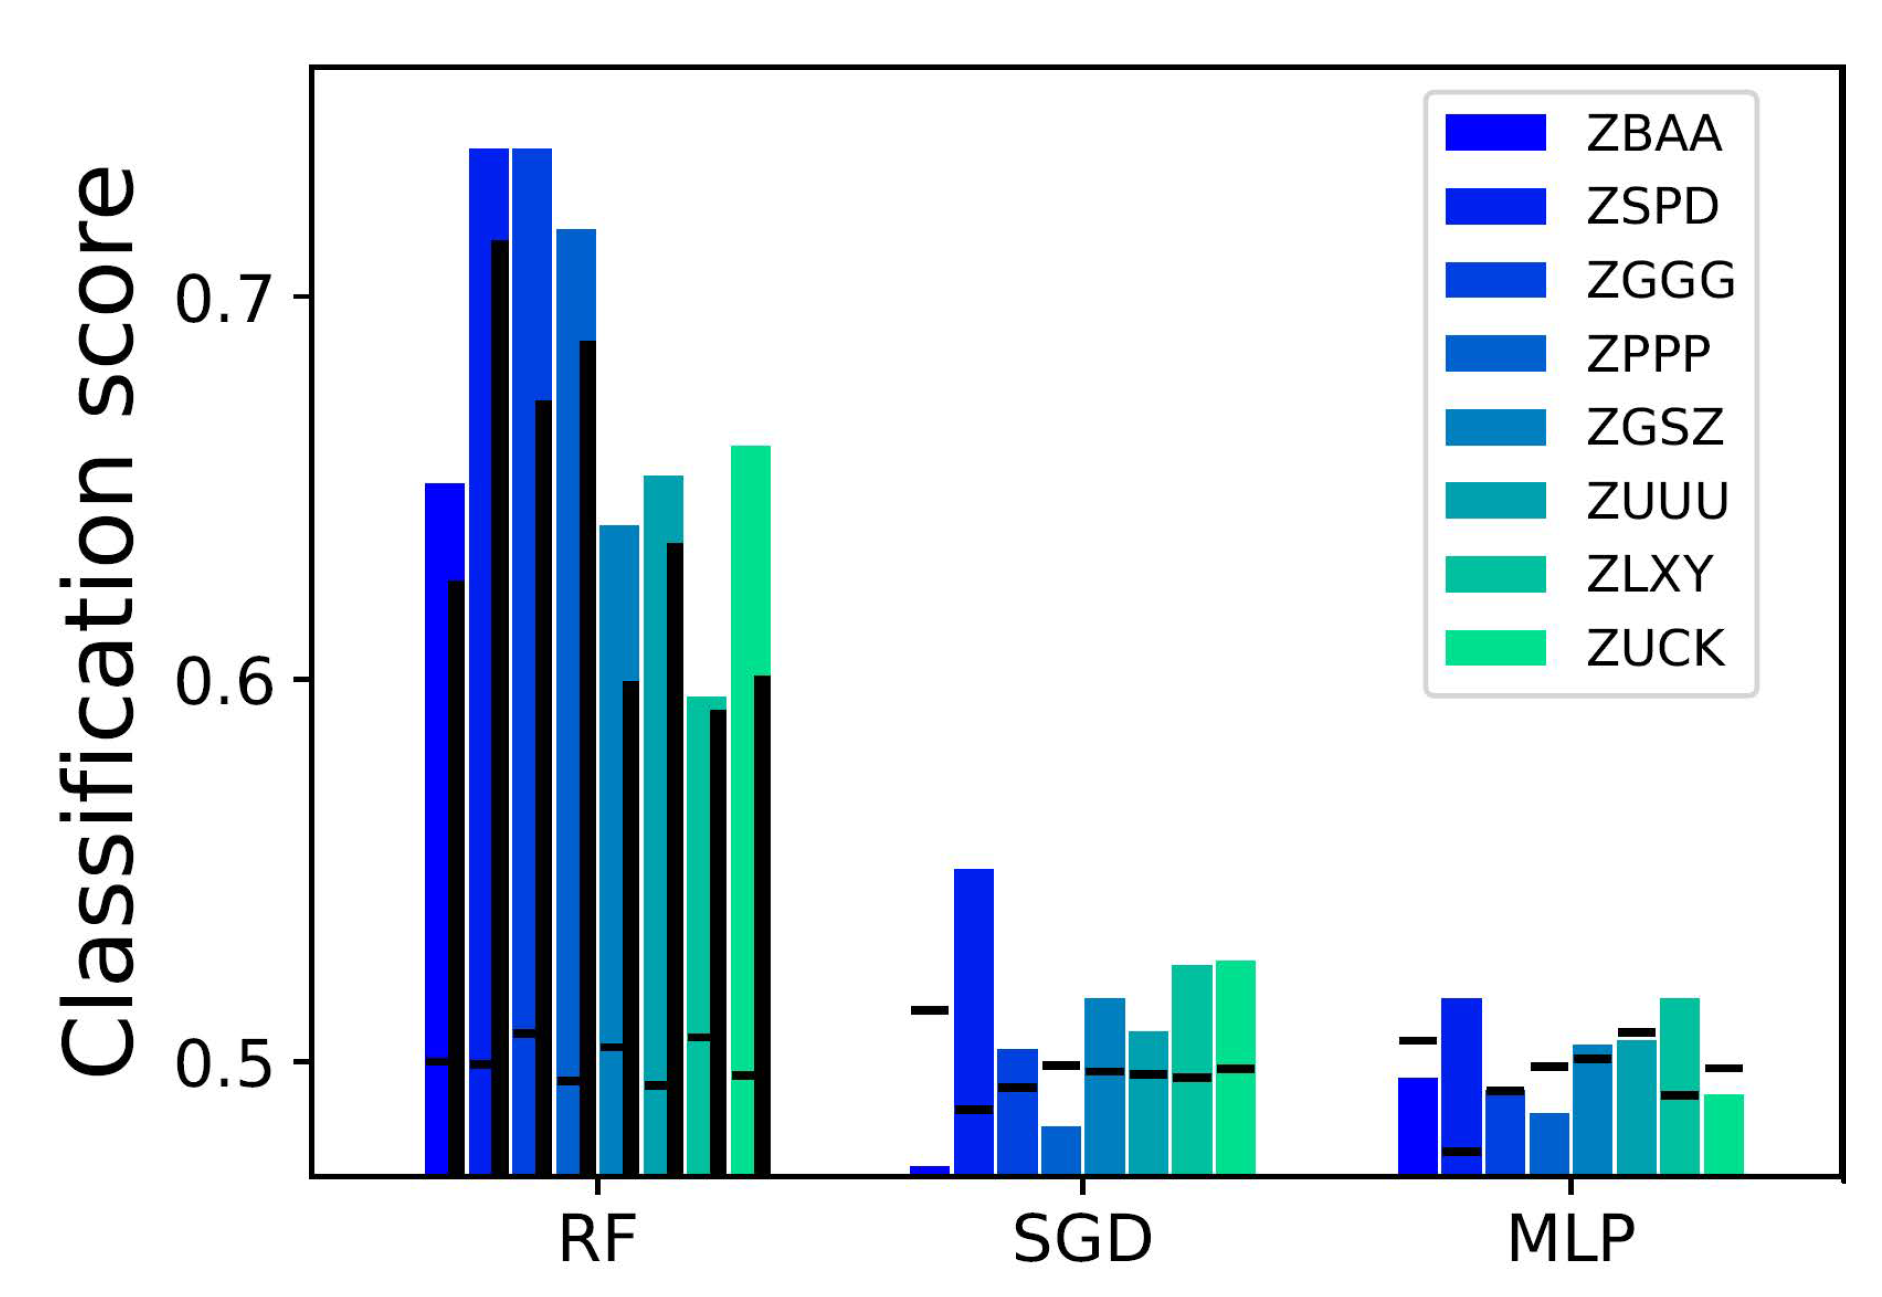
5.2. Delay Prediction

To complete this analysis, we finally assess the presence of a relationship between weather conditions and delays by means of data mining models. Specifically, we use a model to forecast the average level of delay for a given day and at a given airport using the observed weather condition, and by training it with all available historical data. Note that, while similar, this is not equivalent to the statistical analysis performed in Section 5.1. As shown for instance in [37], a data mining approach can help in unveiling relationships between sets of features that are not easily spotted by a classical statistical approach. Similarly, the analysis here proposed is not aimed at creating prediction models, on the line of what was presented in e.g., [13,28,31]; on the contrary, prediction scores are used as a way of quantifying the importance of the detected relationships.
The results, using Random Forests (RF) and Leave-One-Out Cross-Validation (LOOCV) techniques, are reported in Figure 6 in the form of Receiver Operating Characteristic (ROC) curves. The closer these curves are to the upper left corner, the more precise is the forecasted value—the gray dashed diagonal lines representing a random classification. Four classifications are reported for each airport: one in which all the features (both traffic level and weather variables) have been included (black lines); a second one, in which information about thunderstorms was discarded (green lines); a third one only considering weather conditions (blue lines); and a fourth one, in which temperature information was discarded. It can be appreciated that a good prediction is achieved in most airports, with a maximum in the Area Under the Curve (AUC) of 0.826 for ZSPD (Shanghai Pudong International Airport).
The use of the four different sets of features further allows to understand which aspect is more important from a prediction point of view—as its exclusion would substantially lower the score obtained. It can be seen that in all cases the traffic volume and the average daily temperature are the most important features, while the exclusion of information about thunderstorms has a minimal impact.
We finally present in Figure 7 the results of the same classification problem, for all three algorithms described in Section 3.4, and using a simple classification score (fraction of correctly classified days) as the success metric. First of all, it can be observed that results are mostly independent of the considered metric, either AUC or a simple score; the two easiest airports to forecast are ZSPD and ZGGG in both cases. Secondly, results strongly vary when different algorithms are used, with RF clearly outperforming the two other models. SGD tries to construct a linear model, and its low score therefore suggests the presence of non-linear relationships in the data. On the other hand, the low number of instances (913, one per considered day) may not be enough for MLP to reach a stable solution. Note that changing the parameters of the model, as the number of hidden layers and the number of neurons, does not improve the score. Thirdly, the horizontal black dashes report the average classification score obtained when labels (i.e., having large or small delays) are randomly shuffled; in the case of RF the classification score on the real data is much higher than the one for the randomized data set, confirming that the results presented in Figure 6 are statistically significant. Finally, the black vertical bars alongside the RF ones indicate the classification score obtained when classifying only days without thunderstorms. It can be appreciated that the score is lower, but not substantially; it is therefore possible to successfully predict the level of delays also for days without strong adverse meteorological phenomena.

6. Discussion and Conclusions

In this contribution we presented the results of a set of statistical and data mining analyses aimed at characterizing the appearance and evolution of delays in the Chinese air transport network. These analyses leveraged on a data set comprising more than 11 million flights, which allowed describing how the behavior of the system has evolved during two consecutive years, and giving a first estimation of the underlying causes.
The evolution of delays through time suggests that these have not diminished, in spite of efforts for improving the coordination between airports, and between civil and military air space users. As discussed in Section 4, summer peaks for years 2016 and 2018 are not different in a statistically significant way. On a positive note, the situation has not worsened in spite of a significant increase in traffic—see Figure 3.
Moving to delay causes, the results of Figure 6 indicate that a significant fraction of the delays appearing in the system can be predicted, provided some variables (like weather conditions and traffic levels) are known, or at least can be estimated in advance. From an operational point of view, this conclusion has major consequences. First of all, it supports the idea that real-time prediction models can be developed and deployed, ingesting weather forecasts and scheduled traffic patterns and yielding predictions of the delay levels. These could be used to improve the allocation of resources, or even warn passengers of forthcoming major disruptions in their trips. In addition, these results points to a relevant conceptual issue: if the appearance of an abnormal delay can be predicted, it also means that selective resources can be put in place for its mitigation. In contrast, only broad-spectrum mitigation strategies can be implemented if delays were completely random, as are for instance those due to random equipment failures, with an important reduction of their cost effectiveness. Predictability thus here implies actionability.
Regarding the factors associated with the appearance of delays, the most important ones are the presence of thunderstorms and the season of the year (the temperature being a proxy of the latter). The relevance of thunderstorms is self-evident, as aircraft have to reroute around them, and could even make an airport temporarily suspend its operations. This is in line with what is reported in the literature for other airports, see for instance [38,39,40]. These adverse weather phenomena are nevertheless not enough to explain all delays, and, as shown in Figure 5, extreme delays can also appear when no thunderstorm is recorded. The solution to this puzzle resides in the second factor, i.e., the season of the year. China customarily suffers from extreme weather events during summer, including Super Typhoons, partly because of the presence of the East Asian Summer Monsoon [41]. With the monsoon, masses of warm and moist air arrive over China, which also result in an increase in the observed temperature and rain—note the low p-values for these two variables in Table 3. While typhoons may be far away from a given airport, they are still capable of strongly affecting its operation, both by being in the path of flights arriving or departing from it, or through the generation of reactionary delays.
In synthesis, results indicate that most extreme delays in China can be explained either by extreme weather events near an airport, or by disrupting events en-route. As shown in the insets of Figure 6, the second most important element to achieve a good delay prediction is the traffic volume, even though it has a minor effect in the case of some airports (e.g., ZGGG and ZUUU). This seems to partly support the hypothesis of the importance of the limited availability of airspace resources, as suggested by previous analyses [1]—even though the opposite has also been defended [20]. These insights can potentially be used to improve the system at two levels. On one hand, results as those presented in Figure 6 point towards which airport is most sensitive to which factor, thus indicating how new resources have to be prioritized. To illustrate, airports like ZBAA and ZGSZ would benefit from an increase in their capacity, while this would be not a priority for e.g., ZUUU. On the other hand, the analyses here presented could be included into a monitoring software, designed to process historical data (for instance of the last week or month), and raise alerts when an unusual behavior is observed—e.g., when capacity becomes a factor more relevant than weather for delay appearance.
In spite of the multitude of statistical and data mining tests here presented, it is important to highlight that these can only detect co-occurrences, but not necessarily causalities. The factors really responsible for the observed events may be hidden from us, and yet manifest as spurious correlations [42,43]. This is the case, for instance, of the temperature: a hotter day does not directly delay aircraft, but a higher temperature is correlated with a higher probability of thunderstorms, which are the ones having the real impact. In order to confirm the causal nature of those relationships, more data will be needed, eventually endowed with a temporal evolution. Moreover, additional analysis could be performed regarding the temporary limited usage of airspace. For future work, one interesting direction is to extend our results to those of the complete system, i.e., the worldwide airport network [44].

Author Contributions

Conceptualization, M.Z., X.S. and S.W.; software, M.Z. and X.S.; data curation, Y.Z., R.Y., P.D. and X.S.; writing—original draft preparation, M.Z., X.S. and S.W.; writing—review and editing, Y.Z., R.Y. and P.D. All authors have read and agreed to the published version of the manuscript.

Funding

This study is supported by the Research Fund from National Natural Science Foundation of China (Grants No. 61861136005, No. 61851110763, No. 71731001). This project has received funding from the European Research Council (ERC) under the European Union’s Horizon 2020 research and innovation programme (grant agreement No 851255). Financial support has been received from the Agencia Estatal de Investigación (AEI, MCI, Spain) and Fondo Europeo de Desarrollo Regional (FEDER, UE), under the Maria de Maeztu Program for units of Excellence in R&D (MDM-2017-0711).

Conflicts of Interest

The authors declare no conflict of interest.

References

  1. Cook, A.; Belkoura, S.; Zanin, M. ATM performance measurement in Europe, the US and China. Chin. J. Aeronaut. 2017, 30, 479–490. [Google Scholar] [CrossRef]
  2. Ball, M.; Barnhart, C.; Dresner, M.; Hansen, M.; Neels, K.; Odoni, A.R.; Peterson, E.; Sherry, L.; Trani, A.; Zou, B. Total Delay Impact Study: A Comprehensive Assessment of the Costs and Impacts of Flight Delay in the United States. National Center of Excellence for Aviation Operations Research Final Report. 2010. Available online: http://www.isr.umd.edu/NEXTOR/rep2010.html (accessed on 3 August 2020).
  3. Civil Aviation Administration of China. Statistical Bulletin of Civil Aviation Industry Development in 2015; Civil Aviation Administration of China: Beijing, China, 2015. [Google Scholar]
  4. Baumgarten, P.; Malina, R.; Lange, A. The impact of hubbing concentration on flight delays within airline networks: An empirical analysis of the US domestic market. Transp. Res. Part E Logist. Transp. Rev. 2014, 66, 103–114. [Google Scholar] [CrossRef]
  5. Britto, R.; Dresner, M.; Voltes, A. The impact of flight delays on passenger demand and societal welfare. Transp. Res. Part E Logist. Transp. Rev. 2012, 48, 460–469. [Google Scholar] [CrossRef]
  6. Aydemir, R.; Seymour, D.T.; Buyukdagli, A.; Guloglu, B. An empirical analysis of delays in the Turkish Airlines network. J. Air Transp. Manag. 2017, 65, 76–87. [Google Scholar] [CrossRef]
  7. Belkoura, S.; Peña, J.M.; Zanin, M. Generation and recovery of airborne delays in air transport. Transp. Res. Part C Emerg. Technol. 2016, 69, 436–450. [Google Scholar] [CrossRef]
  8. Santos, G.; Robin, M. Determinants of delays at European airports. Transp. Res. Part B Methodol. 2010, 44, 392–403. [Google Scholar] [CrossRef]
  9. Borsky, S.; Unterberger, C. Bad weather and flight delays: The impact of sudden and slow onset weather events. Econ. Transp. 2019, 18, 10–26. [Google Scholar] [CrossRef]
  10. Fukui, H.; Nagata, K. Flight cancellation as a reaction to the tarmac delay rule: An unintended consequence of enhanced passenger protection. Econ. Transp. 2014, 3, 29–44. [Google Scholar] [CrossRef]
  11. Gayle, P.G.; Yimga, J.O. How much do consumers really value air travel on-time performance, and to what extent are airlines motivated to improve their on-time performance? Econ. Transp. 2018, 14, 31–41. [Google Scholar] [CrossRef]
  12. Kim, A.M. The impacts of changing flight demands and throughput performance on airport delays through the Great Recession. Transp. Res. Part A Policy Pract. 2016, 86, 19–34. [Google Scholar] [CrossRef]
  13. Rebollo, J.J.; Balakrishnan, H. Characterization and prediction of air traffic delays. Trans. Res. Part C Emerg. Technol. 2014, 44, 231–241. [Google Scholar] [CrossRef]
  14. Kafle, N.; Zou, B. Modeling flight delay propagation: A new analytical-econometric approach. Transp. Res. Part B Methodol. 2016, 93, 520–542. [Google Scholar] [CrossRef]
  15. Wandelt, S.; Sun, X.; Zhang, J. Evolution of domestic airport networks: A review and comparative analysis. Transp. B Transp. Dyn. 2019, 7, 1–17. [Google Scholar] [CrossRef]
  16. AhmadBeygi, S.; Cohn, A.; Guan, Y.; Belobaba, P. Analysis of the potential for delay propagation in passenger airline networks. J. Air Transp. Manag. 2008, 14, 221–236. [Google Scholar] [CrossRef] [Green Version]
  17. Cook, A.; Tanner, G.; Zanin, M. Towards superior air transport performance metrics–imperatives and methods. J. Aerosp. Oper. 2013, 2, 3–19. [Google Scholar] [CrossRef]
  18. Fleurquin, P.; Ramasco, J.J.; Eguiluz, V.M. Systemic delay propagation in the US airport network. Sci. Rep. 2013, 3, 1159. [Google Scholar] [CrossRef] [Green Version]
  19. Ivanov, N.; Netjasov, F.; Jovanović, R.; Starita, S.; Strauss, A. Air Traffic Flow Management slot allocation to minimize propagated delay and improve airport slot adherence. Transp. Res. Part A Policy Pract. 2017, 95, 183–197. [Google Scholar] [CrossRef]
  20. Zhang, A.; Czerny, A.I. Airports and airlines economics and policy: An interpretive review of recent research. Econ. Transp. 2012, 1, 15–34. [Google Scholar] [CrossRef]
  21. Fan, L.W.; Wu, F.; Zhou, P. Efficiency measurement of Chinese airports with flight delays by directional distance function. J. Air Transp. Manag. 2014, 34, 140–145. [Google Scholar] [CrossRef]
  22. Tsionas, M.G.; Chen, Z.; Wanke, P. A structural vector autoregressive model of technical efficiency and delays with an application to Chinese airlines. Transp. Res. Part A Policy Pract. 2017, 101, 1–10. [Google Scholar] [CrossRef] [Green Version]
  23. Zanin, M.; Belkoura, S.; Zhu, Y. Network analysis of Chinese air transport delay propagation. Chin. J. Aeronaut. 2017, 30, 491–499. [Google Scholar] [CrossRef]
  24. Beatty, R.; Hsu, R.; Berry, L.; Rome, J. Preliminary evaluation of flight delay propagation through an airline schedule. Air Traffic Control Q. 1999, 7, 259–270. [Google Scholar] [CrossRef]
  25. Churchill, A.M.; Lovell, D.J.; Ball, M.O. Flight delay propagation impact on strategic air traffic flow management. Transp. Res. Rec. J. Transp. Res. Board 2010, 2177, 105–113. [Google Scholar] [CrossRef]
  26. Mueller, E.; Chatterji, G. Analysis of aircraft arrival and departure delay characteristics. In Proceedings of the AIAA’s Aircraft Technology, Integration, and Operations (ATIO) 2002 Technical Forum, Los Angeles, CA, USA, 1–3 October 2002; Volume 5866. [Google Scholar]
  27. Tu, Y.; Ball, M.O.; Jank, W.S. Estimating Flight Departure Delay Distributions—A Statistical Approach With Long-Term Trend and Short-Term Pattern. J. Am. Stat. Assoc. 2008, 103, 112–125. [Google Scholar] [CrossRef]
  28. Kim, Y.J.; Choi, S.; Briceno, S.; Mavris, D. A deep learning approach to flight delay prediction. In Proceedings of the 2016 IEEE/AIAA 35th Digital Avionics Systems Conference (DASC), Sacramento, CA, USA, 25–29 September 2016; pp. 1–6. [Google Scholar]
  29. Hansen, M.; Nikoleris, T.; Lovell, D.; Vlachou, K.; Odoni, A. Use of queuing models to estimate delay savings from 4D trajectory precision. In Proceedings of the Eighth USA/Europe Air Traffic Management Research and Development Seminar, Napa, CA, USA, 29 June–2 July 2009. [Google Scholar]
  30. Pyrgiotis, N.; Malone, K.M.; Odoni, A. Modelling delay propagation within an airport network. Transp. Res. Part C Emerg. Technol. 2013, 27, 60–75. [Google Scholar] [CrossRef]
  31. Xu, N.; Sherry, L.; Laskey, K.B. Multifactor Model for Predicting Delays at U.S. Airports. Transp. Res. Rec. 2008, 2052, 62–71. [Google Scholar] [CrossRef] [Green Version]
  32. Liaw, A.; Wiener, M. Classification and regression by randomForest. R News 2002, 2, 18–22. [Google Scholar]
  33. Bottou, L. Large-scale machine learning with stochastic gradient descent. In Proceedings of COMPSTAT’2010, Proceedings of the 19th International Conference on Computational Statistics, Paris, France, 22–27 August 2010; Springer: Berlin/Heidelberg, Germany, 2010; pp. 177–186. [Google Scholar]
  34. Martin, R. Advanced supervised learning in multi-layer perceptrons-from backpropagation to adaptive learning algorithms. Comput. Stand. Interfaces 1994, 16, 265–278. [Google Scholar]
  35. Pedregosa, F.; Varoquaux, G.; Gramfort, A.; Michel, V.; Thirion, B.; Grisel, O.; Blondel, M.; Prettenhofer, P.; Weiss, R.; Dubourg, V.; et al. Scikit-learn: Machine learning in Python. J. Mach. Learn. Res. 2011, 12, 2825–2830. [Google Scholar]
  36. Kohavi, R. A study of cross-validation and bootstrap for accuracy estimation and model selection. IJCAI 1995, 14, 1137–1145. [Google Scholar]
  37. Zanin, M.; Papo, D.; Sousa, P.A.; Menasalvas, E.; Nicchi, A.; Kubik, E.; Boccaletti, S. Combining complex networks and data mining: Why and how. Phys. Rep. 2016, 635, 1–44. [Google Scholar] [CrossRef] [Green Version]
  38. Lee, Y.X.; Zhong, Z.W. A study of the relationship between adverse weather conditions and flight delay. J. Adv. Technol. Eng. Res. 2016, 2, 113–117. [Google Scholar]
  39. Pejovic, T.; Williams, V.A.; Noland, R.B.; Toumi, R. Factors affecting the frequency and severity of airport weather delays and the implications of climate change for future delays. Transp. Res. Rec. 2009, 2139, 97–106. [Google Scholar] [CrossRef]
  40. Sternberg, A.; Carvalho, D.; Murta, L.; Soares, J.; Ogasawara, E. An analysis of Brazilian flight delays based on frequent patterns. Transp. Res. Part E Logist. Transp. Rev. 2016, 95, 282–298. [Google Scholar] [CrossRef]
  41. Zhang, Q.; Ni, X.; Zhang, F. Decreasing trend in severe weather occurrence over China during the past 50 years. Sci. Rep. 2017, 7, 42310. [Google Scholar] [CrossRef] [Green Version]
  42. Pearl, J. Causality; Cambridge University Press: Cambridge, UK, 2009. [Google Scholar]
  43. Pearl, J.; Mackenzie, D. The Book of Why: The New Science of Cause and Effect; Basic Books: New York, NY, USA, 2018. [Google Scholar]
  44. Sun, X.; Wandelt, S.; Zanin, M. Worldwide air transportation networks: A matter of scale and fractality? Transp. A Transp. Sci. 2017, 13, 607–630. [Google Scholar] [CrossRef]
Figure 1. Chinese air transportation infrastructure. All 277 Chinese airports are represented by blue dots. The top 20 Chinese airports according to the total number of passengers are highlighted and labeled with their four-character ICAO codes.
Applsci 10 06165 g001
Figure 2. Highlighting of the top-ranked airport pairs in the data set according to different criteria: Largest number of flights (upper left), largest number of delayed flights (upper right), largest sum of delays (lower left) and largest median of delays (lower right).
Applsci 10 06165 g002
Figure 3. Delay evolution in China from May 2016 to October 2018. Each panel represents the evolution of the average (black lines) and median (green lines) of flight delays, calculated with a one month resolution; additionally, the dashed gray lines (right axis) depict the evolution of the number of flights (in thousands per month). The top left panel reports the aggregated results for the whole data set, while the other ones for the top-eight airports (ranked in decreasing number of flights).
Applsci 10 06165 g003
Figure 4. Evolution of the average monthly delay (black solid line) and of the fraction of days with thunderstorms (green dashed line, right Y axis), for the top eight Chinese airports.
Applsci 10 06165 g004
Figure 5. Box-plots of the distributions of the average daily delays, for days without (left) and with (right) thunderstorms near or at the airport. The p-values of Welch’s two-sample t-tests, assessing the equality of both distributions, are reported in the upper part of each panel.
Applsci 10 06165 g005
Figure 6. ROC curve of classification models predicting the level of binarized delays at each airport. All results correspond to Random Forest (RF) algorithms and a Leave-One-Out cross-validation strategy. The insets further depict the corresponding AUC for each classification model.
Applsci 10 06165 g006
Figure 7. Classification score obtained by three standard data mining algorithms (see Section 3.4 for definitions), for the problem of forecasting the binarized delay at each airport. The horizontal dashes represent the average value obtained in a classification in which labels have randomly been shuffled. Additionally, the vertical black bars alongside RF results indicate the classification score obtained when predicting the delays for days without thunderstorms.
Applsci 10 06165 g007
Table 1. Statistical analysis of delays by seasons. Columns report the average and standard deviation of delays, in the winter and summer seasons of 2016–2018, for the complete data set and for the top-eight airports in China.
Airport2016.05–2016.102016.11–2017.042017.05–2017.102017.11–2018.042018.05–2018.11
Domestic 12.36 ± 6.16 10.88 ± 3.30 26.13 ± 16.62 4.78 ± 3.27 9.04 ± 7.24
ZBAA 12.17 ± 9.13 11.77 ± 5.56 31.52 ± 23.57 3.58 ± 4.21 9.47 ± 8.83
ZSPD 13.88 ± 9.16 4.54 ± 3.53 21.87 ± 18.14 6.98 ± 3.15 4.00 ± 8.92
ZGGG 13.88 ± 9.48 6.16 ± 4.45 24.27 ± 16.86 0.52 ± 3.23 12.24 ± 10.46
ZPPP 7.85 ± 5.57 13.89 ± 10.31 23.92 ± 20.47 3.03 ± 6.66 6.18 ± 8.06
ZGSZ 27.60 ± 11.12 14.93 ± 7.49 39.78 ± 23.37 3.06 ± 4.53 19.96 ± 13.29
ZUUU 9.33 ± 6.19 11.96 ± 3.46 23.31 ± 18.51 2.38 ± 3.35 7.98 ± 8.23
ZLXY 6.10 ± 4.28 3.86 ± 1.79 18.99 ± 12.00 1.97 ± 4.33 2.94 ± 5.05
ZUCK 10.05 ± 6.94 6.49 ± 3.45 29.90 ± 18.84 4.32 ± 2.53 9.76 ± 7.34
Table 2. Statistical significance of delays by seasons. The columns report the p-value of a two-sample t-test checking if the delay was significantly different between the same season of two consecutive years.
AirportpV Summer (2016 vs. 2017)pV Winter (2016 vs. 2017)pV Summer (2017 vs. 2018)
Domestic0.13020.01490.0739
ZBAA0.13420.02670.0950
ZSPD0.4065 2.966 × 10 4 0.0870
ZGGG0.26490.04710.2108
ZPPP0.14350.08080.1176
ZGSZ0.32700.01580.1383
ZUUU0.1593 1.246 × 10 3 0.1350
ZLXY0.06250.39790.0294
ZUCK0.06670.28460.0642
Table 3. Statistical relationships between weather, air quality and delays. Columns 2–7 report the p-values of χ 2 tests assessing the dependence between the average delay at each airport and the corresponding weather condition, as well as the air quality index (AQI).
AirportTemperatureWind SpeedRainVisibilityThunderstormAQI
ZBAA 1.34 × 10 6 3.53 × 10 4 1.21 × 10 6 0.849 6.47 × 10 12 3.15 × 10 4
ZSPD 6.87 × 10 26 0.127 7.51 × 10 8 0.029 4.70 × 10 13 4.34 × 10 5
ZGGG 2.05 × 10 15 0.355 1.35 × 10 36 0.145 2.40 × 10 32 0.114
ZPPP 8.95 × 10 20 6.03 × 10 3 9.31 × 10 26 0.957 8.44 × 10 21
ZGSZ 0.951 0.951 5.29 × 10 11 2.60 × 10 4 8.27 × 10 16
ZUUU 9.62 × 10 7 1.61 × 10 6 0.021 9.42 × 10 6 2.64 × 10 6 5.80 × 10 3
ZLXY 1.15 × 10 7 0.128 0.104 6.61 × 10 6 1.37 × 10 3
ZUCK 2.48 × 10 31 1.49 × 10 3 0.286 8.98 × 10 11 2.48 × 10 10
Table 4. Evolution of the weather-delay relationships. Each cell reports the evolution of the χ 2 statistics of a test assessing the presence of a relationship between high delays and a meteorological factor, for a given pair airport-metric, from the first year of the data set (May 2016 to April 2017, left side of the arrow) to the second year (May 2017 to April 2018, right side of the arrow).
AirportTemperatureWind SpeedRainVisibility
ZBAA 11.07 135.6 7.88 5.72 15.9 35.2 0.69 0.00
ZSPD 11.84 120.6 1.09 2.95 8.58 19.8 3.14 2.95
ZGGG 12.16 112.5 0.13 0.00 38.4 29.3 4.56 0.17
ZPPP 15.24 116.9 0.00 3.50 4.23 52.2 7.05 1.56
ZGSZ 0.229 83.72 1.43 1.56 17.1 17.4 0.07 7.31
ZUUU 2.119 112.5 0.88 5.72 0.19 13.2 5.23 26.0
ZLXY 5.517 94.01 0.02 14.9 1.41 5.02 10.1 10.4
ZUCK 25.18 122.8 2.15 0.70 5.79 0.00 8.57 29.5

