Article

Identification of Major Inefficient Water Consumption Areas Considering Water Consumption, Efficiencies, and Footprints in Australia

by
Muhammad Atiq Ur Rehman Tariq
1,2,*,
Riley Raimond Damnics
1,
Zohreh Rajabi
1,
Muhammad Laiq Ur Rahman Shahid
3 and
Nitin Muttil
1,2,*
1
College of Engineering and Science, Victoria University, Melbourne, VIC 8001, Australia
2
Institute for Sustainable Industries & Liveable Cities, Victoria University, P.O. Box 14428, Melbourne, VIC 8001, Australia
3
Department of Electronic Engineering, University of Engineering and Technology Taxila, Rawalpindi 46000, Pakistan
*
Authors to whom correspondence should be addressed.
Appl. Sci. 2020, 10(18), 6156; https://doi.org/10.3390/app10186156
Submission received: 25 July 2020 / Revised: 28 August 2020 / Accepted: 30 August 2020 / Published: 4 September 2020

Abstract

:
Due to population growth, climatic change, and growing water usage, water scarcity is expected to be a more prevalent issue at the global level. The situation in Australia is even more serious because it is the driest continent and is characterized by larger water footprints in the domestic, agriculture and industrial sectors. Because the largest consumption of freshwater resources is in the agricultural sector (59%), this research undertakes a detailed investigation of the water footprints of agricultural practices in Australia. The analysis of the four highest water footprint crops in Australia revealed that the suitability of various crops is connected to the region and the irrigation efficiencies. A desirable crop in one region may be unsuitable in another. The investigation is further extended to analyze the overall virtual water trade of Australia. Australia’s annual virtual water trade balance is adversely biased towards exporting a substantial quantity of water, amounting to 35 km3, per trade data of 2014. It is evident that there is significant potential to reduce water consumption and footprints, and increase the water usage efficiencies, in all sectors. Based on the investigations conducted, it is recommended that the water footprints at each state level be considered at the strategic level. Further detailed analyses are required to reduce the export of a substantial quantity of virtual water considering local demands, export requirements, and production capabilities of regions.

1. Introduction

Inefficient and excessive use of water could deplete aquifers, degrade flora and fauna habitats, and cause water supply shortages. Water is the fundamental resource required for sustaining life; however, with the current trends in population growth, climatic disturbances of water distribution, and the mismanagement of water usage, water scarcity is becoming a more prevalent issue not only globally but also within Australia. For example, the total withdrawal of global water resources was 4 trillion m3 in 2014; however, it was only 1 trillion m3 in 1934 [1]. A report by the World Water Assessment Programme [2] predicts “By 2025, 1.8 billion people are expected to be living in countries or regions with absolute water scarcity, and two-thirds of the world population could be under water stress conditions”. Several examples of water scarcity have occurred over the years, which have highlighted the importance of water sustainability [3]. As water resources become increasingly scarce, the appropriate usage of water needs to be emphasized, particularly in the agricultural sector. This trend is worrying considering the additional factor of global warming, which is further contributing to water scarcity through the increased evaporation of freshwater resources. This phenomenon is generally characterized by less rainfall and drier conditions. This is felt locally in southern Australian cropping zones, which are affected by a severe deficit of water, putting pressure on water supply networks [4,5]. The FAO predicted that the amount of global water withdrawal for agriculture will increase by 11 percent from 2006 to 2050. At present, extraction from aquifers has reached 100% of total groundwater replenishment rates in many parts of the world and agriculture systems are already at risk due to water scarcity [6,7]. As a result, these excessive abstractions of groundwater have led to severe problems with groundwater reserves.
Despite being the driest populated continent on the planet, Australia has the highest rate of internal domestic water use per person [8]. The Australian government initialized a number of project streams including urban water efficiency projects addressing issues such as reduced leakage, sewerage treatment practices, and stormwater capture and recycling [9]. Industrial water efficiency projects such as plant upgrades, processing or product redesign, and implementation and water recycling have also been initiated. Off-farm projects have included dams and water storage, stock and domestic pipelines, and upgraded channel systems [10]. Metering projects comprise flow regulation infrastructure, installing meters and upgrading meters to comply with the Australian Standard. On-farm projects have included drip irrigation systems, replacing open channels with pipes and water-efficient root stock. Various other steps have been taken, such as “New Water” from saline aquifers, water loss management programs, water efficiency audits of steam systems, irrigation network renewal, aquifer recharge with storm water programs, etc. These are effective approaches to address the water crisis by enhancing water availability. However, the smart use of this precious resource is still being ignored at a larger scale. The overall picture of water efficiency still lacks better planning of water resources.
It has been proven that monitoring and controlling the water footprint can reduce water consumption by identifying water-related risks within the supply chain [11]. Water footprint assessments can be used to ensure sustainable water usage and maintain global water security. The concept of the water footprint introduced the idea of measuring water consumption throughout the lifecycle of a product or service, including direct and auxiliary water consumption values throughout the product’s lifecycle. This consumption is categorized into three broad classifications: blue, green, or grey water. Blue water is classified as surface or groundwater consumed or lost in the production of an item. Losses from blue water are counted when water can no longer be used in the defined analysis area, e.g., evaporation or pumped away. Green water is water stored in the root-zone of plants and is consumed by plants or evaporated away. Grey water is relevant to the concentration of pollutants released in the production of a good or service. It is the amount of water required to maintain the water quality standard in the pollutant release zone. The sum of these three values provides a metric of the true impact of a product or service on the water network.
In addition to products and services, water footprints of nations can help identify the priority areas for the water security of a country. Hoekstra and Chapagain [12] investigated the water footprints of Morocco and the Netherlands for agricultural production from domestic sources. Yu et al. [13] concluded that water consumption for domestic, industrial, and agriculture sectors must be taken into account in planning water provision and promoting sustainable water consumption in a similar study for England at regional and national level. Feng et al. [14] considered the spatial aspect of the internal and external water footprints for the UK. In recent years, a significant amount of detailed water efficiency, footprints, virtual trade, and accounting research has been carried out for China in the fields of food security, power generation, urban households, and agriculture sectors [15,16,17,18,19].
Unfortunately, Australian water footprints are concerning as the added value of water for industrial usage is lowest in the world, and water footprints for domestic and industrial usages are the fourth highest at the global level [20,21]. Nevertheless, the country exports a large amount of virtual water annually through its trade. Considering the inefficient water usage in almost all sectors in Australia and the capabilities of water footprint assessments to address water security issues, the following research question triggered the current research:
What are the major water consumption sectors and how can the water footprint help in reducing the water accounting-related vulnerabilities in Australia by identifying the most detrimental sector?
The aim of this research is to analyze the substantial water consumption, efficiencies, and footprints in Australia to examine water conservation in different sectors, including trade. The undertaken research identifies possibilities to reduce the water footprints of different uses. A framework is developed to analyze the water security issues of a country/region. The work itself demonstrates an application of combining water footprint and virtual water trade techniques with traditional water accounting methods. The outcomes of this research not only provide guidance to improve water consumption in Australia but are equally beneficial for other countries/regions to review their water consumption practices considering the availability and economic value of water.

1.1. Freshwater Availability in Australia

Australia receives an average of 417 mm of rainfall per year, which generates 3700 km3 of runoff [22]. Rainfall supports Australia’s dryland (non-irrigated) agriculture and a number or domestic water supplies (via rainwater tanks); however, rainfall is not considered a water resource for statutory water management. Only rainfall-runoff into creeks, rivers, and lakes (which accounts for 9% of total water received from rainfall) or recharged groundwater aquifers (2% of total water received from rainfall) is considered a managed resource. About 89% of water received from rainfall is lost through evapotranspiration [23].
Australia’s population data (2014) shows that the population has doubled in the last 50 years. As the population has grown, water resources have decreased due to climate change. Renewable internal freshwater resources reduced from 45,802 m3 in 1962 to 20,971 m3 per capita as of 2014 [24,25]. Australia has experienced severe droughts in the past, such as the Federation drought (1895–1902), World War II drought (1937–1945), and the Millennium draught (2001–2009) [26]. These droughts mostly impacted Australia’s agricultural sector. Large water storages, designed to hold reserves to manage dry years, were also drawn down during these droughts [27].

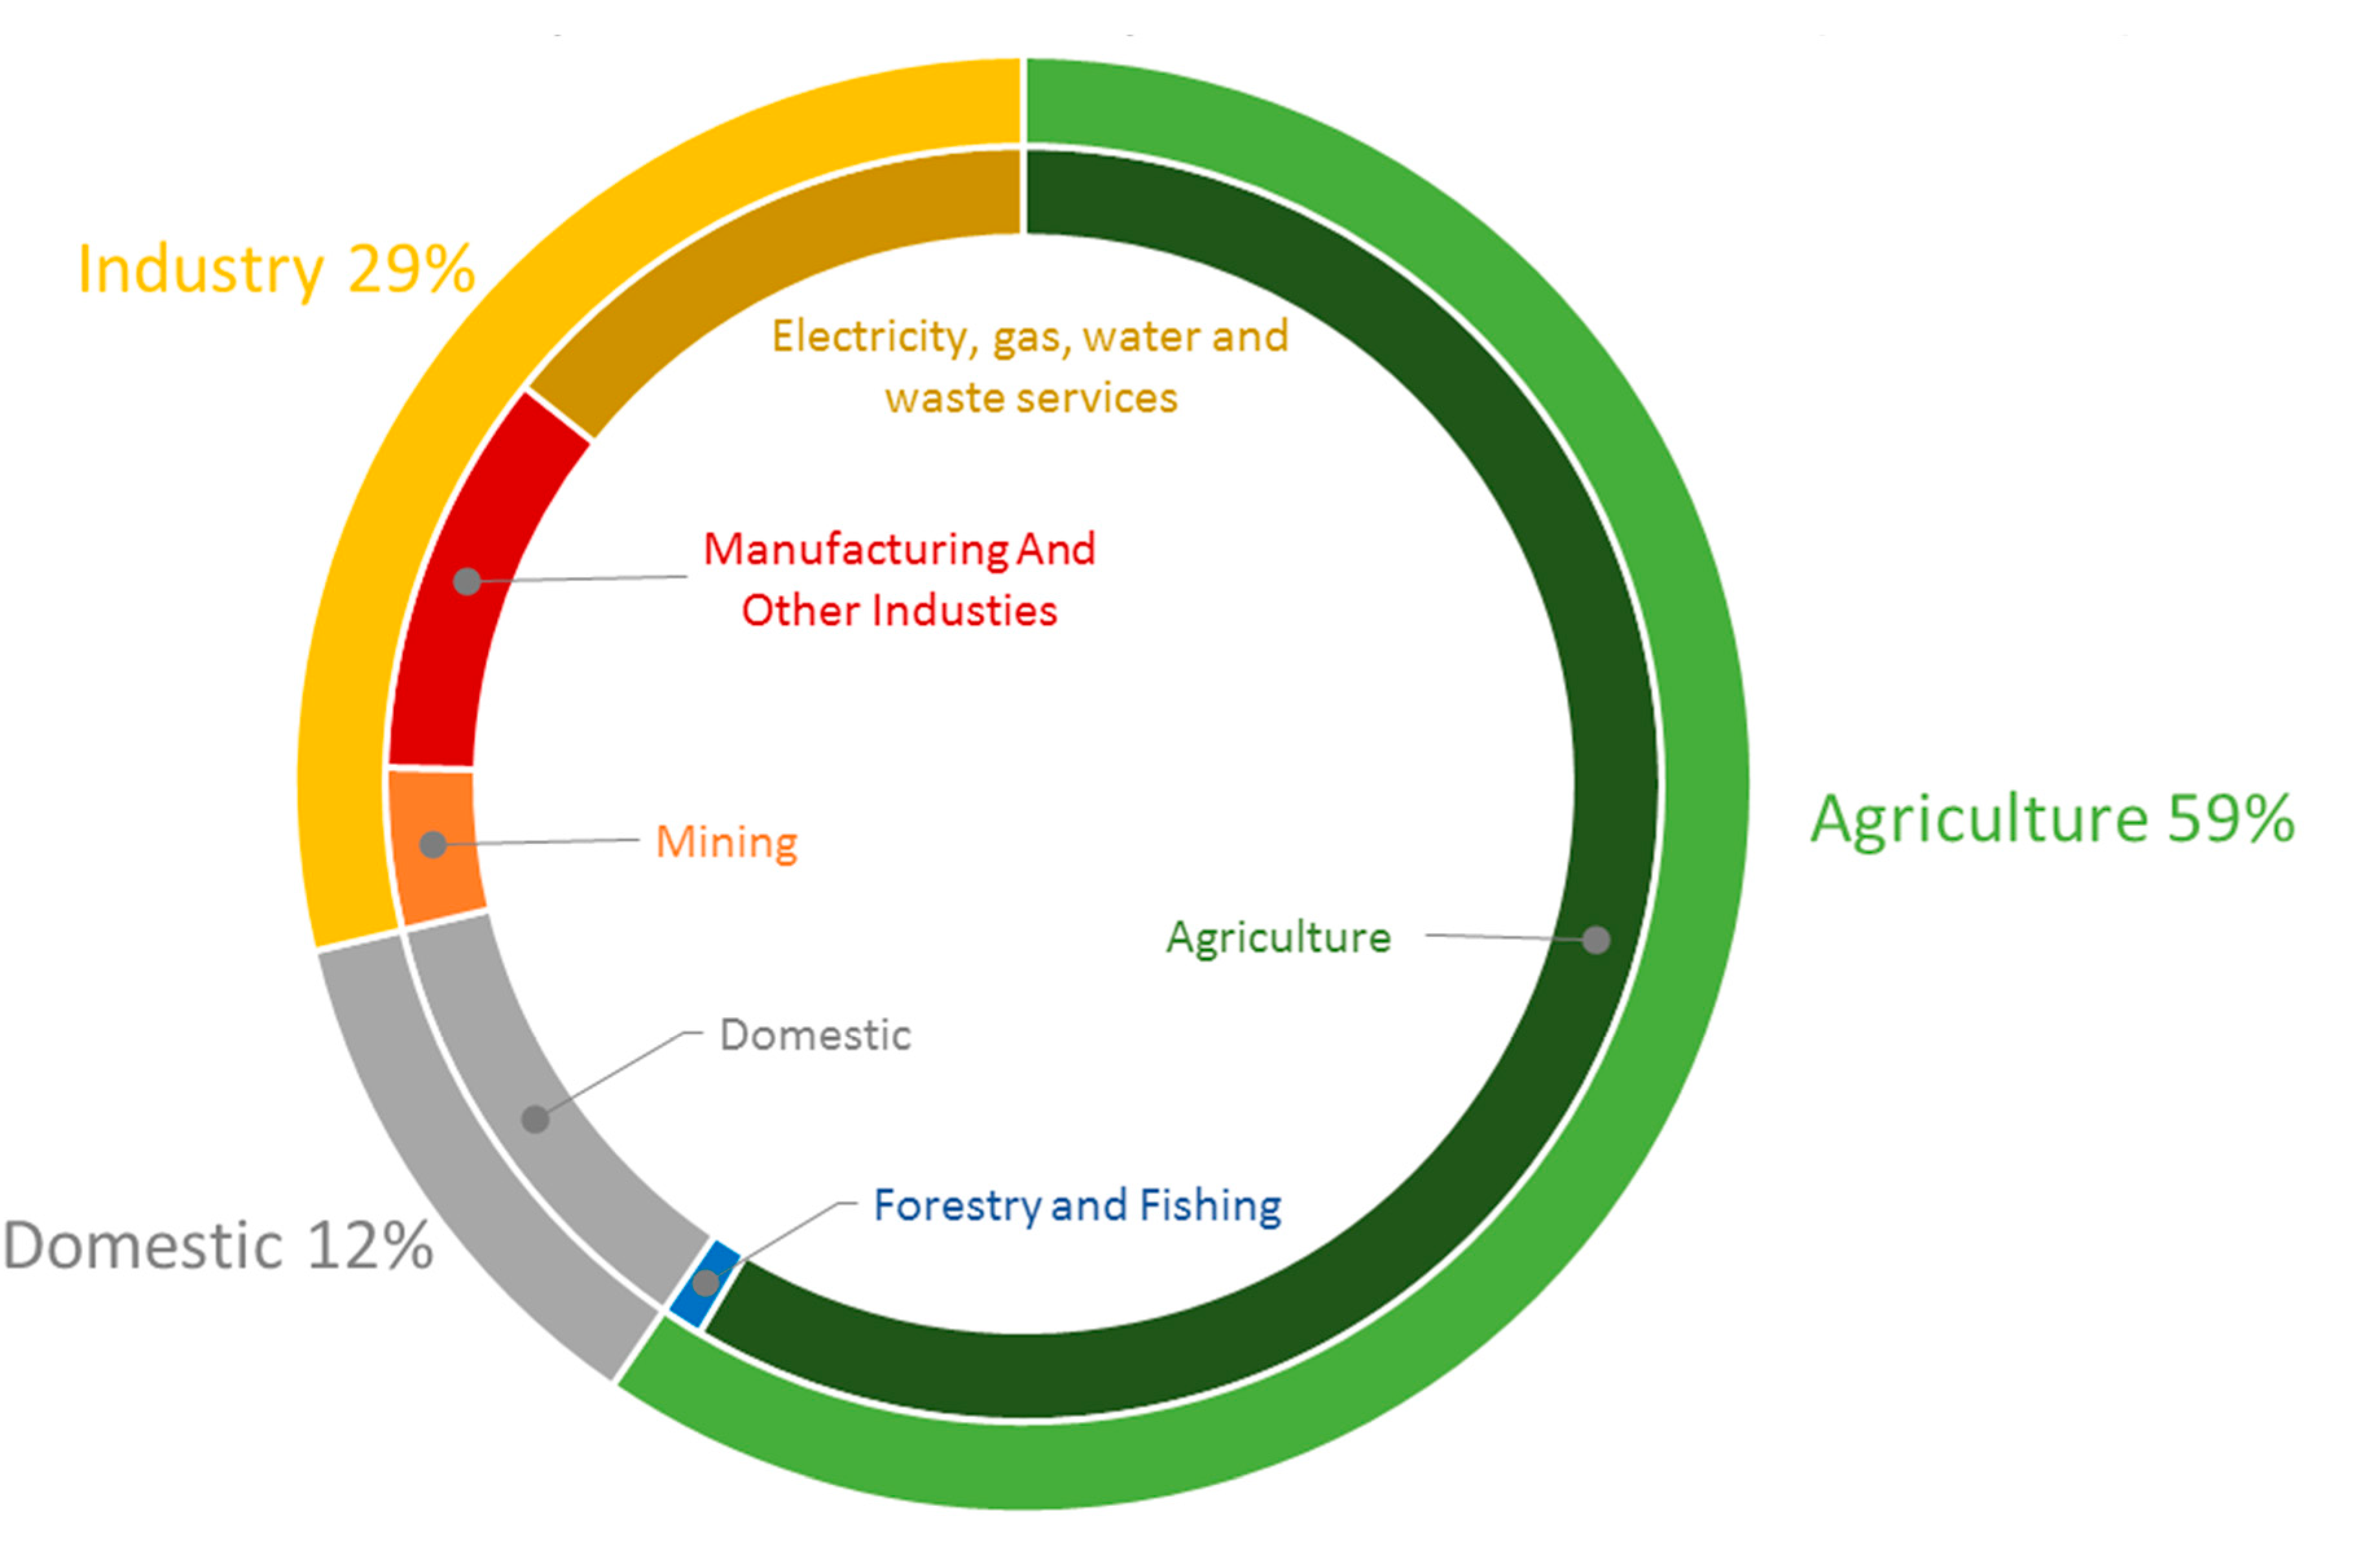
1.2. Major Water Consumption Sectors

Australia has the fourth largest domestic water footprint globally [20]. It uses more water domestically than could be considered “essential” and may not be utilizing its water resources efficiently in the industrial sector [20,28]. Figure 1 shows that the largest consumer of freshwater resources is the agriculture sector (59%), followed by industry (29%) and then domestic (12%) sectors. Previous research prioritizes the agriculture sector being the largest consumer of Australian water, because an efficient management of water resources in the agriculture sector will have a significant impact on overall water efficiency [29].

2. Water Footprint Accounting

After the analysis of freshwater availability, a detailed analysis of water footprints of major water consuming sectors was carried out. The proposed methodology is explained in Figure 2. A standard water consumption accounting for the domestic and industrial sectors was conducted; however, a detailed and thorough analysis for major crops was performed at the regional level due to high water consumption in the agriculture sector. Australia has one of the highest negative balances of green water, mainly due to its exports [30]. Hoekstra et al. [8] determined the water footprints of Australia at the national level and found that the internal water footprint for domestic water is 341 m 3 / Cap / y , and for industrial is 64 m 3 / Cap / y internal and 211 m 3 / Cap / y external, whereas for agricultural products it is 736 m 3 / Cap / y internal and 41 m 3 / Cap / y external. Therefore, recalculating the internal and external water footprints is beyond the scope of this research.

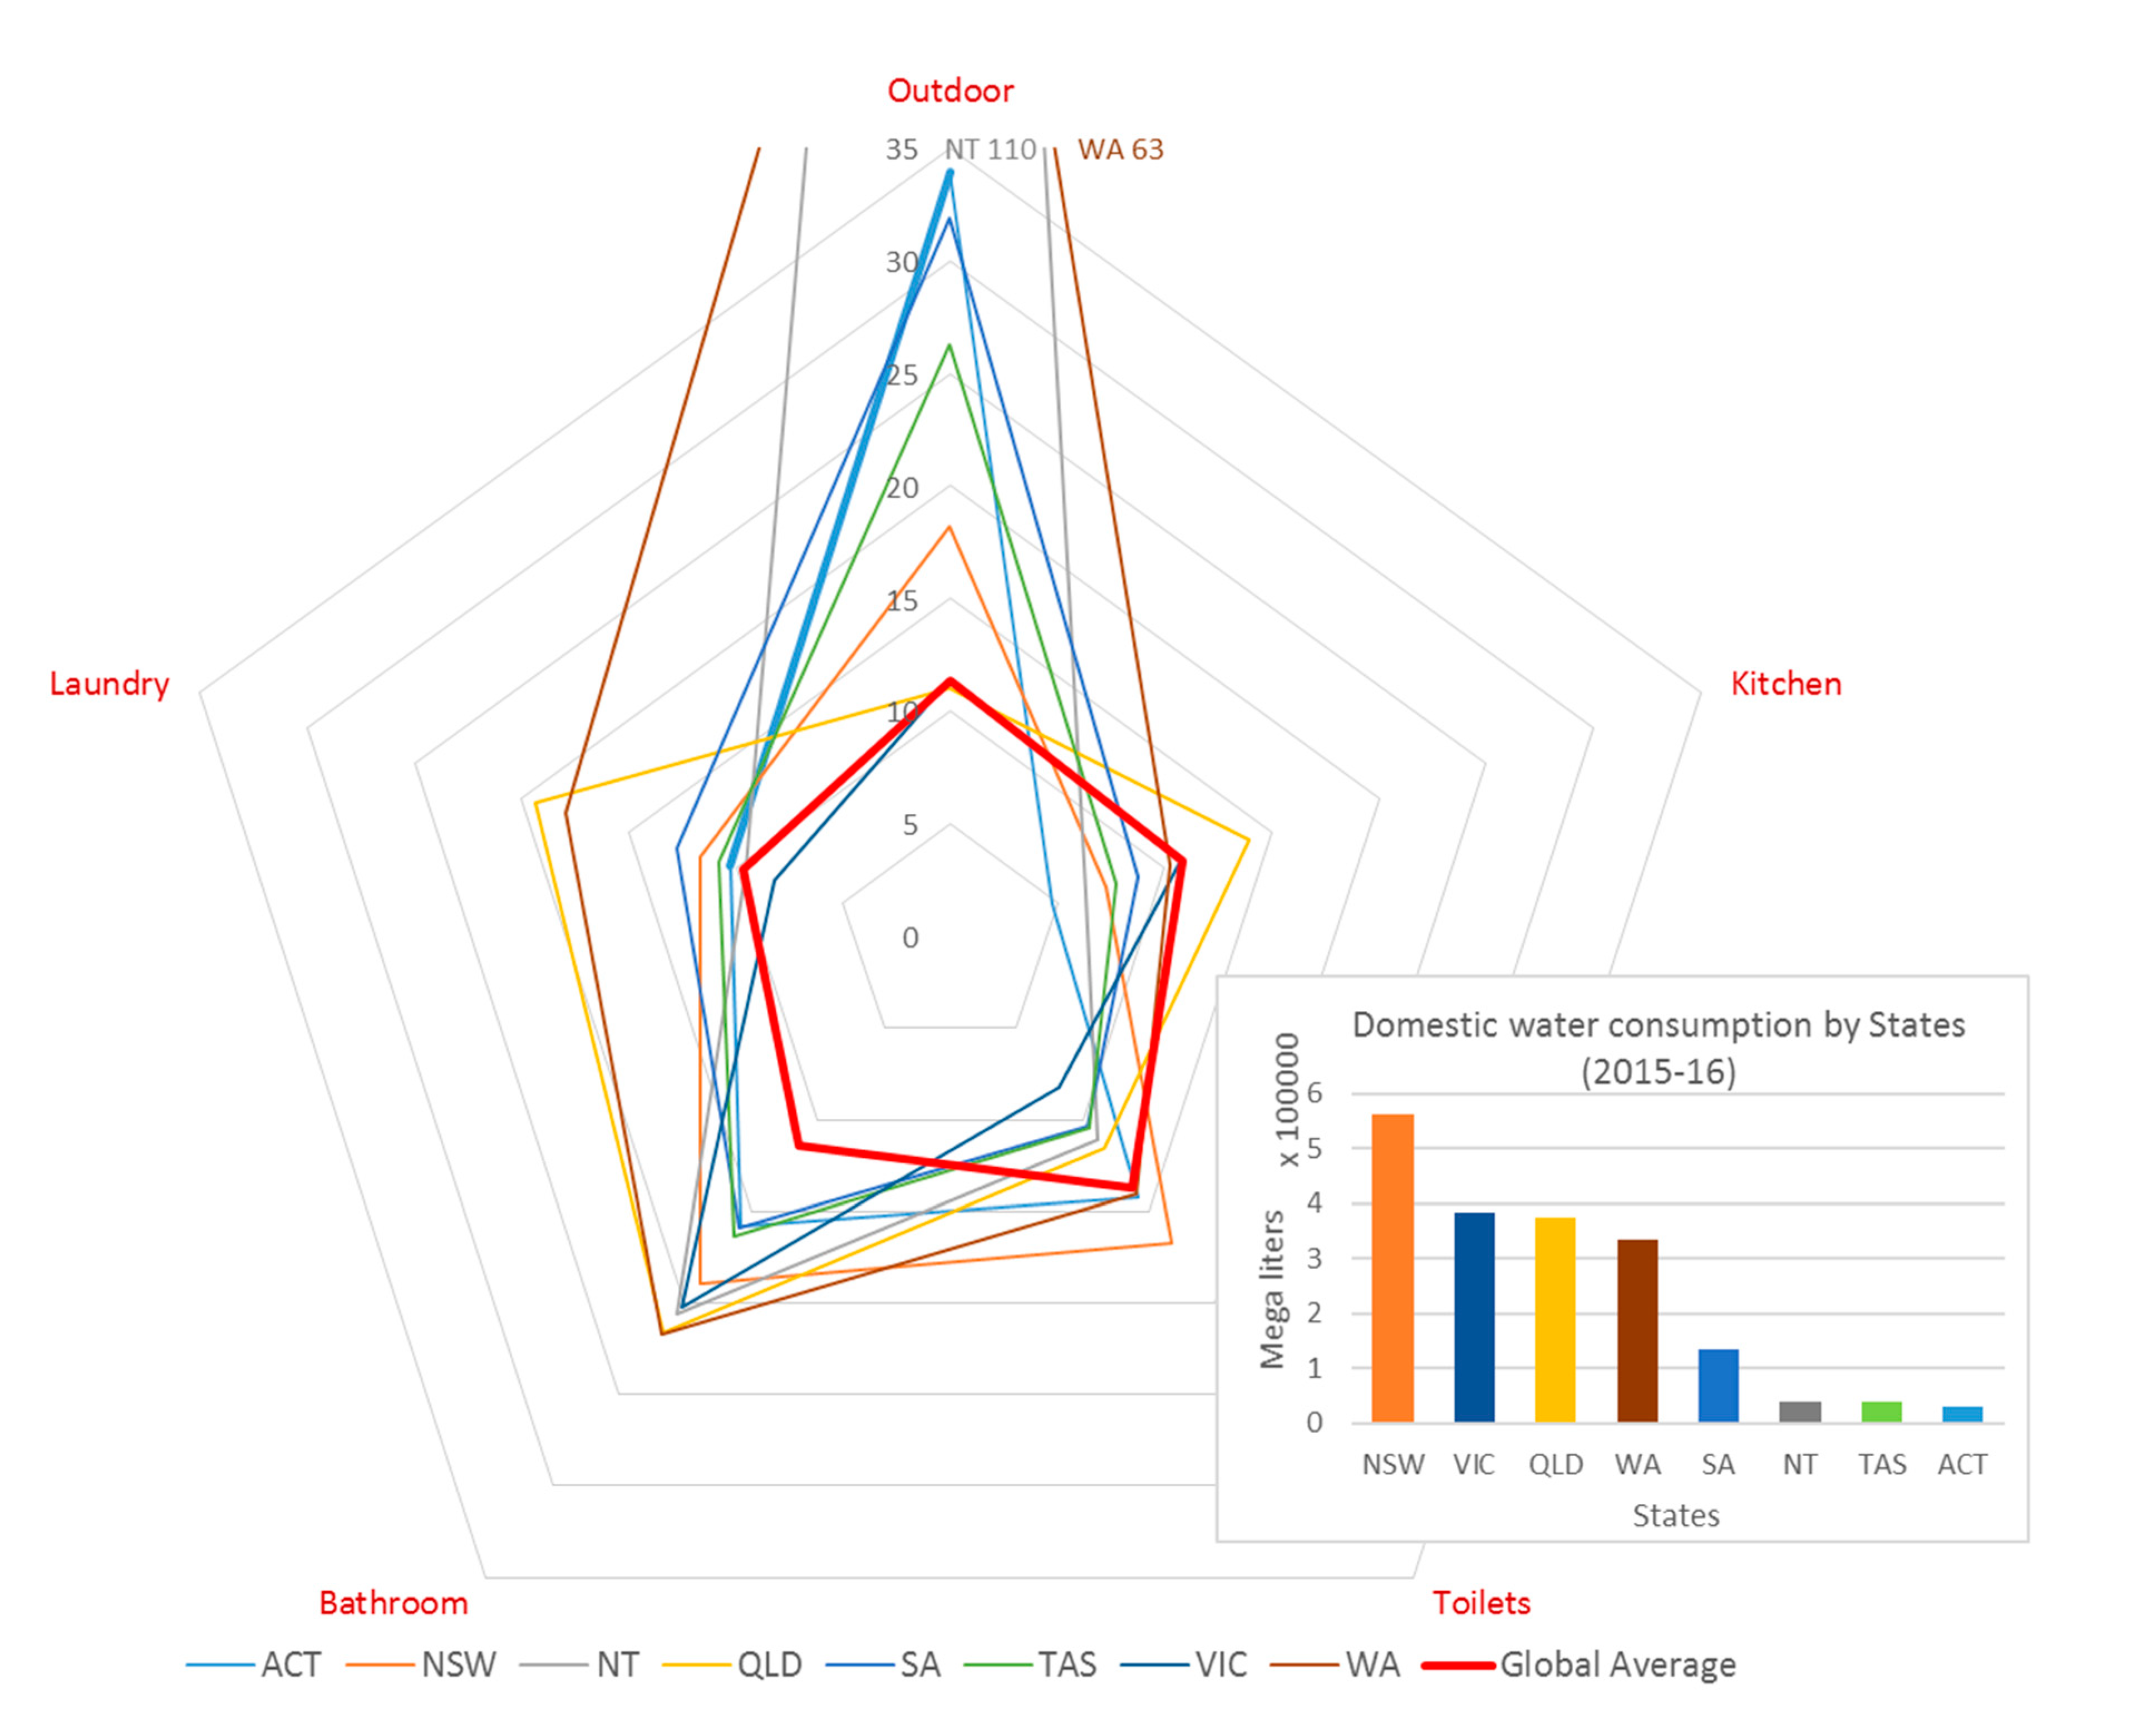
2.1. Domestic Water Consumption Accounting

Population and water consumption data was collected from the National Water Account and the Australian Bureau of Statistics (ABS) [31] to perform the domestic water consumption accounting. Calculation of water use per capita highlighted the states with higher water consumption. The data for end water usage was collected for the states of Northern Territory (NT), Victoria (VIC), Western Australia (WA), Queensland (QLD), and New South Wales (NSW). The states of NT, VIC, and QLD however, only had data available on a city basis; this data was for the largest cities in the state therefore was an accurate representation of water usage trends within the states. Domestic water usage (12%) is a relatively minor portion compared to the agricultural and industrial sectors. However, due to its nature of use and based on direct stakeholders, urban water footprints have the highest priority. Excluding NT and WA, the remaining six states have a mean usage of 74,186 L per capita per year (LCY) (refer Figure 3) which is higher than the global average footprints of 57,000 LCY. WA and NT demonstrate much higher water consumption of 127,929 LCY (72% higher than the middle band average of other states excluding these two) and 158,407 LCY (114% greater than the middle band average of other states excluding these two), respectively. NT and WA have potential to reduce water consumption. Further investigation revealed that the lifestyle of these two states is characterized by larger houses with green areas that need a substantial amount of water for gardening [32]. End water usage data shows that Darwin and West Australia use 70% and 50%, respectively, of domestic water for outdoor use, whereas Brisbane and Melbourne use 5% and 18%, respectively [33].

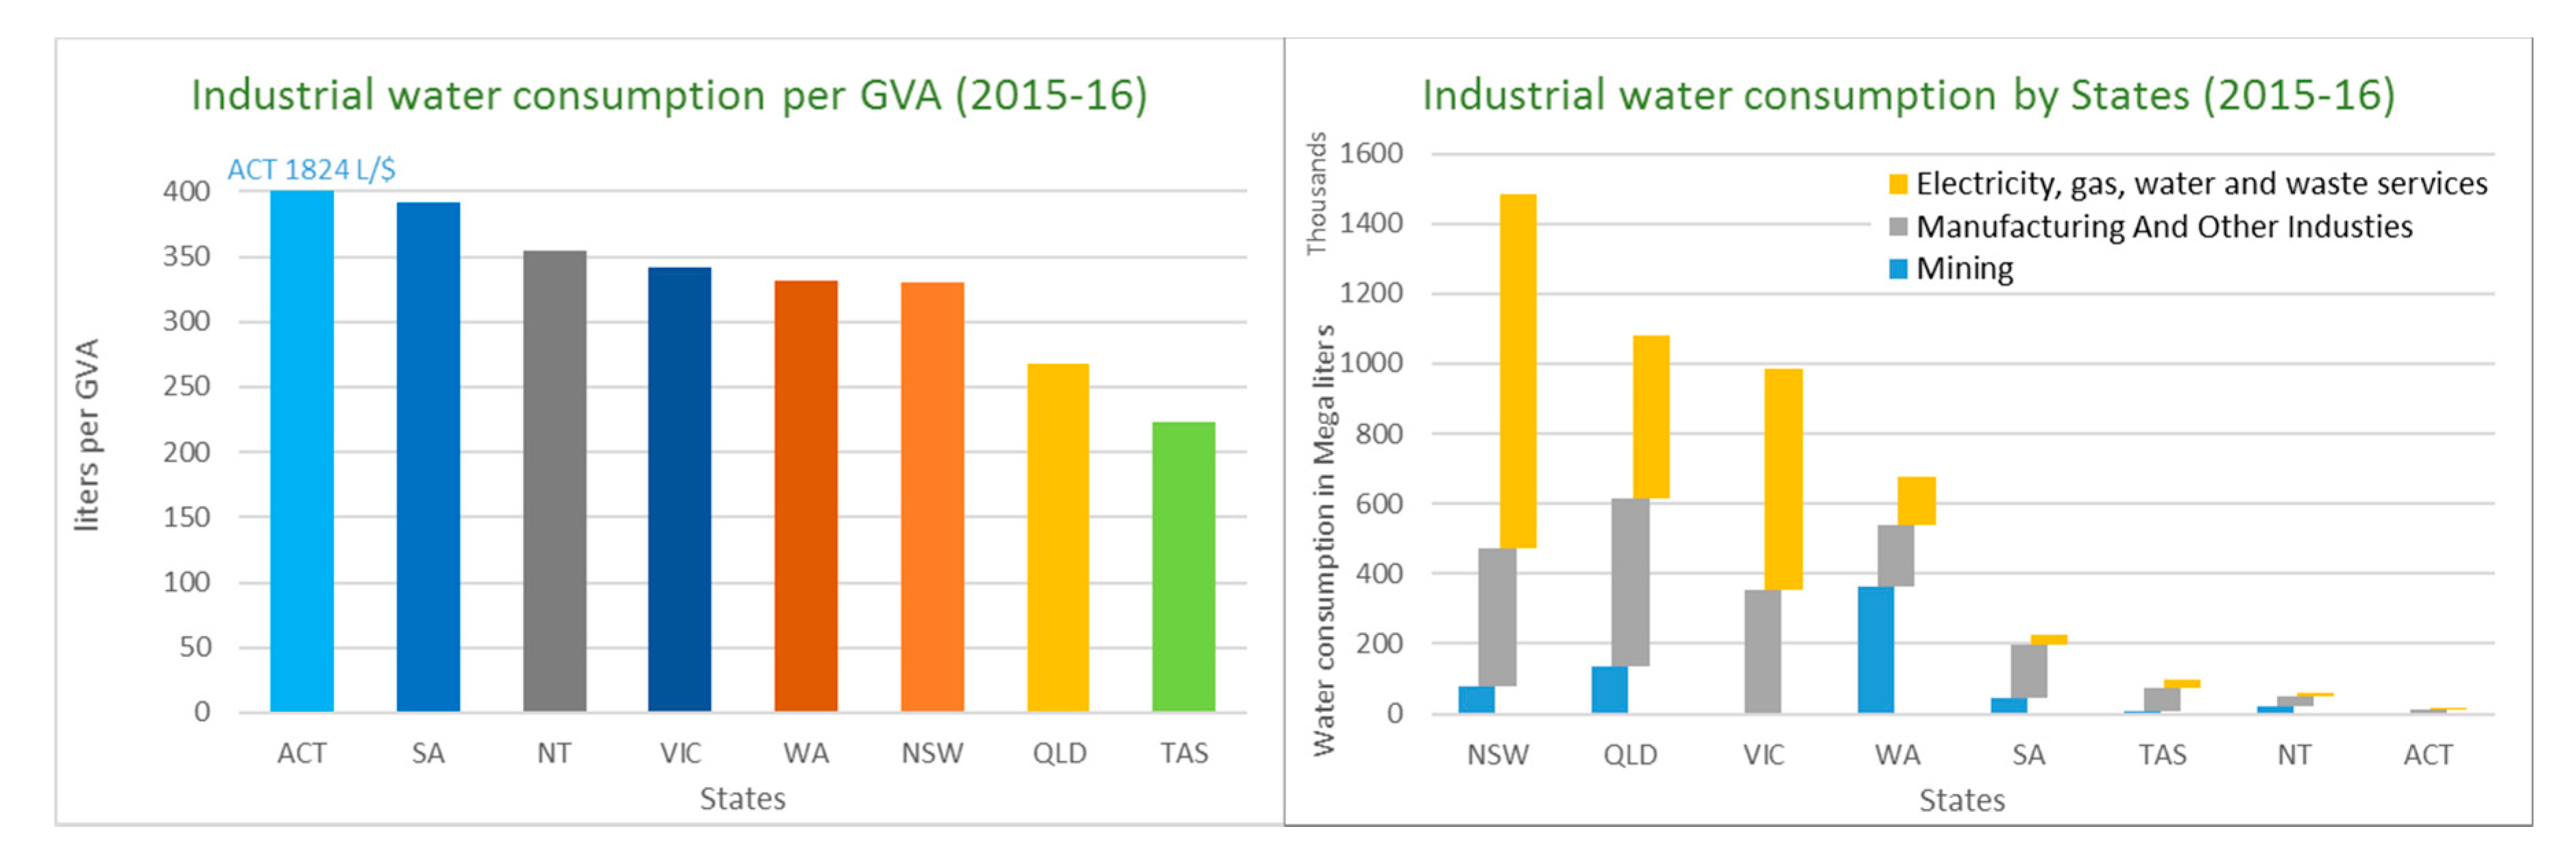
2.2. Industrial Water Consumption Accounting

The industrial water consumption accounting was calculated using a combination of the National Water Account and GVA (Gross Value Added) data taken from the Australian Bureau of Statistics [21,28,34,39]. Green and grey water footprints for industrial sector were assumed to be the same [40] and, for the scope of this research, detailed insight of these two was not required. Therefore, blue water consumption was the only value used for the state-wise comparison. Additionally, the population data found for the domestic sector was used in addition to energy production statistics from the Department of Environment and Energy [41]. Data was collected for mining, manufacturing, and utilities industries.
The literature provides details of each industry type (mining, manufacturing, and utilities), however, due to differences in currencies and circumstances, a comparison with global average was not considered to be a useful indicator. Therefore, an interstate comparison was carried out for better understanding of practices within Australia. NSW is the largest consumer in industrial water consumption followed by QLD and then VIC (refer Figure 4). These values represent the extent of industrial activities in each state. When the value added per unit of water used in each state is compared, the results are altogether different. Standardized results are obtained for all of the states except ACT, which had the largest footprints in the industrial sector. Having a relatively small area and being a predominantly government service area, it does not contribute significantly to the economy. From the available data, Tasmania appears to be ahead of the competition but this may be simply due to the type of mineral being extracted. For the industrial sector, it is hard to pinpoint where water efficiency could be increased as limited data is available due to private rights of industries regarding water usage.

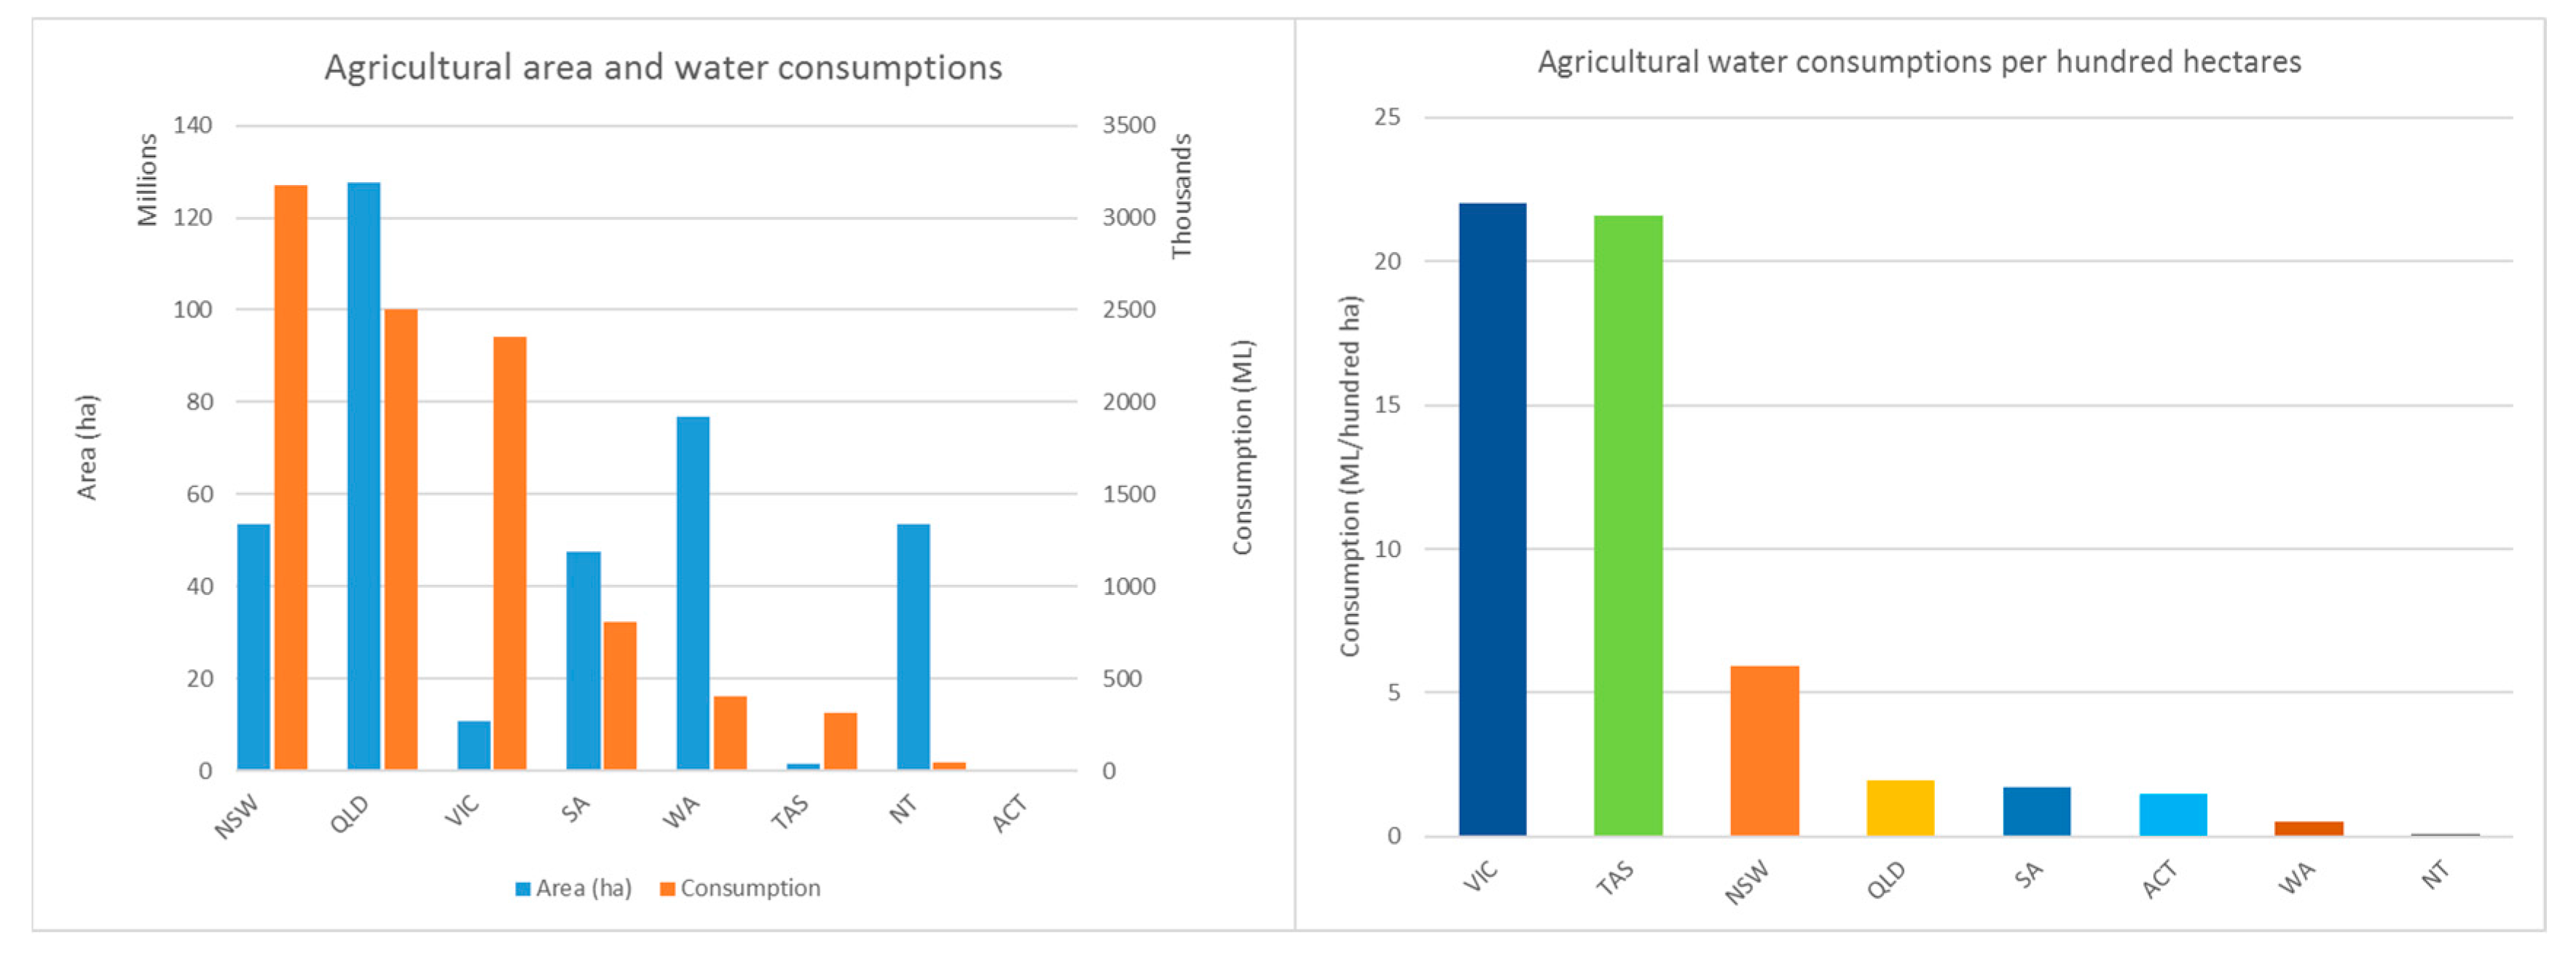
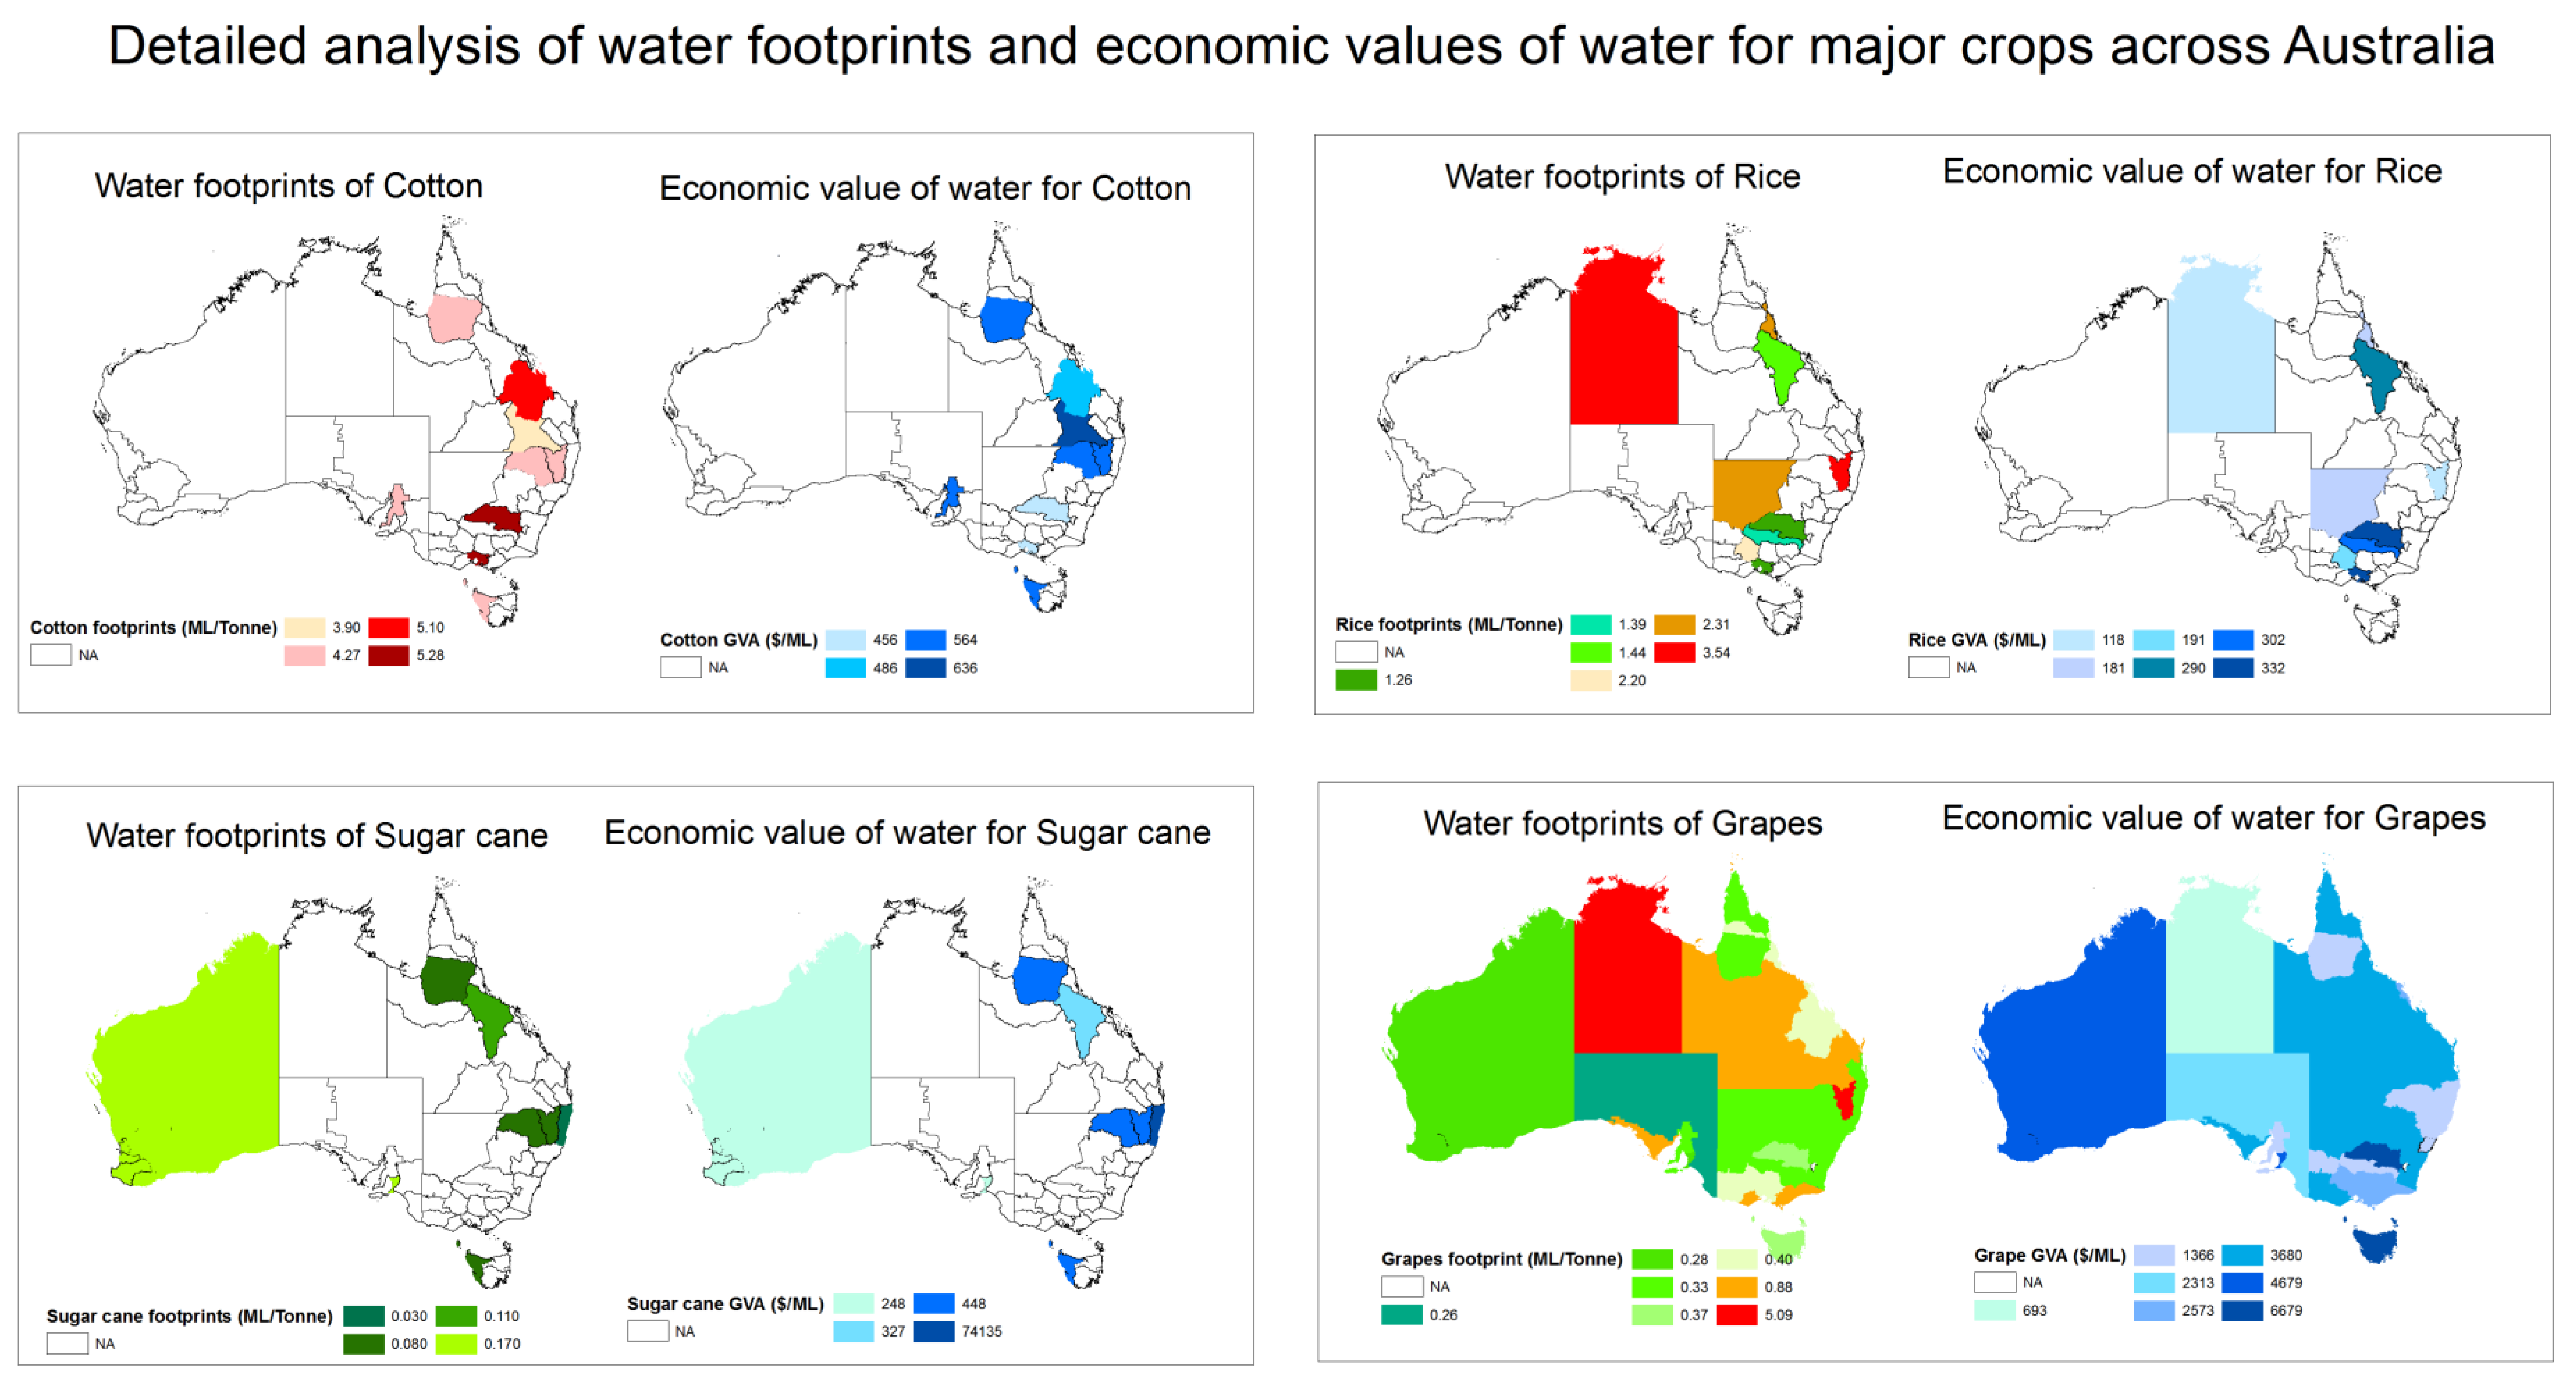
2.3. Agricultural Footprints

Because many crops are grown in particular areas only, there was not extensive data within the National Water Account database for comparison purposes. In this study, the data was collected from the Water Use on Australian Farms and Agricultural Commodities Australia data by the ABS [31,32,34,42,43,44]. Where there was insufficient data to compare the states, the two largest Natural Resource Management (NRM) regions within the states were chosen for comparison. Based on the large water footprints involved and the scale of production, four agricultural commodities were selected and their water footprints are compared across the NRM regions:
  • • Cotton
  • • Rice
  • • Sugar cane
  • • Grapevines
The agricultural footprint includes two distinct components: direct virtual water and water for energy (indirect) [45]. For the sake of simplicity in this study, only direct virtual water component was calculated. It is also worth noting that the green water footprint is only pertinent to the agricultural sector; typically, for the growing of a crop or tree the total water footprint is equivalent to:
WF proc =   WF proc . green + WF proc , blue +   WF proc , grey
As mentioned previously, information regarding the blue water (WFproc, Blue) footprint in a process was gathered from the ABS, and the grey water (WFproc, grey) footprint in a process was considered redundant for the sake of comparison across the states. Thus, only the green water footprint (WFproc, green) in a process was required to be calculated. For this purpose, a combination of rainfall data by state from the Bureau of Meteorology (BOM) and the Blaney–Criddle equation for a simple calculation of evapotranspiration yielded the green value:
E T o = p × ( 0.457 T m e a n + 8.128 )
where ETo is the reference evapotranspiration (mm day−1) (monthly), Tmean is the mean daily temperature (°C) given as Tmean = (Tmax + Tmin)/2, and p is the mean daily percentage of annual daytime hours. This approximate method is stated as Equation (3):
WF proc , green = ( Mean   Areal   Rainfall   ( State ) Evapotranspiration ) × Crop   Area ×   Growing   Period Crop   Yield

2.4. Detailed Investigation of Agricultural Practices

The main part of the water usage in the agricultural industry is used for irrigation purposes, representing more than 85% of the total water consumption in the agricultural sector. The remaining 15% is used for other agricultural purposes such as drinking water and cleaning. According to the Australian Bureau of Statistics, NSW was ranked as the state with the largest agricultural water consumption, being just higher than QLD and VIC for the period 2014–2016 (refer to Figure 5). The percentage of land use for agriculture is 58% in Australia. The agricultural activities are driven by the climate, economy, water availability, and soil conditions. The low consumption rate of NT is mainly because 99.5% of the agricultural area is grazing native vegetation [46]. The state experiences a high fluctuation in rainfall, because of which the limited crop production activities use groundwater (82%) [47]. As such, although it may appear that TAS and VIC use more water, they may achieve better yields from the area farmed. This highlights the need to compare each crop individually in addition to comparing the yield for the relevant crop.
As mentioned earlier, cotton, rice, sugar cane, and grapevines were selected and their water footprints were compared across the states. It must be noted that the comparison of these commodities is based on water consumption per mass and the value added of water per mass of the commodity.

2.4.1. Comparison of Cotton

Murrumbidgee regions (NSW) and Fitzroy regions (QLD) both consume the most water per tonne of cotton produced, 5.28 ML/tonne and 5.10 ML/tonne and economic value 456 $/ML and 486 $/ML, respectively. These are also above the global water footprint average for the green/blue water footprint of cotton at 3.6 ML/tonne [48,49,50]. The other two regions, Border Rivers-Gwydir (NSW) and Border Rivers Maranoa-Balonne (QLD) are also above this average having 4.27 ML/tonne and 3.90 ML/tonne, respectively, and economic value of 564 $/ML and 636 $/ML, respectively. Border Rivers-Gwydir and Border Rivers Maranoa-Balonne are in close proximity geographically, whereas Murrumbidgee and Fitzroy are further south and north, respectively (refer to Figure 6). It must be noted that the water efficiency of cotton crops was much lower initially, and improved by approximately 40% from 2003 to 2013 nationwide [51].

2.4.2. Rice Comparison

In the case of rice production, NSW, VIC, and QLD all have a similar water footprint (1.32 ML/tonne (economic value 324 $/ML), 2.3 ML/tonne (economic value 181 $/ML), and 1.82 ML/tonne (economic value 275 $/ML), respectively. With the exception of NSW, the other states are above the global average water footprint of 1.5 ML/tonne as per the Crop Water Footprint Benchmark [48]. NT is a significant over user of water resources, with a water footprint of 3.54 ML/tonne, which is double the next most significant state’s water footprint value. The water footprint of the Northern Territory region (NT) (with economic value 127 $/ML) is 126% greater than the average of the other regions. It should also be noted that the other underperformer lies in the Wet Tropics region (QLD); the water footprint of this region lies above the global average and is a 38% above the average of the selected regions excluding the NT.

2.4.3. Sugar Cane Comparison

The calculated water footprints for the Border Rivers-Gwydir (NSW) (0.08 ML/tonne, 327 $/ML), Burdekin (QLD) (0.11 ML/tonne, 248 $/ML), and the Wet Tropics (QLD) (0.08 ML/tonne, 448 $/ML) lie under the global average of 0.197 ML/tonne. The Northern Rivers (NSW) has a significantly small footprint at 0.03 ML/tonne, however, this result appears unlikely and is due to an error in the data (as cautioned by the ABS). On the other hand, the Rangelands (WA) uses 0.17 ML/tonne with an economic value of 68 $/ML, and lies below the global average.

2.4.4. Grape Comparison

A solid average across all the states is observed except the significant outlier of NT (5.1 ML/tonne) which, compared to the remaining states’ average (0.42 ML/tonne) is 1214% higher. This average is significantly below the global water footprint at 0.61 ML/tonne. QLD is the next highest value, indicating that there is a correlation between the water footprint and mean temperature for grape production. The substantial water footprint difference is due to the nature of grape production in each of the states; wine production generally has a greater economic value of the water used. NT for example uses 0%, 693 $/ML, TAS uses 100%, 6680 $/ML, and VIC uses 72% 3140 $/ML of their grapes for wine production.
The water consumption figures used for calculation purposes are conservative because water theft is not accounted for in the calculations [52,53,54].

2.5. Irrigation Practices

Because the water footprints of majority of crops were found to be above the global average, it was felt necessary to investigate the irrigation practices in Australia to examine the role of irrigation in higher water footprints. Large-scale irrigation started in Australia in the 1800s. The irrigated area grew steadily during 1920–1960, then increased rapidly number until 1990. The irrigated area decreased from 1996 until 2012 due to drought conditions. The most common method of irrigation is surface irrigation followed by sprinkle irrigation using large mobile machines. The use of drip irrigation has increased in recent years, and overall drip irrigation is the least preferred method. The use of sprinkler irrigation remained similar from 2003 to 2009 [55]. It was found that Australia continues to predominantly use traditional inefficient methods of irrigation.

3. Analysis of Virtual Water Trade

The third area of investigation was the analysis of virtual water trade, because imports and exports can influence the overall water security of a region [48]. The literature was consulted to develop an effective approach to identify the main crops/trade goods contributing to the export of virtual water. Water Embodied in Bilateral Trade (WEBT) and Multi-Regional Input–Output Analysis (MRIO) were used to calculate the embodied water because these methods are traditionally used for energy and carbon footprints as two input–output top-down approaches [56,57,58,59]. The bottom-up approaches do not consider the entire industrial supply chain, therefore the results are highly impacted by the recorded data set and the total water footprint can vary by as much as 48% [60,61]. The main exports involving major water content are agricultural products. A basic assessment of virtual water content was performed to estimate the virtual water export. The trade data of the top ten imports and exports were collected from the FAOSTAT website for the year 2014 (latest available data). The mainstream agricultural products were identified, and the calculation of water trade was performed accordingly (refer Equation (4)). The proportions of green, blue, and grey water in each export commodity were calculated.
V o l u m e   ×   V i r t u a l   w a t e r   c o n t e n t   =   V o l u m e   o f   V i r t u a l   W a t e r
Australia’s total export of green virtual water was 26.5 km3, of blue virtual water was 6.4 km3, and of grey virtual water was 3.6 km3, thus totaling 36.5 km3. By comparison, the import of green virtual water was 1.6 km3, of blue virtual water was 0.184 km3, and of grey virtual water was 0.078 km3, for a total water footprint of 1.8 km3. Thus, in 2014 Australia indirectly exported 35 km3 of water, which represents a significant indirect loss of freshwater. The total export value data was obtained from the FAO website [62]. For the calculation of usable water value, green water was not counted because green water must be consumed at the location at which the precipitation occurs (refer Equation (5)). Therefore, the usable water value comprised only blue and grey waters [11,59]:
U s a b l e   W a t e r   V a l u e = T o t a l   E x p o r t   V a l u e ( T o t a l   B l u e   W a t e r   E x p o r t + T o t a l   G r e y   W a t e r   E x p o r t )
According to the Australian Department of Foreign Affairs and Trade, Australia’s exports of services and goods totaled $330.3 billion. Iron ore is Australia’s largest export commodity [63,64,65,66]. Because of Australia’s natural resources, coal and natural gas are also significant export resources. About 65% of all agricultural products produced in Australia are exported for a relatively lower economic benefit. Some of the exported products are the most water-intensive crops produced, such as cotton (98% exported on a three-year average). Despite covering 58% of Australian land and accounting for 59% of water consumption, none of the agricultural products are among Australia’s top five exports. Furthermore, agricultural products contribute only 2.7% of GDP and account for 2.5% of employment [67,68]. Australia has GDP of $1.561 trillion and per capita GDP of $68,973, and was ranked fifth in the world in 2014 in the latter measure according to data released by the Australia Bureau of Statistics and Department of Foreign Affairs, Trade, and Industry [65,69,70]. Analysis indicated sheep meat is the most efficient water value agricultural product (14.90 $/ML) as it requires minimal or no blue water usage. The second highest value added agricultural product was found to be wine grapes (5.72 $/ML). The lowest usable water values were obtained for cotton lint (0.48 $/ML), rice (0.53 $/ML), and raw sugar centrifugal (0.69 $/ML), due to the obvious reason of the high consumption of blue water and low export value. The analysis clearly indicates a need to consider the usable water value at the strategic level. Alternative crops, high efficiency crops, crops suiting specific climatic zones, and reduction of the cultivation of low usable water value crops can be considered after detailed analysis.

4. Conclusions and Recommendations

Australian water footprints for each sector (domestic, agricultural, and industrial) are much higher than the average global footprints. Domestic water consumption is higher for bathroom, laundry, and outdoor usage. The outlier is outdoor gardening usage, which is exceptionally higher than the global average. Usage of the states of NT and WA is exceptionally high, at 1000% and 570% of the global average, respectively. To reduce domestic water consumption, it is recommended that these states should reduce gardening water consumption by introducing legislation (water restrictions) to limit its use, educating the populace about water tolerant garden varieties, using recycled water for outdoor usage, and incentivizing the installation of rainwater tanks (which could be used for gardening to reduce the pressure on the freshwater supply). If these states reduced their water usage to the average level of the remaining states, a total of 161,279 ML could be saved annually. Furthermore, it is recommended that more precise data for each domestic component should be compiled to identify the usage subtype where the significant wastage is occurring. Ultimately water mismanagement in the domestic sector not only risks urban water security but retroactively results in financial losses.
The importance of industrial use, which consumes 29% of freshwater resources, cannot be ignored. To identify the scope for improvements in the water efficiency of industries, specific targeting of an industrial process should be investigated. However, this is not possible under the present conditions of private agreements between the government and industries (particularly mining). Therefore, for future studies of the water footprints of mining it would be beneficial if details of water usage, in addition to data on the mass of mineral being extracted per state, is made available. This would allow investigation of which mining practices are operating more efficiently. However, it can be concluded that, among the industry sector, utilities (energy, water supply, and gas, etc.) are the main water consumers, followed by manufacturing. Considering the volatile conditions of freshwater availability in Australia, the government may motivate the industry to carry out water footprint studies for various industries and support those that use water more efficiently by offering effective incentives.
For the agricultural sector, the water footprint and water economic efficiencies can help identify suitable regions for different crops. Australia can undoubtedly increase its agricultural production and water efficiencies if modern irrigation methods are used. However, the selection of the most suitable crops in different regions plays a key role in determining the extent of the water footprint. To account for the economic perspective, economic efficiency was calculated in addition to the water footprints of the agriculture sector. Australia’s current approach of crop selection for different regions can be improved if water footprints are considered at the planning stage. Crop cultivation planning must be performed at a central level by considering the availability of green water in different NRM regions, production capabilities of different regions for different crops, local demands, export priorities, climatic impacts, and future perspectives. Because the green water component cannot be allocated to another region without being embedded in a product, agricultural products should absorb all available green water in the region with minimum or no blue water supplement. However, this is not always possible, and it is essential to ensure that only appropriate crop types are planted in different regions to maximize green water utilization. The consumption by agricultural products of less than the available green water will cause resource wastage (if the excess water is not converted into blue water); however, if the product requires more than the available green water then blue water needs to be consumed, which is more valuable due to its capability to be reallocated to other regions. Supplementation of blue water should be to an option to maximize the possible value added of agricultural products. This can be achieved by water pricing and raising the water footprint awareness among the stakeholders, particularly farmers and national planning authorities.
With the exception of grapes, crops are not cultivated in all regions due to various reasons in addition to their suitability to the climate and geography of the area. It can be concluded that the climate is an important factor, however, the type of grape plays an important role in determining the water footprints. Wine production grapes yield a higher economic value of water. Wine producing grapes can be experimented with in NT because this is the only region which does not produce grapes for wine production and has a water footprint that is 12 times higher than the average of the rest of Australia. It is also important to note that the lowest economic value of water (which is in NT, at 693 $/ML) is even higher than the maximum value of water in any other crop and any other region. A further exploration of crop practices will not only identify more efficient water usage possibilities but will provide an opportunity to shift towards more efficient crops in terms of water footprints.
Water usage above the median water consumption rate can be used as an indicator to identify inefficient agricultural practices. Threshold or acceptable water footprint limits for different types of crops must be established by the government to ensure the efficient use of this valuable resource. To achieve further increases in the efficiency of the economic value of water, the concept of an open water market regulated under a focused government strategy can be trialed.
Managing the virtual water trade ensures that trade patterns does not endanger the water balance of the country. The current virtual trade of water is concerning due to the export of higher volumes of water used to generate lower economic values, which is neither economically feasible nor sustainable in the longer term. Although the water security of Australia is extremely volatile and vulnerable to seasonal and annual fluctuations of freshwater availability, the imbalance of virtual water trade requires immediate attention. In the case of another severe drought, such as the previous Millennium drought, the country will not only suffer a water shortage but also face a sharp decline in revenue generation resulting from the negative economic impacts of the hazard. Further detailed analyses are required to reduce the export of a substantial quantity of virtual water considering local demands, export requirements, and production capabilities of Australian resources. A focused vulnerability analysis of the Australian economy, its goods and services trade, and virtual water trade is recommended to comprehend and envisage the impacts of any future drought in Australia.
The current study explored water consumption and efficiencies in three major sectors of water consumption. Further detailed analysis of the major industrial production sectors is already underway. The first-tier industries include the construction, power generation (particularly the renewable sector), and the food processing industries to supplement the missing portion of the agricultural sector. Further investigation of the virtual water trade is being conducted to calculate the internal and external water footprint at a more precise level. This research ultimately aim to develop a comprehensive framework of water usage efficiencies for a country, and Australia in particular.

Author Contributions

Conceptualization, M.A.U.R.T., R.R.D. and N.M. Data curation, R.R.D.; Formal analysis, M.A.U.R.T., R.R.D. and M.L.U.R.S.; Investigation, M.A.U.R.T., R.R.D. and N.M.; Methodology, M.A.U.R.T., R.R.D. and Z.R.; Project administration, M.A.U.R.T. and N.M.; Software, M.A.U.R.T. and Z.R.; Supervision, M.A.U.R.T. and N.M.; Visualization, M.A.U.R.T., Z.R. and M.L.U.R.S.; Writing—original draft, M.A.U.R.T. and R.R.D.; Writing—review & editing, M.A.U.R.T., Z.R., M.L.U.R.S. and N.M. All authors have read and agreed to the published version of the manuscript.

Funding

This research received no external funding.

Conflicts of Interest

The authors declare no conflict of interest.

References

  1. Worldometers, Global Water Use. 2019. Available online: https://www.waterscarcitysolutions.org/ (accessed on 11 December 2019).
  2. World Water Assessment Programme. Managing Water Under Uncertainty and Risk; United Nations Educational Scientific and Cultural Organization: Paris, France, 2012. [Google Scholar]
  3. Mekonnen, M.M.; Hoekstra, A.Y. Sustainability: Four billion people facing severe water scarcity. Sci. Adv. 2016, 2, e1500323. [Google Scholar] [CrossRef] [PubMed] [Green Version]
  4. Bureau of Meteorology, Recent Rainfall, Drought and Southern Australia’s long-Term Rainfall Decline, 2015. Available online: http://www.bom.gov.au/climate/updates/articles/a010-southern-rainfall-decline.shtml#toc1 (accessed on 5 October 2018).
  5. Bureau of Meteorology, Indian Ocean influences on Australian Climate, 2018. Available online: http://www.bom.gov.au/climate/iod/ (accessed on 11 October 2018).
  6. FAO. The State of the World’s Land and Water Resources for Food and Agriculture (SOLAW)–Managing Systems at Risk; The Food and Agriculture Organization of the United Nations and Earthscan: New York, NY, USA.
  7. FAO AQUASTAT Global Information System of Water and Agriculture: Rome, Italy, 2012. Available online: http://www.fao.org/aquastat/en/ (accessed on 2 September 2020).
  8. Hoekstra, A.C.A. Water footprints of nations: Water use by people as a function of their consumption pattern. Water Resour. Manag. 2007, 21, 35–48. [Google Scholar] [CrossRef]
  9. Department for Environment and Water, Efficiency Measure projects in South Australia, Government of South Australia for Environment and Water. 2017. Available online: https://www.environment.sa.gov.au/topics/river-murray/basin-plan/efficiency-measure-projects (accessed on 1 December 2019).
  10. Water services Association of Australia (WSAA). Water Efficient Australia, Smart Approved WaterMark; Water Services Association of Australia (WSAA): Canberra, Australia, 2019; Available online: https://www.wsaa.asn.au/publication/water-efficient-australia (accessed on 10 December 2019).
  11. Water Foot Print Network, Global Water Footprint Standard, 2011. Available online: https://waterfootprint.org/en/water-footprint/global-water-footprint-standard/ (accessed on 17 December 2019).
  12. Hoekstra, A.Y.; Chapagain, A.K. The water footprints of Morocco and the Netherlands: Global water use as a result of domestic consumption of agricultural commodities. Ecol. Econ. 2007, 64, 143–155. [Google Scholar] [CrossRef]
  13. Yu, Y.; Hubacek, K.; Feng, K.; Guan, D. Assessing regional and global water footprints for the UK. Ecol. Econ. 2010, 69, 1140–1147. [Google Scholar] [CrossRef]
  14. Feng, K.; Hubacek, K.; Minx, J.; Siu, Y.L.; Chapagain, A.; Yu, Y.; Guan, J. Barrett, Spatially Explicit Analysis of Water Footprints in the UK. Water 2010, 3, 47–63. [Google Scholar] [CrossRef] [Green Version]
  15. Cai, B.; Liu, B.; Zhang, B. Evolution of Chinese urban household’s water footprint. J. Clean. Prod. 2019, 208, 1–10. [Google Scholar] [CrossRef]
  16. Liu, X.; Shi, L.; Engel, B.A.; Sun, S.; Zhao, X.; Wu, P.; Wang, Y. New challenges of food security in Northwest China: Water footprint and virtual water perspective. J. Clean. Prod. 2020, 245, 245–118939. [Google Scholar] [CrossRef]
  17. Zhang, S.; Taiebat, M.; Liu, Y.; Qu, S.; Liang, S.; Xu, M. Regional water footprints and interregional virtual water transfers in China. J. Clean. Prod. 2019, 228, 1401–1412. [Google Scholar] [CrossRef]
  18. Zhai, Y.; Shen, X.; Quan, T.; Ma, X.; Zhang, R.; Ji, C.; Zhang, T.; Hong, J. Impact-oriented water footprint assessment of wheat production in China. Sci. Total Environ. 2019, 689, 90–98. [Google Scholar] [CrossRef] [PubMed]
  19. Xie, X.; Jiang, X.; Zhang, T.; Huang, Z. Study on impact of electricity production on regional water resource in China by water footprint. Renew. Energy 2020, 152, 165–178. [Google Scholar] [CrossRef]
  20. Mekonnen, M.M.; Hoekstra, A.Y. National Water Footprint Accounts: The Green, Blue and Grey Water Footprint of Production and Consumption; UNESCO-IHE: Delft, The Netherlands, 2011. [Google Scholar]
  21. The Wold Bank, Industry (including Construction), Value Added (Constant 2010 US$), 2018. Available online: https://data.worldbank.org/indicator/NV.IND.TOTL.KD?view=chart (accessed on 18 September 2018).
  22. Prosser, I. Current Water Availability and Use; Csiro: Melbourne, Australia, 2011. [Google Scholar]
  23. BOM, Water in Australia -Australian Government—Bureau of Meteorology, BOM, 2018–2019. Available online: http://www.bom.gov.au/water/waterinaustralia/ (accessed on 25 December 2019).
  24. Index Mundi, Australia—Renewable Internal Freshwater Resources per Capita (cubic meters), 2015. Available online: https://www.indexmundi.com/facts/australia/indicator/ER.H2O.INTR.PC (accessed on 15 December 2019).
  25. Hugo, G. Changing Patterns of Population distribution in Australia. J. Popul. Res. Spec. Ed. 2002. Available online: https://search.informit.com.au/documentSummary;dn=395273573294486;res=IELAPA (accessed on 2 September 2020).
  26. The Role of Water in Australia’s Uncertain Future. The Conversation 2015. Available online: https://theconversation.com/the-role-of-water-in-australias-uncertain-future-45366 (accessed on 24 June 2019).
  27. Australian Food History Timeline, 2001—2008 Millennium Drought, 2011. Available online: https://australianfoodtimeline.com.au/millennium-drought/ (accessed on 1 December 2019).
  28. The World Bank, Agriculture, Forestry, and Fishing, Value Added (Current US$), 2018. Available online: https://data.worldbank.org/indicator/NV.AGR.TOTL.CD?end=2017&start=2017&view=bar (accessed on 14 September 2018).
  29. UNSW-Sydney Connected Waters Initiative, Connected Waters, 10 September 2007. Available online: http://www.connectedwaters.unsw.edu.au/articles/2007/09/national-water-footprints (accessed on 28 November 2019).
  30. Fader, M.; Gerten, D.; Thammer, M.; Heinke, J.; Lotze-Campen, H.; Lucht, W.; Cramer, W. Internal and external green-blue agricultural water footprints of nations, and related water and land savings through trade. Hydrol. Earth Syst. Sci. Discuss. 2011, 8, 483–527. [Google Scholar] [CrossRef]
  31. Australian Bureau of Statistics, Australian Demographic Statistics, Jun 2016, 2017. Available online: http://www.abs.gov.au/AUSSTATS/[email protected]/Lookup/3101.0Main+Features1Jun%202016?OpenDocument (accessed on 1 September 2018).
  32. Australian Bureau of Statistics, Water Account, Australia, 2015–16, 2017. Available online: http://www.abs.gov.au/AUSSTATS/[email protected]/allprimarymainfeatures/49F854E3831E4294CA2580580015E2A6?opendocument (accessed on 30 August 2018).
  33. Hoekstra, A.Y.; Chapagain, A.K.; Aldaya, M.M.; Mekonnen, M.M. The Water Footprint Assessment Manual: Setting the Global Standard; Earthscan: London, UK, 2011. [Google Scholar]
  34. Australian Bureau of Statistics, Australian National Accounts: State Accounts, 2015–16, 2017. Available online: http://www.abs.gov.au/AUSSTATS/[email protected]/allprimarymainfeatures/8DEE81B03A2C2842CA2581DA000F4790?opendocument (accessed on 5 September 2018).
  35. Power and Water Corporation, the Darwin Water Story, 2013. Available online: https://www.powerwater.com.au/__data/assets/pdf_file/0011/1523/Darwin_Water_Story_2013.PDF (accessed on 23 September 2019).
  36. Redhead, M. Melbourne Residential Water End Uses Winter 2010; summer 2012; Smart Water Fund: Melbourne, Australian, 2013. [Google Scholar]
  37. Griffith University, School of Engineering and Smart Water Research Centre, South East Queensland Residential End Use Study: Baseline Results—Winter 2010, Urban Water Security Research Alliance, City East, 2010. Available online: http://hdl.handle.net/10072/38126http://www.urbanwateralliance.org.au/publications/UWSRA-tr31.pdf (accessed on 25 September 2019).
  38. Rickwood, P.; Giurco, D.; Glazebrook, G.; Kazaglis, A.; Thomas, L.; Zeibots, M.; Boydell, S.; White, S. Integrating Population, Land Use, Transport, Water and Energy-Use Models to Improve the Sustainability of Urban Systems; University of Technology Sydney: Sydney, Australia, 2007. [Google Scholar]
  39. TeamPoly, Water Price in Australia, 2018. Available online: https://www.teampoly.com.au/2018/06/15/water-prices-in-australia/ (accessed on 2 December 2019).
  40. Averink, J. Global Water Footprint of Industrial Hemp Textile; University of Twente: Enschede, The Netherlands, 2015. [Google Scholar]
  41. Department of the Environment and Energy. Australian Energy Statistics: Table O; Department of the Environment and Energy: Canberra, Australia, 2018. [Google Scholar]
  42. ABARES, Agricultural Commodities, 2019. Available online: http://www.agriculture.gov.au/abares/research-topics/agricultural-commodities (accessed on 3 May 2019).
  43. ABARES, Food Consumption and Imports, 2018. Available online: https://public.tableau.com/profile/australian.bureau.of.agricultural.and.resource.economics.and.sci#!/vizhome/FooddemandinAustralia/Indicators-fig3 (accessed on 2 May 2019).
  44. PMSEIC Expert Working Group. Australia and Food Security in a Changing World; Australian Government: Canberra, Australia, 2010. [Google Scholar]
  45. Chini, M.; Konar, M.; Stillwell, A.S. Direct and indirect urban water footprints of the United States. Water Resour Res. 2016, 53, 1. [Google Scholar]
  46. Department of Agriculture Water and the Environment, about My Region-Northern Territory, Department of Agriculture Water and the Environment, 4 February 2020. Available online: https://www.agriculture.gov.au/abares/research-topics/aboutmyregion/nt (accessed on 19 December 2019).
  47. Australian Bureau of Statistics, Irrigation on Australian farms, 1301.0—Yearbook Chapter, 2008, 2008. Available online: https://www.abs.gov.au/AUSSTATS/[email protected]/Previousproducts/1301.0Feature%20Article16012008?opendocument&tabname=Summary&prodno=1301.0&issue=2008&num=&view= (accessed on 18 February 2020).
  48. Frontier Economics. The Concept of ‘Virtual Water’—A Critical Review; The Frontier Economics Network: Melbourne, Australia, 2008. [Google Scholar]
  49. Mekonnen, M.M.; Hoekstra, A.Y. Value of Water Research Report Series No. 47; UNESCO-IHE: Delft, The Netherlands, 2010. [Google Scholar]
  50. Mekonnen, M.M.; Hoekstra, A.Y. Value of Water Research Report Series No. 48; UNESCO-IHE: Delft, The Netherlands, 2010. [Google Scholar]
  51. Roth, G.; Harris, G.; Gillies, M.; Montgomery, J. Water-Use Efficiency and Productivity Trends in Australian Irrigated Cotton: A Review; Crop and Pasture Science: Collingwood, Australia, 2013; Volume 64, pp. 1033–1048. [Google Scholar]
  52. McNally, Alleged Barwon-Darling Water Thieves to be Prosecuted after ABC Investigation, 2018. Available online: https://www.abc.net.au/news/2018-03-08/nsw-water-theft-barwon-darling-government-prosecuting/9527364 (accessed on 16 May 2019).
  53. Ferguson, Cotton Grower Anthony Barlow Pleads Guilty to Illegal Pumping of Murray Darling Water, 2018. Available online: https://www.abc.net.au/news/2018-11-26/cotton-grower-pleads-guilty-to-mdb-illegal-pumping/10553990 (accessed on 12 May 2019).
  54. WaterSource, NSW Ombudsman Makes a Move on Murray-Darling Basin Water Thieves, 2018. Available online: https://watersource.awa.asn.au/environment/natural-environment/nsw-ombudsman-makes-a-move-on-murray-darling-basin-water-thieves/ (accessed on 6 May 2019).
  55. Irrigation Australia, 2019. Available online: https://www.irrigationaustralia.com.au/about-us/types-of-irrigation/types-of-irrigation (accessed on 10 May 2019).
  56. Suh, S.; Lenzen, M.; Treloar, G.J.; Hondo, H.; Horvath, A.; Huppes, G.; Jolliet, O.; Klann, U.; Krewitt, W.; Moriguchi, Y.; et al. System Boundary Selection in Life-cycle Inventories Using Hybrid Approaches; Environmental Science & Technology: Bethesda, MD, USA, 2004; pp. 657–664. [Google Scholar]
  57. Weber, L.; Matthews, H.S. Quantifying the Global and Distributional Aspects of American Household Carbon Footprint. Ecol. Econ. 2008, 66, 379–391. [Google Scholar] [CrossRef]
  58. WFN, Water Footprint: Introduction, 2008. Available online: https://www.waterfootprint.org/en/ (accessed on 21 February 2020).
  59. Water Footprint Network, Aims & History, 2018. Available online: http://waterfootprint.org/en/about-us/aims-history/ (accessed on 15 August 2018).
  60. Feng, K.; Chapagain, A.; Suh, S.; Pfister, S.; Hubacek, K. A Comparison of Bottom-Up and Top-Down Approaches to Calculating the Water Footprints of Nations; Routledge-Taylor and Francis Group: London, UK, 2011; Volume 23, pp. 371–385. [Google Scholar]
  61. Minx, J.C.; Weber, C.L.; Edenhofer, O. Growth in Emission Transfers International Trade from 1990 to 2008; National Center for Biotechnology Information: Bethesda, MD, USA, 2011; Volume 108, p. 21. [Google Scholar]
  62. FAO. FAOSTAT, 05 May 2019. Available online: http://www.fao.org/faostat/en/#data/TP (accessed on 5 May 2019).
  63. DFAT Australia’s Trade Statistic at a Glance, 2018. Available online: https://dfat.gov.au/trade/resources/trade-at-a-glance/Pages/top-goods-services.aspx (accessed on 3 December 2019).
  64. Anderson, Fifty Years of Australia’s Trade, 12 2014. Available online: https://dfat.gov.au/about-us/publications/Documents/fifty-years-of-Australias-trade.pdf (accessed on 23 March 2019).
  65. Ministry of Commerce Country, Ministry of Commerce Country Report Trade Data and Australian Office of Commerce, 2017. Available online: http://www.mofcom.gov.cn/article/tongjiziliao/fuwzn/ckt (accessed on 4 May 2019).
  66. Ministry of Commerce Country Report Trade Data and Australian Office of Commerce, Overview of Australian Trade in Goods and Bilateral Trade between China and Australia. 2017. Available online: http://www.mofcom.gov.cn/article/tongjiziliao/fuwzn/ckt (accessed on 4 May 2019).
  67. Jackson, T.Z.K. Snapshot of Australian Agriculture; ACT 2601; Australian Bureau of Agricultural and Resource Economics and Sciences: Canberra, Australia, 2018. [Google Scholar]
  68. Reserve Bank of Australia, Chart Pack, Regions and Industry, 2019. Available online: https://www.rba.gov.au/chart-pack/regions-industry.html (accessed on 4 May 2019).
  69. Sherald, M. Australian’s the World’s Wealthiest, 2011. Available online: https://www.smh.com.au/lifestyle/australians-the-worlds-wealthiest-20111101-1mt2r.html (accessed on 13 March 2019).
  70. Australia Bureau of Statistics. Balance of Payments and International Investment Position; Australian Bureau of Statistics: Belconnen, Australia, 2014. [Google Scholar]
Figure 1. Water consumption share in major sectors 2015–2016 (Data source: Australian Bureau of Statistics, 2017).
Applsci 10 06156 g001
Figure 2. Flowchart of the methodology.
Applsci 10 06156 g002
Figure 3. Domestic water consumption by each state; total consumption on right (in frame graph) and consumption patterns in each state on right side (2015–2016) (Data sources: [31,32,34,35,36,37,38]).
Applsci 10 06156 g003
Figure 4. Industrial water consumption (ML) per industry and per Gross Value Added (GVA) excluding agriculture (thousand $) by each state (2015–2016) on left and total consumption by each sector on right (Data source: Australian Bureau of Statistics, 2017).
Applsci 10 06156 g004
Figure 5. Land use and water consumption for agricultural production.
Applsci 10 06156 g005
Figure 6. Detailed analysis of water footprints (red shades are above the global average and green are below the global average) and economic value of water for major crops in Australia.
Applsci 10 06156 g006

