1. Introduction
1.1. Importance of Tall Buildings and Their Various Dimensions
Tall buildings have always been one of the most critical elements of a city’s visual appearance and research on the visual impact of tall buildings is underdeveloped.
Tall buildings need more attention due to the growing number of tall buildings all over the world and their high impact on the city—e.g., “they cannot be ignored” [
1].
Short [
2] believes that the impact of tall buildings on the city can be studied based on eight categories including context, the effect on the historic environment, the effect on the local environment, the relationship to transport, permeability, architectural quality, contributions, and sustainability. To study the tall buildings’ roles in the cities, Al-Kodmany and Ali [
3] consider tall buildings’ relationships to the city in various dimensions including infrastructure, city skyline, place making, architectural and engineering quality, and iconic role. Another study evaluates the triple effects of tall buildings, and their impact on the city based on aesthetic, semantic, and visual criteria, and presented a framework to measure their impact.
1.2. Definition of Tall Buildings
There are different words for defining tall buildings worldwide, including high-rise, skyscraper, tower, and super tall buildings. Tall buildings’ categories can be different around the world; for example, one city can consider more than 12 stories as tall buildings, but another city does not categorize 30–40 stories as tall buildings.
Tall buildings’ definitions can differ due to the time and place conditions of this type. Different cities of the world have specific descriptions of tall buildings in different periods concerning urban criteria, fire stations, structure, and installation.
Al-Kodmany and Ali [
2] classified these buildings as tall buildings: high-rise buildings, ultra-high-rise buildings, towers, and skyscrapers. Other definitions are based on the countries’ internal regulations. For example, in Germany, some of the high-rise construction criteria are determined by the country’s firefighting system’s available equipment. Howeler (2003) categorized skyscrapers based on appearance into media-oriented, environmental, kinetic, etc. These buildings are defined according to each country and city’s local regulations [
4].
However, it seems to be an unsaid contract that tall buildings are taller than their context in their location in the world [
5]. Therefore, the definition of tall buildings in this study is 20-story buildings that are considered taller than the context in Hamedan.
1.3. Tall Buildings and Visibility
Al-Kodmany and Ali [
2] believe that “the visual impact of tall buildings on urban form extends far beyond their footprints”. In architecture and urban studies, visibility is a criterion that deals with whether a building or an urban structure is visible from urban public spaces, to analyze its impact on the viewers [
6]. This analysis calculates the visual impact of structures and buildings with the aim of controlling their impacts on the city.
London is one of the cities that has specific regulations on controlling the impact of tall buildings on urban views. The London View Management Framework (LVMF) includes strict regulations that control the possible effects of proposals for new buildings on the skyline and views in London. It proposes four kinds of views, including London Panoramas, Linear Views, River Prospect, and Townscape Views. Proposals for new buildings are assessed for their impact on the protected views within the foreground, middle ground, or background of those views [
7].
Tall buildings and city skylines are essential components of these views, and in most cases, tall buildings are the most prominent parts of the city skyline [
8]. Rod and Van der Meer [
9] evaluated the dominance of tall buildings in new developments. They considered how much a tall building could influence visibility, using both traditional and modern methods. They believe visibility and dominance are fundamental options for locating tall buildings in cities. The question that “a building how much and how long would be visible for citizens” will be examined in analyzing visibility and dominance.
Zarghami et al [
10] developed a method to study the impact of the form and the physical features of tall buildings on citizens based on Height, width, and height-to-width ratio. Karimimoahaver [
11] provided and evaluated different methods of describing a building’s visual impact on the city. Karimimoshaver et al. [
12] examined the relationship between tall buildings’ locations and the urban landscape. They evaluated the effectiveness of single and cluster tall buildings based on functional, identity, and aesthetic purposes.
Traditional visibility considers if urban elements are visible or non-visible; however, Fisher [
13] does not agree with this definition. She believes, instead, that visibility is how much of a tall building is visible, and considers that as a measure using fuzzy logic [
13]. In another study, Oh [
14] examines the percentage of visibility and its importance as two critical things in visual analysis.
Rød and van der Meer [
9] showed how a planned tall building’s impact can be evaluated through GIS-based visibility and dominance analysis. To make the visibility of tall buildings more practical, they explain the dominance concept based on the distance of the building from the observation viewpoint. They believe that traditional visibility analysis calculates the relationship between buildings and the existing situation in the urban landscape, in which visual obstacles, trees or other disturbing elements are considered. However, dominance analysis adds the criterion of how a building dominates visually, taking into account the distance from the building and the degree to which the building is visible from any point of view [
9].
Another study did a visibility analysis of high-rise building development, using a GIS-based map to present visual coverage and cumulative visibility of tall buildings through the study of visibility of existing single and cluster buildings in the city of Rotterdam, and the impact of those buildings on the city skyline during the time [
15]. They considered a tall building’s performance in the cluster, which is perceived visually instead of obtaining it individually; this offered a new way to characterize the visibility of a tall building. Czynska and Rubinowicz [
16] offer the visual impact size (VIS) method to recognize tall buildings’ locations and to determine how much tall buildings are visible through virtual city models.
Today visibility analysis is performed in both binary and fuzzy forms. The binary form presents the possibility of seeing the building only, while the fuzzy method determines the percentage of visibility. Since binary visibility only examines whether a building is seen or not, it can only be useful in certain cases. The purpose of visibility in this research is fuzzy visibility in order to determine the amount of visibility of tall buildings from urban spaces, and based on this to be able to measure their impact.
1.4. Locating Tall Buildings
Locating is a kind of spatial planning that locates certain activities [
17]. Hence projects can exploit the identification of the most economical places, and its competitiveness should be considered as one of the critical goals. These decisions must be in line with the investors’ and government’s specific policies, and will primarily meet environmental needs [
18].
Results from tall buildings’ physical-spatial effects of Farmanieh and Kamranieh neighborhoods in the city of Tehran designate that creating tall buildings must occur based on pre-planned principles and macro-policies [
19]. Azizi and Fallah [
20] presented suitable areas for the tall building development by providing location criteria (social, economic, environmental, and physical) in the city of Shiraz.
Adeli and Sardarre [
21] evaluated proper locations for tall buildings in the city of Qazvin by considering social, economic, environmental, and physical criteria, weighting them, and producing the corresponding layers. Sedaghati [
22] studied the existing location of one of the tall building complexes in the city of Tabriz. This study evaluated the impact of distance from pollutants, faults, traffic points, highways, etc., on these buildings.
Thomasetin et al., [
23] desired to turn the process of developing tall buildings into a purposeful endeavor by categorizing existing tall buildings by location (city center, middle texture, surrounding ring, next to the big ones, and close to the industrial areas) and type of accumulation (single-scattered) [
23]. They concluded that urban planners must keep developing tall buildings in centralized clusters around the historic part of the city, and that constructing individual buildings near the historic center of the city should be avoided. The investigation of location methods during the last two decades in Iran reveals that existing approaches are mostly simplistic and rudimentary. Over that time period, there has not been a significant achievement in advancing the urban planning profession in Iran [
24]. Another study suggested location for nine regions of the city of Mashhad by using criteria (physical-spatial, environmental) that have been extracted from the smart growth theory. This paper declares that existing tall buildings are located in inappropriate locations and defines appropriate points [
25]. Salehi and Ghadiri [
26] believe that the criteria required for locating and constructing tall buildings in Iran are in line with building regulations of the city of Toronto in Canada. These regulations considered “rule”, “tower”, and “communication with adjacent areas” in terms of shading, neighborhood, aesthetics, and urban landscape. These rules can also be used in Iranian metropolises.
Zista consulting engineering [
27] considered urban planning principles, citizen orientation, and urban visualization for building locations in Tehran. Anabestani et al., [
28] estimated appropriate locations for constructing tall buildings in Mashhad’s 9th region. Zareian [
29] studied social issues of tall buildings. He defines the most critical social problems of these buildings as increased congestion, lack of cultural compatibility, reduced neighborhood identity, difficulty in ensuring security, and weak neighborly relations.
1.5. Research Question
Previous studies that dealt with tall buildings’ locations suggested appropriate locations only for specific sites and failed to provide a comprehensive model including the weight of the criteria and consideration of the two- and three-dimensional impacts of tall buildings on the city, therefore the main research question is:
What is the weight of the criteria affecting the location of tall buildings and how to create an effective combination of two-dimensional and three-dimensional criteria for locating tall buildings, as a comprehensive model?
2. Materials and Methods
The research method consists of three main stages including weighting and prioritizing criteria, applying criteria to the GIS layer, and visibility analysis.
2.1. Weighting and Prioritizing Criteria
The first stage was prioritizing criteria (
Figure 1,
Figure 2 and
Figure 3 and
Table 1). Twenty registered and reputable experts, including twelve urban designers, five architects, and three urban planners, completed a survey through the analytic network process (ANP) technique (
Figure 4). Criteria were narrowed down based on the current information and the general situation of Hamedan. The relationship between them and inhibiting sub-criteria, and their importance compared to one another, were measured. Finally, the weighting and priority of criteria were provided by using Super Decisions V2.8 software. Super Decisions software is a tool for making decisions based on multi-criteria methods including the analytic hierarchy process (AHP) and the analytic network process (ANP) [
30] which is applied in this research.
2.2. Developing GIS Layers
In the second stage, the GIS layers of Hamedan’s characteristics (
Figure 5,
Figure 6,
Figure 7,
Figure 8,
Figure 9,
Figure 10,
Figure 11,
Figure 12,
Figure 13,
Figure 14,
Figure 15,
Figure 16,
Figure 17 and
Figure 18) are applied based on the sub-criteria mentioned in
Table 1. The Map Algebra tool in ArcGIS V10.3 software was applied to create the layers so that it was possible to include the weight of the criteria obtained in the first stage. Then a map (
Figure 19) is provided by the ArcGIS software that shows the best locations for the proposed tall buildings in the city.
2.3. Visibility Analysis
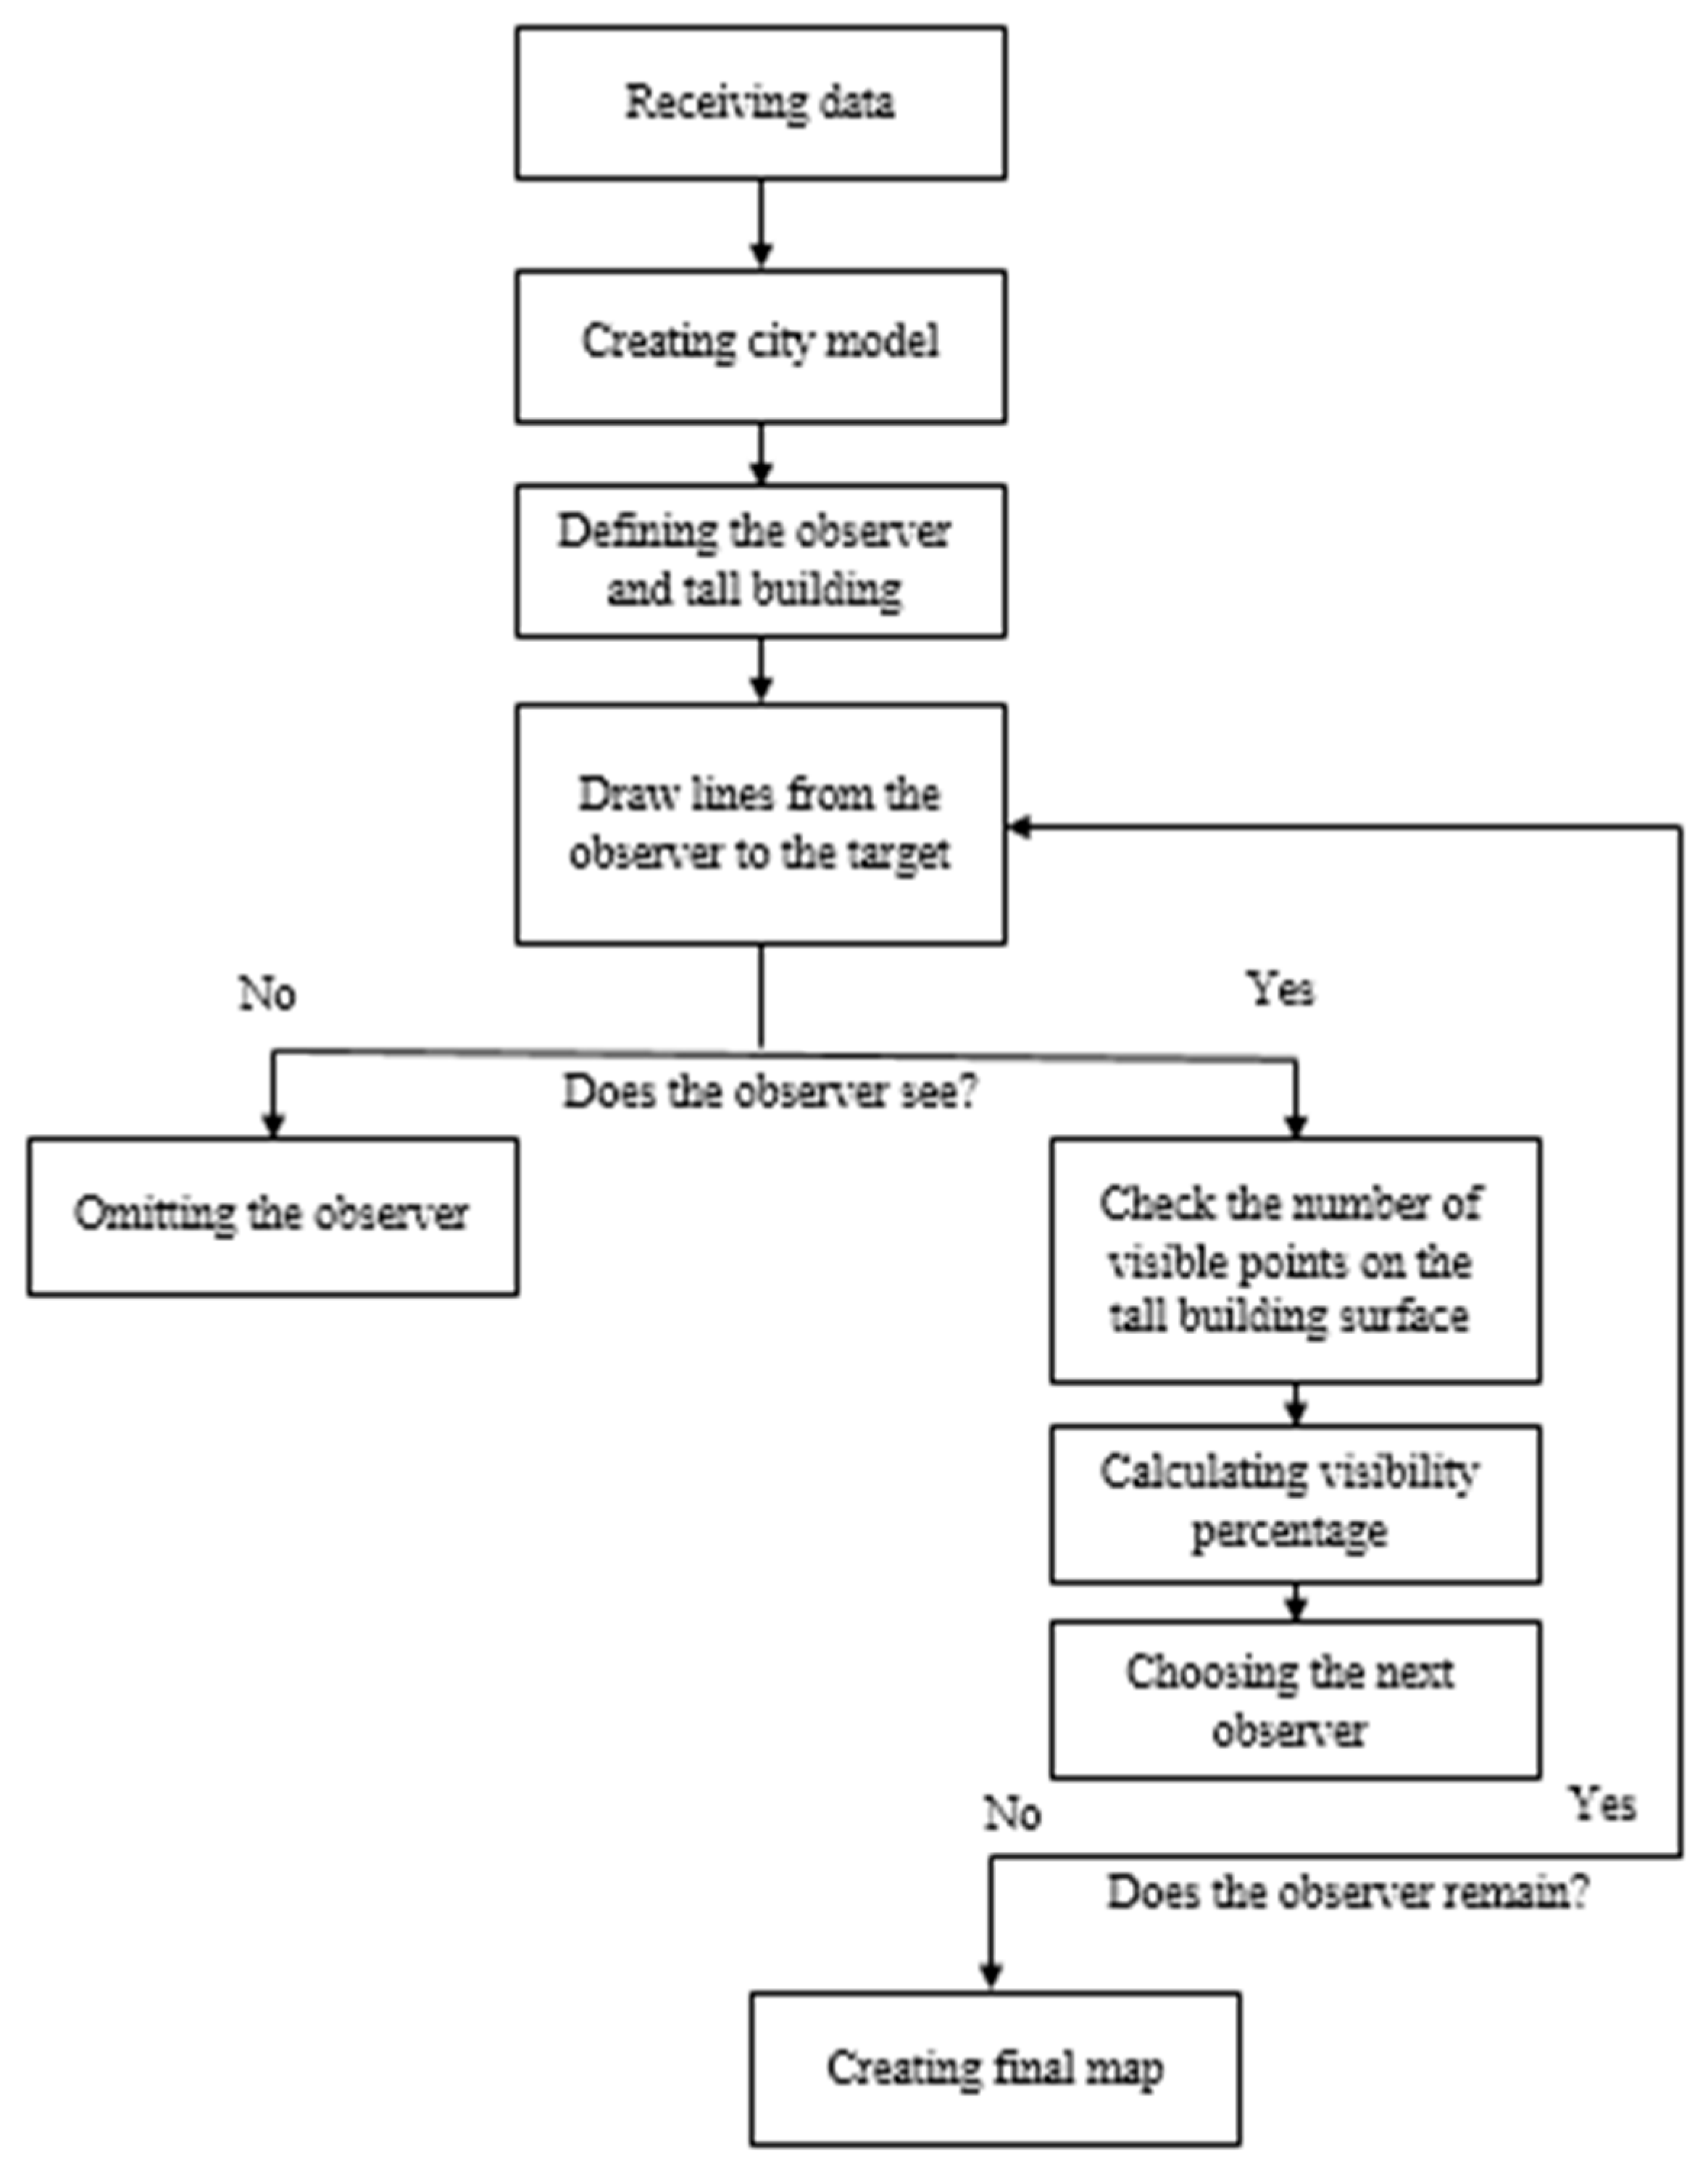
The last and most crucial stage was preparing a plan that addressed building visibility in future development. Then, a general algorithm was reached (
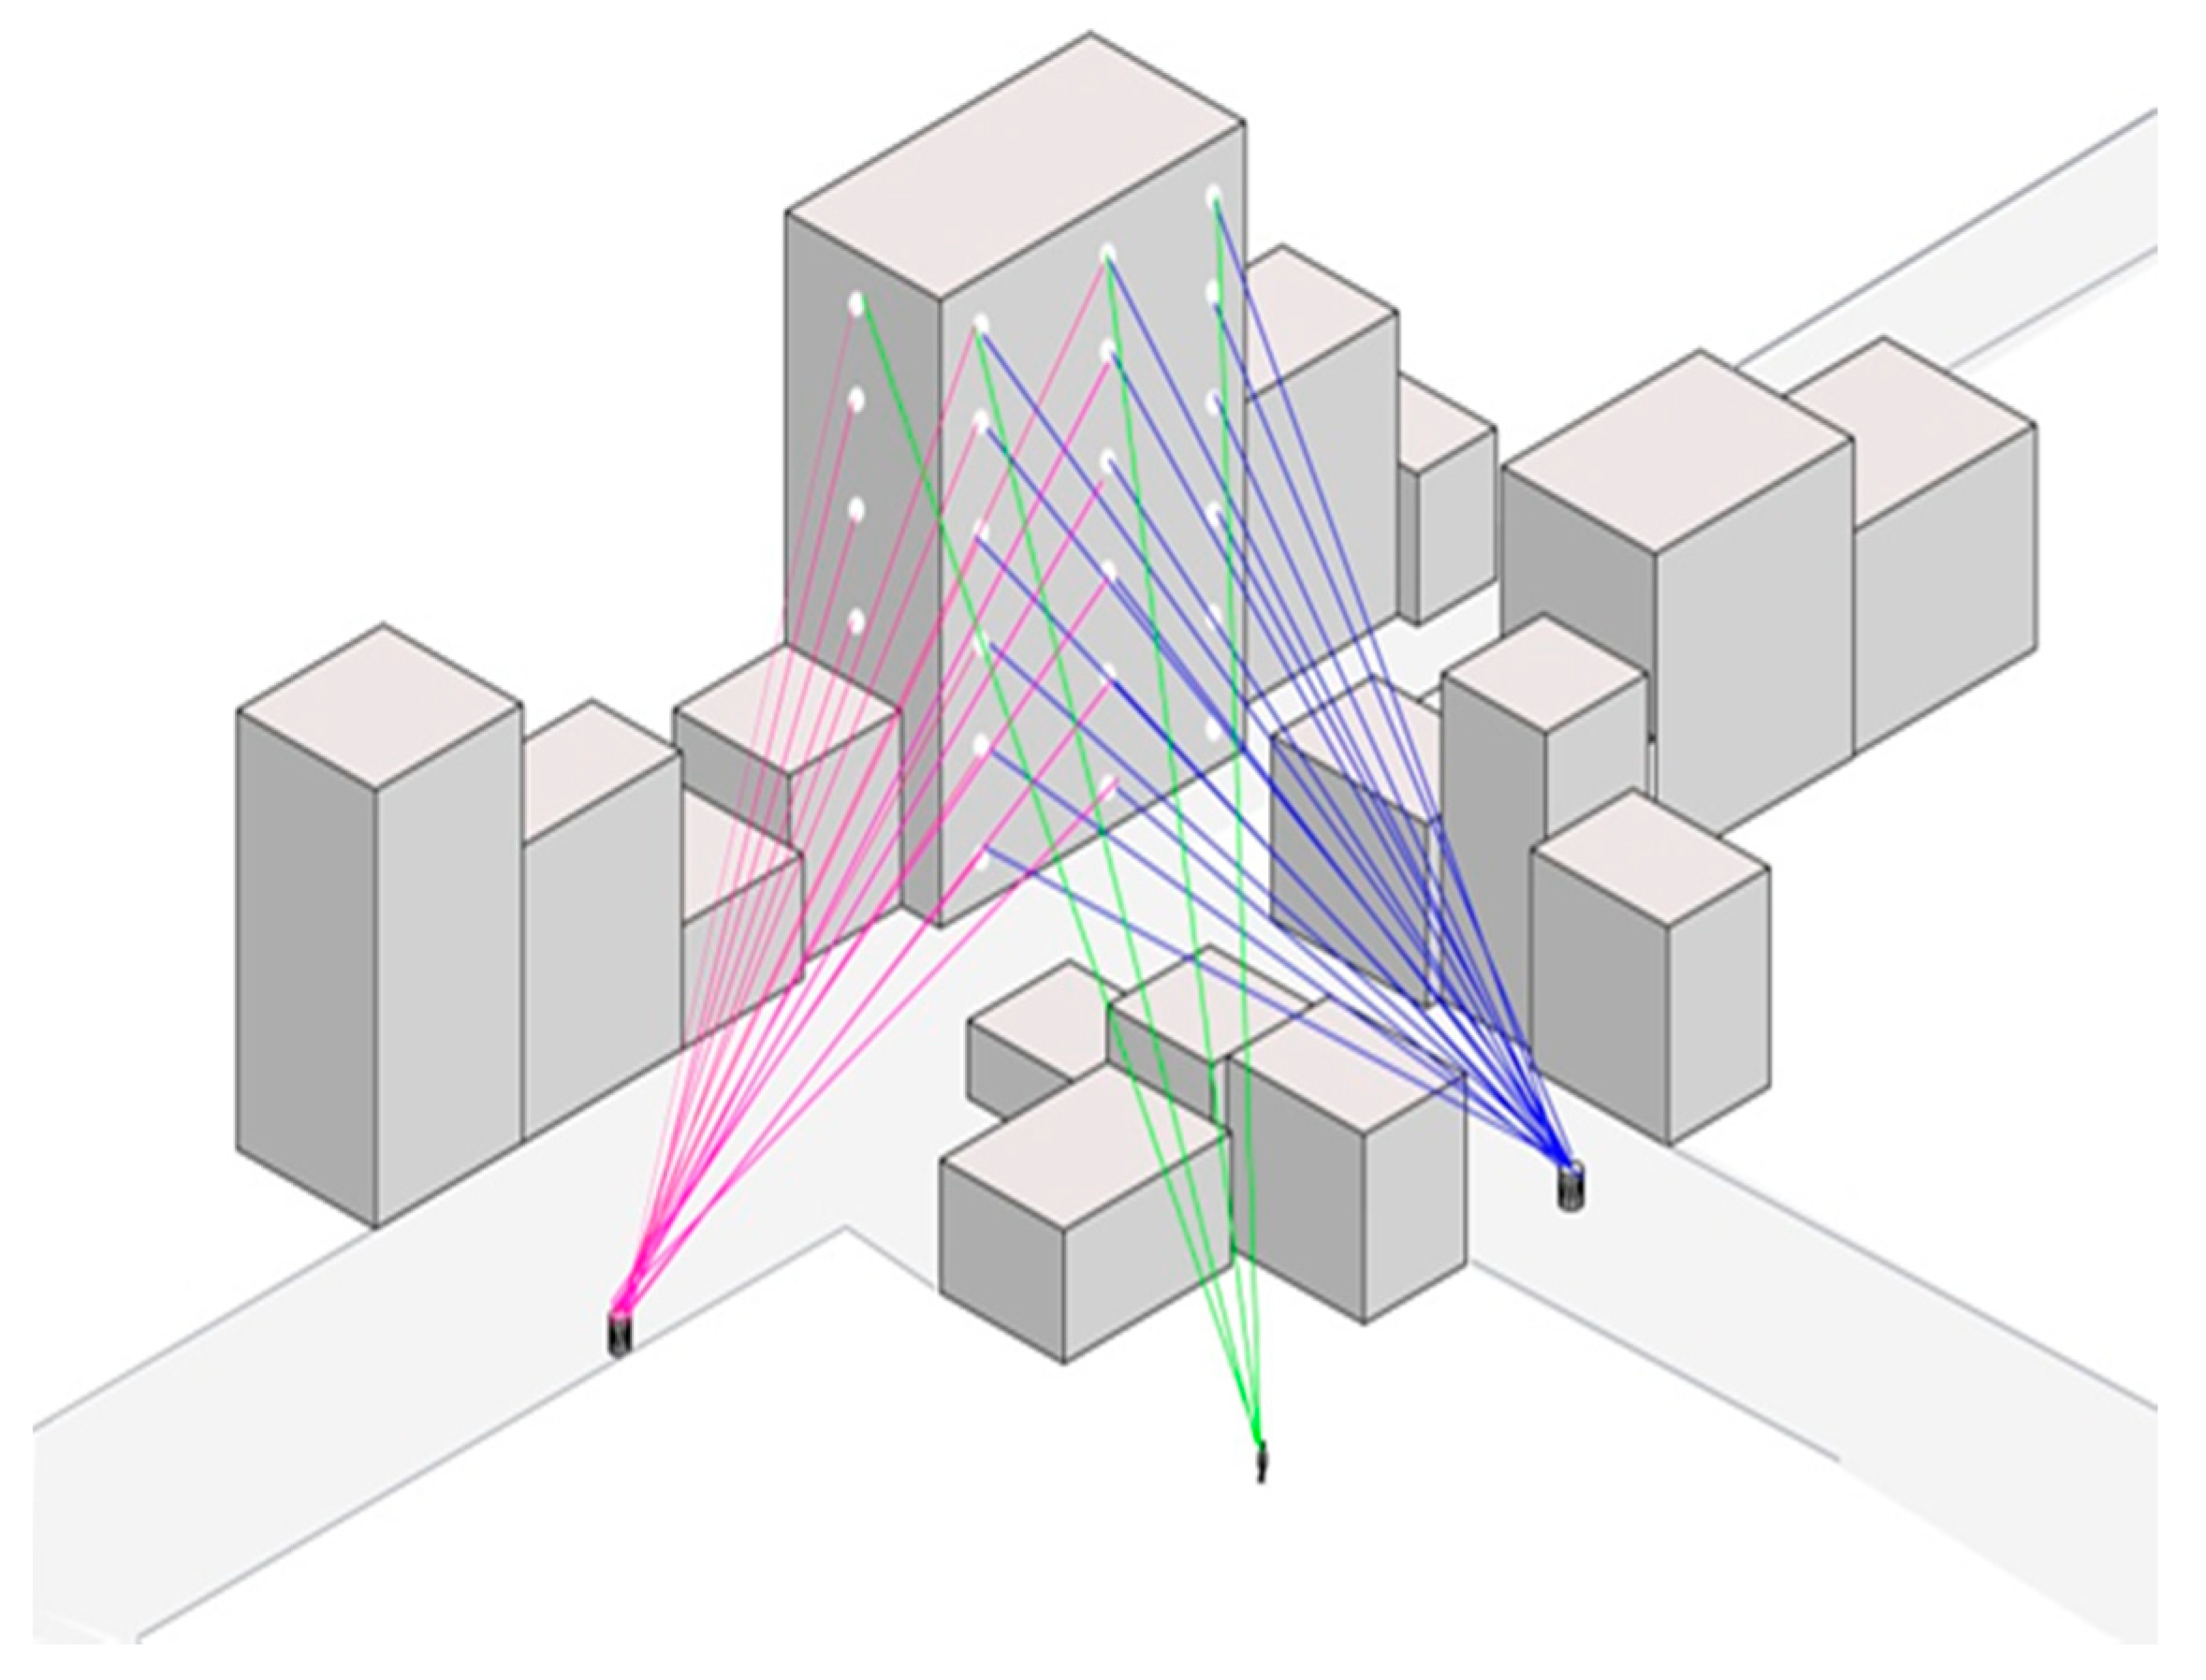
Figure 20). For visibility analysis, a fuzzy model was used, which was designed to provide the numerical value of visibility for each tall building (
Figure 21). Based on
Figure 19, seven hypothetical 70-m-tall buildings (20 stories), with a length of 30 m and a width of 15 m, were considered. This process was programmed on Matlab software (based on the process shown in
Figure 20) and outputs were imported into ArcGIS again. In this program, larger sides had 18 points (3 points in 6 rows), and smaller sides had 6 points; 48 points were defined exclusively, and the observer could see 24 points at best. The observer (height: 170 cm, radius vision: 1000 m), was located on the surrounding urban spaces (
Figure 21). The purpose of doing the third stage is comparing the influence of chosen buildings and finally selecting the best place with the least negative impact on public urban spaces (
Figure 22,
Figure 23,
Figure 24,
Figure 25,
Figure 26,
Figure 27 and
Figure 28).
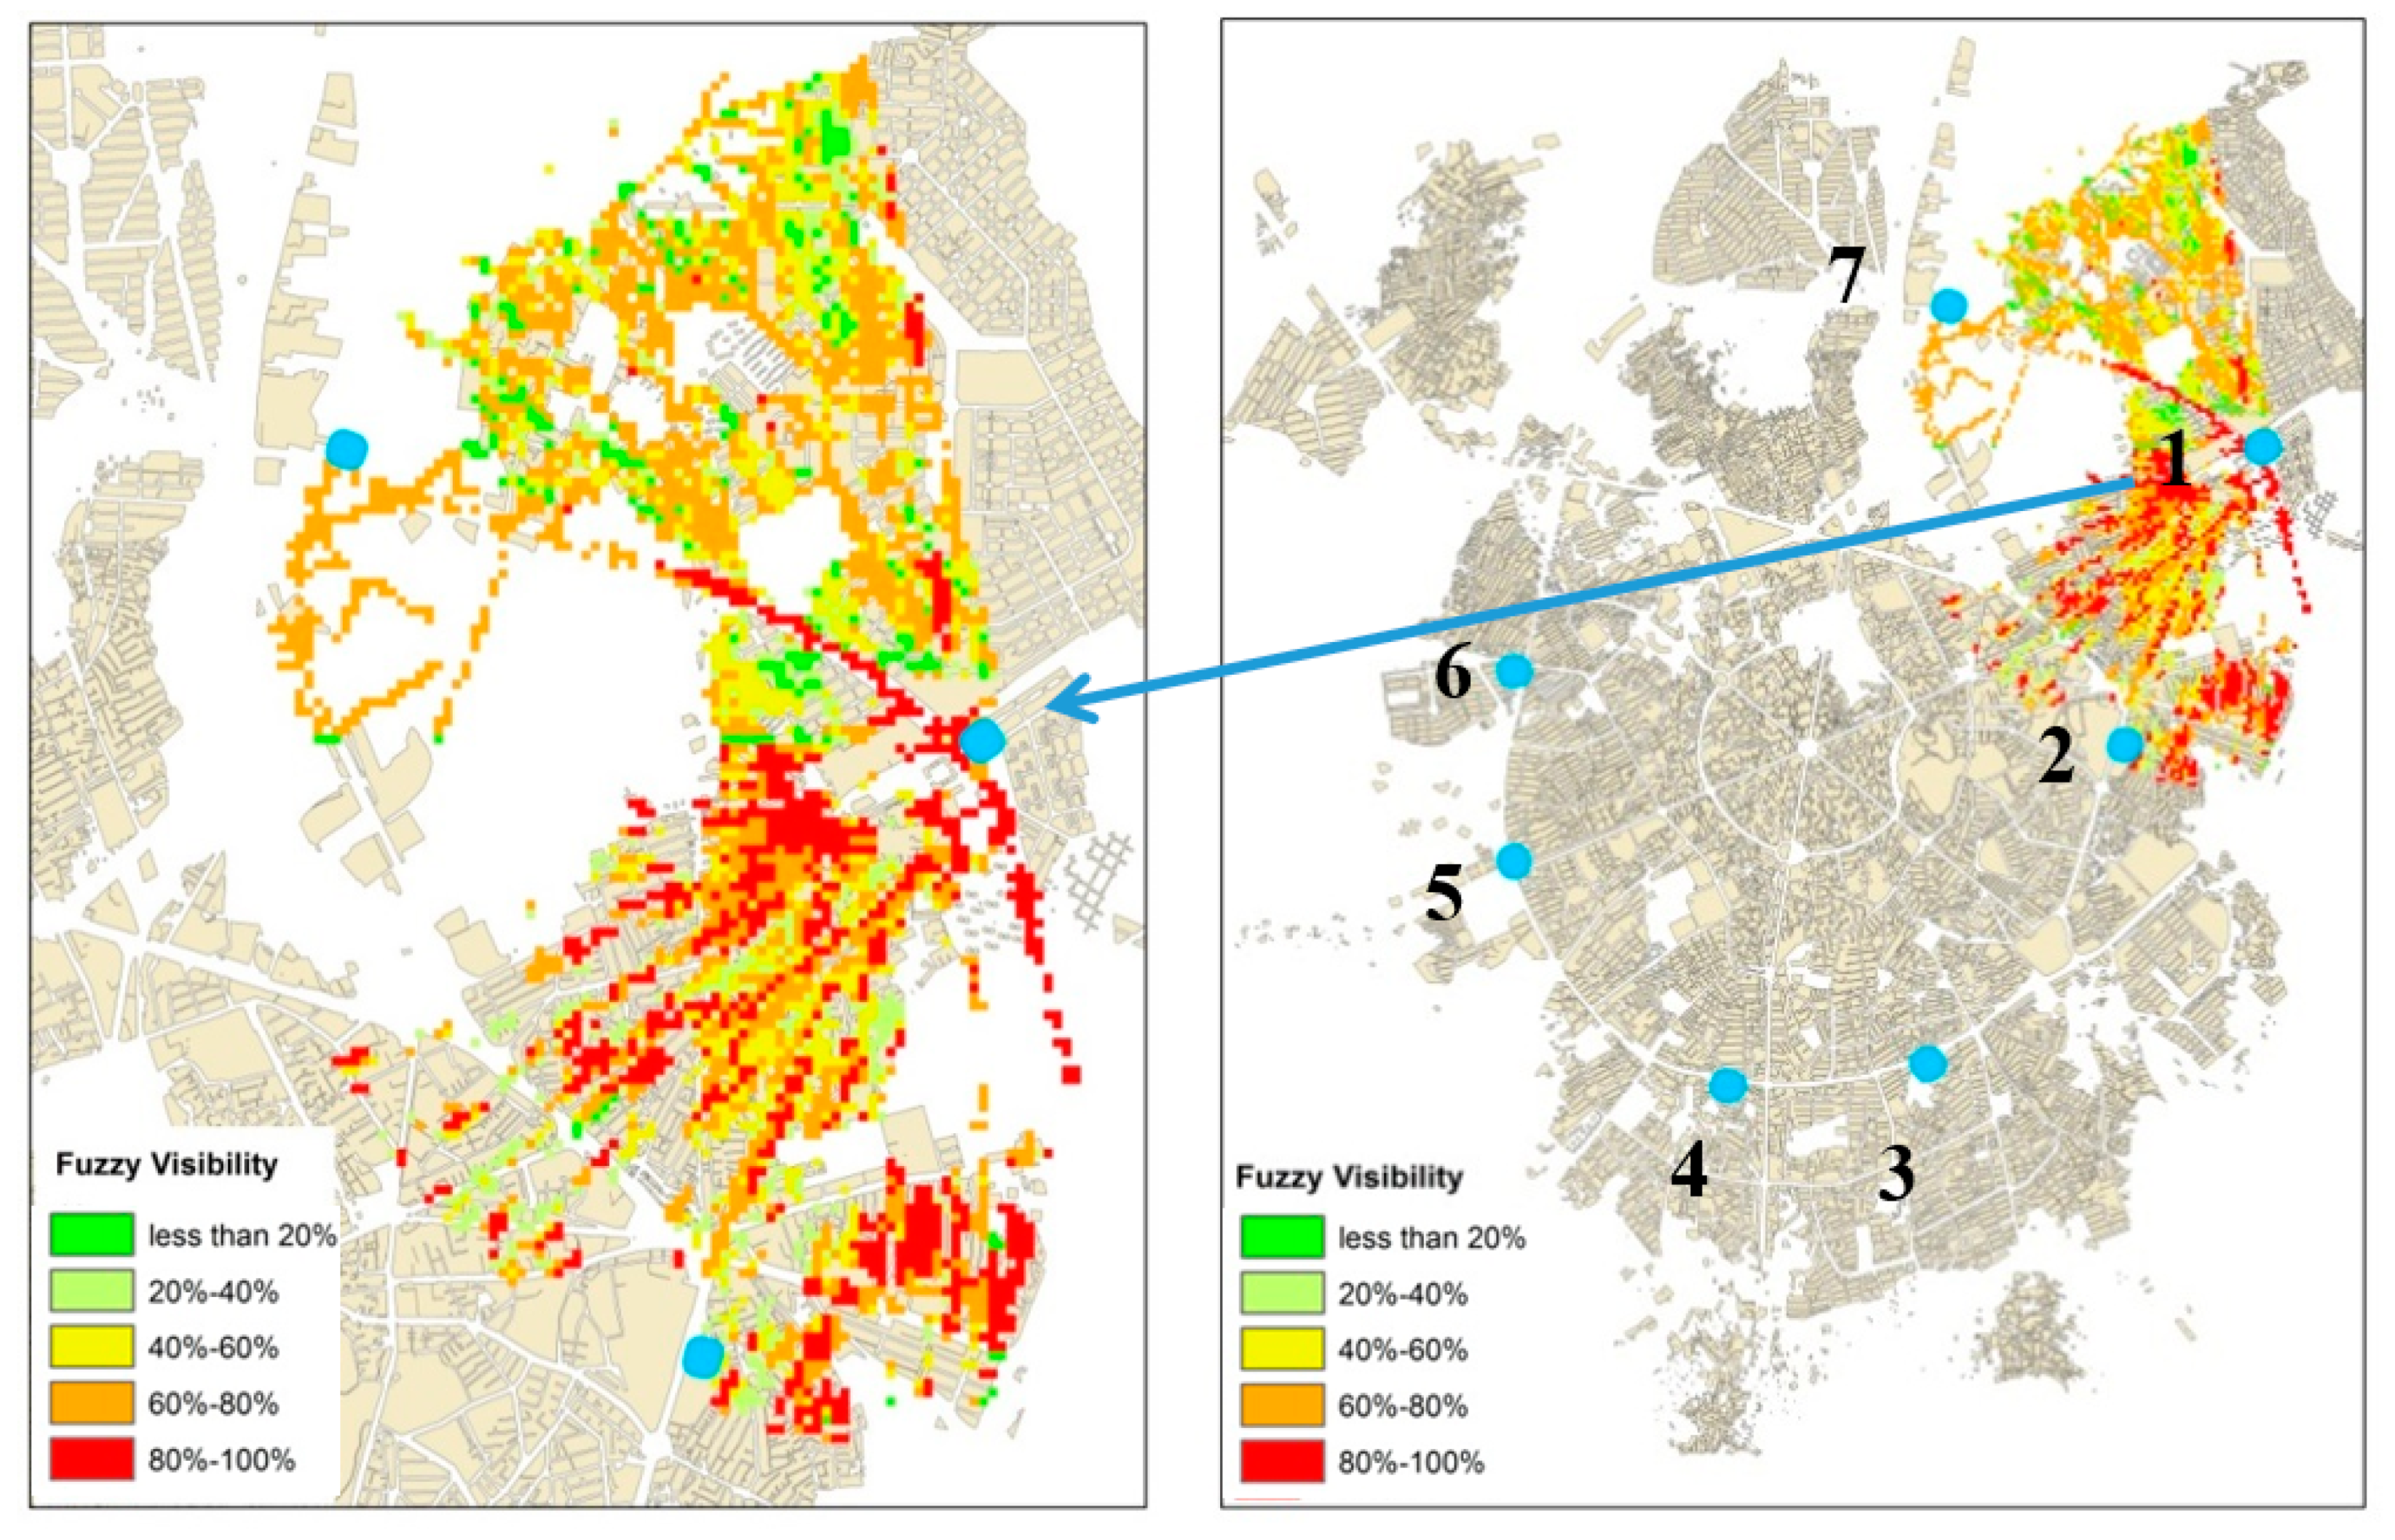
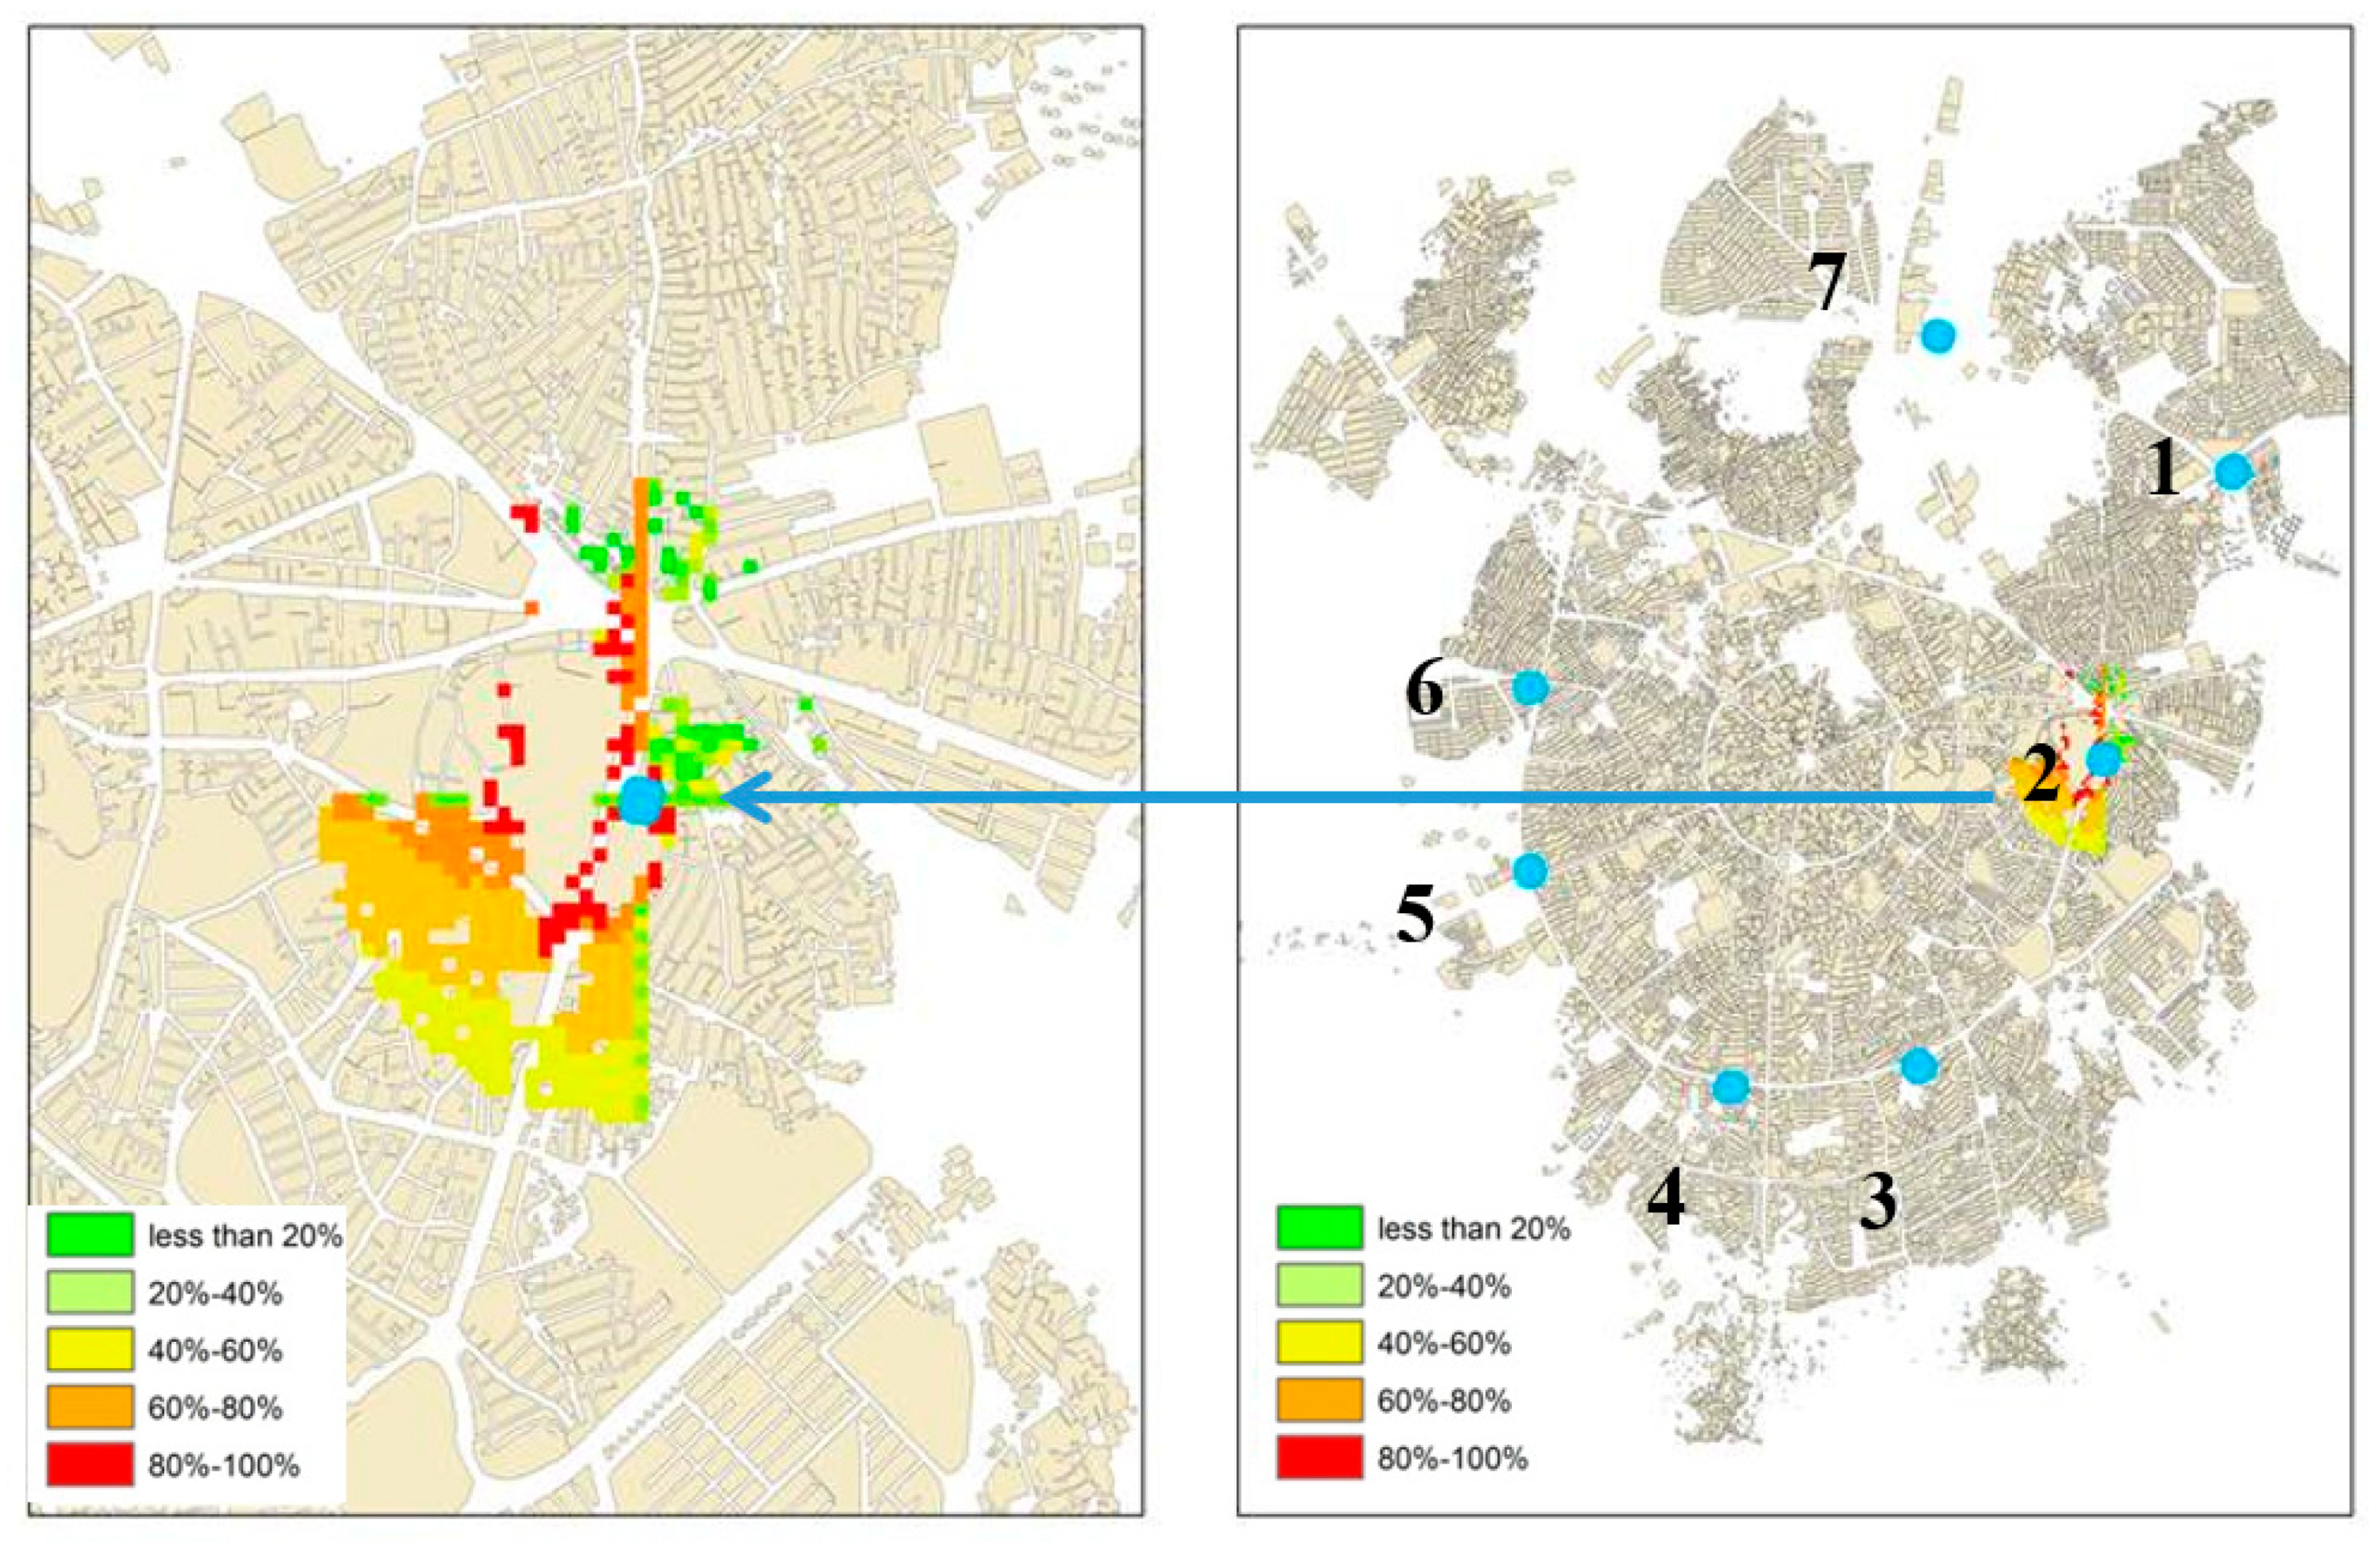
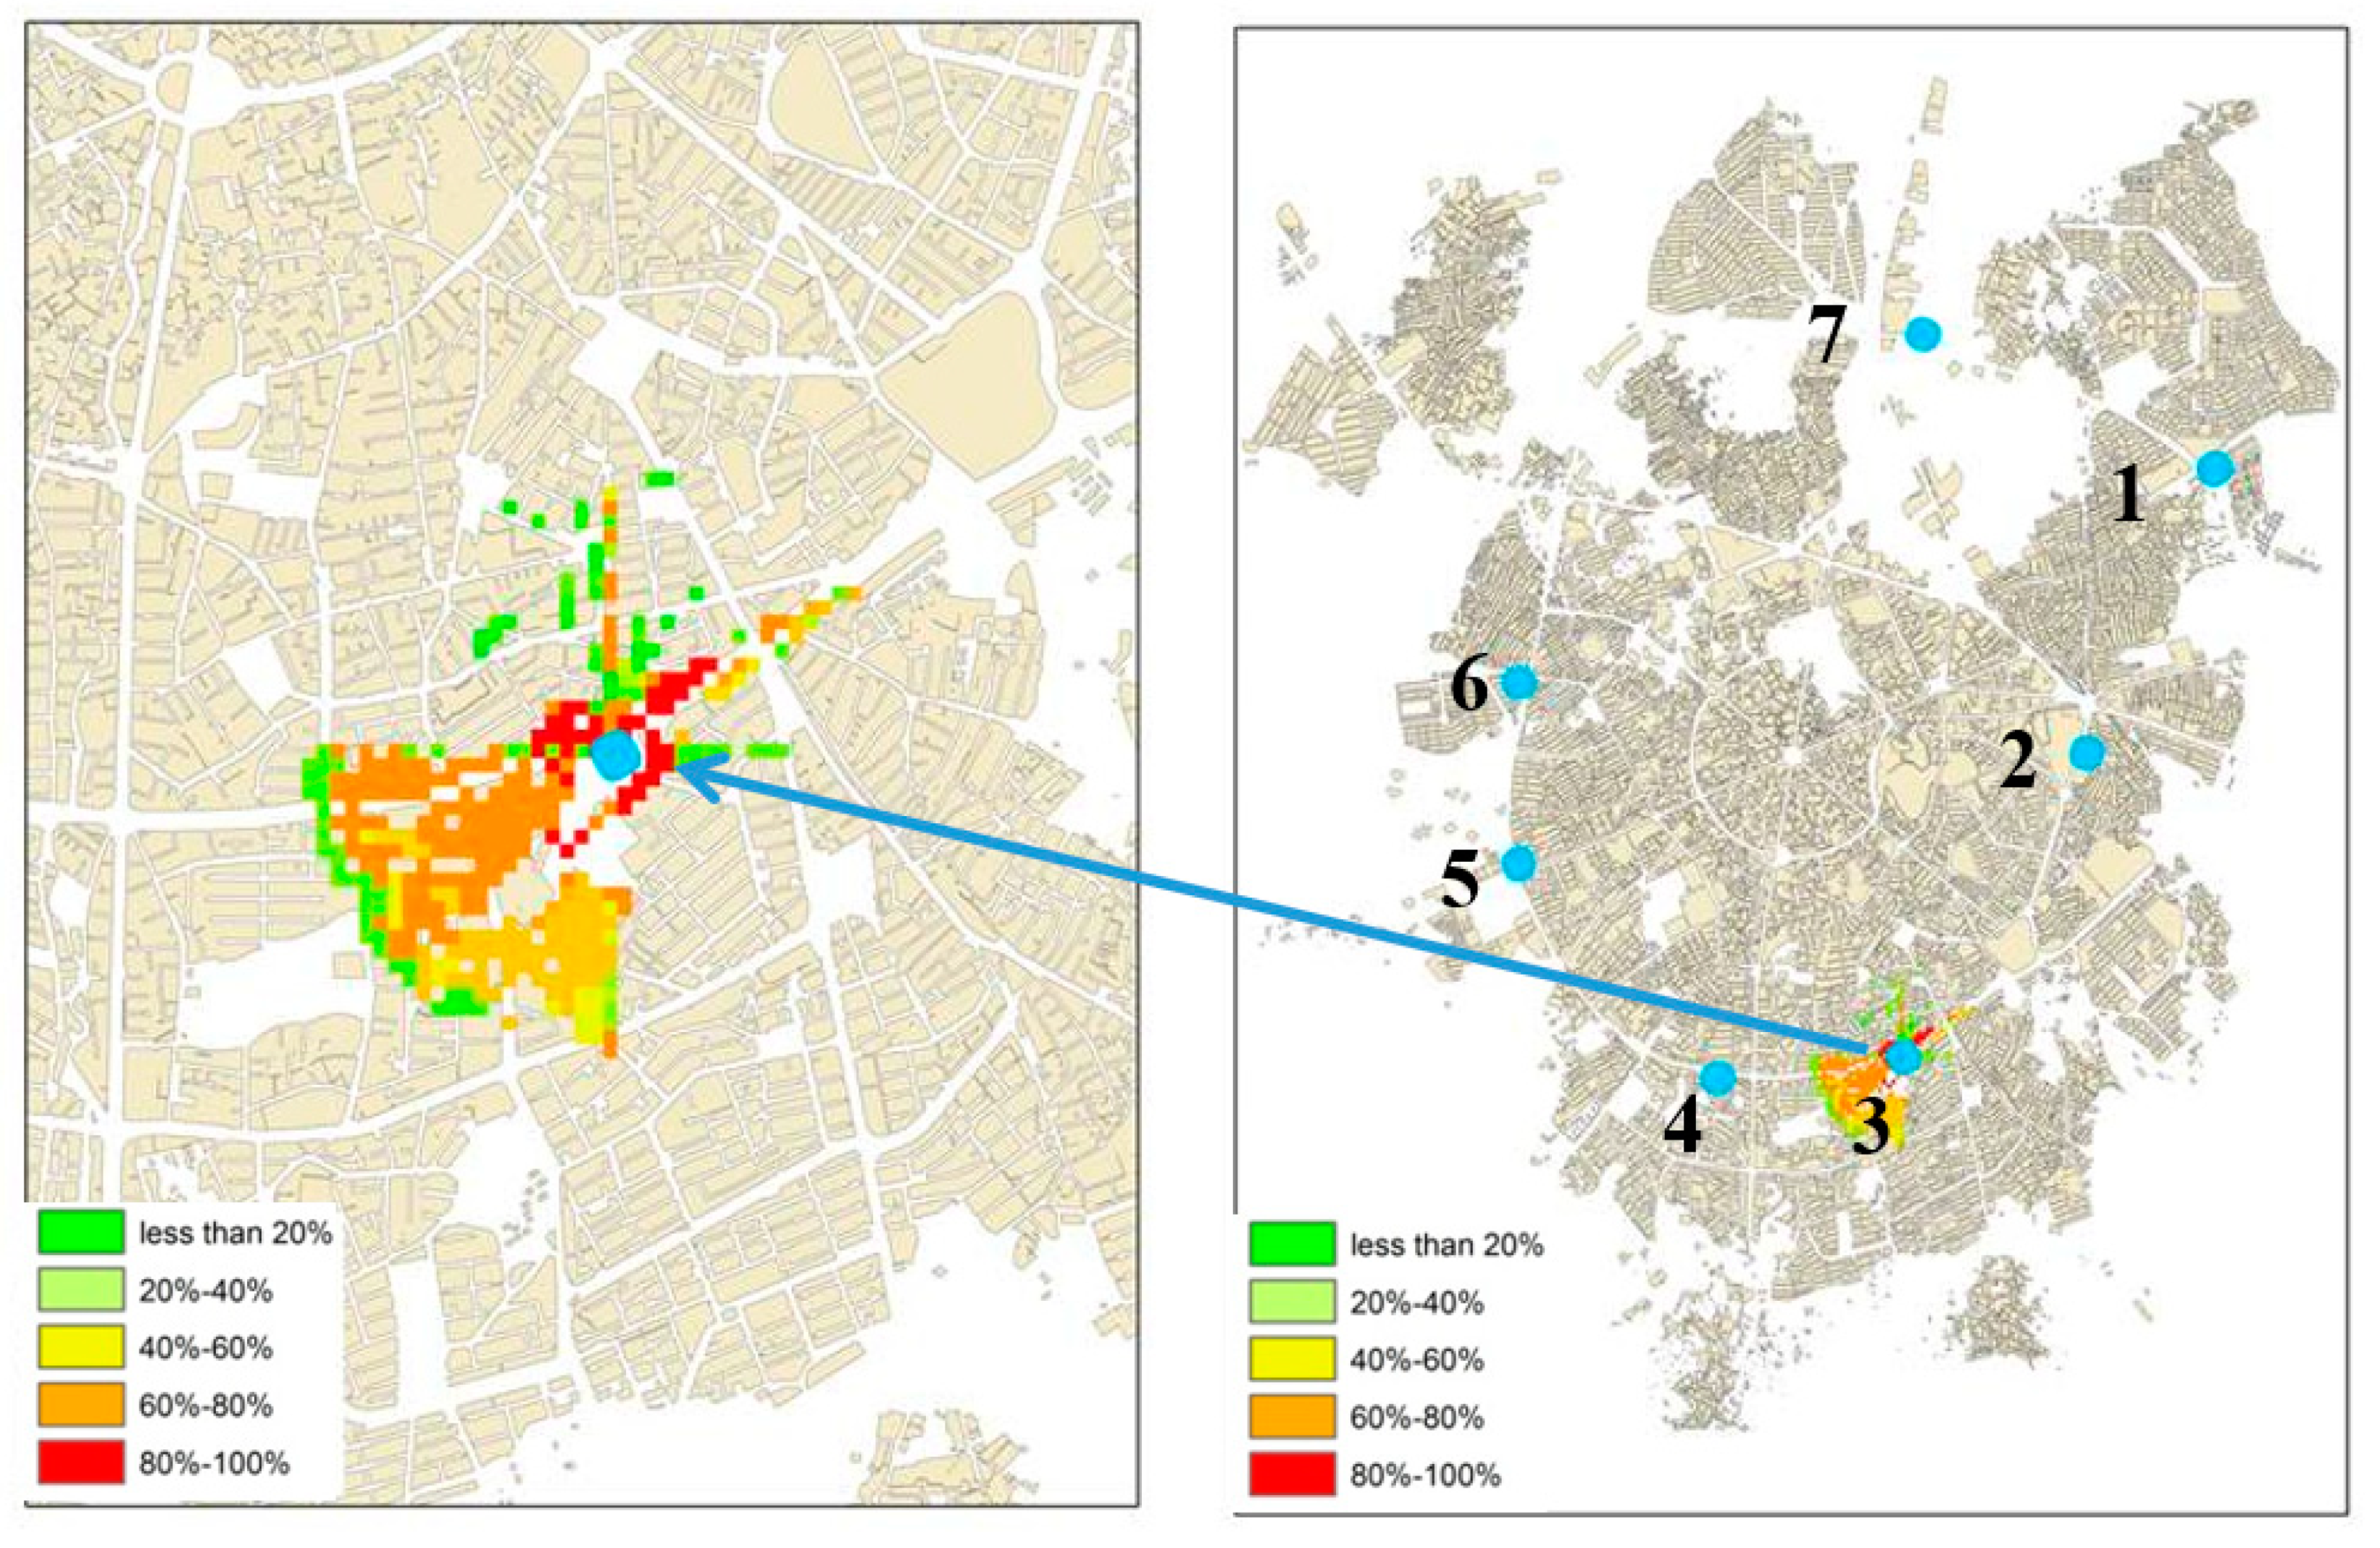
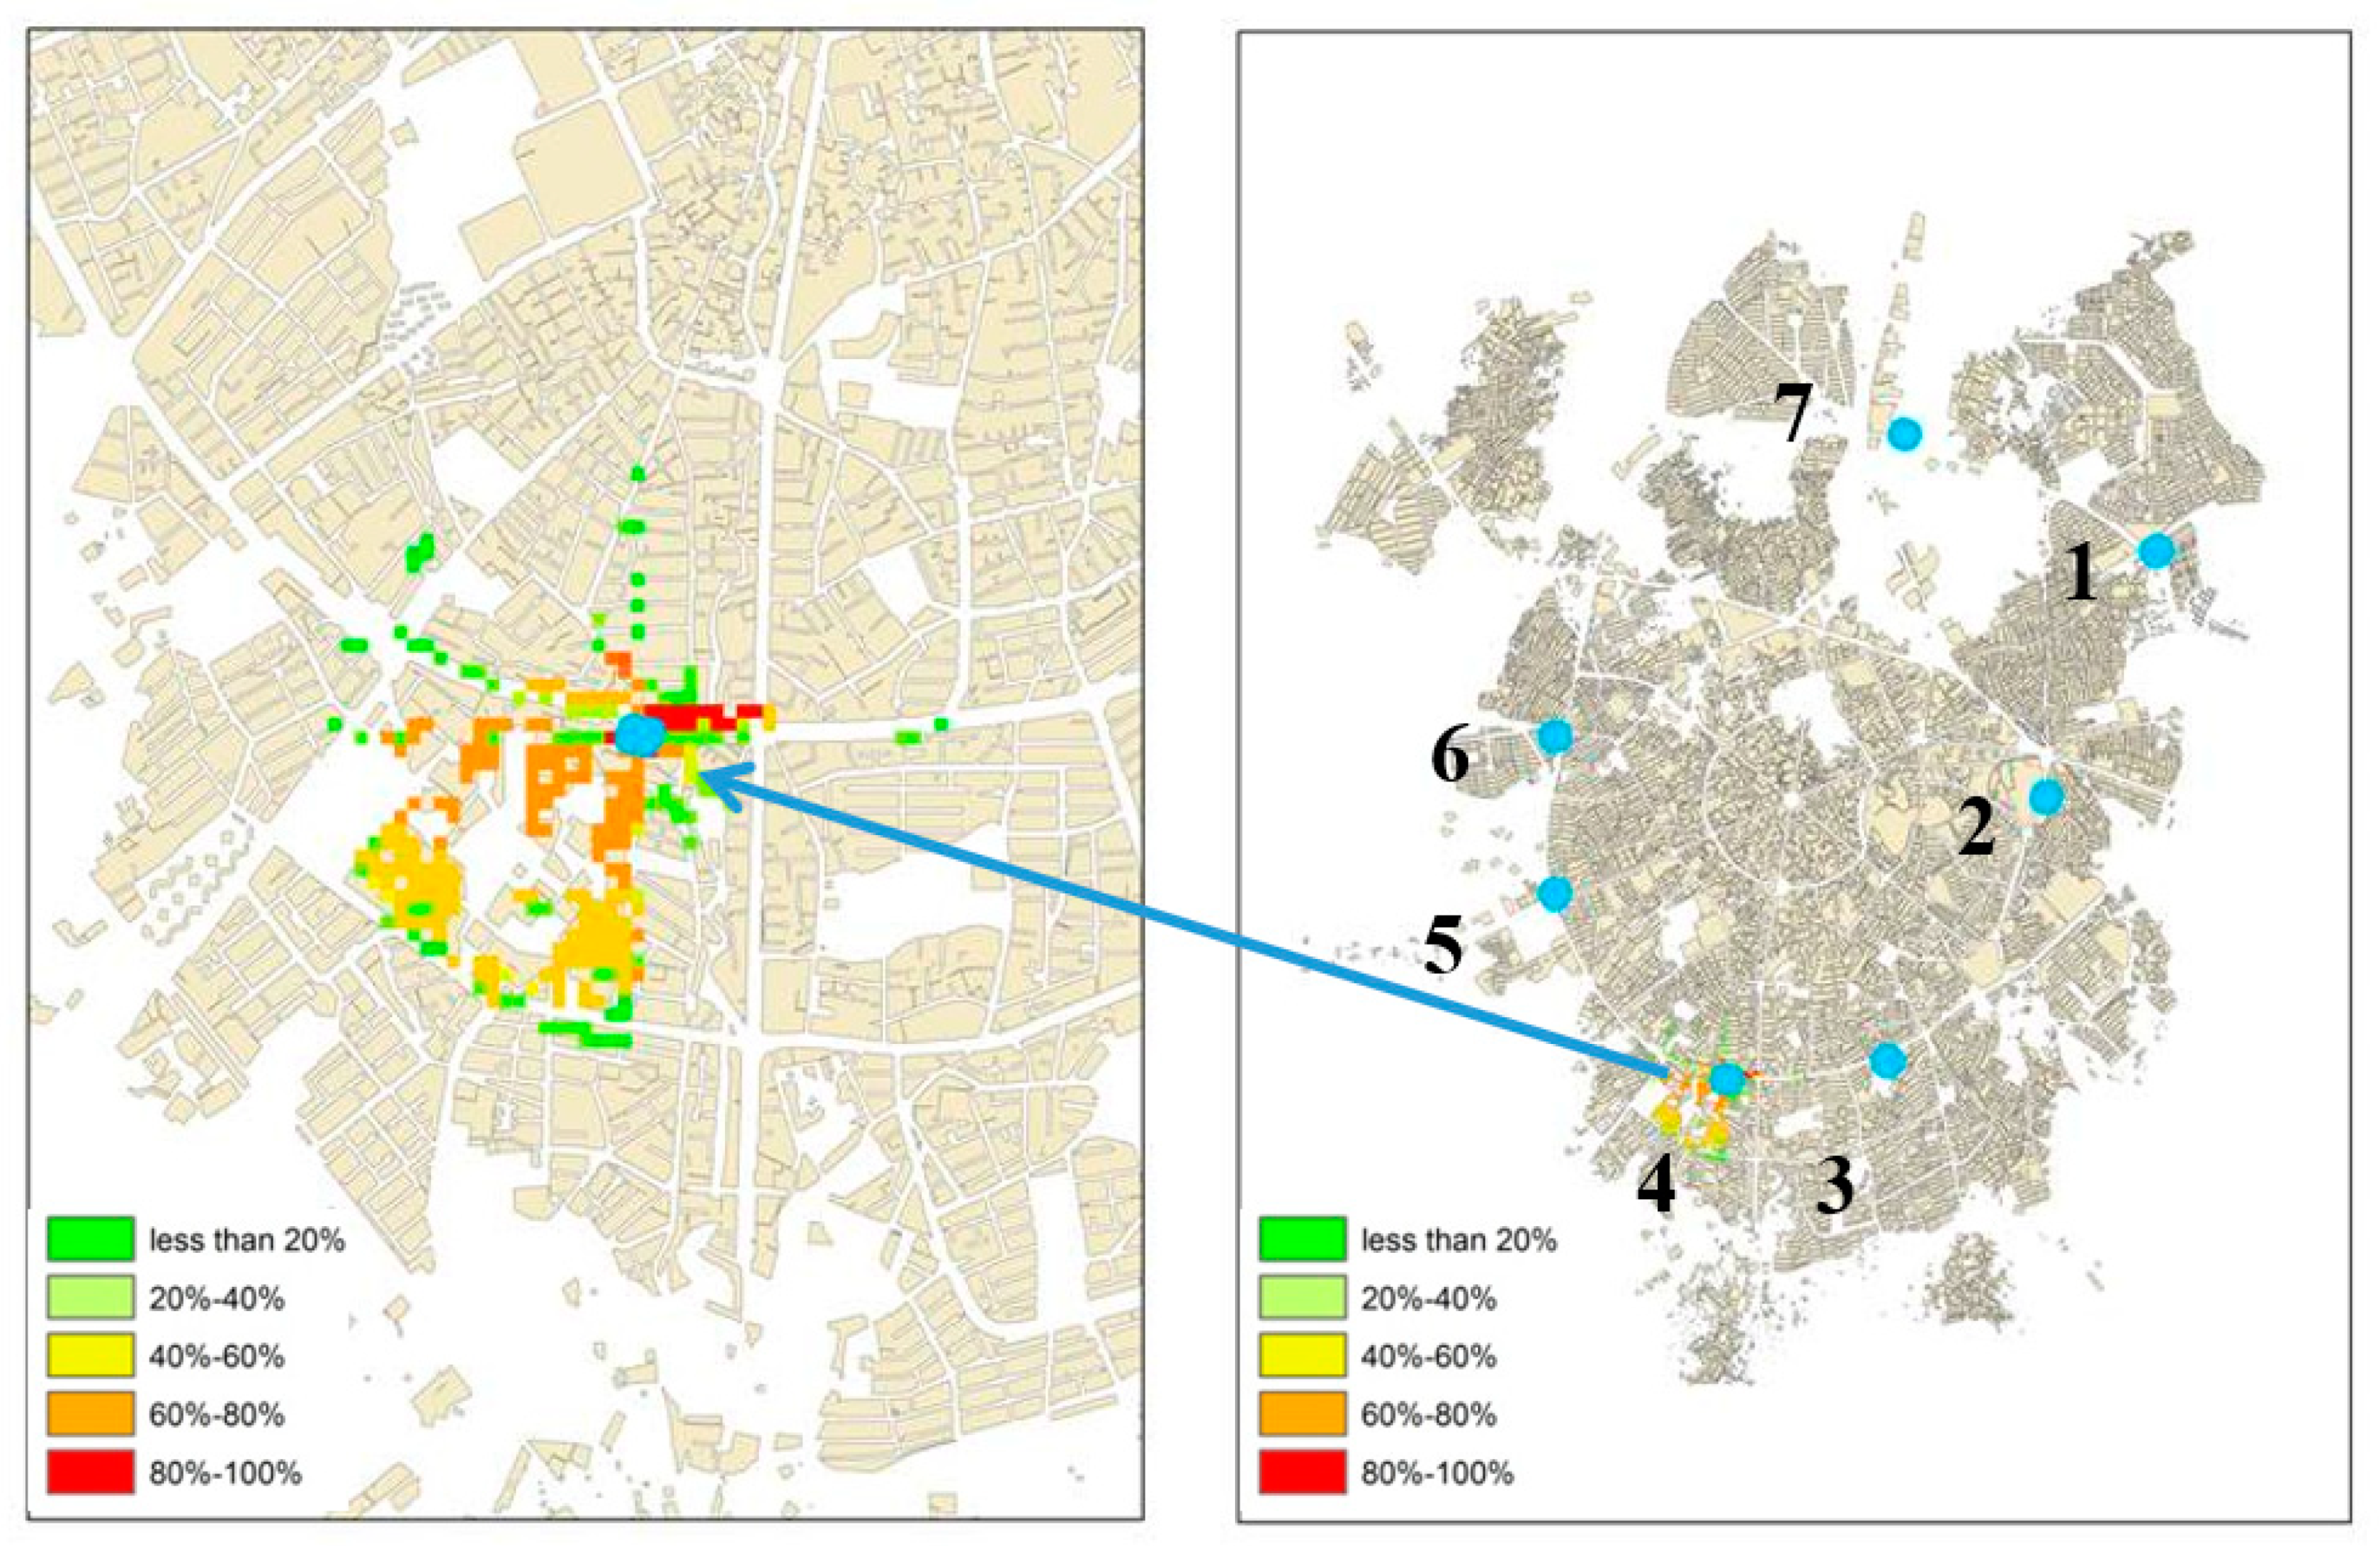
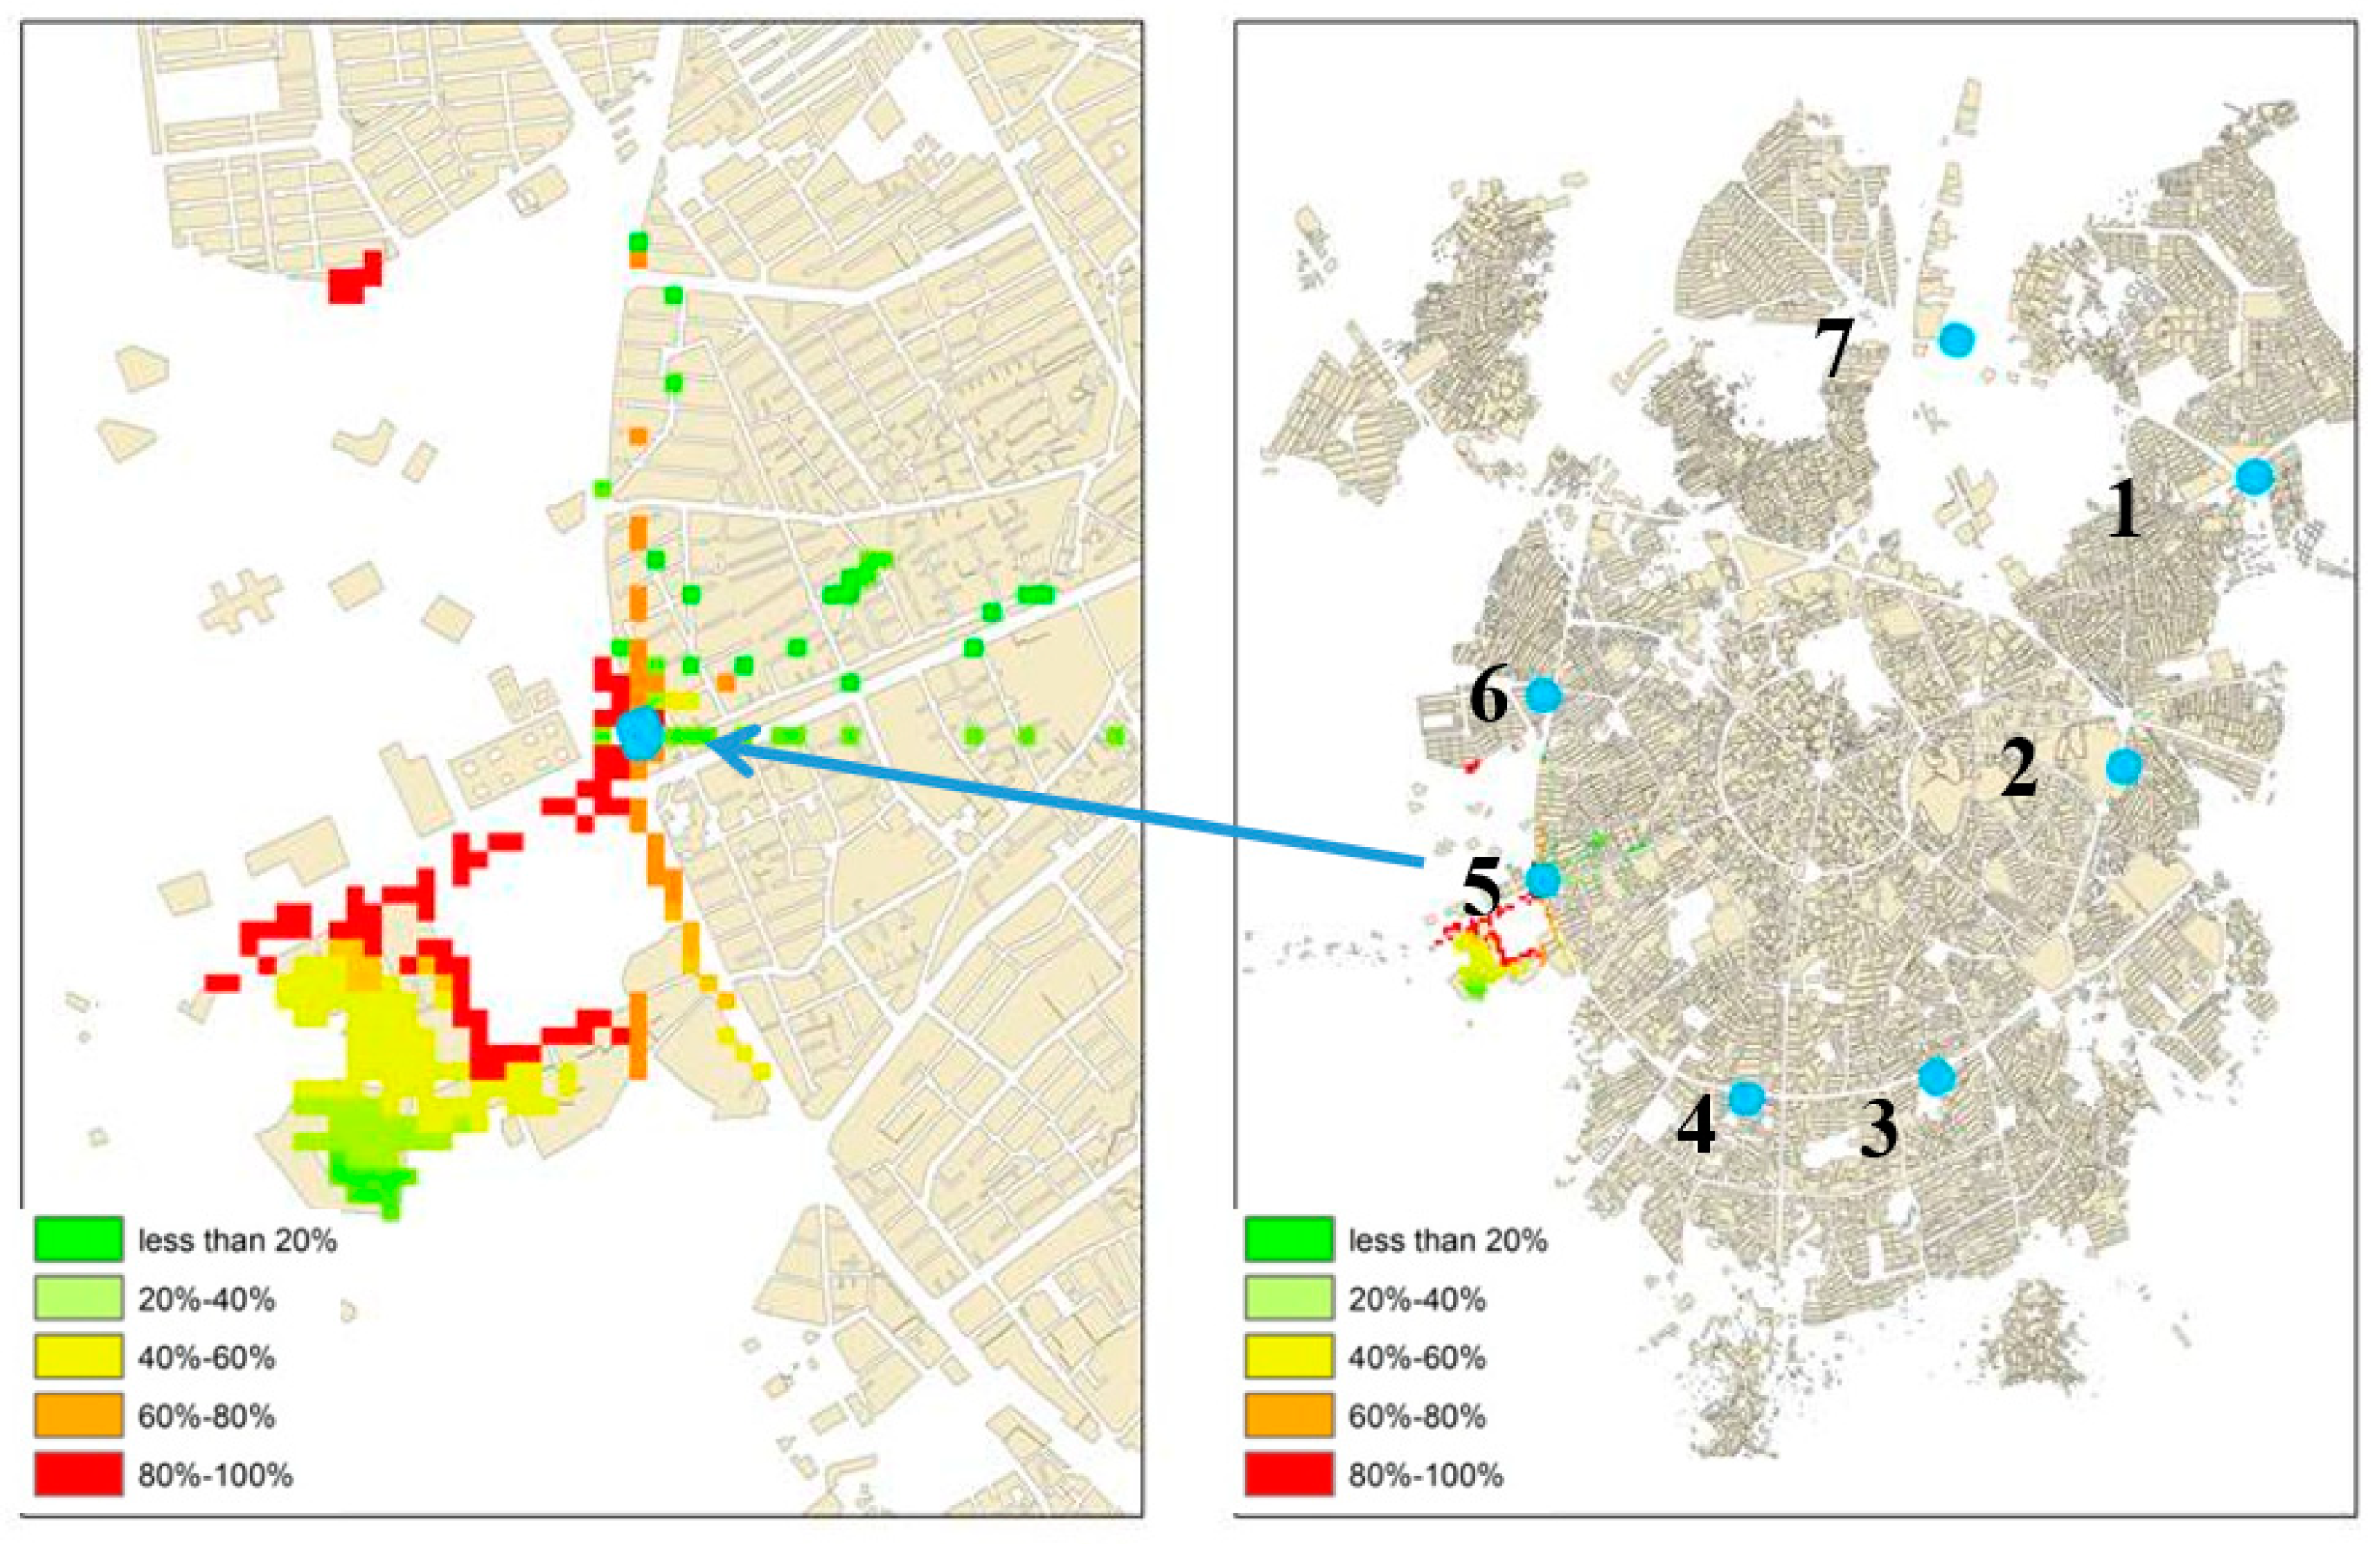
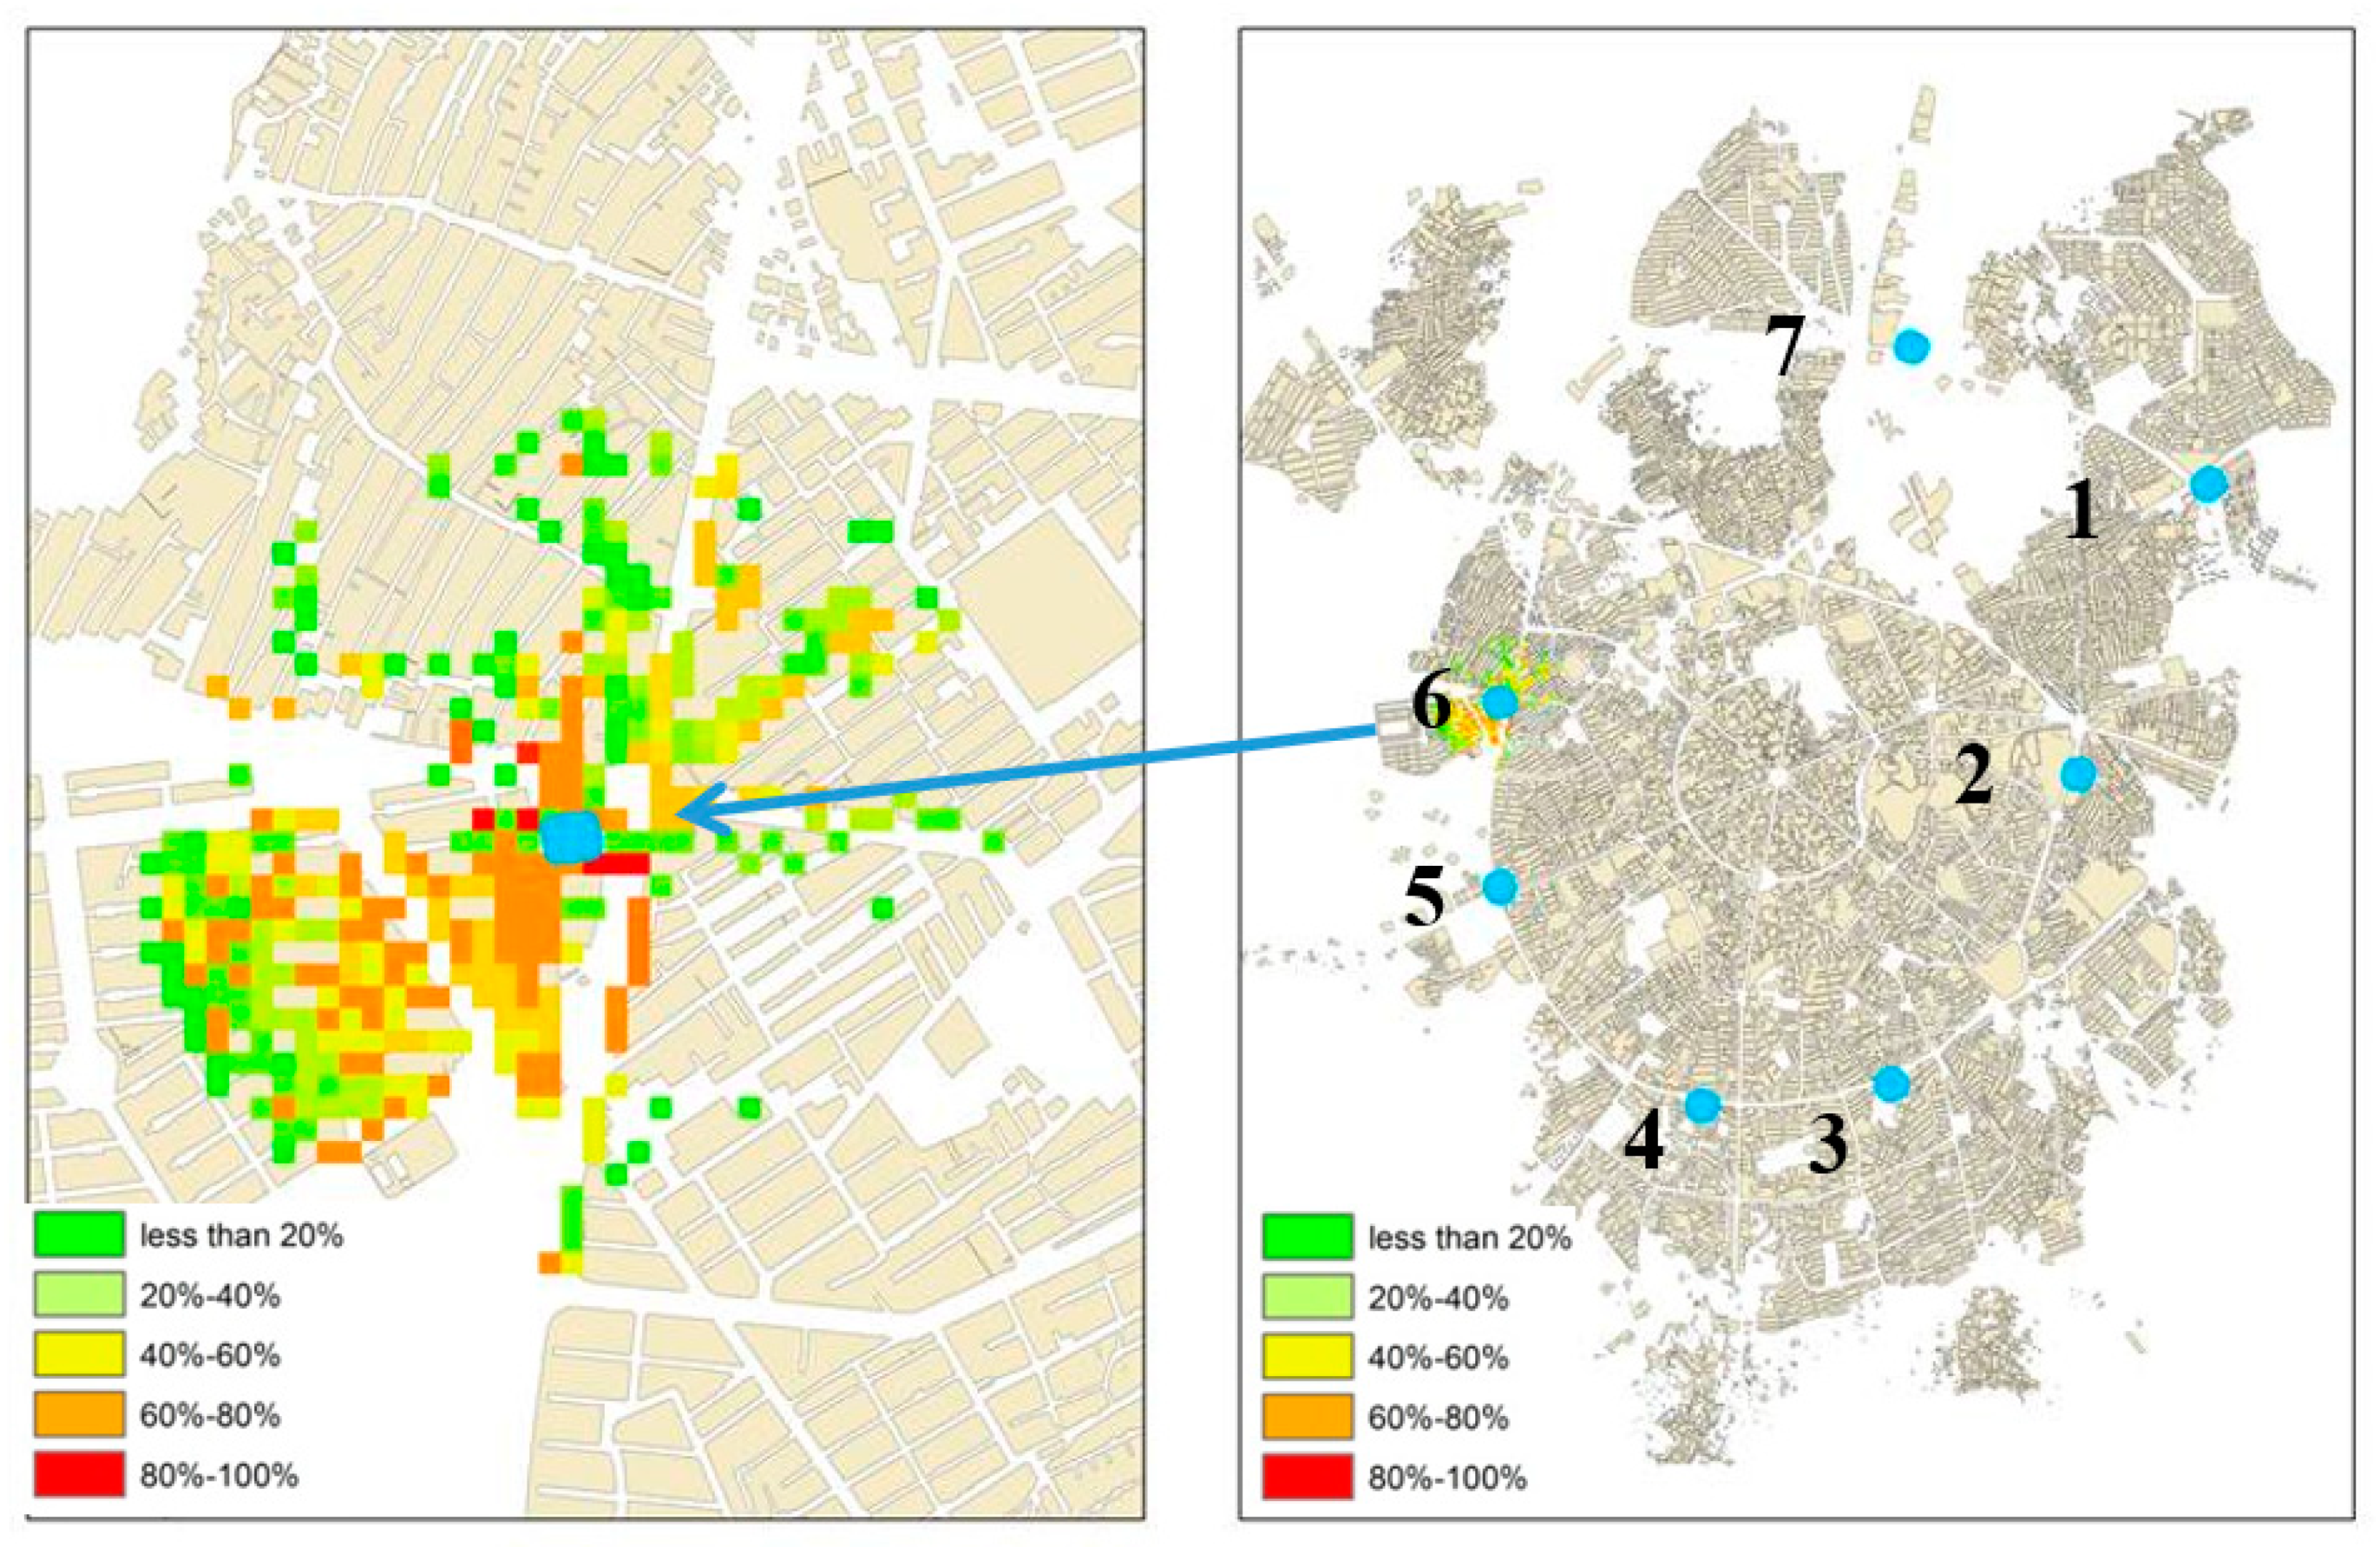
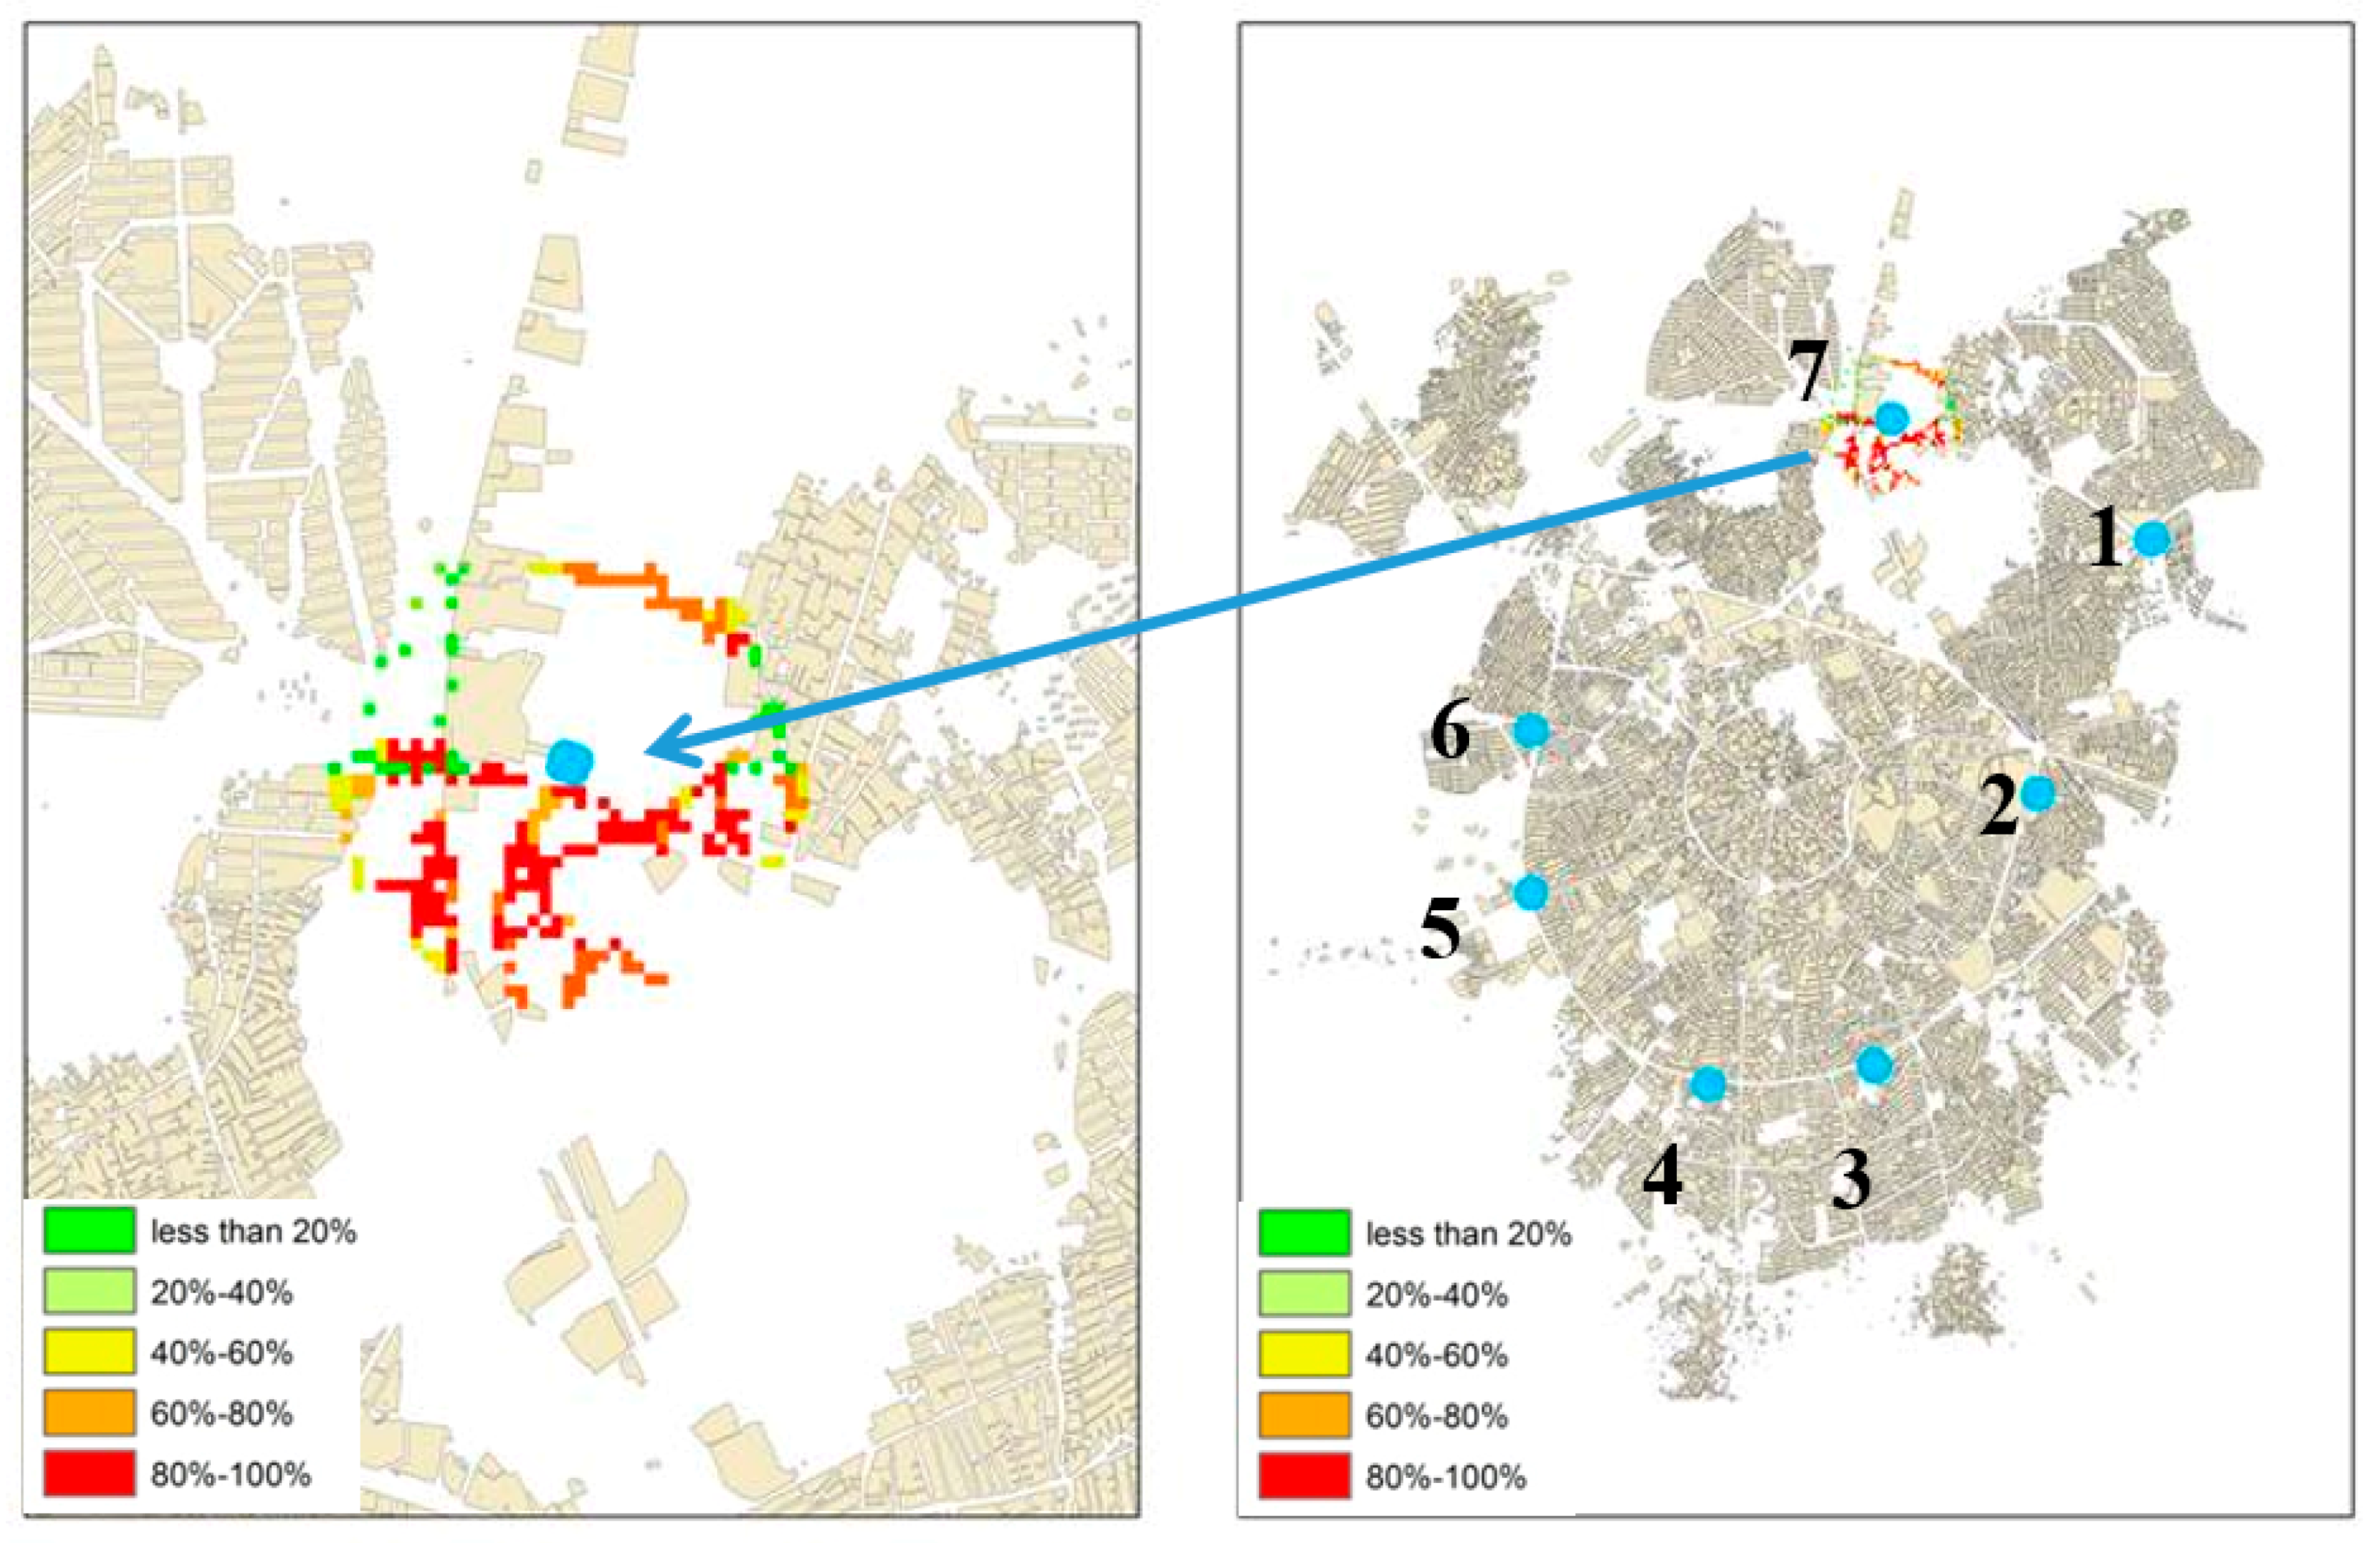
Note: all the visibility maps for tall buildings No. 1–7 are produced based on Matlab software coding and ArcGIS V10.3 outputs. In the images on the right, the blue dots show the location of seven hypothetical tall buildings, which are enlarged on the left. In these images, red spots show the highest visibility of a tall building from urban spaces (80 to 100%) and the lowest is the green color, which is less than 20% of each of these urban spaces.
2.4. Case Study: City of Hamedan
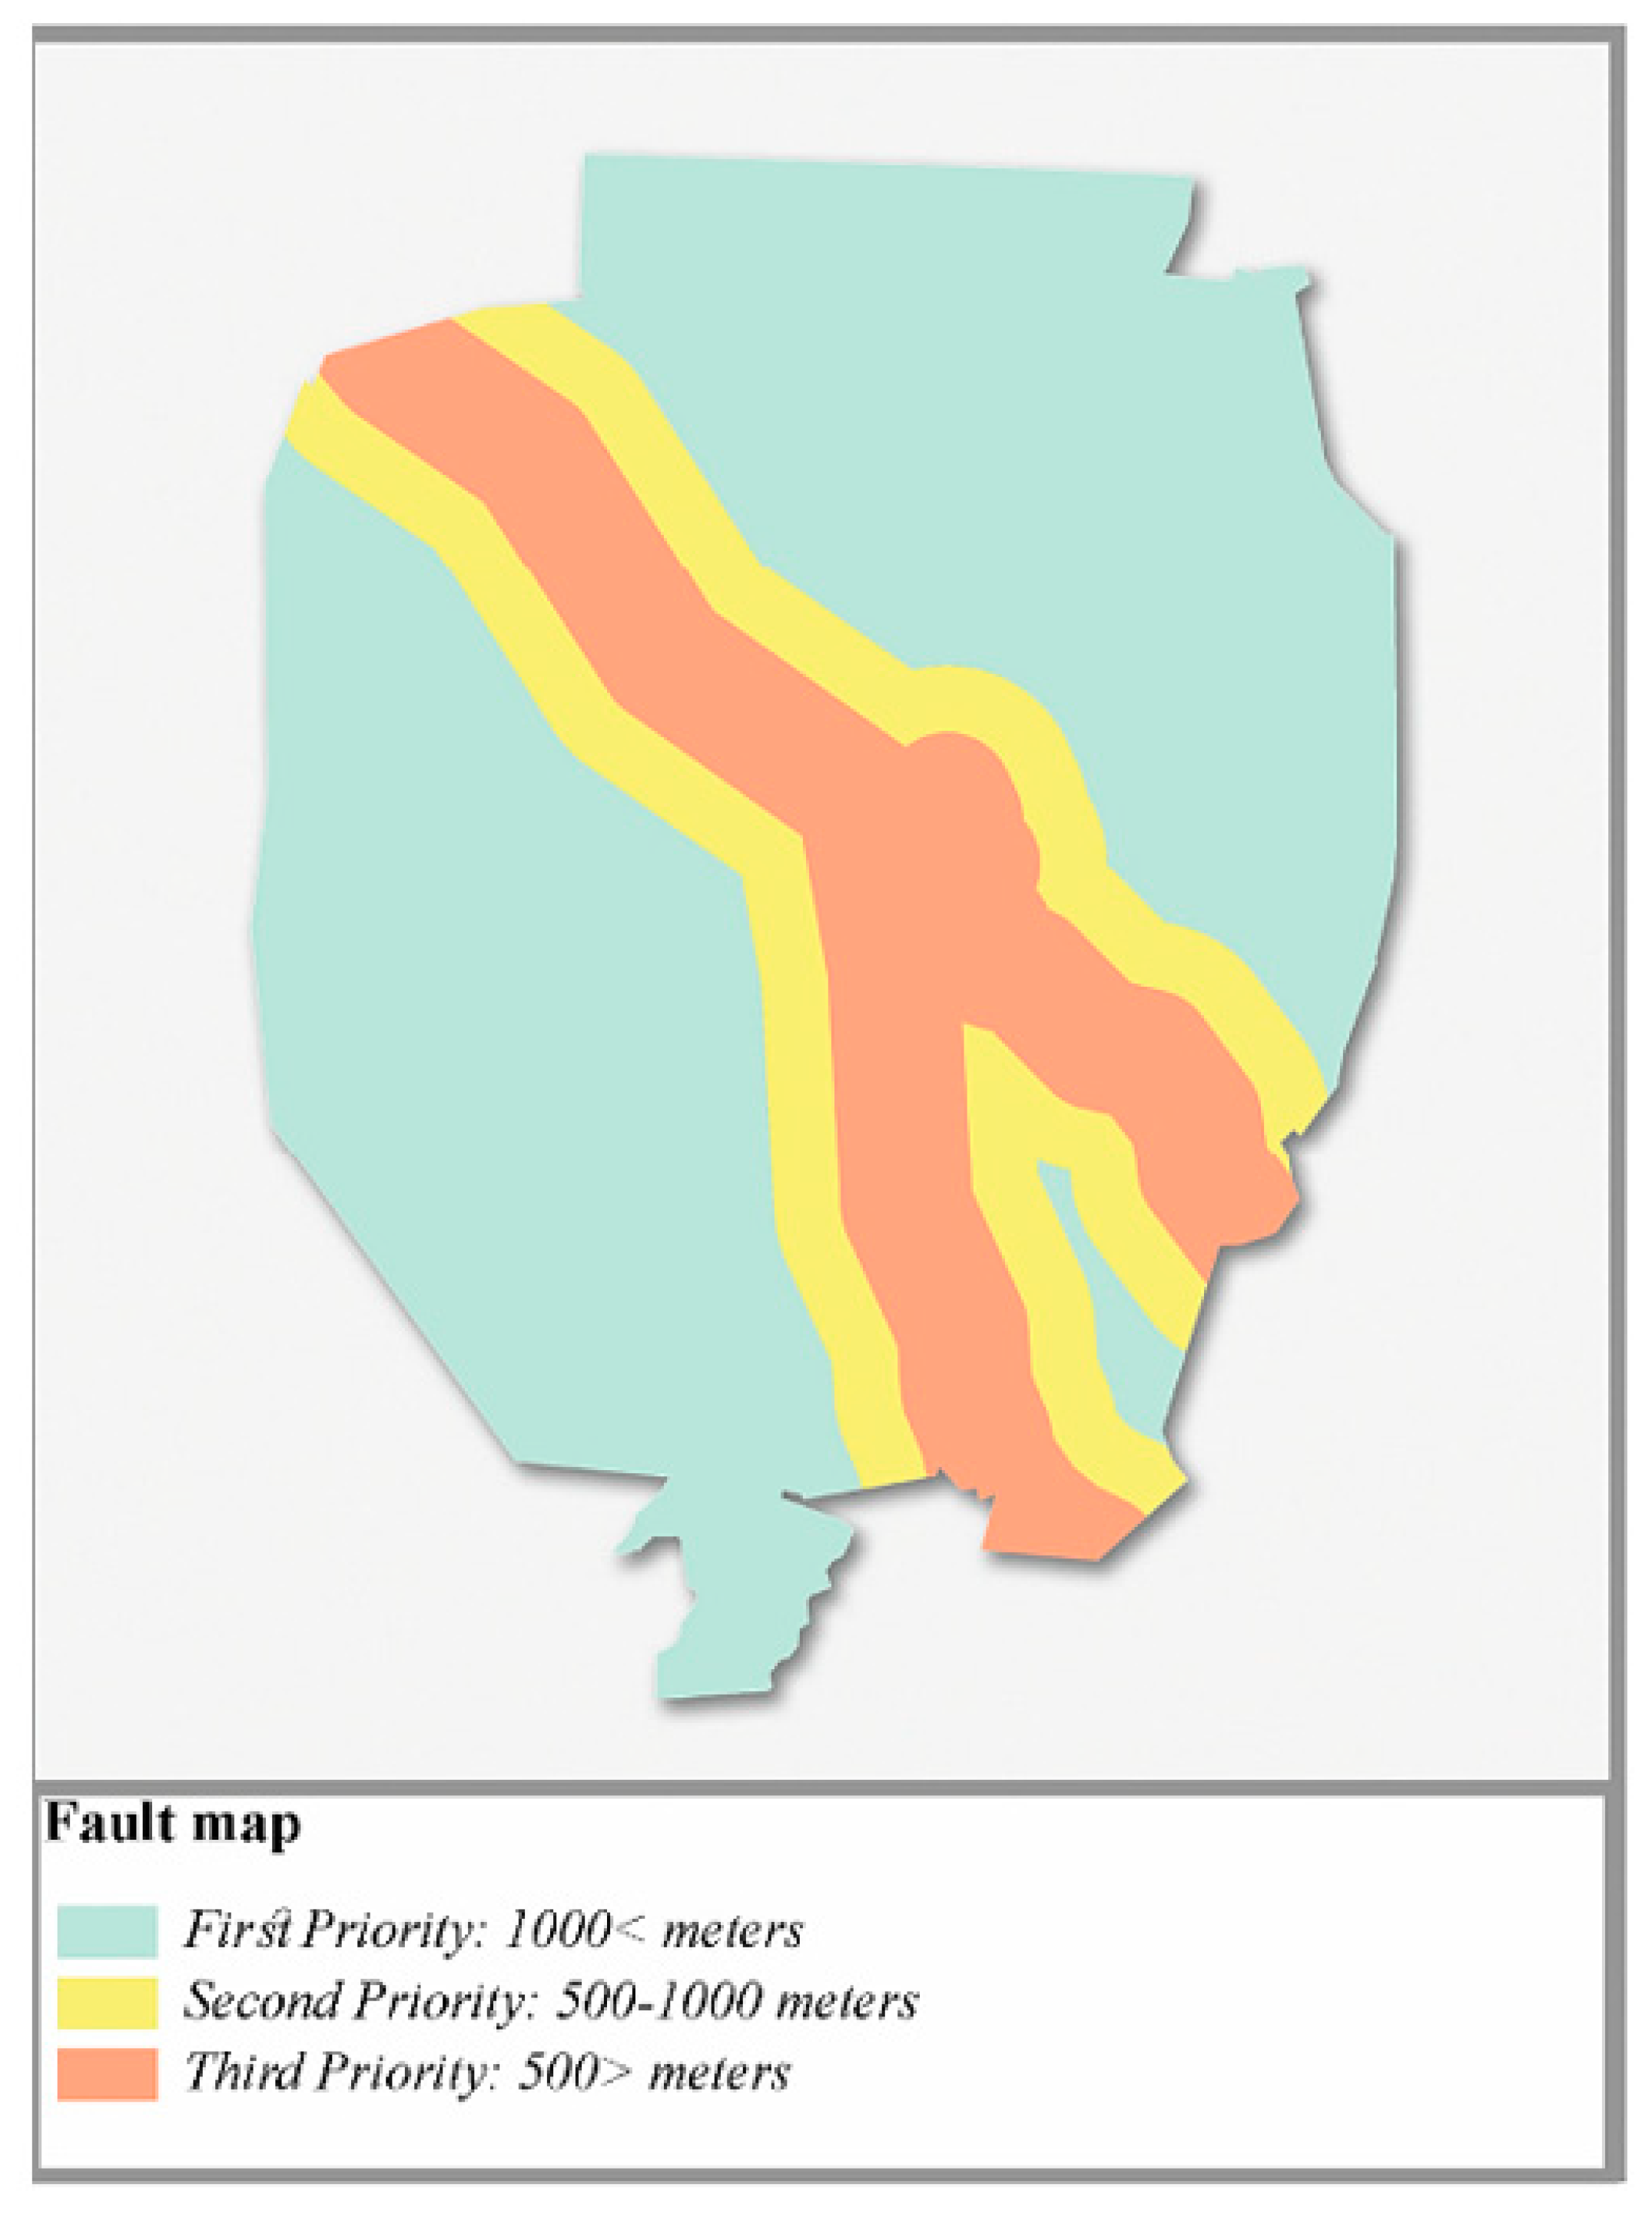
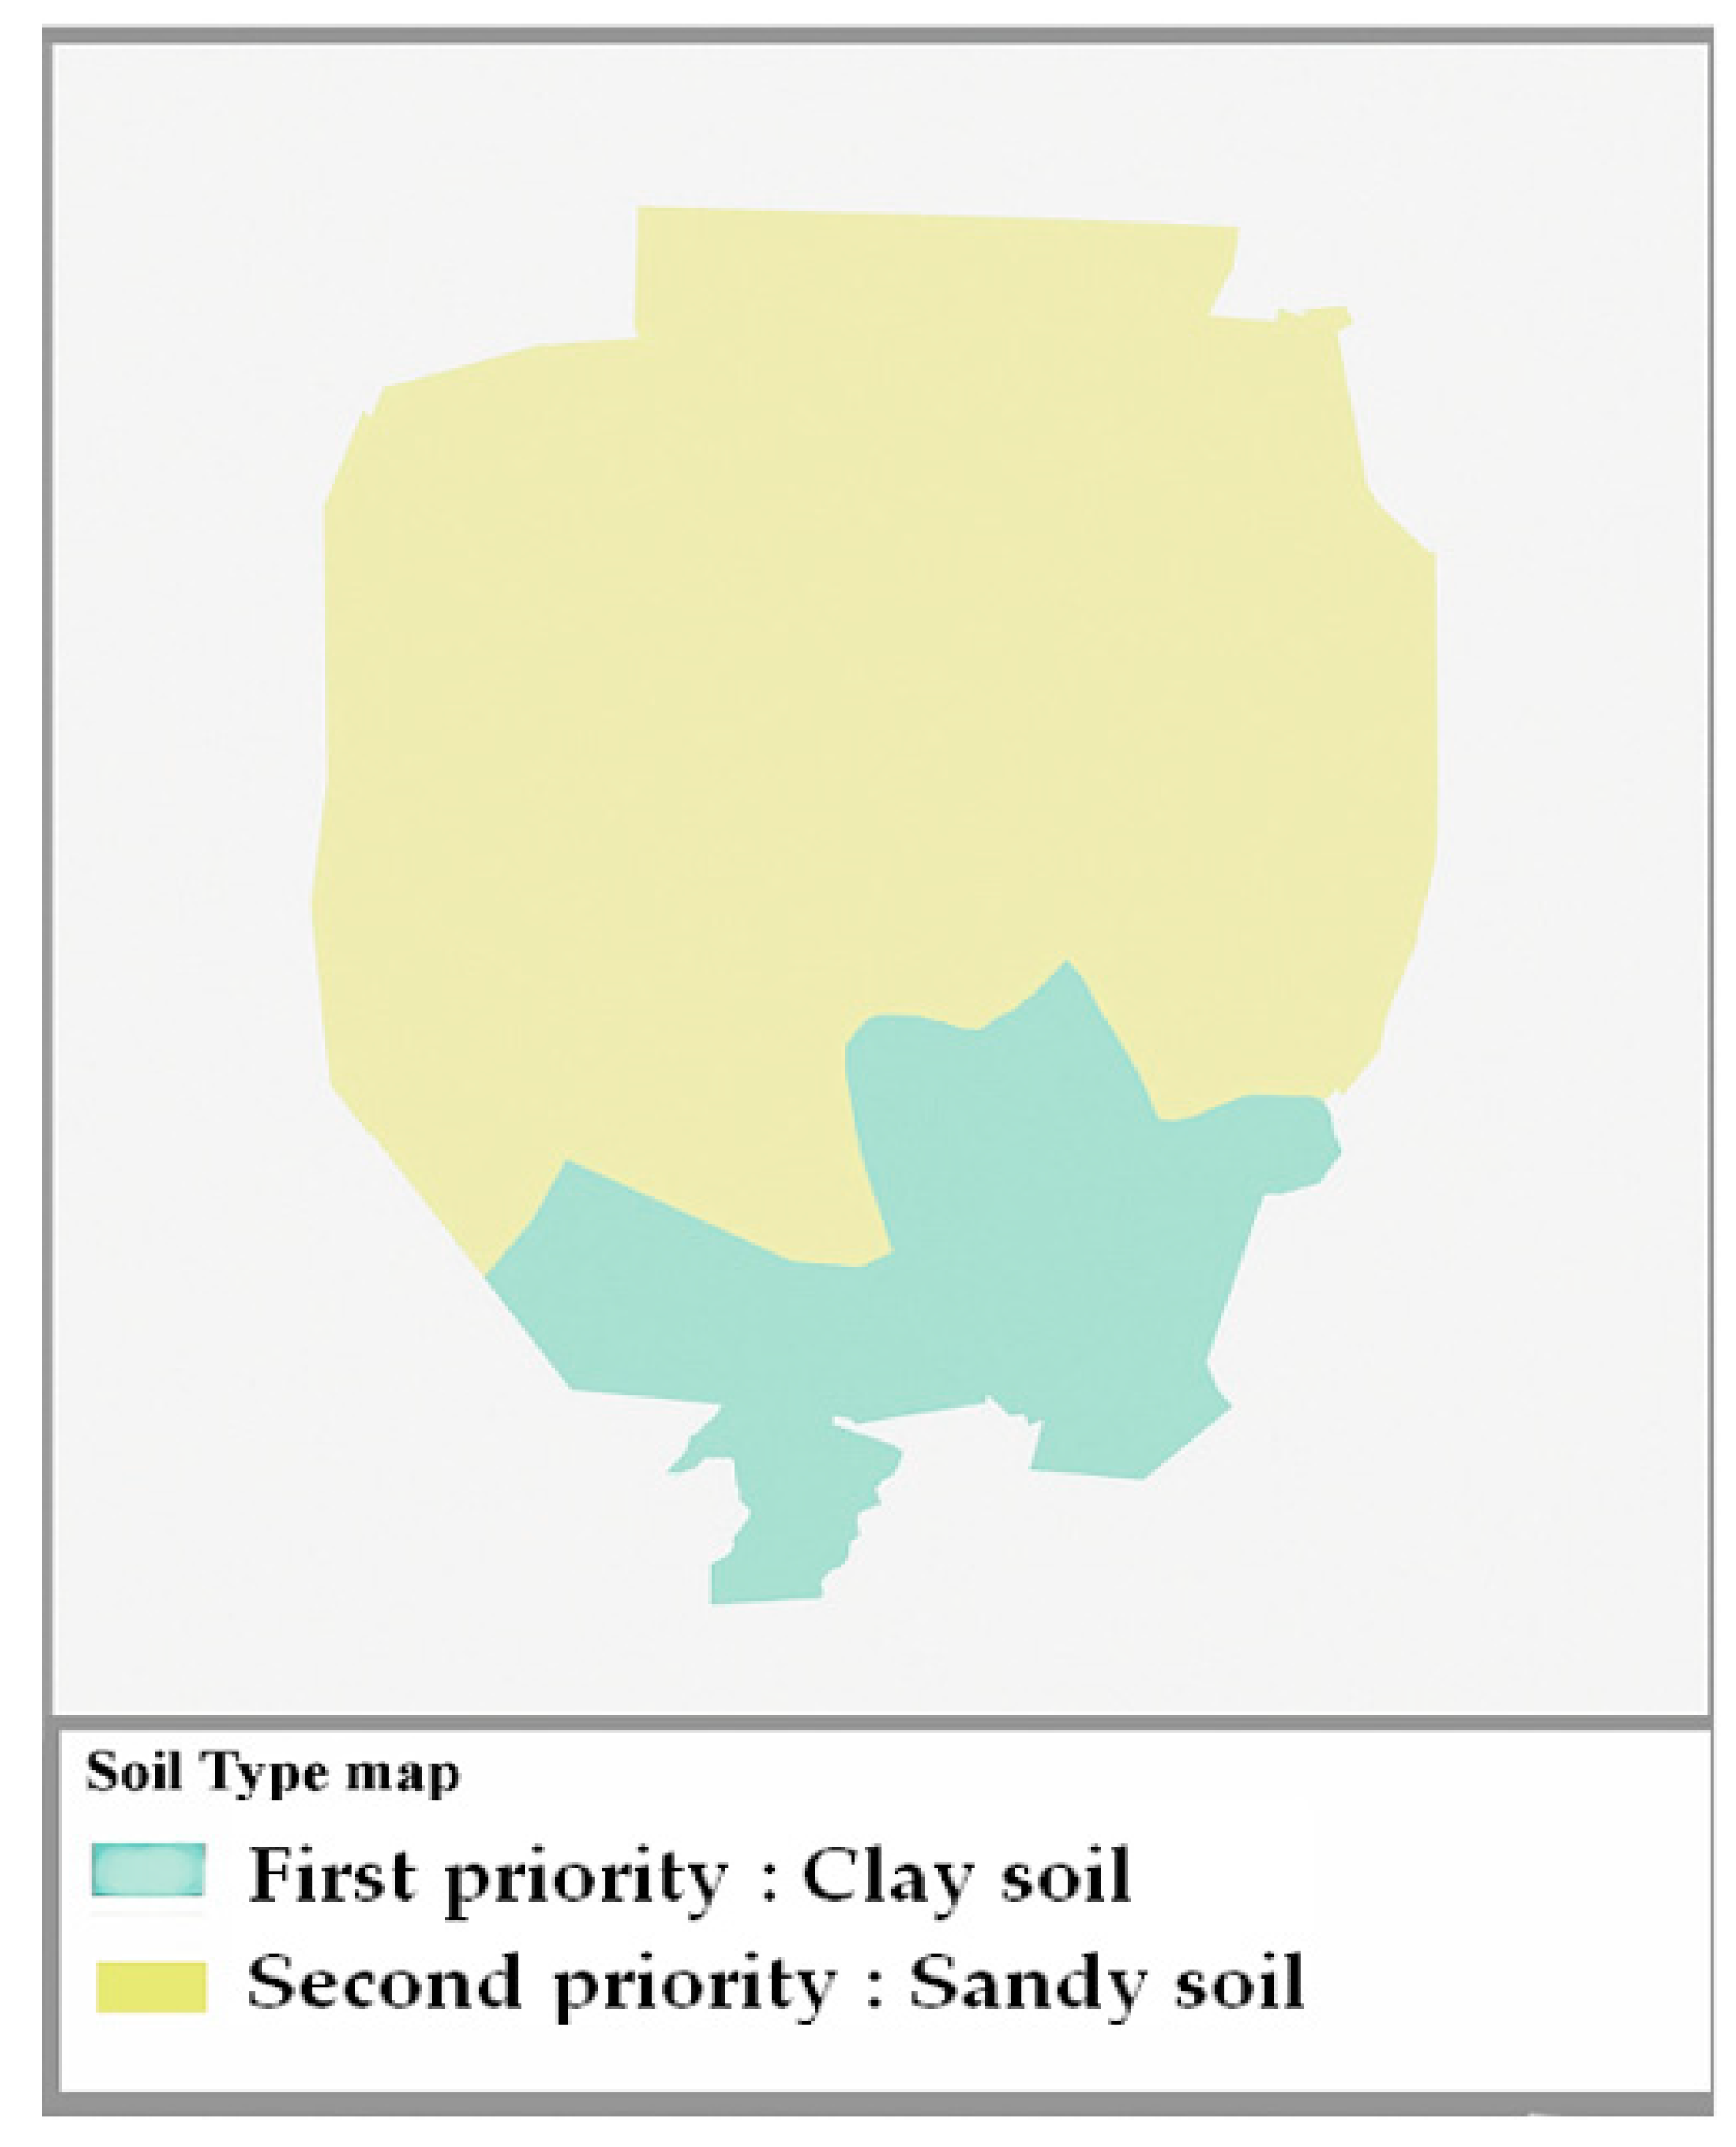
The city of Hamedan is located on the west side of Iran and on the slope of Alvand Mountain. The northern side of the city’s height is 1780 m, and at the end of the southern side, it reaches 1950 m; this causes a steeper slope on the northern side of the city. Hamedan’s soil categories are composed of two types: clay and sandy soil. In this city, two main faults exist that begin from the southeast and continue to the center and northwest; they are named Yelfan and Kashin [
31]. Five rivers have flowed through the city. However, today their surface is covered in some places, and they turned into sewers [
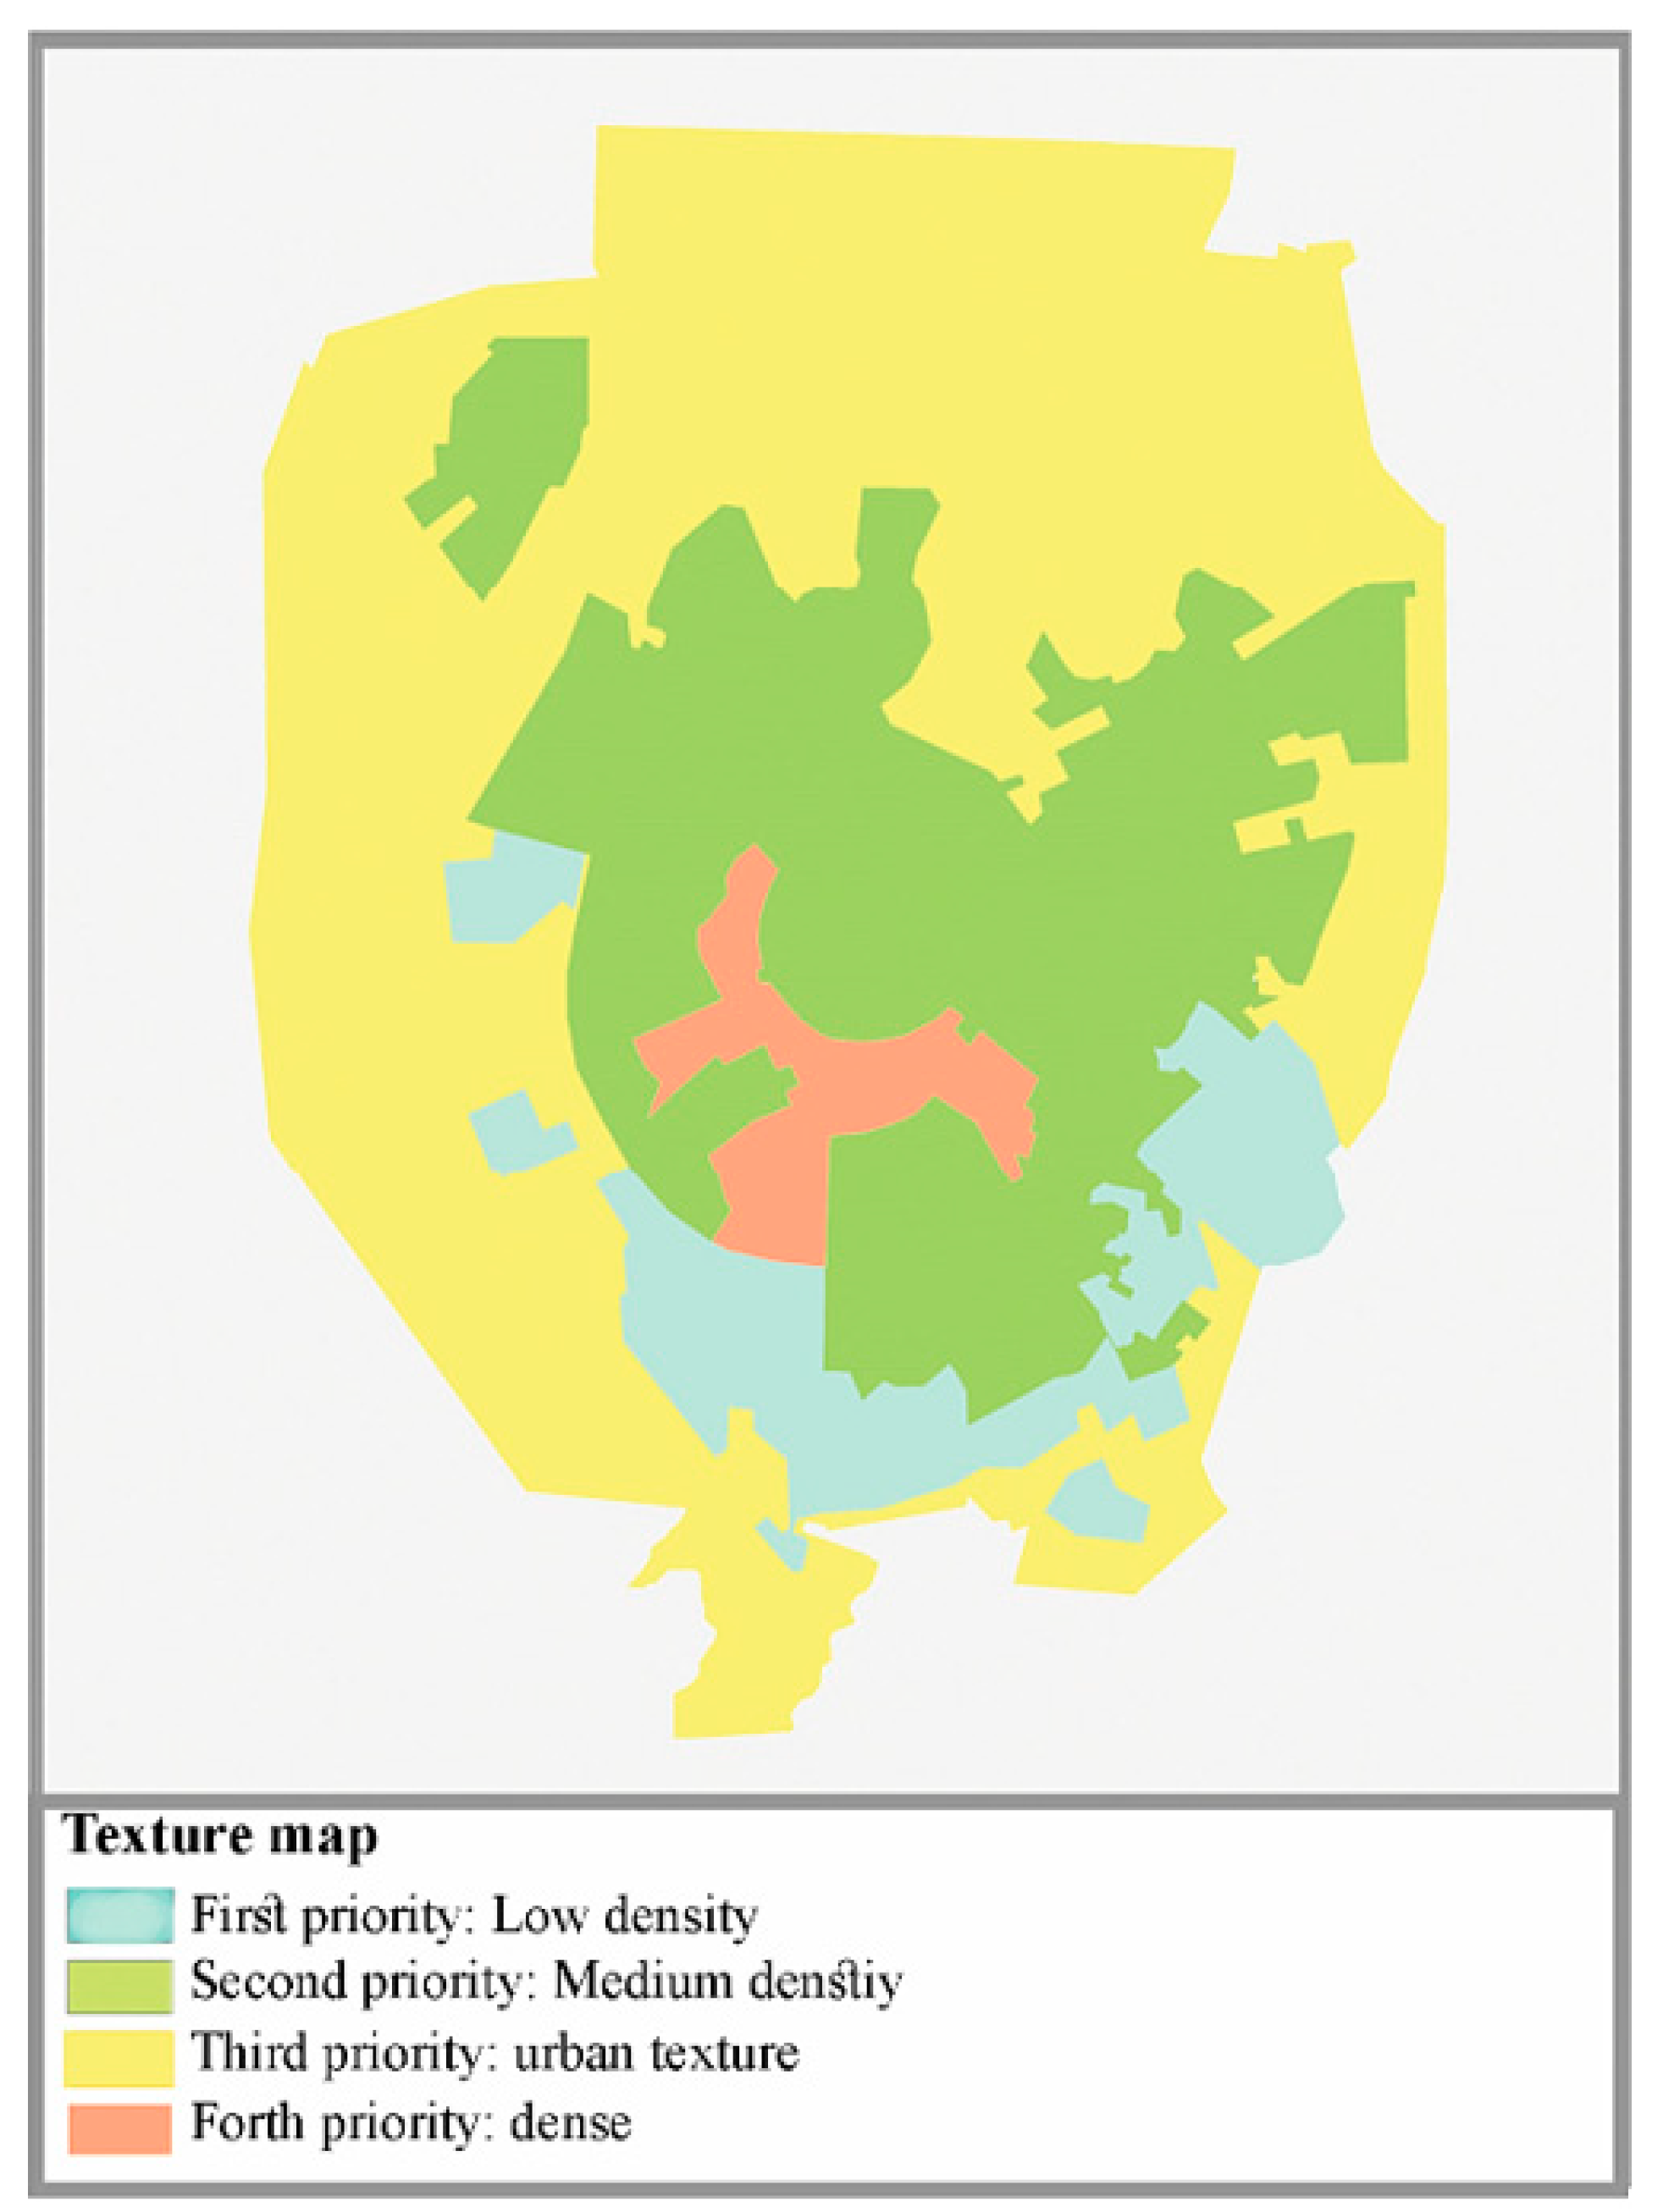
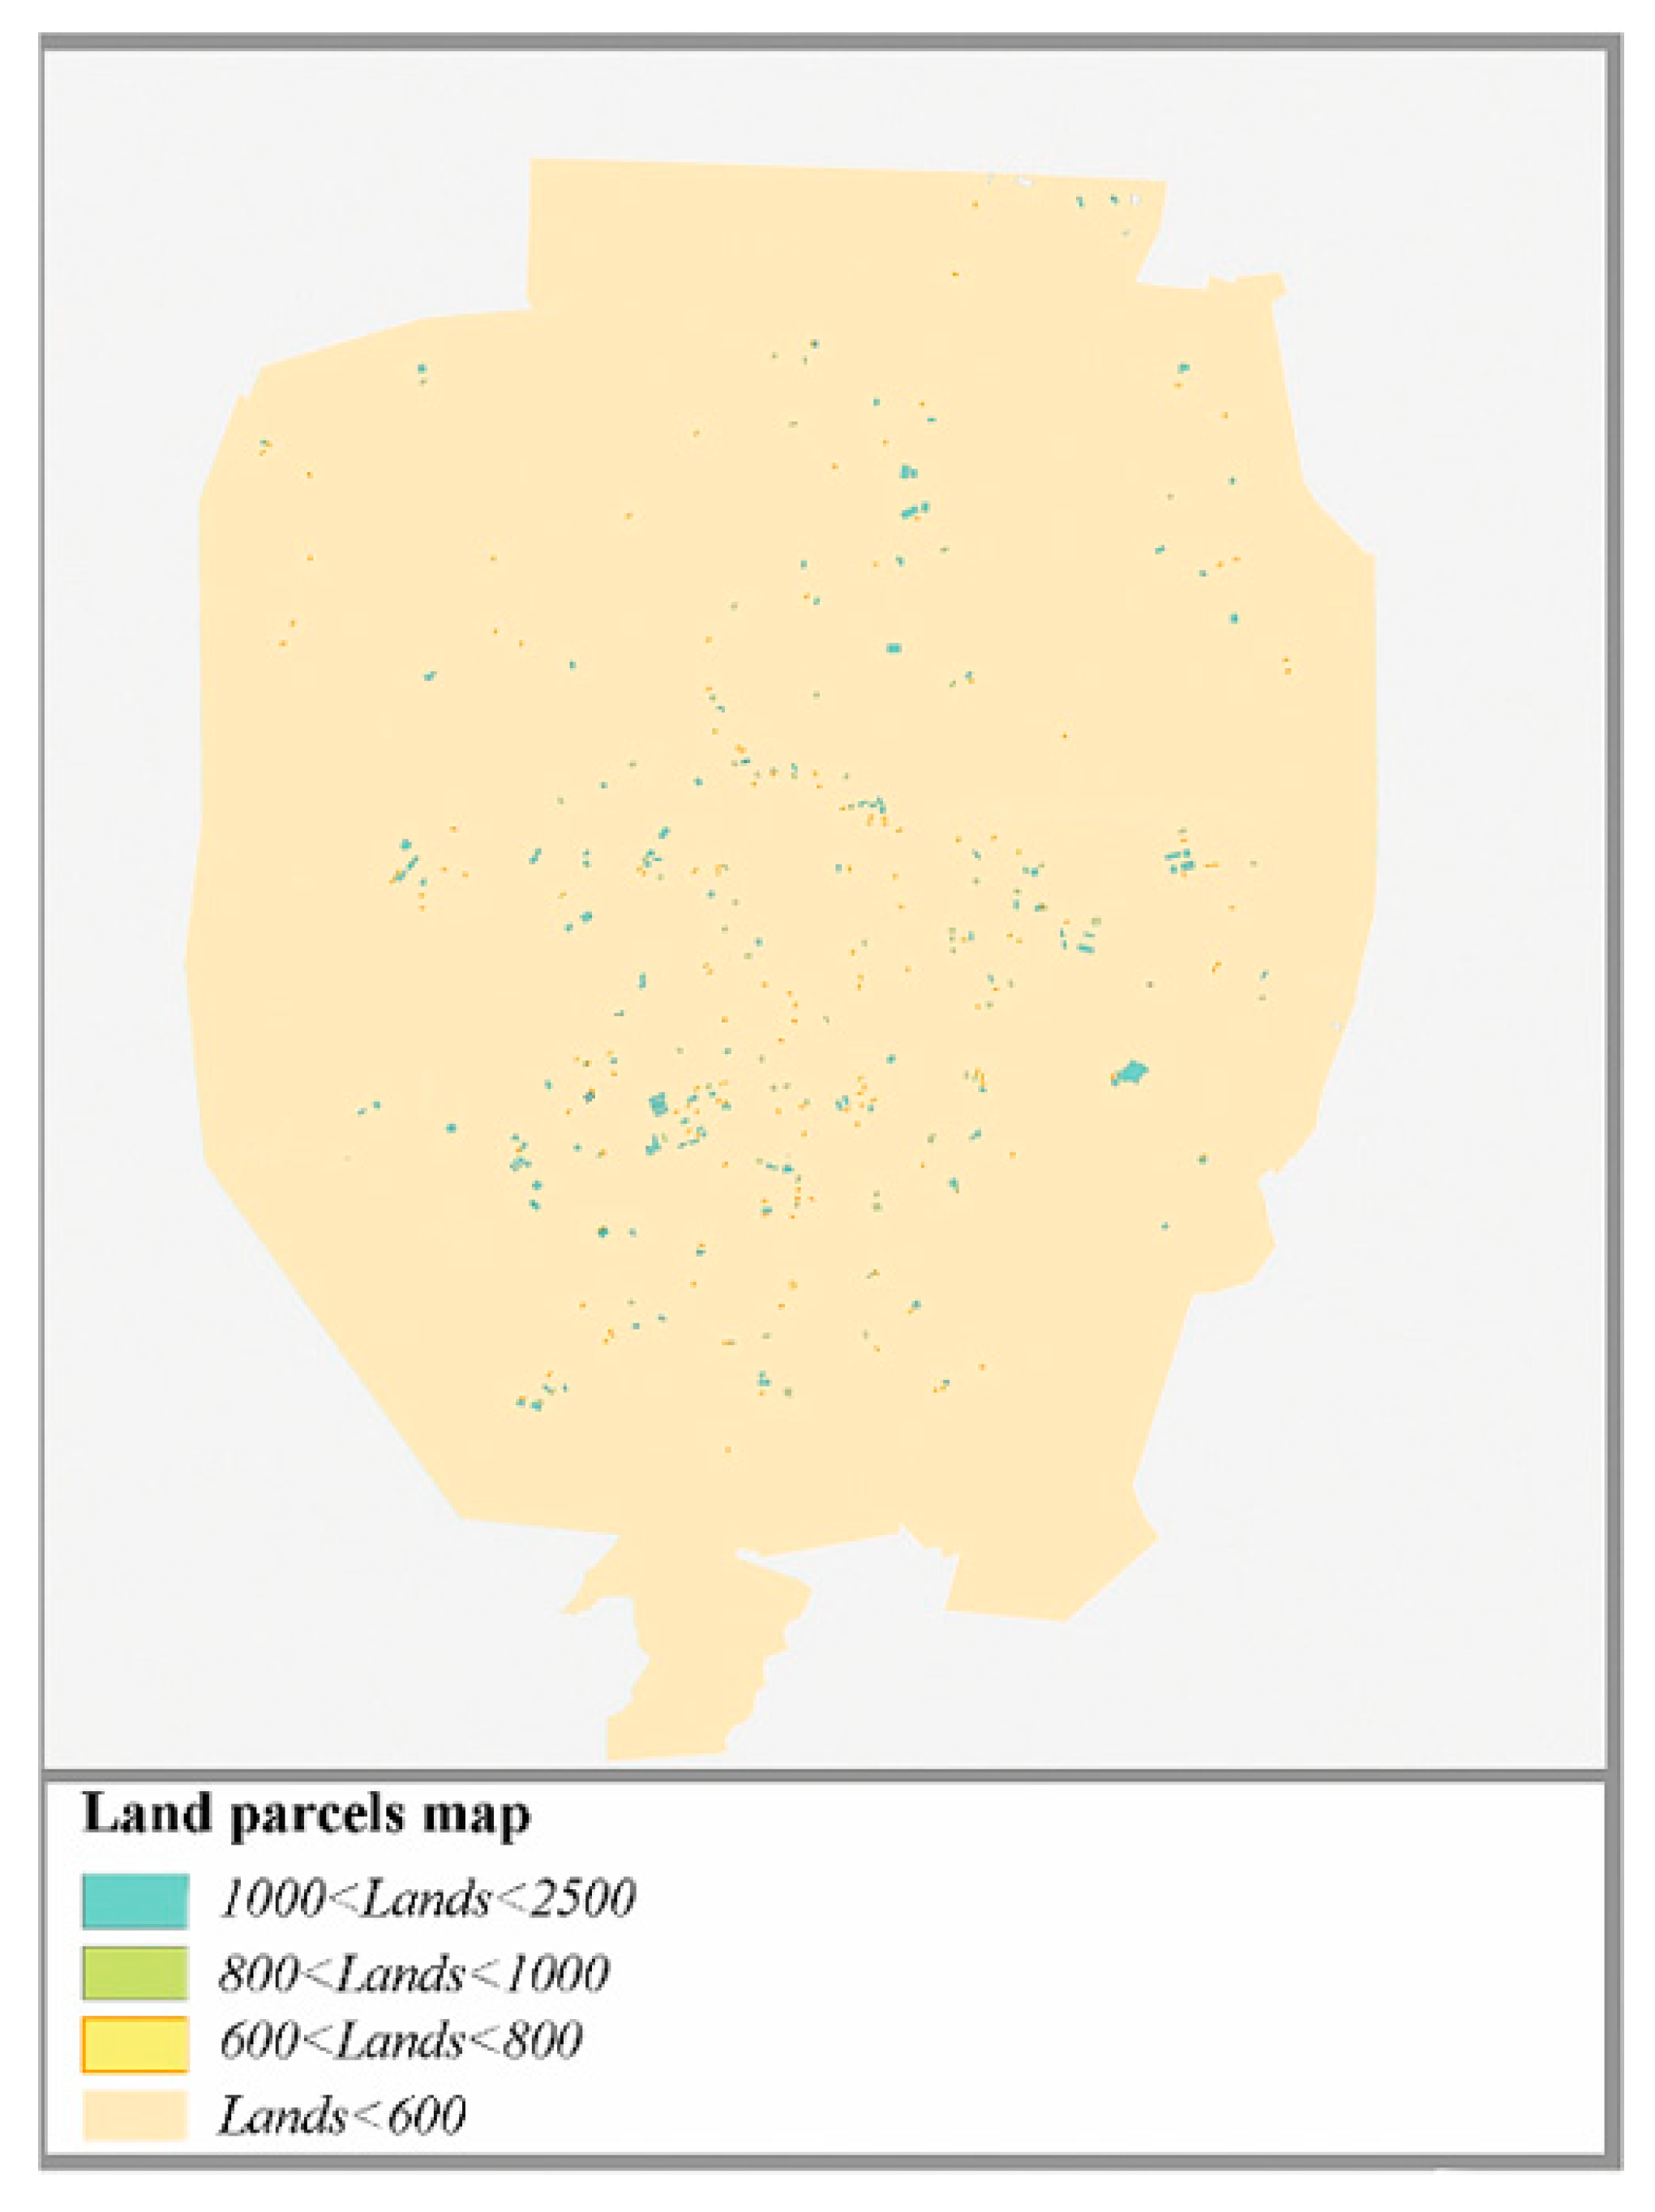
31], which explains surface and groundwater criteria. Urban texture, based on the maps prepared by the municipality, is divided into three sections: dense, medium density, and low density, and city parcels more significant than 600 m
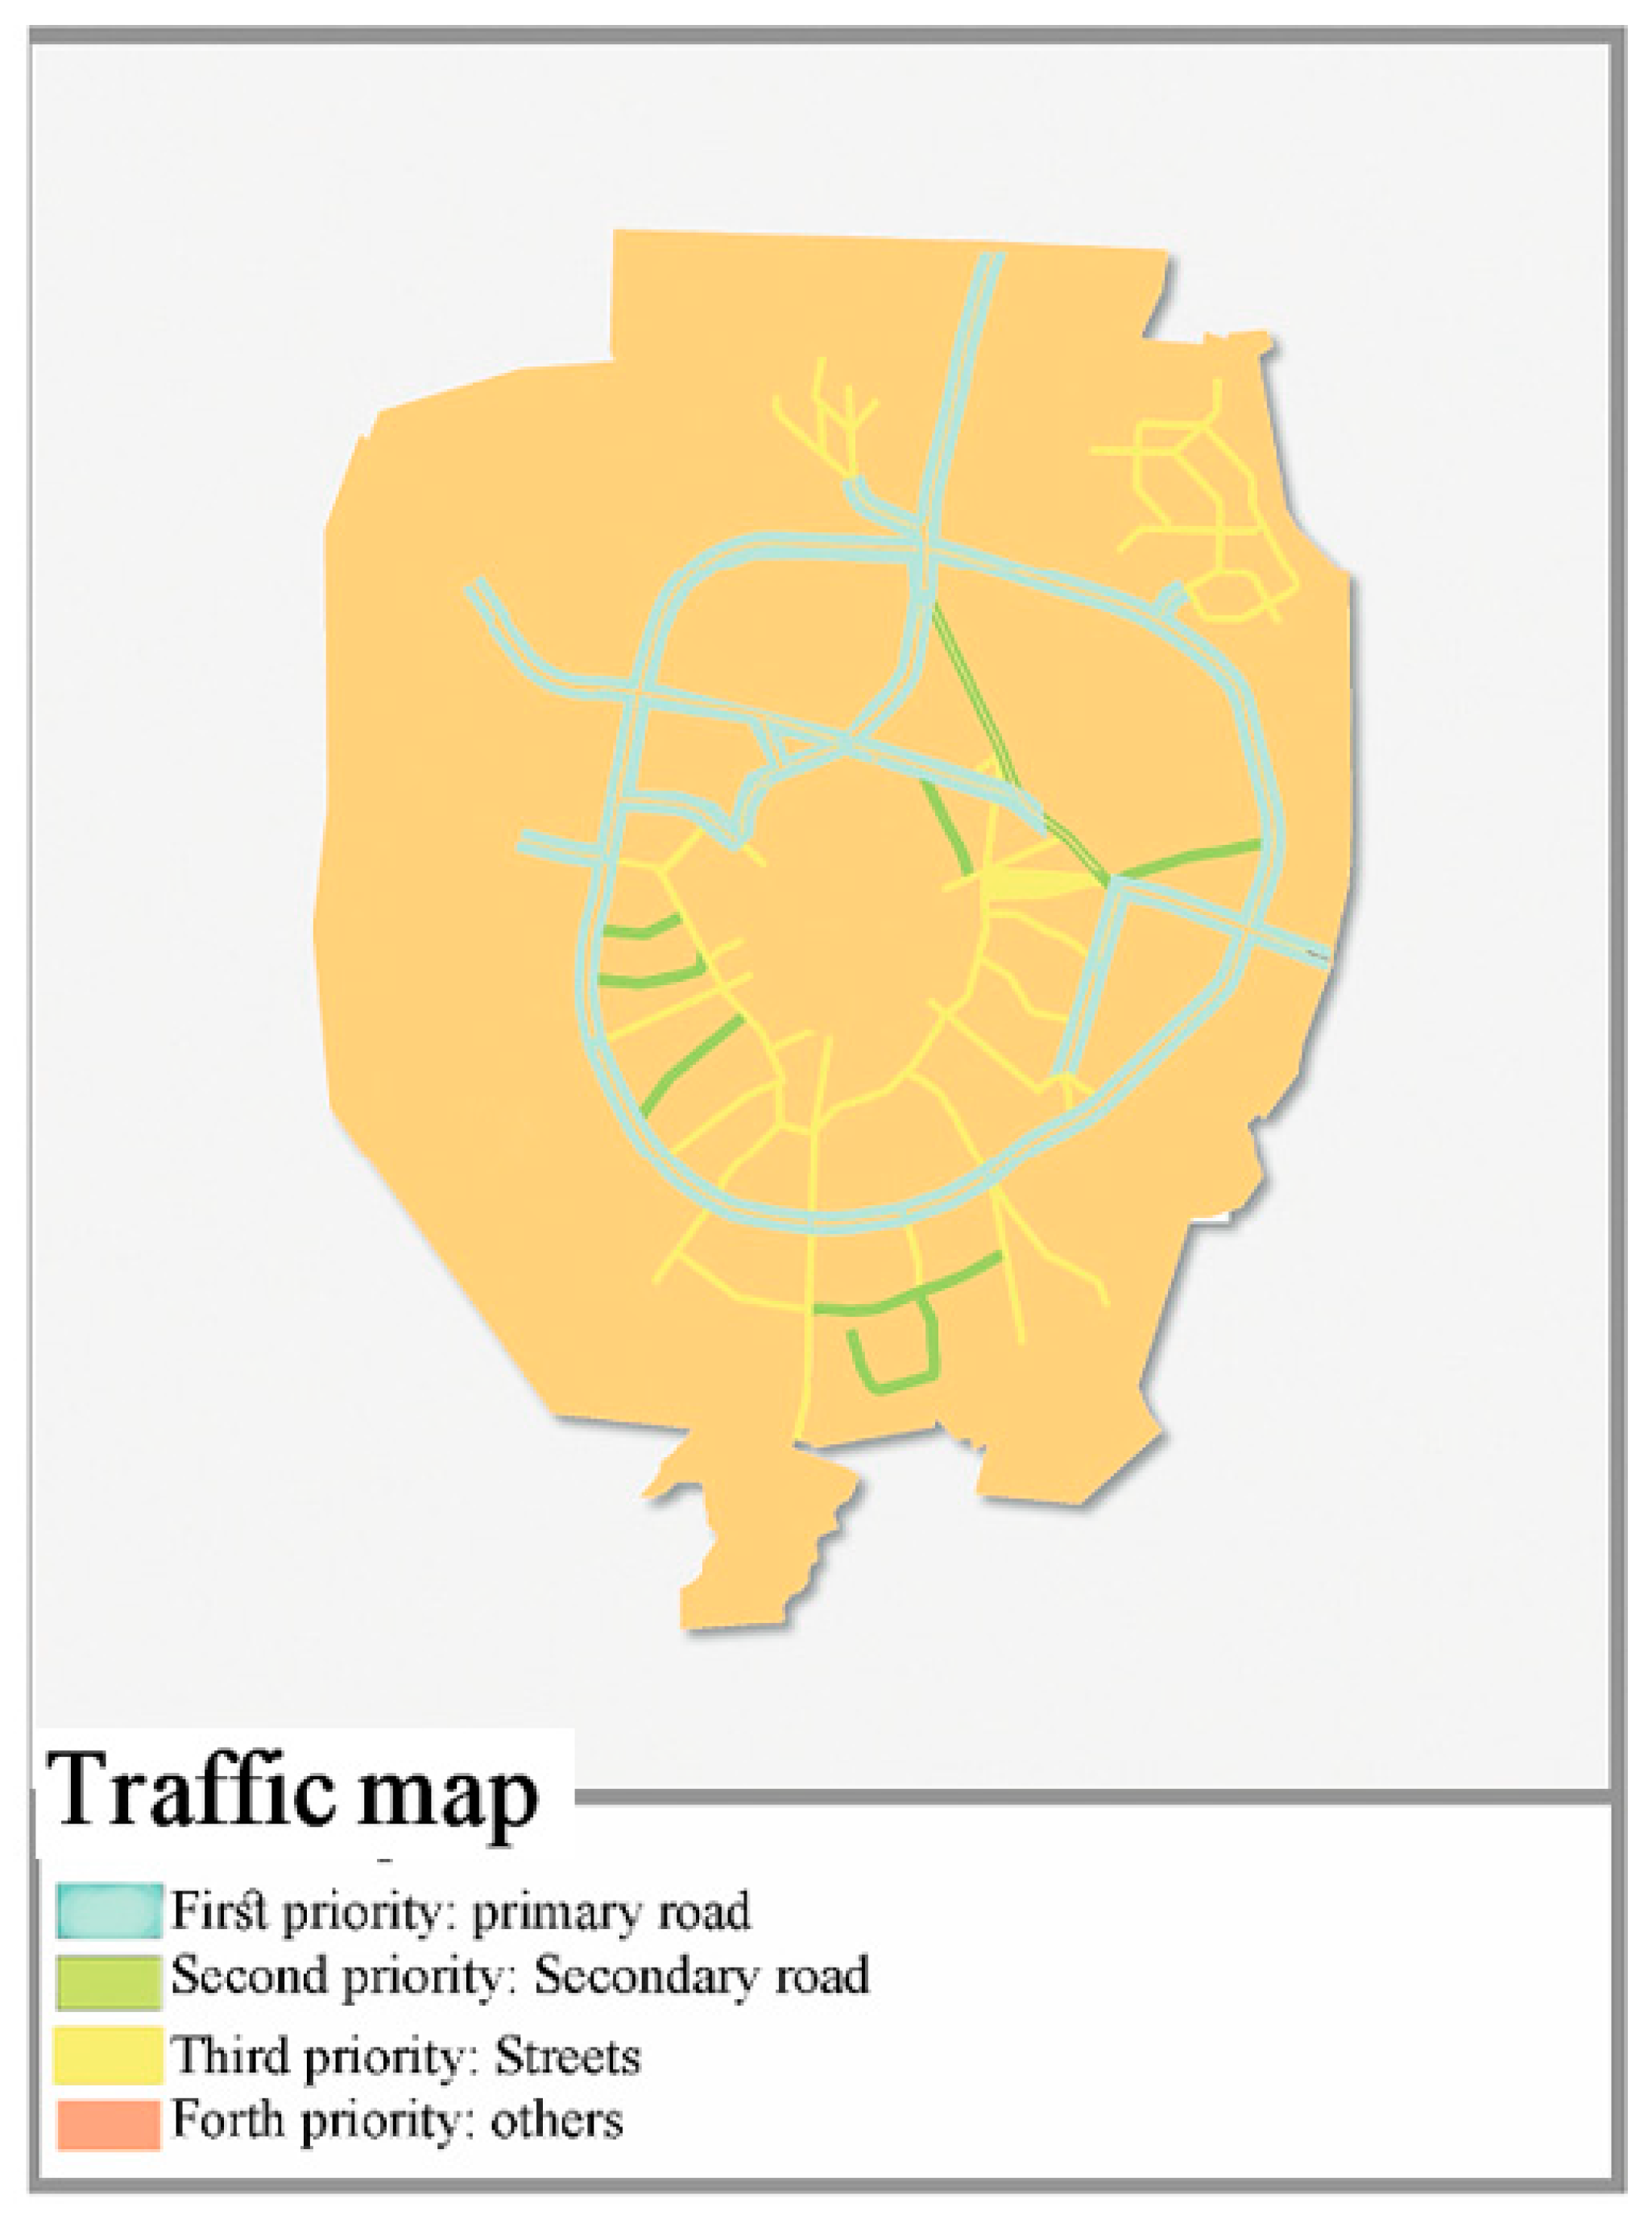
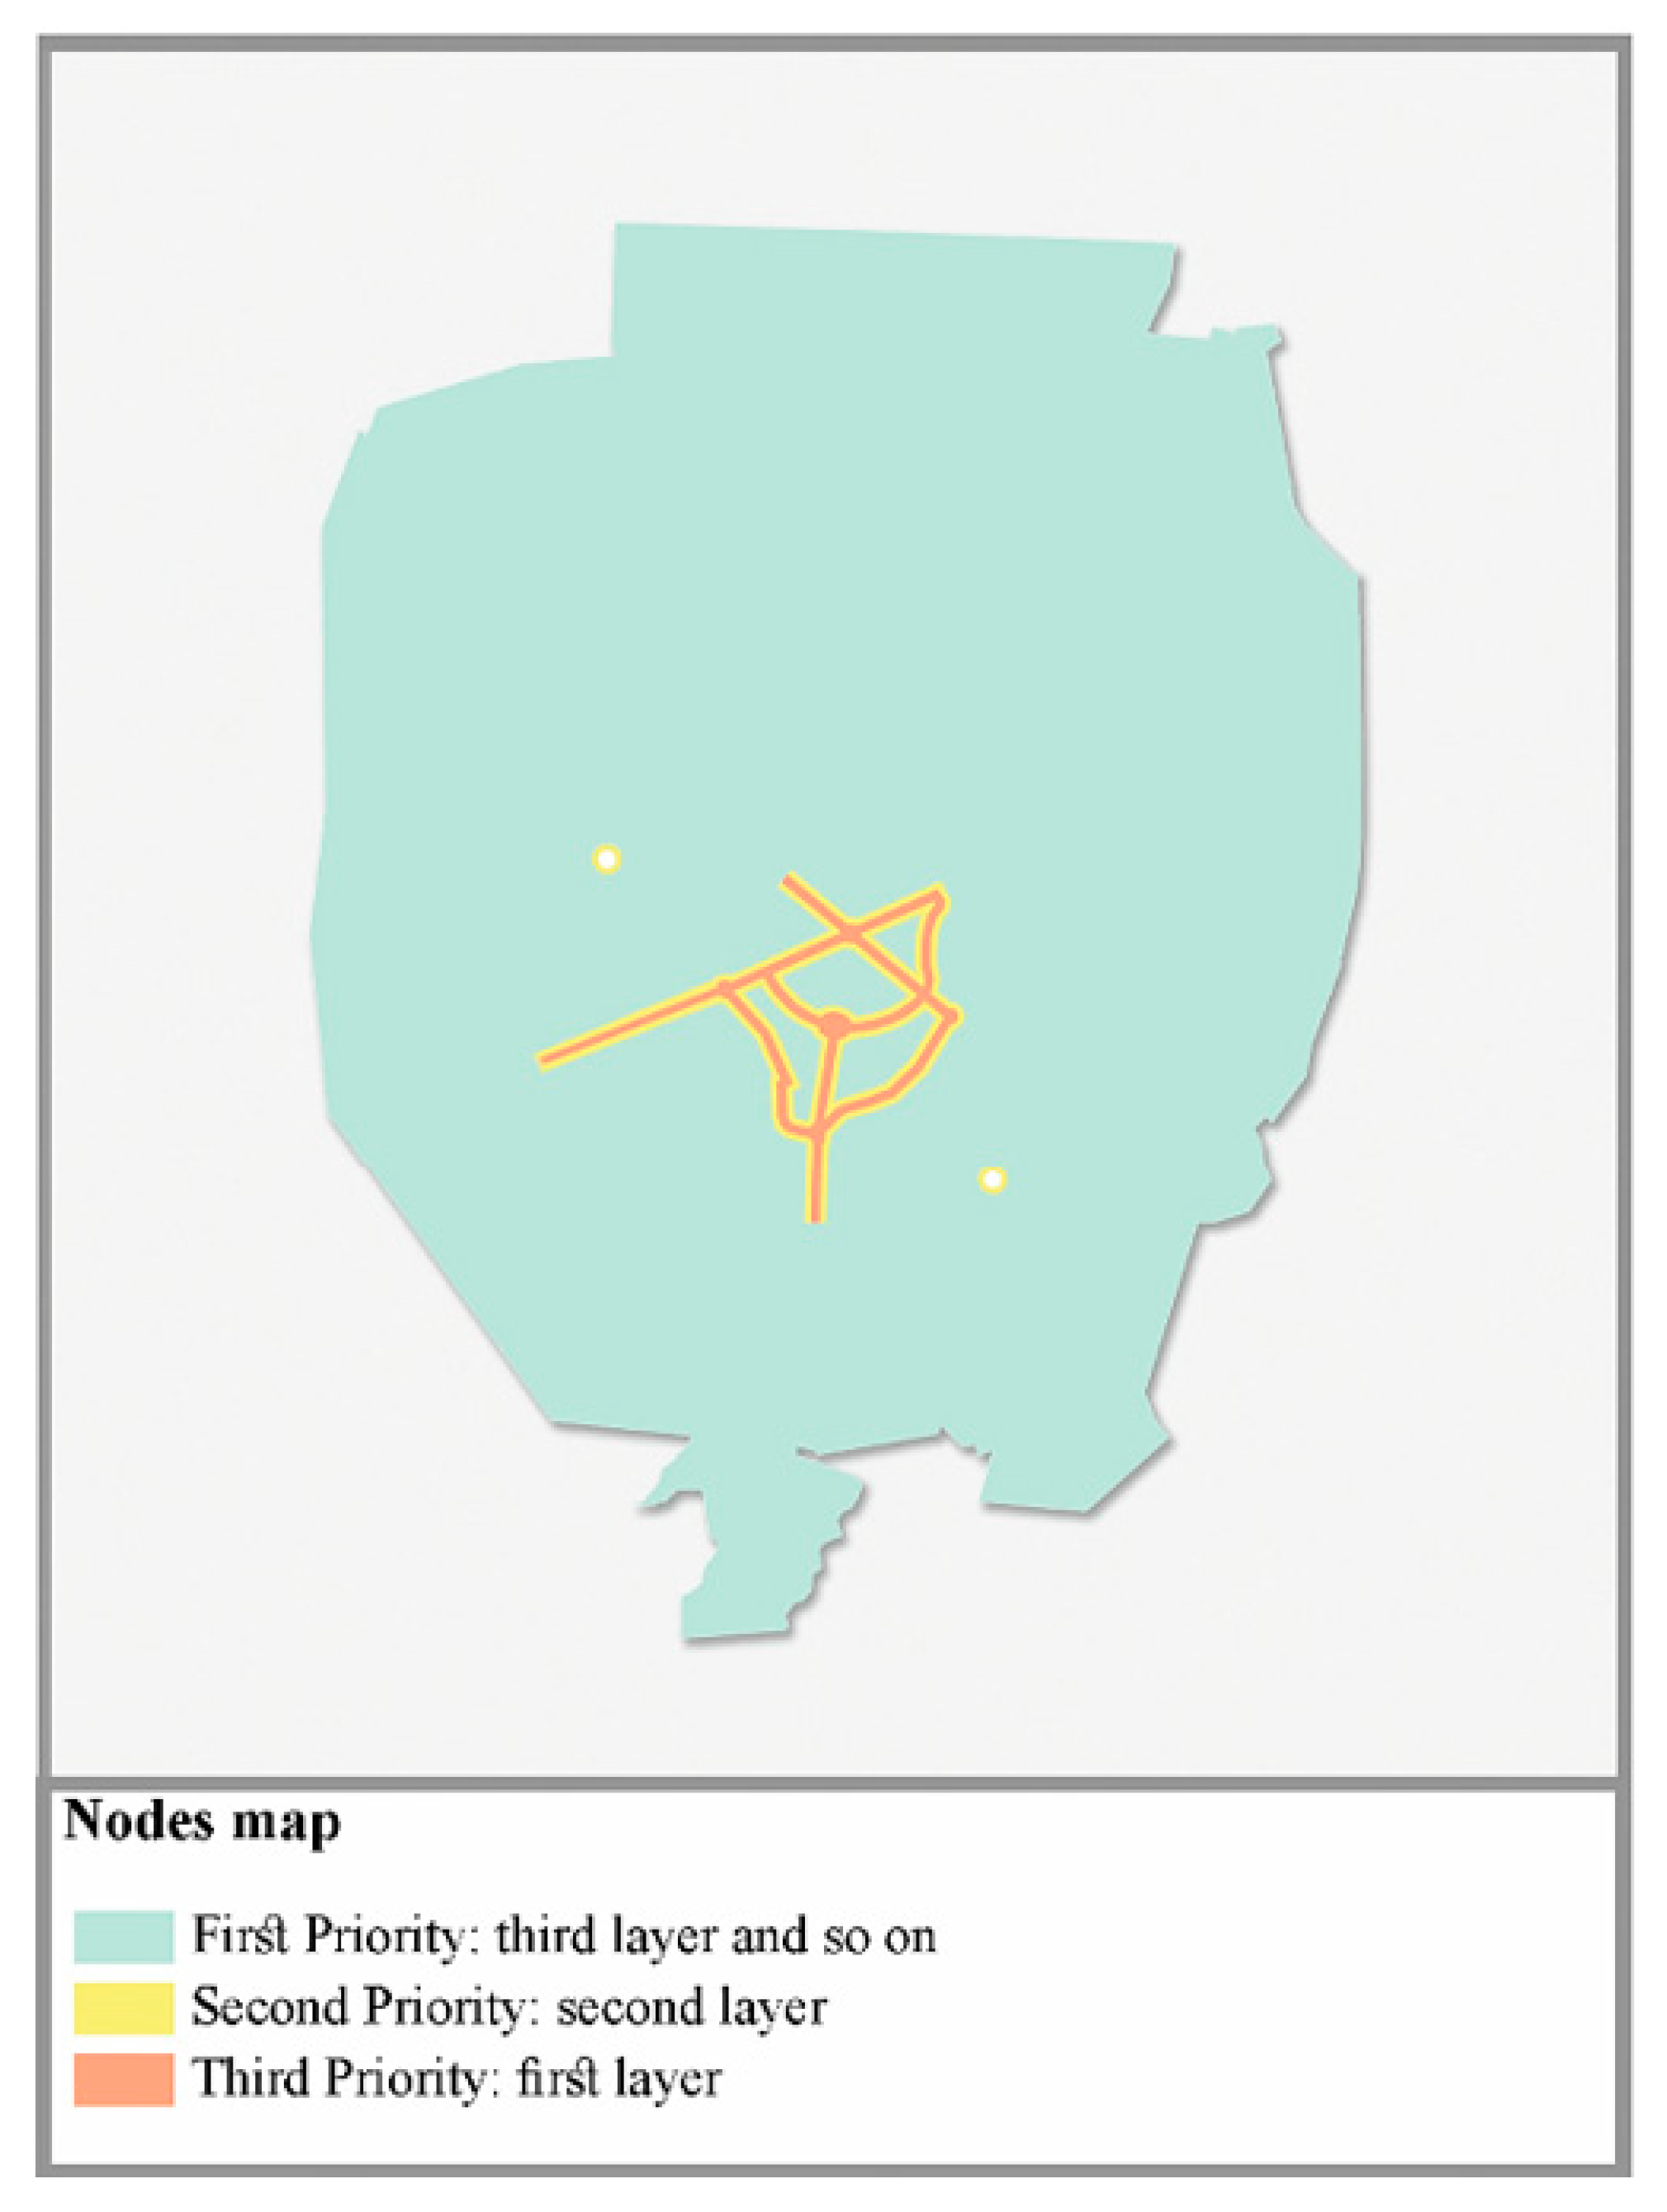
2 are identified and categorized by ArcGIS V10.3 software. Road maps were prepared to cover accessibility and transportation criteria, and adjacent layers of these roads have been prioritized based on the street width. A traffic node map was arranged through field study and surveys at different hours of the day. Socio-economic features were prepared by referring to the Statistics Organization, and land price information was requested from the experts of the land pricing department and field study. The calculation and prioritization of the region’s per capita area in treatment, training, green space, and urban facilities provided functional and land-use maps. The detailed plan explained land-use, buffers, and their compatibility.
3. Results
The research’s findings are presented in three main sections. The first section provides criteria and sub-criteria and their weights. The second section shows the appropriate regions in the city for constructing tall buildings through GIS maps. The third section clarifies proposed tall buildings’ visual impacts in proper lands.
3.1. Findings of the First Section: Criteria, Sub-Criteria and Their Weight
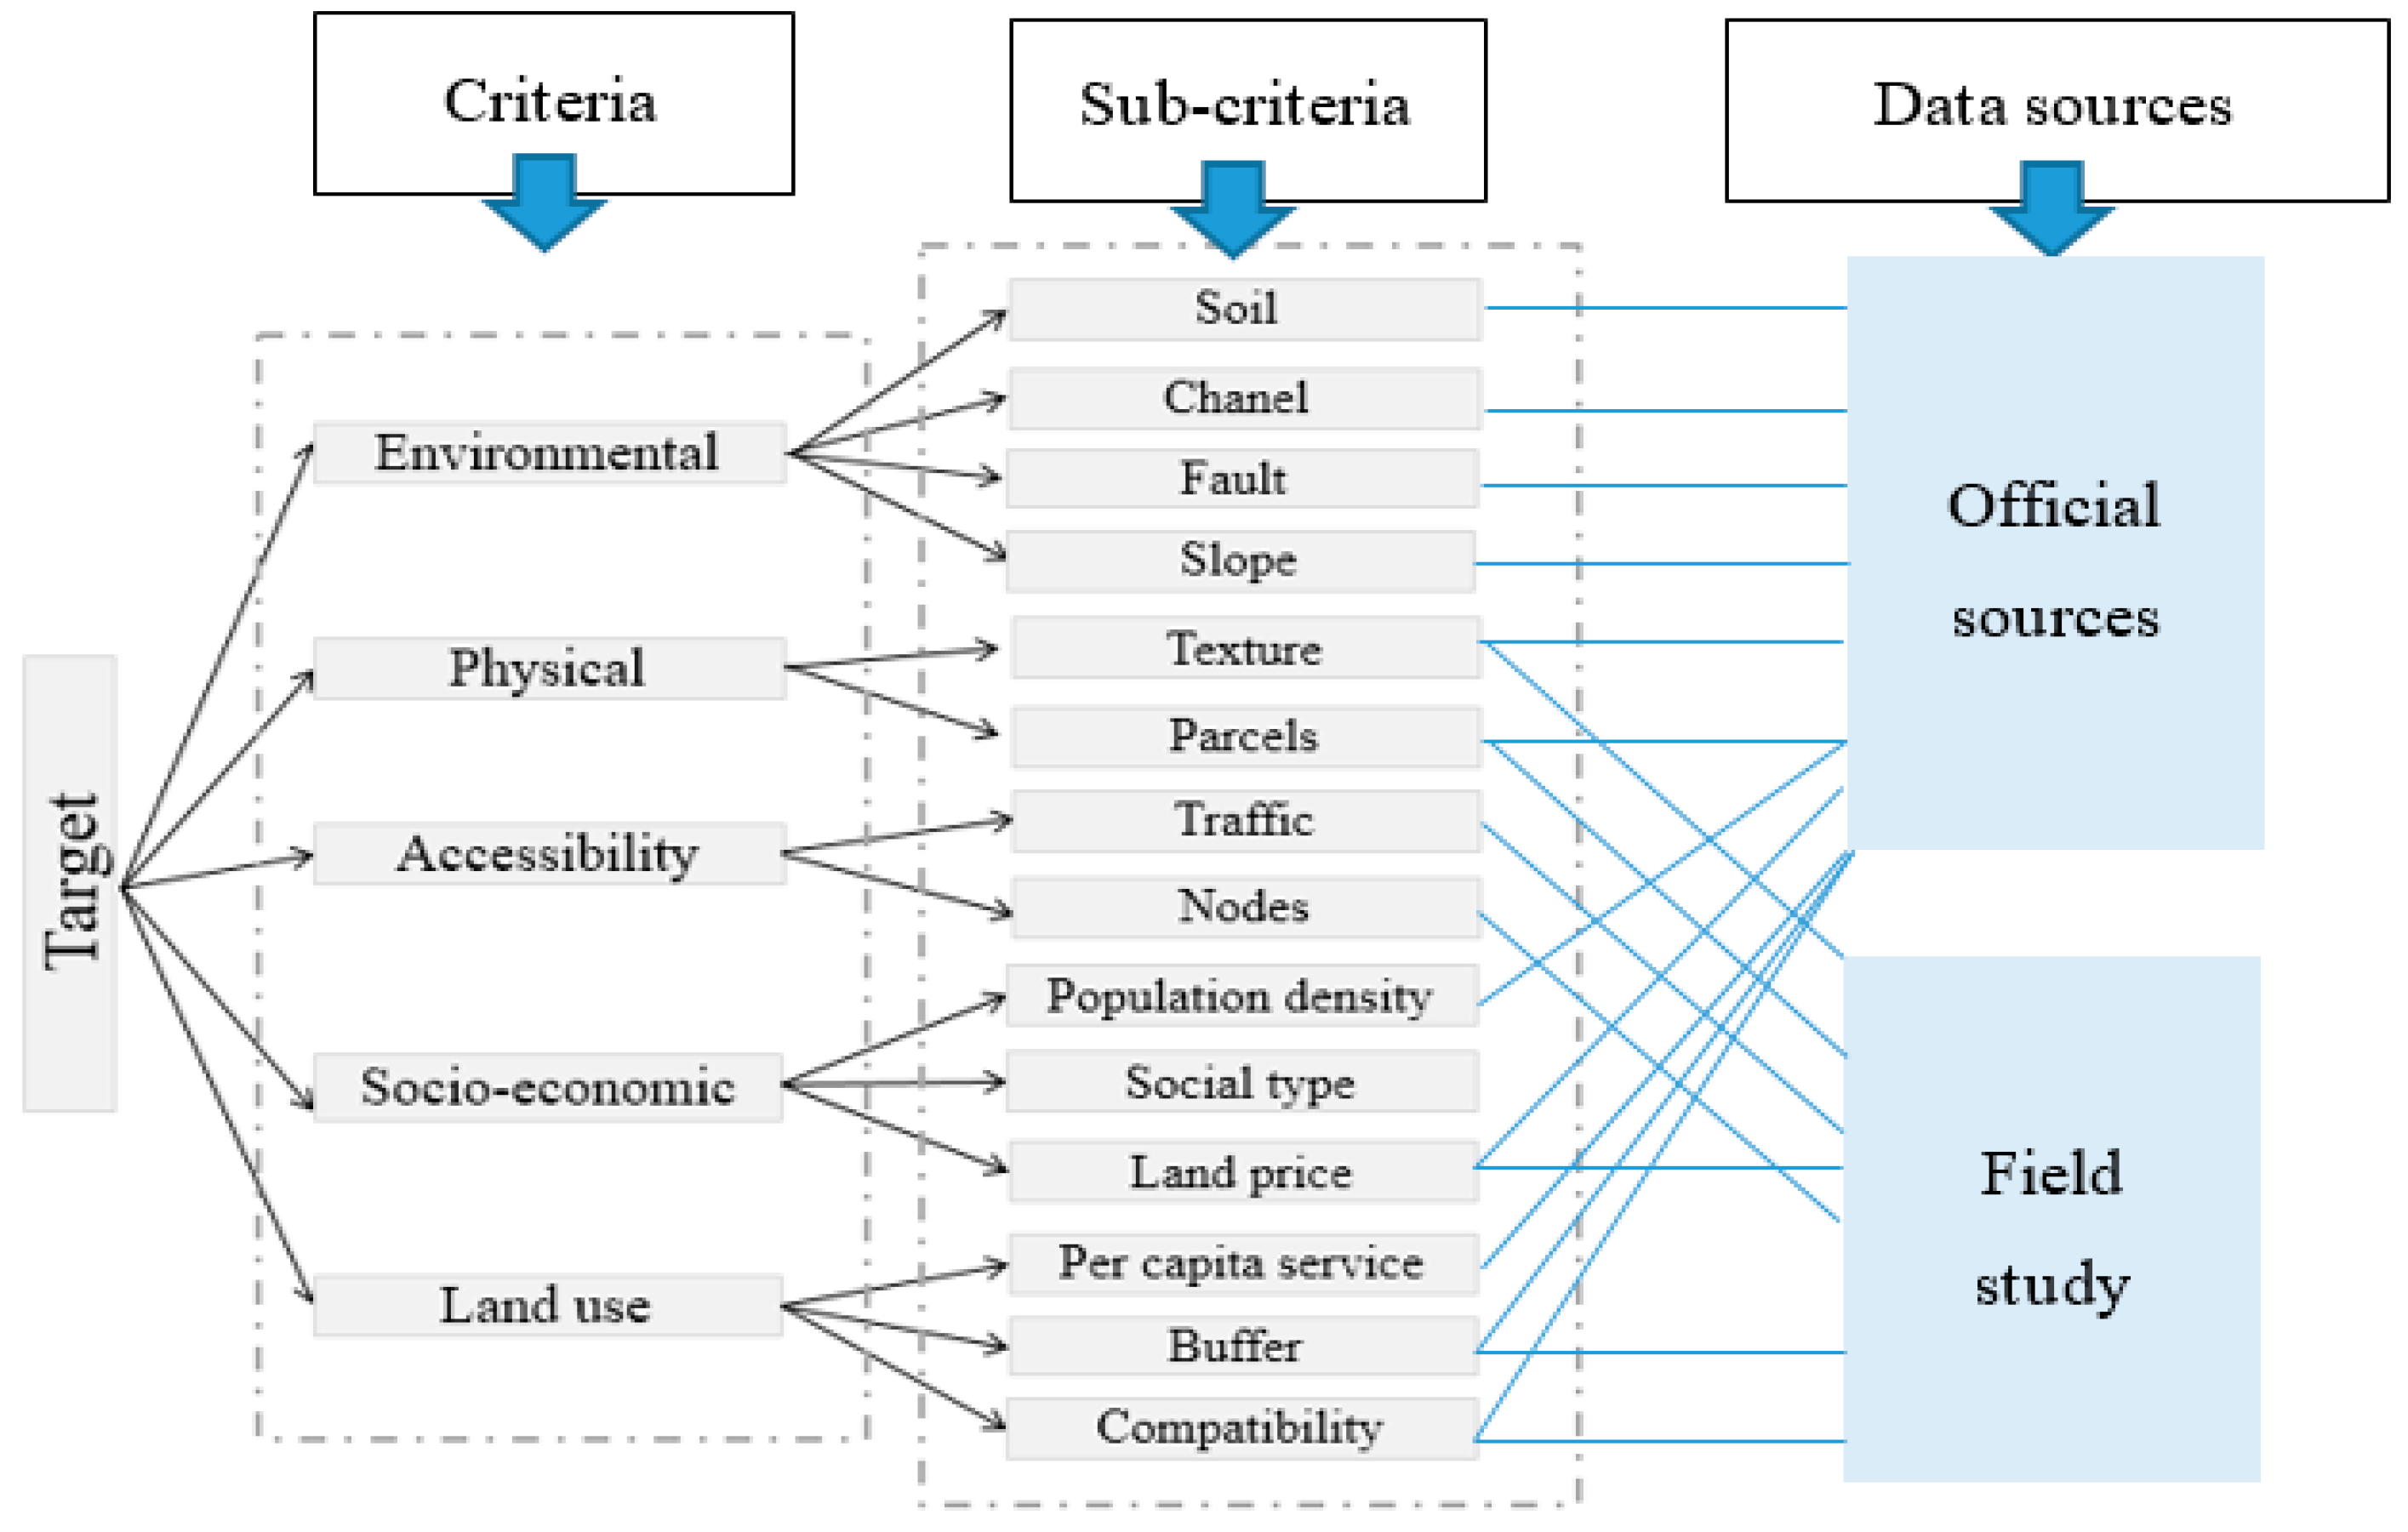
This section specifies the essential criteria and sub-criteria based on experts’ opinions for choosing proper lands as a main target (
Figure 1).
The criteria weights and priorities are clarified based on the experts’ viewpoints. To do this, experts are asked to compare all the related criteria and sub-criteria in a pairwise manner to determine which criteria in each comparison have priority over other criteria.
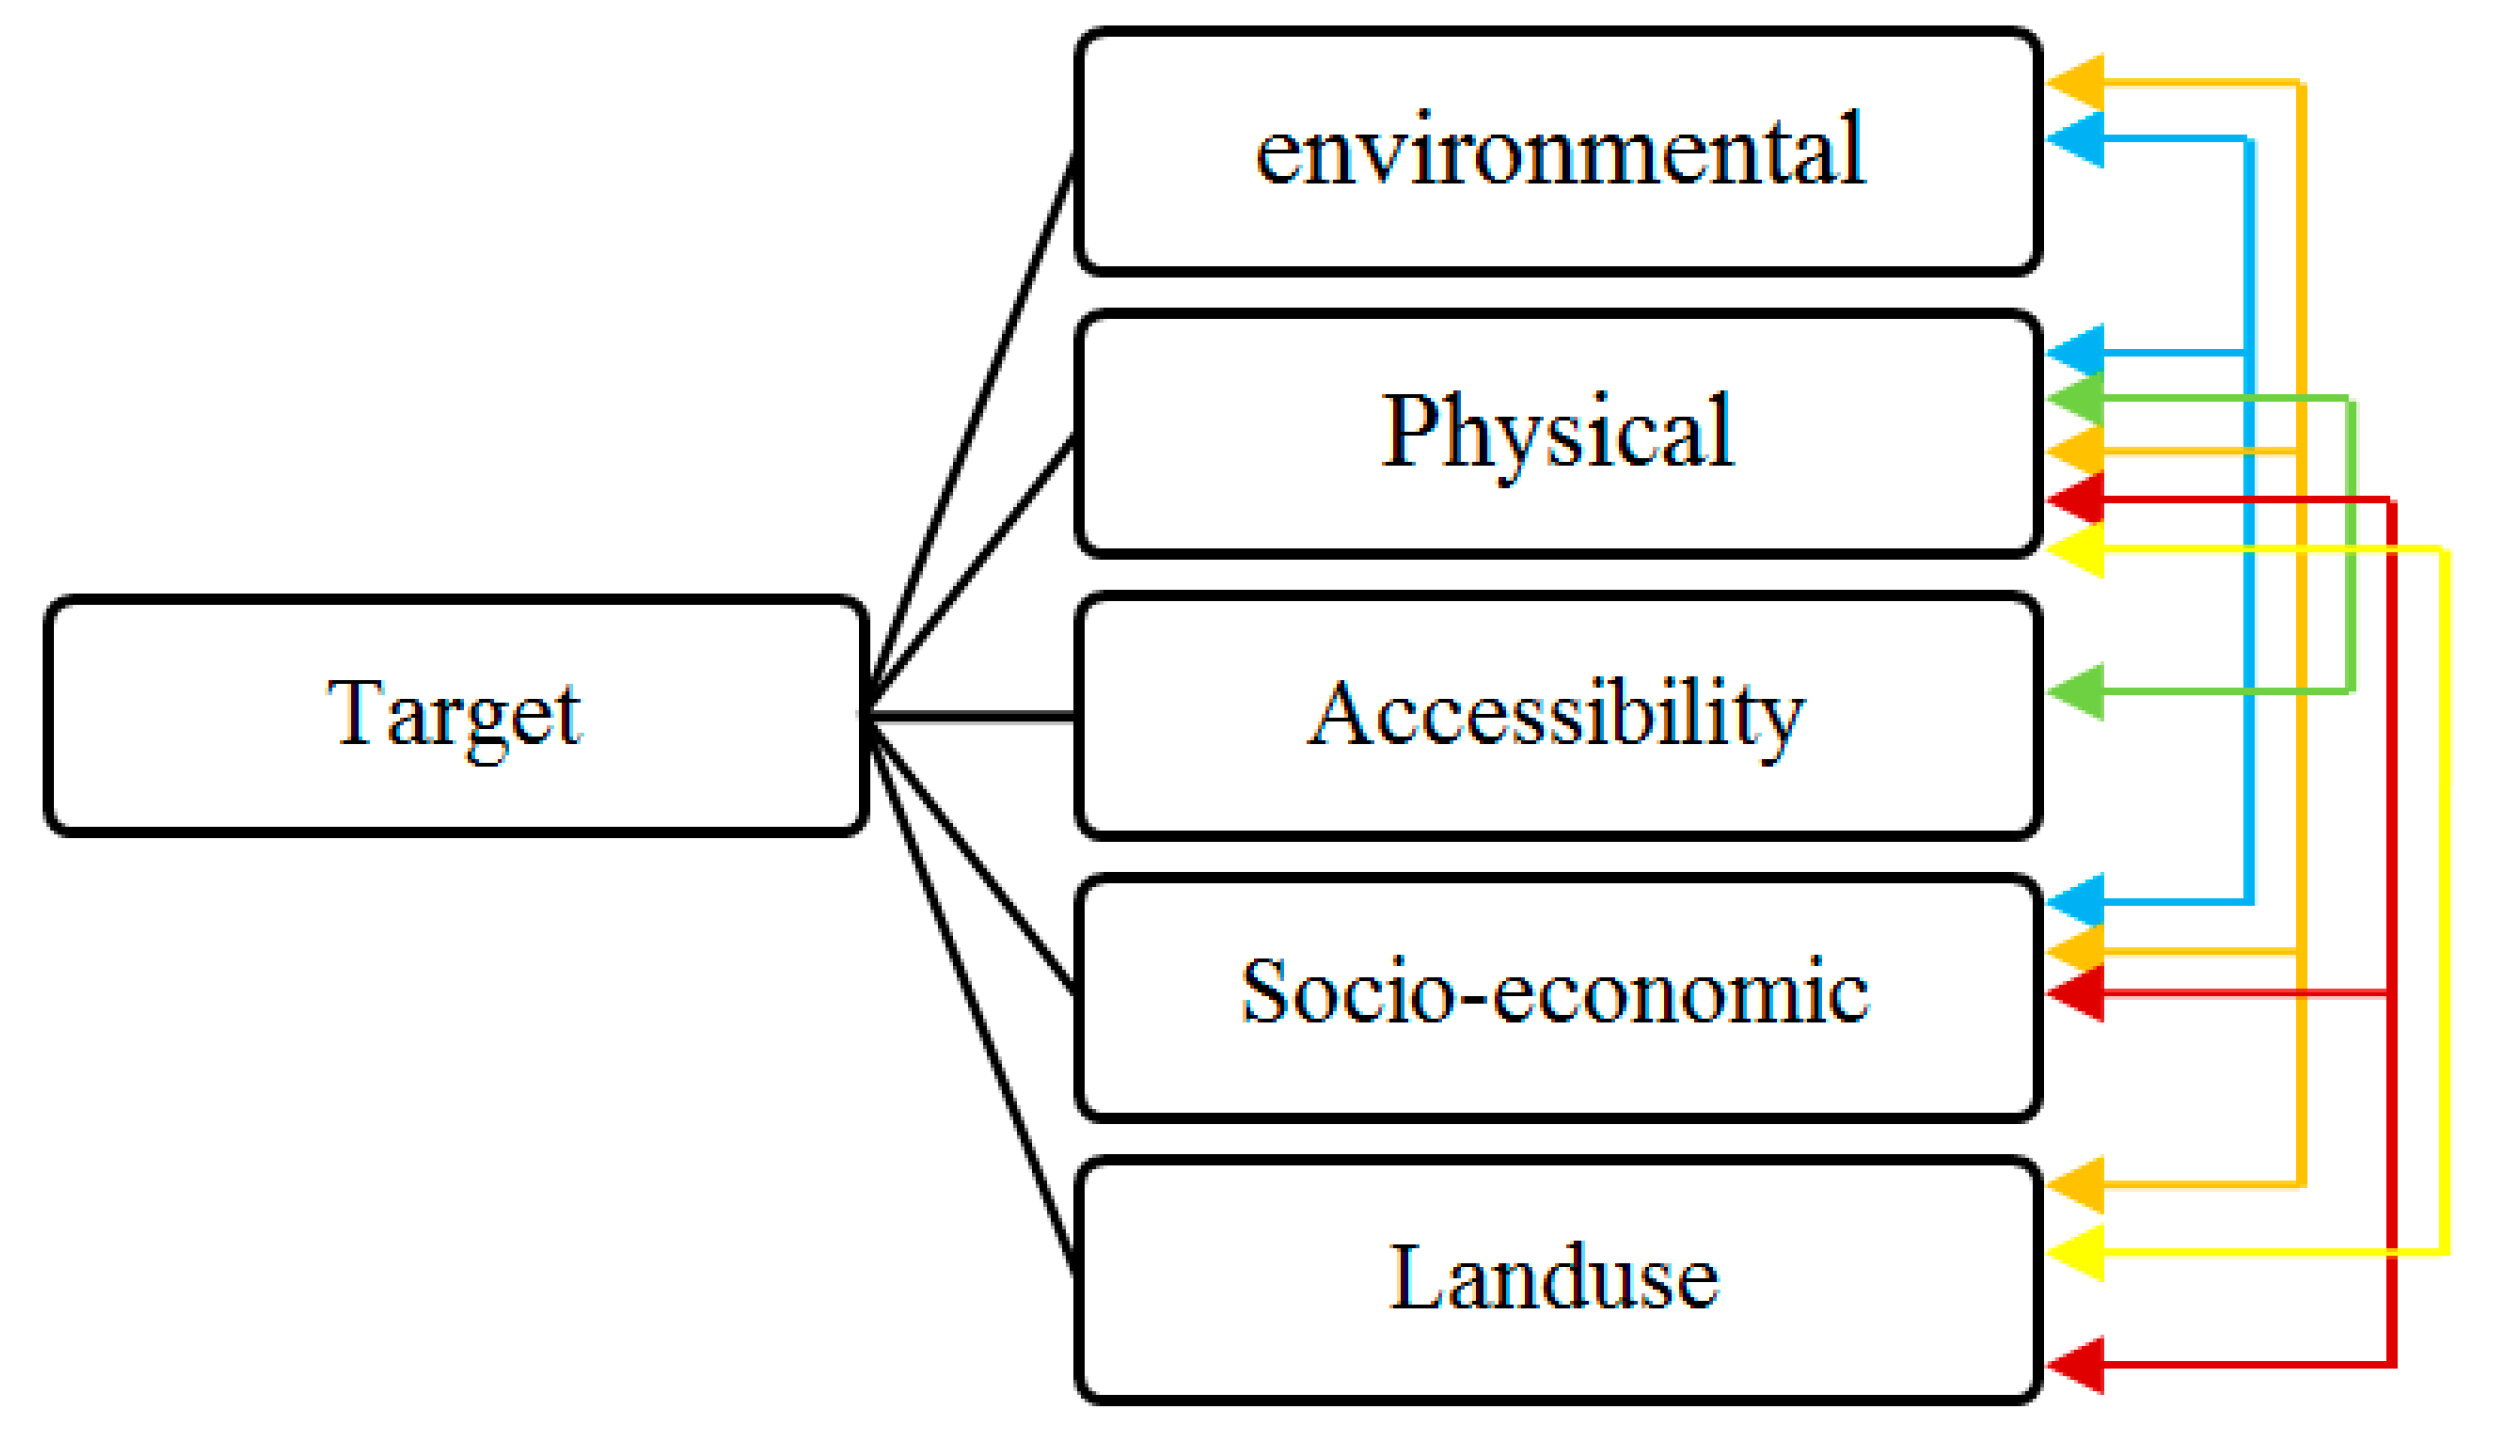
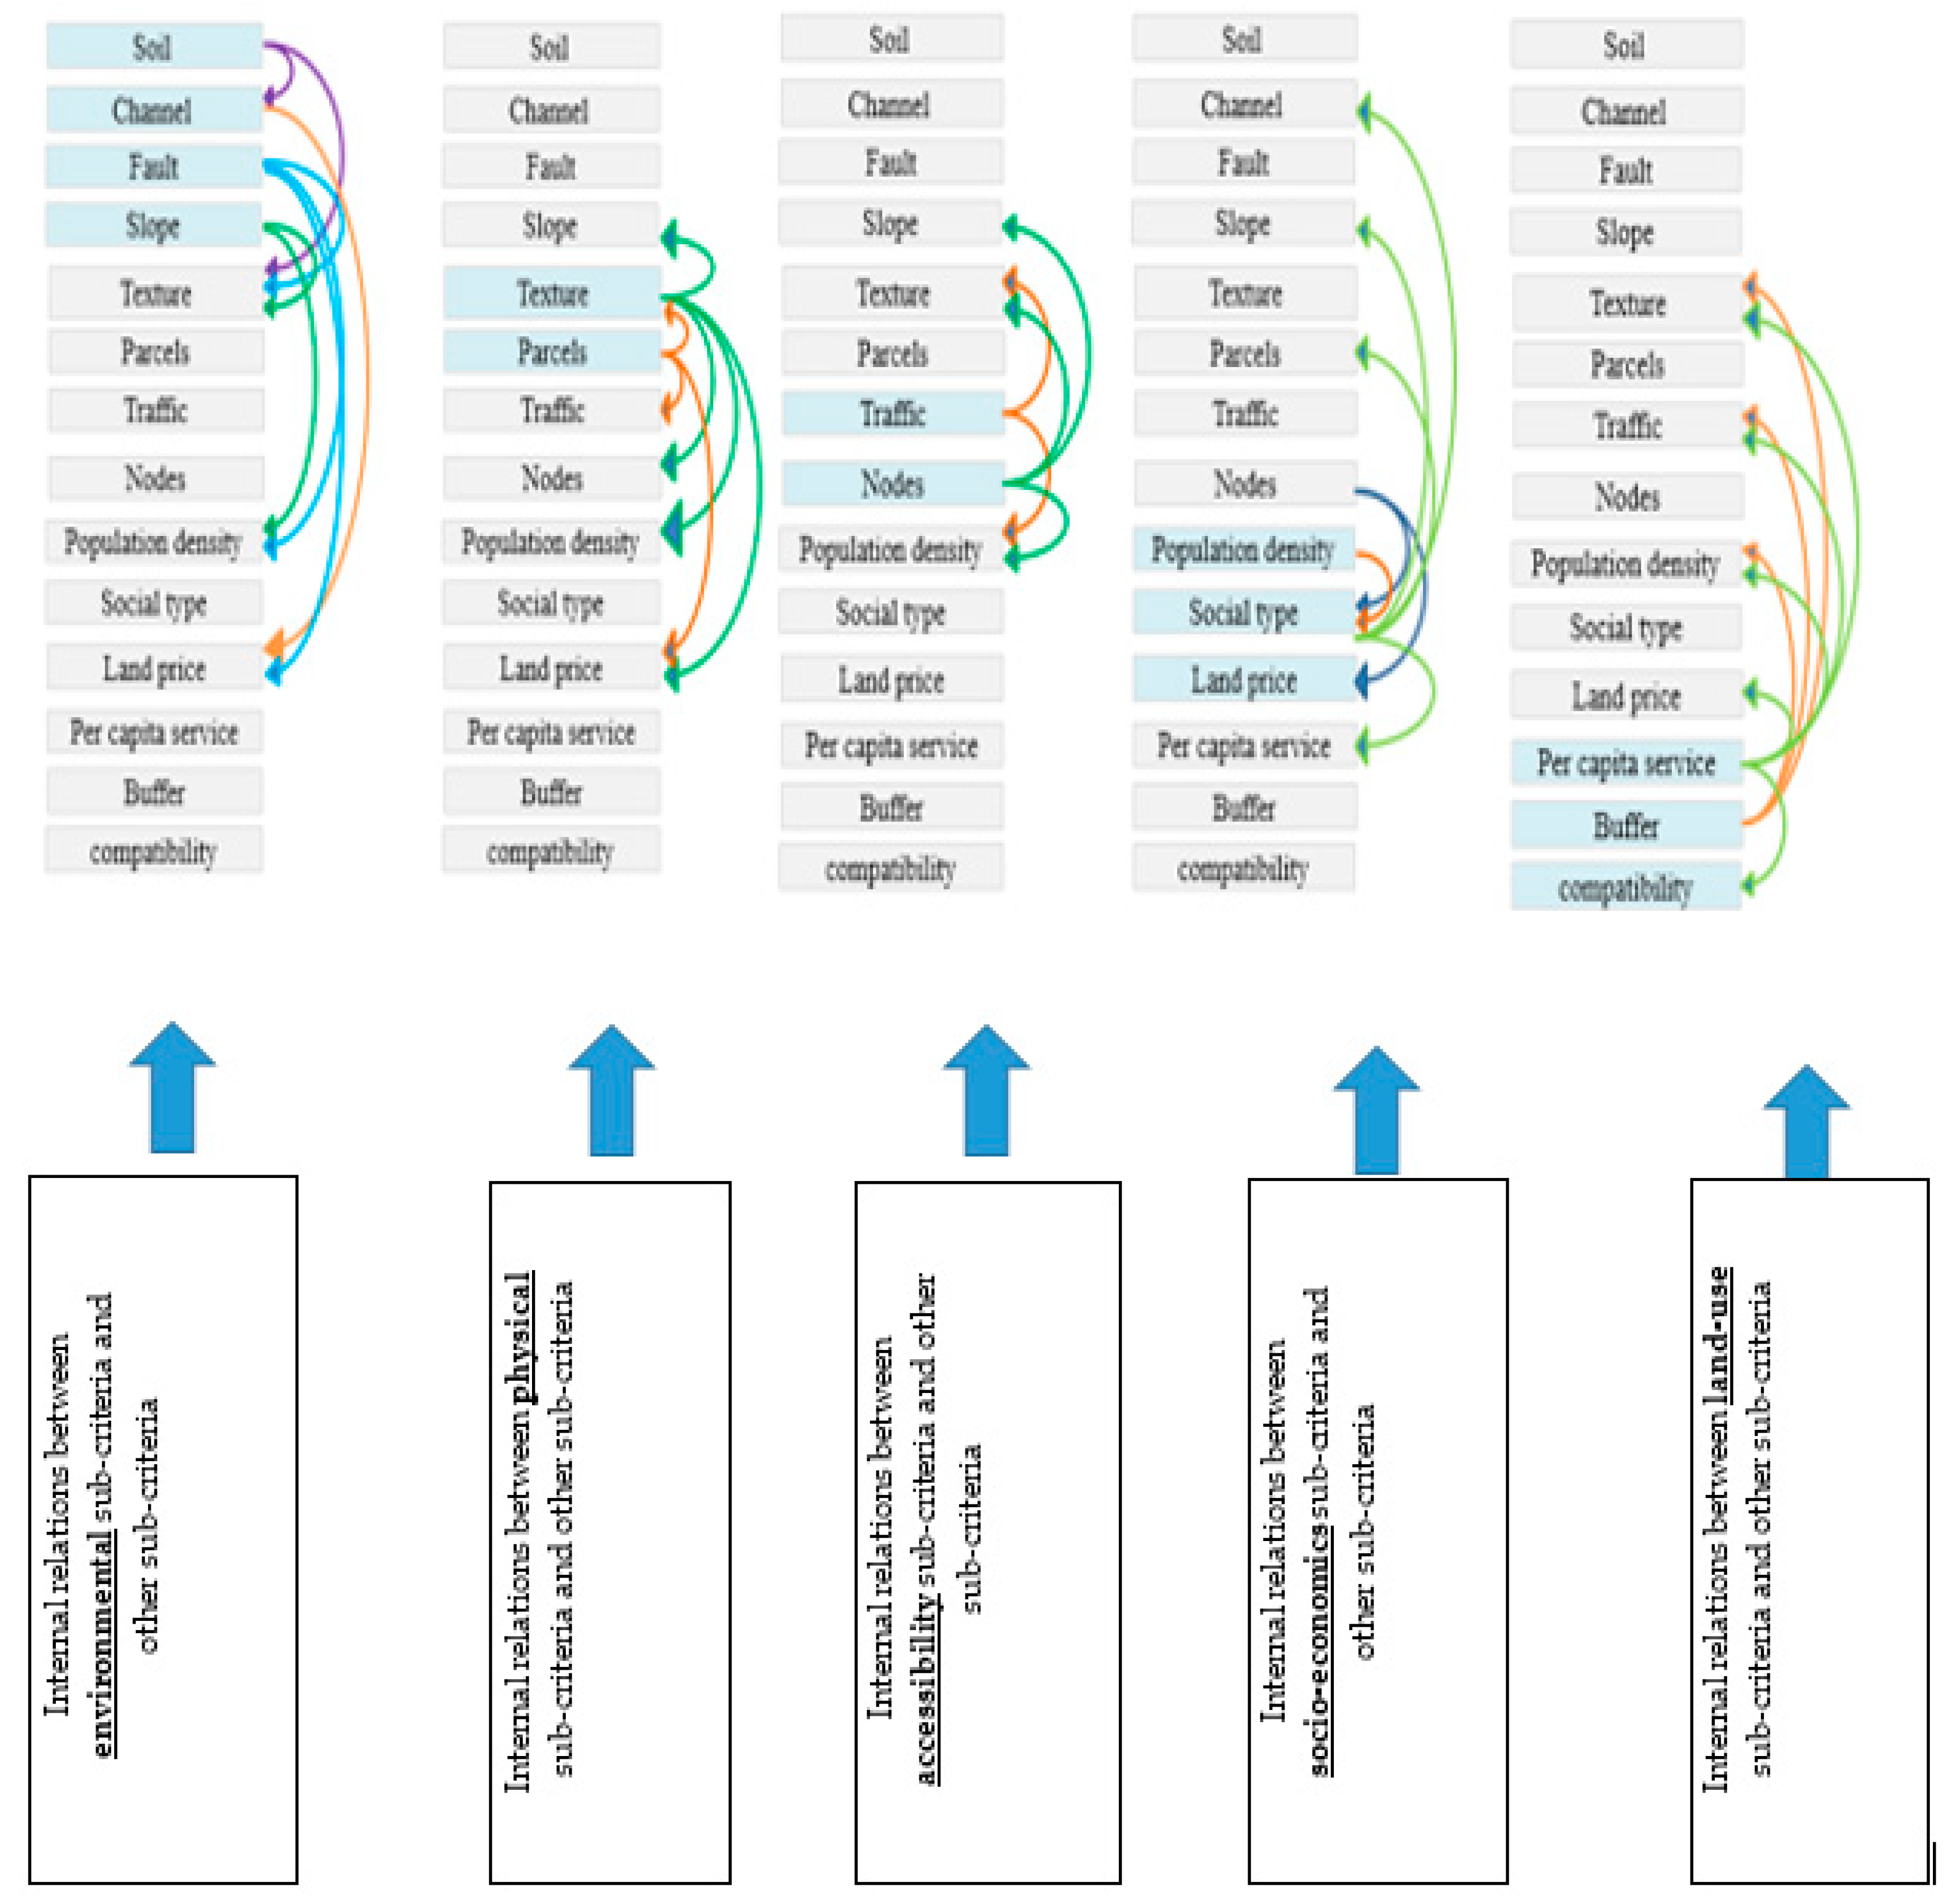
Figure 2 and
Figure 3 show the criteria and sub-criteria inter-relationships respectively. The method of comparison between criteria and sub-criteria is that the criteria and sub-criteria are compared in pairs and each of them, which have more importance and priority than the other, is awarded more points, in a scale of 1 to 9, which ultimately determines how important each criterion is compared to the other (
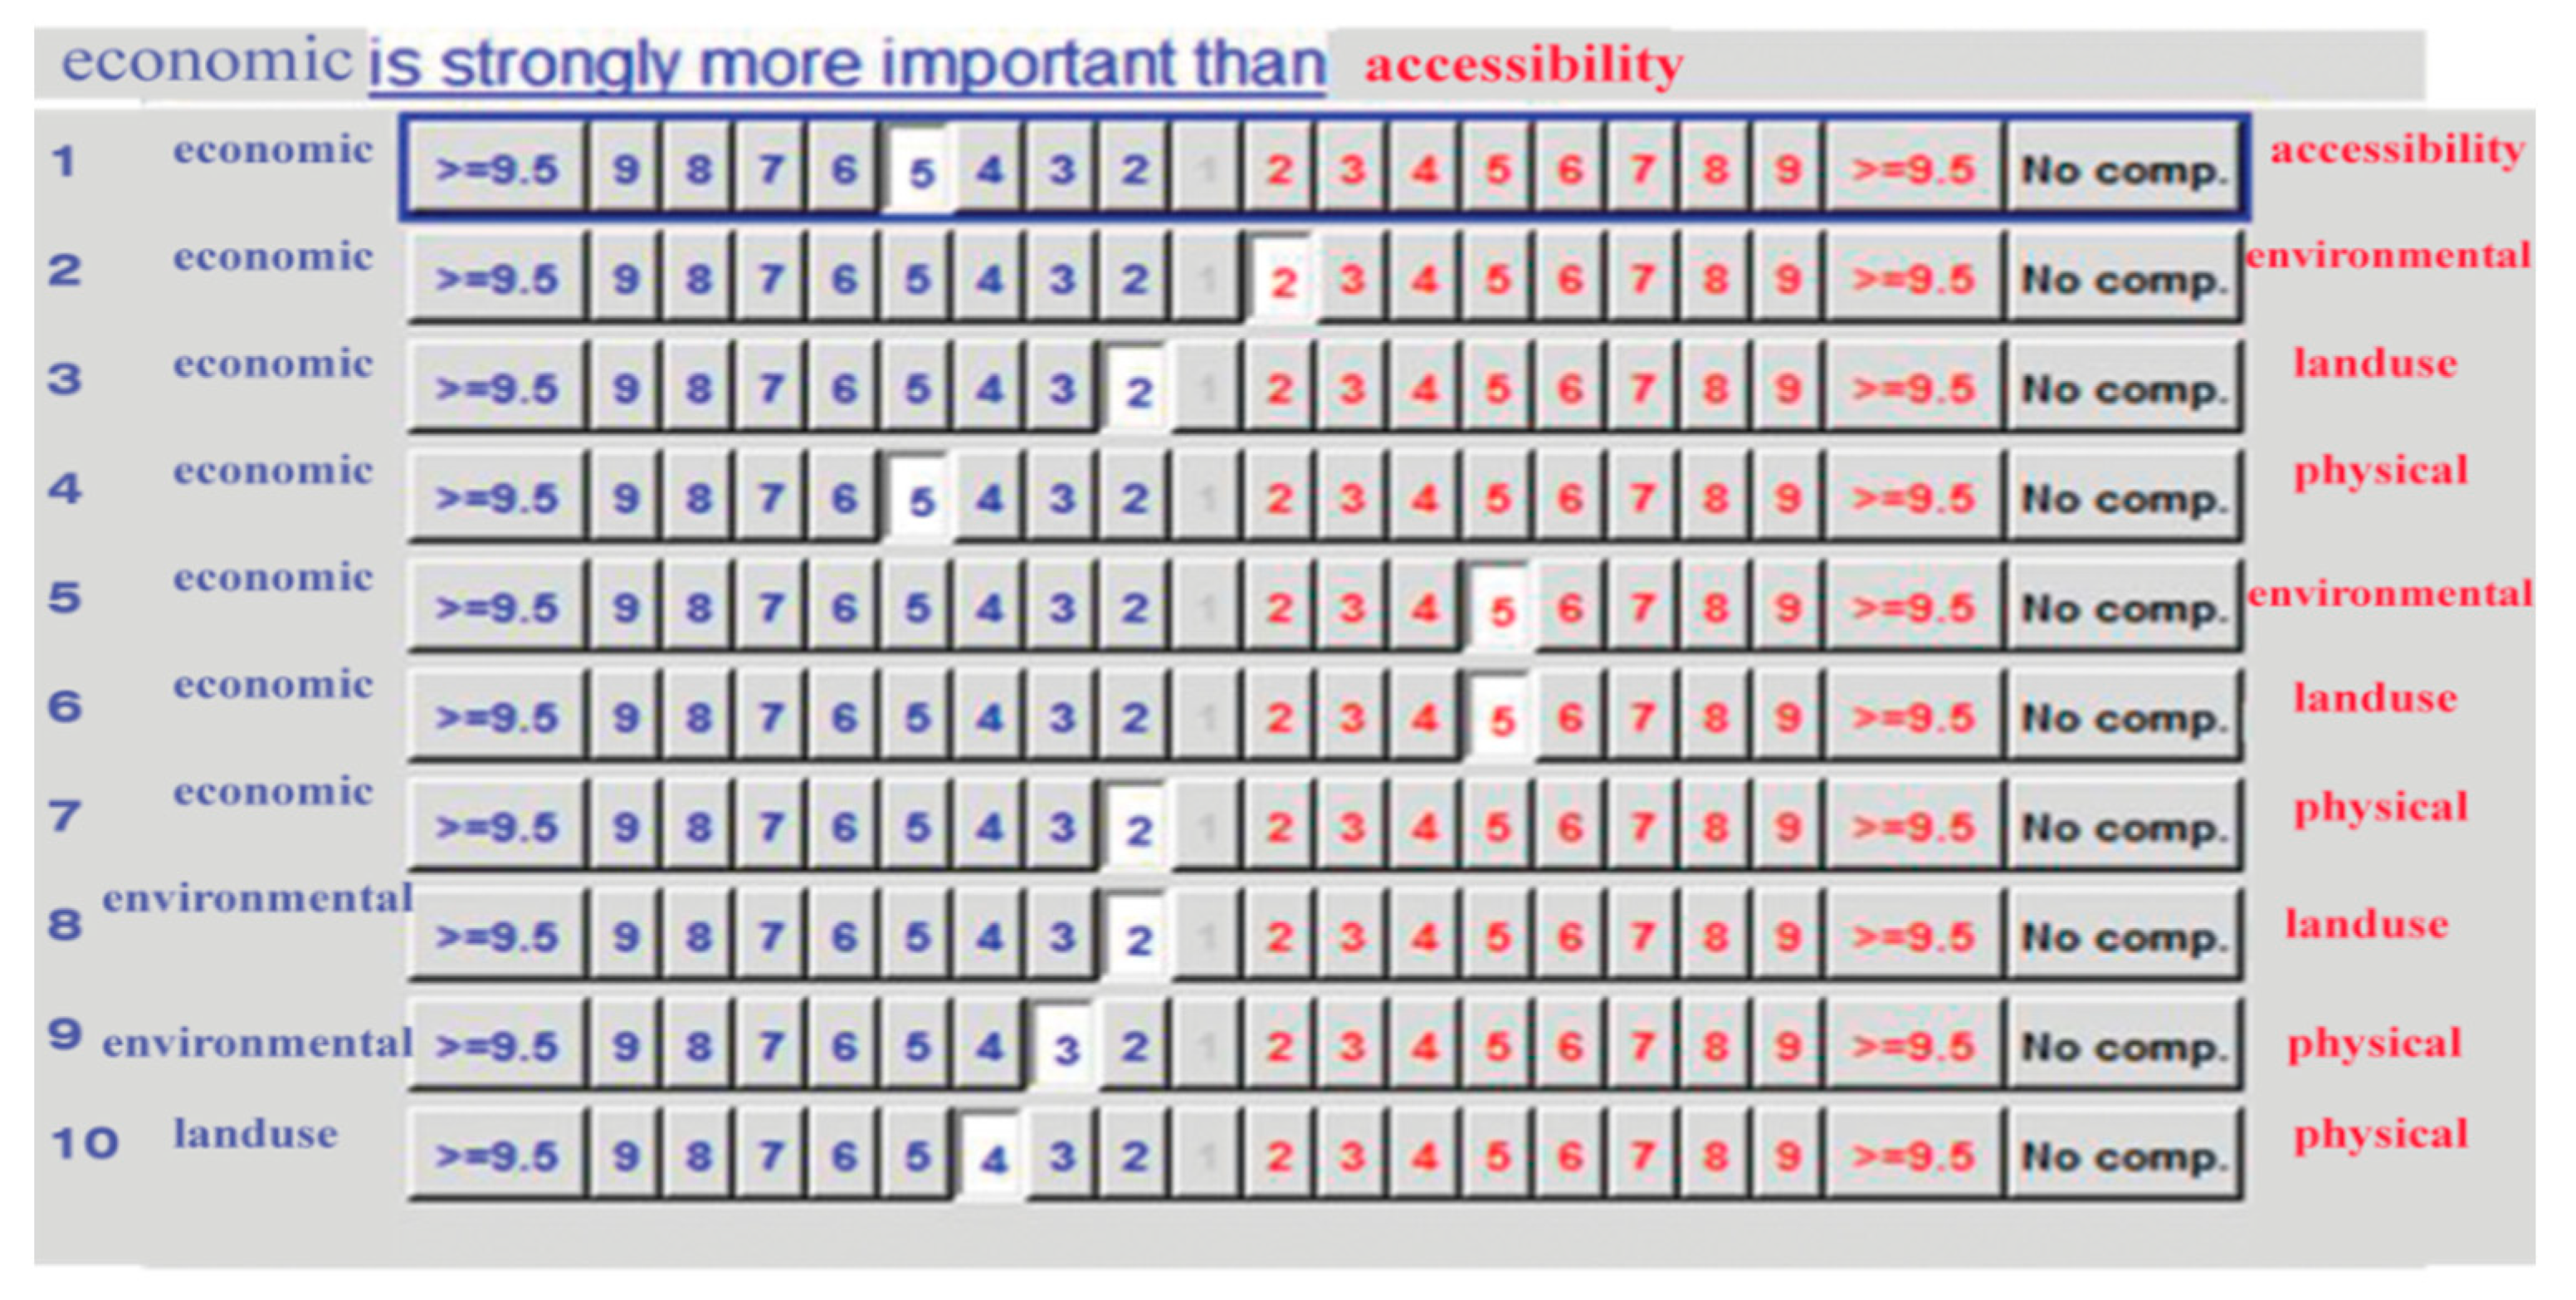
Figure 4). Then, Super Decisions V2.8 software has been used to achieve
Figure 4, this image is an example of the output of this software, which shows the pairwise comparison of the criteria expressed in
Figure 2. These analyses have been implemented for all the sub-criteria mentioned in
Figure 3, and the results of all these analyses are presented numerically in
Table 1.
3.2. Findings of the Second Section: Appropriate Locations for Tall Buildings
In this phase, essential sub-criteria (based on
Table 1) for locating tall buildings are presented via GIS layers (
Figure 5,
Figure 6,
Figure 7,
Figure 8,
Figure 9,
Figure 10,
Figure 11,
Figure 12,
Figure 13,
Figure 14,
Figure 15,
Figure 16,
Figure 17,
Figure 18 and
Figure 19); by overlapping them, (
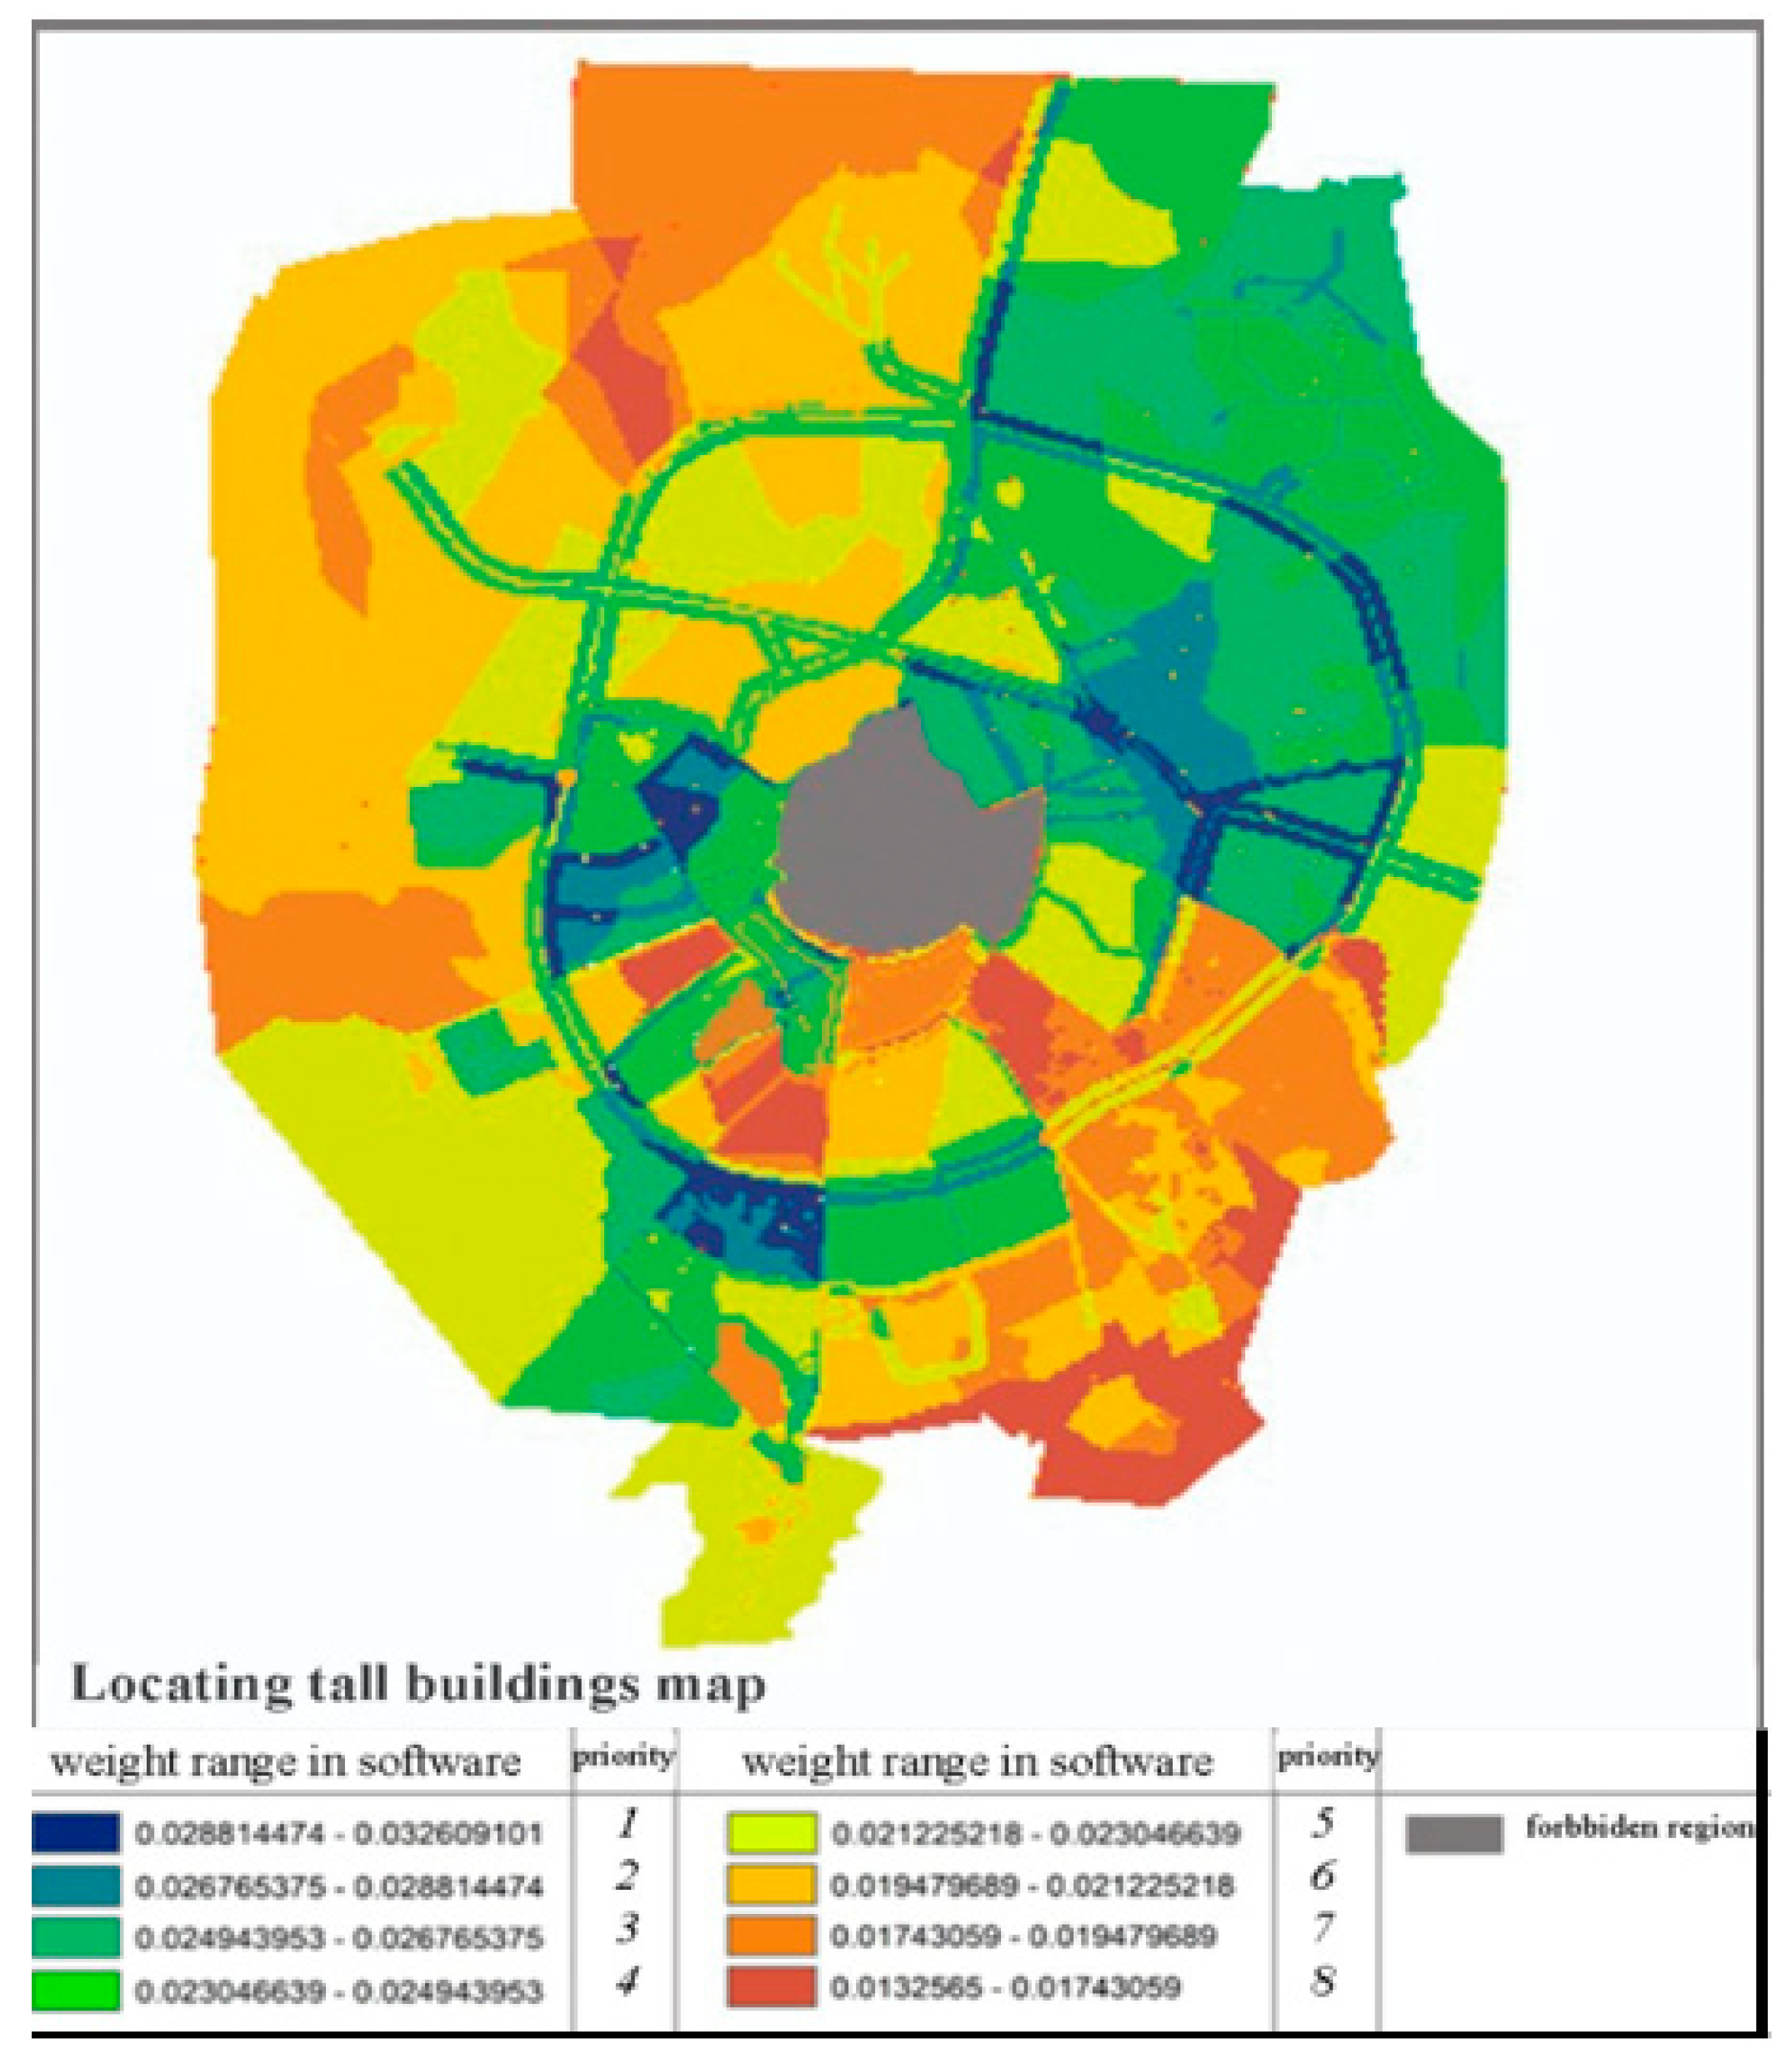
Figure 20) the suitable areas for erecting tall buildings are identified.
In the next step, the GIS layers, shown in
Figure 5,
Figure 6,
Figure 7,
Figure 8,
Figure 9,
Figure 10,
Figure 11,
Figure 12,
Figure 13,
Figure 14,
Figure 15,
Figure 16,
Figure 17,
Figure 18 and
Figure 19, were overlapped together; consequently, the best areas for tall buildings locations, as shown in
Figure 20, are obtained.
3.3. Findings of the Third Section: Tall Building Visual Impacts
In this phase, seven tall buildings are placed in seven more suitable zones, based on the best urban area for locating tall buildings (
Figure 20), and their visual impact is determined by GIS maps. By comparing these maps and the visual impact of these buildings, the most appropriate place for tall buildings can be obtained.
Figure 23,
Figure 24,
Figure 25,
Figure 26,
Figure 27 and
Figure 28 show the visual impact of each of the proposed buildings. In this article, we do not intend to judge which mode is better, and we are only trying to provide a method for cities to act according to their plan and vision. Whether visibility is more or less better depends on the urban plans and visions of each city. In some cities, managers and planners need to find a way to increase the visibility of tall buildings, and in some other cities, they need to minimize the visual impact of tall buildings as much as possible.
4. Discussion
The model presented in this research can help to locate tall buildings. The method presented in this research is a combination of the two methods of planning and visual analysis. In the planning section, the criteria and sub-criteria are considered to determine the appropriate areas for the erection of tall buildings. Visual analysis is done in three dimensions based on fuzzy visibility; the positive and negative effects of tall buildings on the city are identified and help to decide on the appropriate location of the tall buildings. This model can be used for every desirable region and it suggests proper spots for all of them, provided there is localization of criteria.
In most previous researches, the influential factors in locating tall buildings have been mentioned [
32,
33], but the prioritization and weighting of these criteria have not been studied in detail. In this study, according to the results, land price, urban texture, population density, and traffic sub-criteria are at the highest level, and surface and groundwater sub-criteria are at the lowest level in locating tall buildings by prioritization. Other criteria like buffer, slope, per capita service, traffic nodes, fault, compatibility, and parcels are also placed among the list.
Lack of access to accurate 3D images and maps of the city was one of the main limitations of this research. Although we tried to develop a comprehensive model, further studies can examine designing adjacent sidewalks criteria, facades and their details, a building’s 3D model, parametric design according to the background characteristics, etc. The effects of vegetation have not been applied in the fuzzy visibility analysis in this research. By minimizing the study area, this factor can be included. Another thing to consider is the amount of visibility from inside of the yard. The visual analysis could accommodate different factors such as increasing legibility, making memories, and preparing maps to protect visually valuable axes.
5. Conclusions
In this research, a model is presented so that the role of the tall buildings’ visual impacts in the city can be properly considered in decision-making for the location of tall buildings in the city. The central hypothesis of this research was that a set of criteria is vital in locating tall buildings.
The main question of this research was how to find a solution that is reproducible and can be used in any other city based on many heterogeneous criteria. To do this, the criteria were divided into two-dimensional criteria and three-dimensional criteria. In two-dimensional criteria, technical issues affecting the location of tall buildings were identified and weighted and prioritized based on the opinion of experts by the ANP method in Super Decisions V2.8 software. In the three-dimensional section, the fuzzy visual analysis was applied by MATLAB software considering how much of a tall building can be seen from urban spaces. In this way, this research provided a model that was able to examine a large number of heterogeneous variables affecting the location of tall buildings and to determine their weight and priority.
After evaluating the criteria, locations should be chosen that not only do not negatively impact the city, but also positively impact it. The final filter for locating tall buildings is a visual criterion that is very important in the city. In other words, in addition to evaluating technical criteria, the visual impact and its positive influence should be considered. Due to the complexity of three-dimensional analysis, the proposed model in this research is formed in two stages: the first stage is reviewing technical criteria to narrow the possible urban area for locating tall buildings, and the second stage is reviewing visual criteria in which only areas of the city that have been identified as suitable for the construction of tall buildings in terms of two dimensions are examined in the first stage.
In this study, the main limitation is the unavailability of 3D images of the city with sufficient accuracy. This limitation might change the research results. We tried to get as close as possible to the existing reality through field research. However, observing correct height codes for both the land and the building requires more accurate mapping data.
This research generally seeks to find the appropriate framework for locating tall buildings. This research’s framework presented in two main steps. In the first step, technically suitable locations of the city for constructing tall buildings were recognized. In the second step, parts of the city that had both a positive visual impact on the city and positive technical criteria were identified. The method and framework used in this research can be used in all cities around the world. In fact, in each city, the criteria and sub-criteria and their weights can be reviewed based on the city’s priority.
This model can be considered individually for areas considered more desirable, and offers a proper location in each zone.
The designed program can evaluate a building’s visibility in future development plans if the input data is accurate enough. In this program, one of the essential requirements for preparing a precise output is the accuracy and precision of the information. In further studies, vegetation and distance impact can also be considered and can be focused on providing a set of regulations.
Author Contributions
Conceptualization, M.K.; methodology, M.K.; software, H.H., S.S., M.S. and F.A.; validation, M.K. and H.H.; formal analysis, H.H. and F.A.; investigation, M.K.; resources, S.K.; data curation, F.A.; writing—Original draft preparation, M.K. and H.H.; writing—Review and editing, M.K. and S.K.; visualization, S.S.; supervision, M.K.; funding acquisition, S.S. All authors have read and agreed to the published version of the manuscript.
Funding
We acknowledge the support of the German Research Foundation (DFG) and the Bauhaus-Universität Weimar within the Open-Access Publishing Programme.
Conflicts of Interest
The authors declare no conflict of interest.
References
- Short, M. Planning for Tall Buildings; Routledge: Abingdon, UK, 2012. [Google Scholar]
- Al-Kodmany, K.; Ali., M.M. The Future of the City: Tall Buildings and Urban Design; WIT Press: Chicago, IL, USA, 2013; pp. 11–44 & 68–98. [Google Scholar]
- Karimimoshaver, M.; Winkemann, P. A framework for assessing tall buildings’ impact on the city skyline: Aesthetic, visibility, and meaning dimensions. Environ. Impact Assess. Rev. 2018, 73, 164–176. [Google Scholar] [CrossRef]
- Howeler, E. Skyscraper: Design of the Recent Past and for the Near Future; Thames & Hudson: London, UK, 2003. [Google Scholar]
- Council on Tall Buildings and Urban Habitat. Ctbuh.org. 2017. Available online: http://ctbuh.org/ (accessed on 30 October 2017).
- Karimimoshaver, M. Methods, Techniques and Tools in Urban Visual Analysis. Bagh-e Nazar 2014, 11, 73–80. [Google Scholar]
- London View Management Framework. Available online: https://www.london.gov.uk/what-we-do/planning/implementing-london-plan/planning-guidance/london-view-management (accessed on 12 November 2017).
- Heath, T.; Smith, S.G.; Lim, B. Tall Buildings and the Urban Skyline. Environ. Behav. 2000, 32, 541–556. [Google Scholar] [CrossRef]
- Rød, J.K.; Van Der Meer, D. Visibility and Dominance Analysis: Assessing a High-Rise Building Project in Trondheim. Environ. Plan. B Plan. Des. 2009, 36, 698–710. [Google Scholar] [CrossRef]
- Zarghami, E.; Karimimoshaver, M.; Ghanbaran, A.; SaadatiVaghar, P. Assessing the oppressive impact of the form of tall buildings on citizens: Height, width, and height-to-width ratio. Environ. Impact Assess. Rev. 2019, 79, 106287. [Google Scholar] [CrossRef]
- Karimimoshaver, M. Approaches and methods in urban aesthetics. Sci. J. NAZAR Res. Cent. (NRC) Art Archit. Urban. 2013, 10, 63–72. [Google Scholar]
- Karimimoshaver, M.; Mansouri, S.A.; Adibi, A. Relationship between the Urban Landscape and Position of Tall Buildings in the City. Sci. J. NAZAR Res. Cent. (NRC) Art Archit. Urban. 2010, 7, 89–99. [Google Scholar]
- Fisher, P.F. Probable and fuzzy models of the viewshed operation. In Innovations in GIS; Worboys, M.F., Ed.; Taylor and Francis: London, UK, 1994; pp. 161–175. [Google Scholar]
- Oh, K. Visual threshold carrying capacity (VTCC) in urban landscape management: A case study of Seoul, Korea. Landsc. Urban Plan. 1998, 39, 283–294. [Google Scholar] [CrossRef]
- Van der Hoeven, F.; Nijhuis, S. Developing Rotterdam’s skyline. CTBUH J. 2012, 2, 32–37. [Google Scholar]
- Czyńska, K.; Rubinowicz, P. Visual impact size method in planning tall buildings. In Education for Research, Research for Creativity; Słyk, J., Bezerra, L., Eds.; Faculty of Architecture, Warsaw University of Technology: Warsaw, Poland, 2016; pp. 169–174. [Google Scholar]
- Sahami, H. Preparation and Location; Malek-e-Ashtar Industrial University: Tehran, Iran, 2010. [Google Scholar]
- Forghani, A.; Akhundi, A.; Sharifyazdi, M. Industry and Service Facility Location with a Practical Approach; Sharif University Press: Tehran, Iran, 2009. [Google Scholar]
- Azizi, M.M. Evaluation of physical-spatial effects of tower construction in Tehran (Farmanieh-Kamranieh). Honar-Ha-Ye-Ziba 1999, 4–5, 33–46. [Google Scholar]
- Azizi, M.M.; Fallah, E. Determining and Applying the Criteria for Locating Tall Buildings in Metropolitan Areas (Case Study: Shiraz); University of Tehran: Tehran, Iran, 2008. [Google Scholar]
- Adeli, Z.; Sardare, A. Locating of Tall buildings in Qazvin City using the hierarchical process of G.I.S., AHP. In Proceedings of the Third Conference on Urban Planning and Management, Mashhad, Iran, 20–23 April 2011; pp. 1–12. [Google Scholar]
- Sedaghati, H. Study and Analysis of Location Criteria for Tall Buildings in Cities, Tabriz City Residential Tower. In Proceedings of the National Conference on Urban Development, Sanandaj, Iran, 15–16 October 2011. [Google Scholar]
- Tamošaitienė, J.; Šipalis, J.; Banaitis, A.; Gaudutis, E. Complex model for the assessment of the location of high-rise buildings in the city urban structure. Int. J. Strat. Prop. Manag. 2013, 17, 93–109. [Google Scholar] [CrossRef]
- Aminzadeh Goharrizi, B.; Roshan, M.; Badr, S. A Comparative Analysis of Site Selection Methods for New Towns in Iran. Sci. J. NAZAR Res. Cent. (NRC) Art Archit. Urban. 2013, 9, 21–32. [Google Scholar]
- Rahnama, M.R.; Razaghian, F. Locating of High-Rise Buildings with Emphasis on Smart Growth Theory. Geogr. Plan. Space Q. J. 2014, 3, 45–64. [Google Scholar]
- Salehi, N.; Ghadiri, H. An analysis of the design criteria for Toronto high-rise buildings for use in Iran. In Proceedings of the First National Conference on the Landscape of Natanz in the Pattern of Islamic Architecture and Urban Planning on the Horizon of 1404, Natanz, Iran, 25 February 2014. [Google Scholar]
- Zista Consulting Engineers. Tehran High-Rise Buildings: Criteria and Location; Urban Planning and Processing Company Publications: Tehran, Iran, 2004. [Google Scholar]
- Anabestani, A.; Javanshiri, M.; Anabestani, Z. Adaptive comparison of multi-criteria decision-making methods in optimal locating of tall buildings (case study: Region 9 Mashhad Municipility). J. Spat. Plan. 2015, 5, 1–24. [Google Scholar]
- Zareian, M. Tall buildings’ social issues. In Proceedings of the Sixteenth Conference on Housing Development Policies in Iran (Economy Faculty of Tehran University), Tehran, Iran, 3–4 October 2016; pp. 3–11. [Google Scholar]
- Saaty, T.L. Theory and Applications of the Analytic Network Process: Decision Making Benefits, Opportunities, Costs and Risks; RWS Publications: Pittsburgh, PA, USA, 2005; ISBN 1-888603-06-2. [Google Scholar]
- Hamadan Municipality. Statistics and Technology Center. Available online: http://www.hamedan.ir/ (accessed on 25 November 2019).
- Dimić, V.; Milošević, M.; Milošević, D.; Stević, D. Adjustable Model of Renewable Energy Projects for Sustainable Development: A Case Study of the Nišava District in Serbia. Sustainability 2018, 10, 775. [Google Scholar] [CrossRef]
- Faroughi, M.; Karimimoshaver, M.; Aram, F.; Solgi, E.; Mosavi, A.; Nabipour, N.; Chau, K.-W. Computational modeling of land surface temperature using remote sensing data to investigate the spatial arrangement of buildings and energy consumption relationship. Eng. Appl. Comput. Fluid Mech. 2020, 14, 254–270. [Google Scholar] [CrossRef]
Figure 1.
The structure of the criteria study including criteria (environmental, physical, accessibility, socio-economic, and land use), sub-criteria (soil, channel, fault, slope, texture, parcels, traffic, nodes, population density, social type, land price, per capita service, buffer, and compatibility), and data sources.
Figure 2.
The network relations between the criteria, based on expert opinion. (The colors in this figure are simply due to the better readability of the relationships between the criteria and have no special meaning).
Figure 2.
The network relations between the criteria, based on expert opinion. (The colors in this figure are simply due to the better readability of the relationships between the criteria and have no special meaning).
Figure 3.
The internal relations between the sub-criteria, based on expert opinion. In this figure, the relationships between each of the sub-criteria (related to the five criteria introduced in
Figure 2) with other sub-criteria related to other categories are demonstrated (The colors in this figure are simply due to the better readability of the relationships between the criteria and have no special meaning).
Figure 4.
The result of the pairwise comparison of the criteria presented in
Figure 4 from Super Decisions V2.8 software.
Figure 4.
The result of the pairwise comparison of the criteria presented in
Figure 4 from Super Decisions V2.8 software.
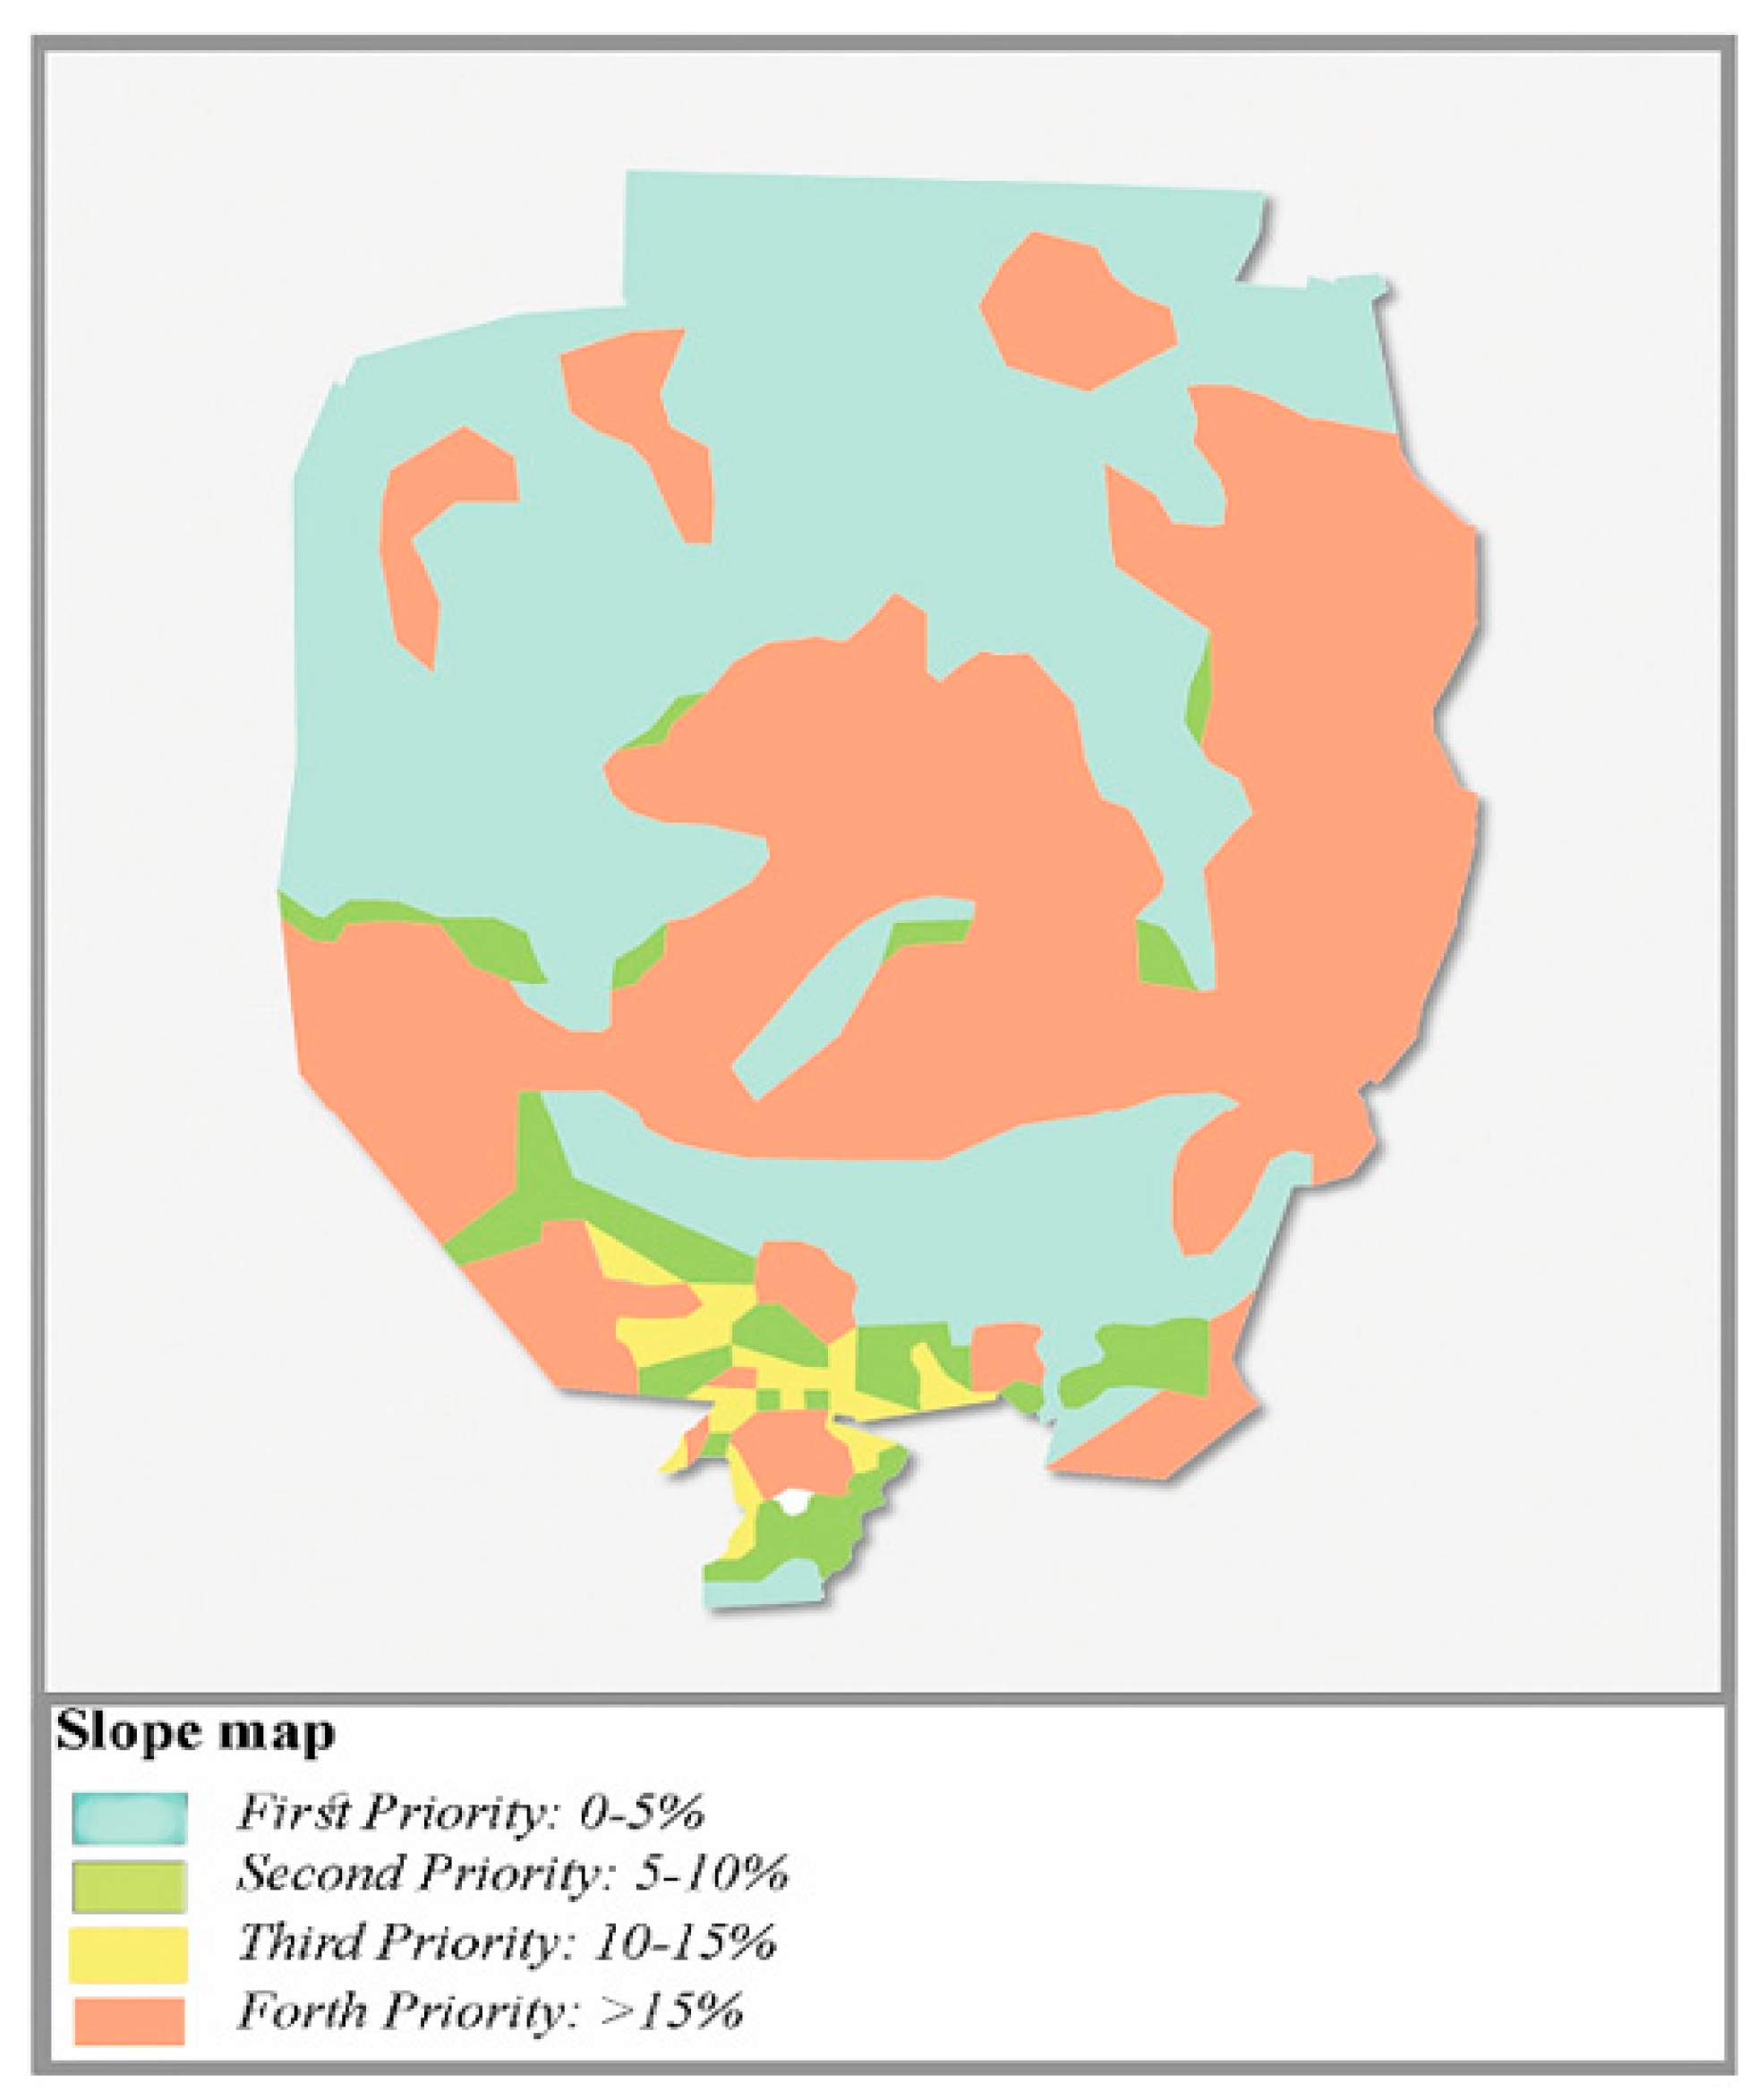
Figure 5.
The slope map of Hamedan based on the sub-criteria measures in
Table 1.
Figure 5.
The slope map of Hamedan based on the sub-criteria measures in
Table 1.
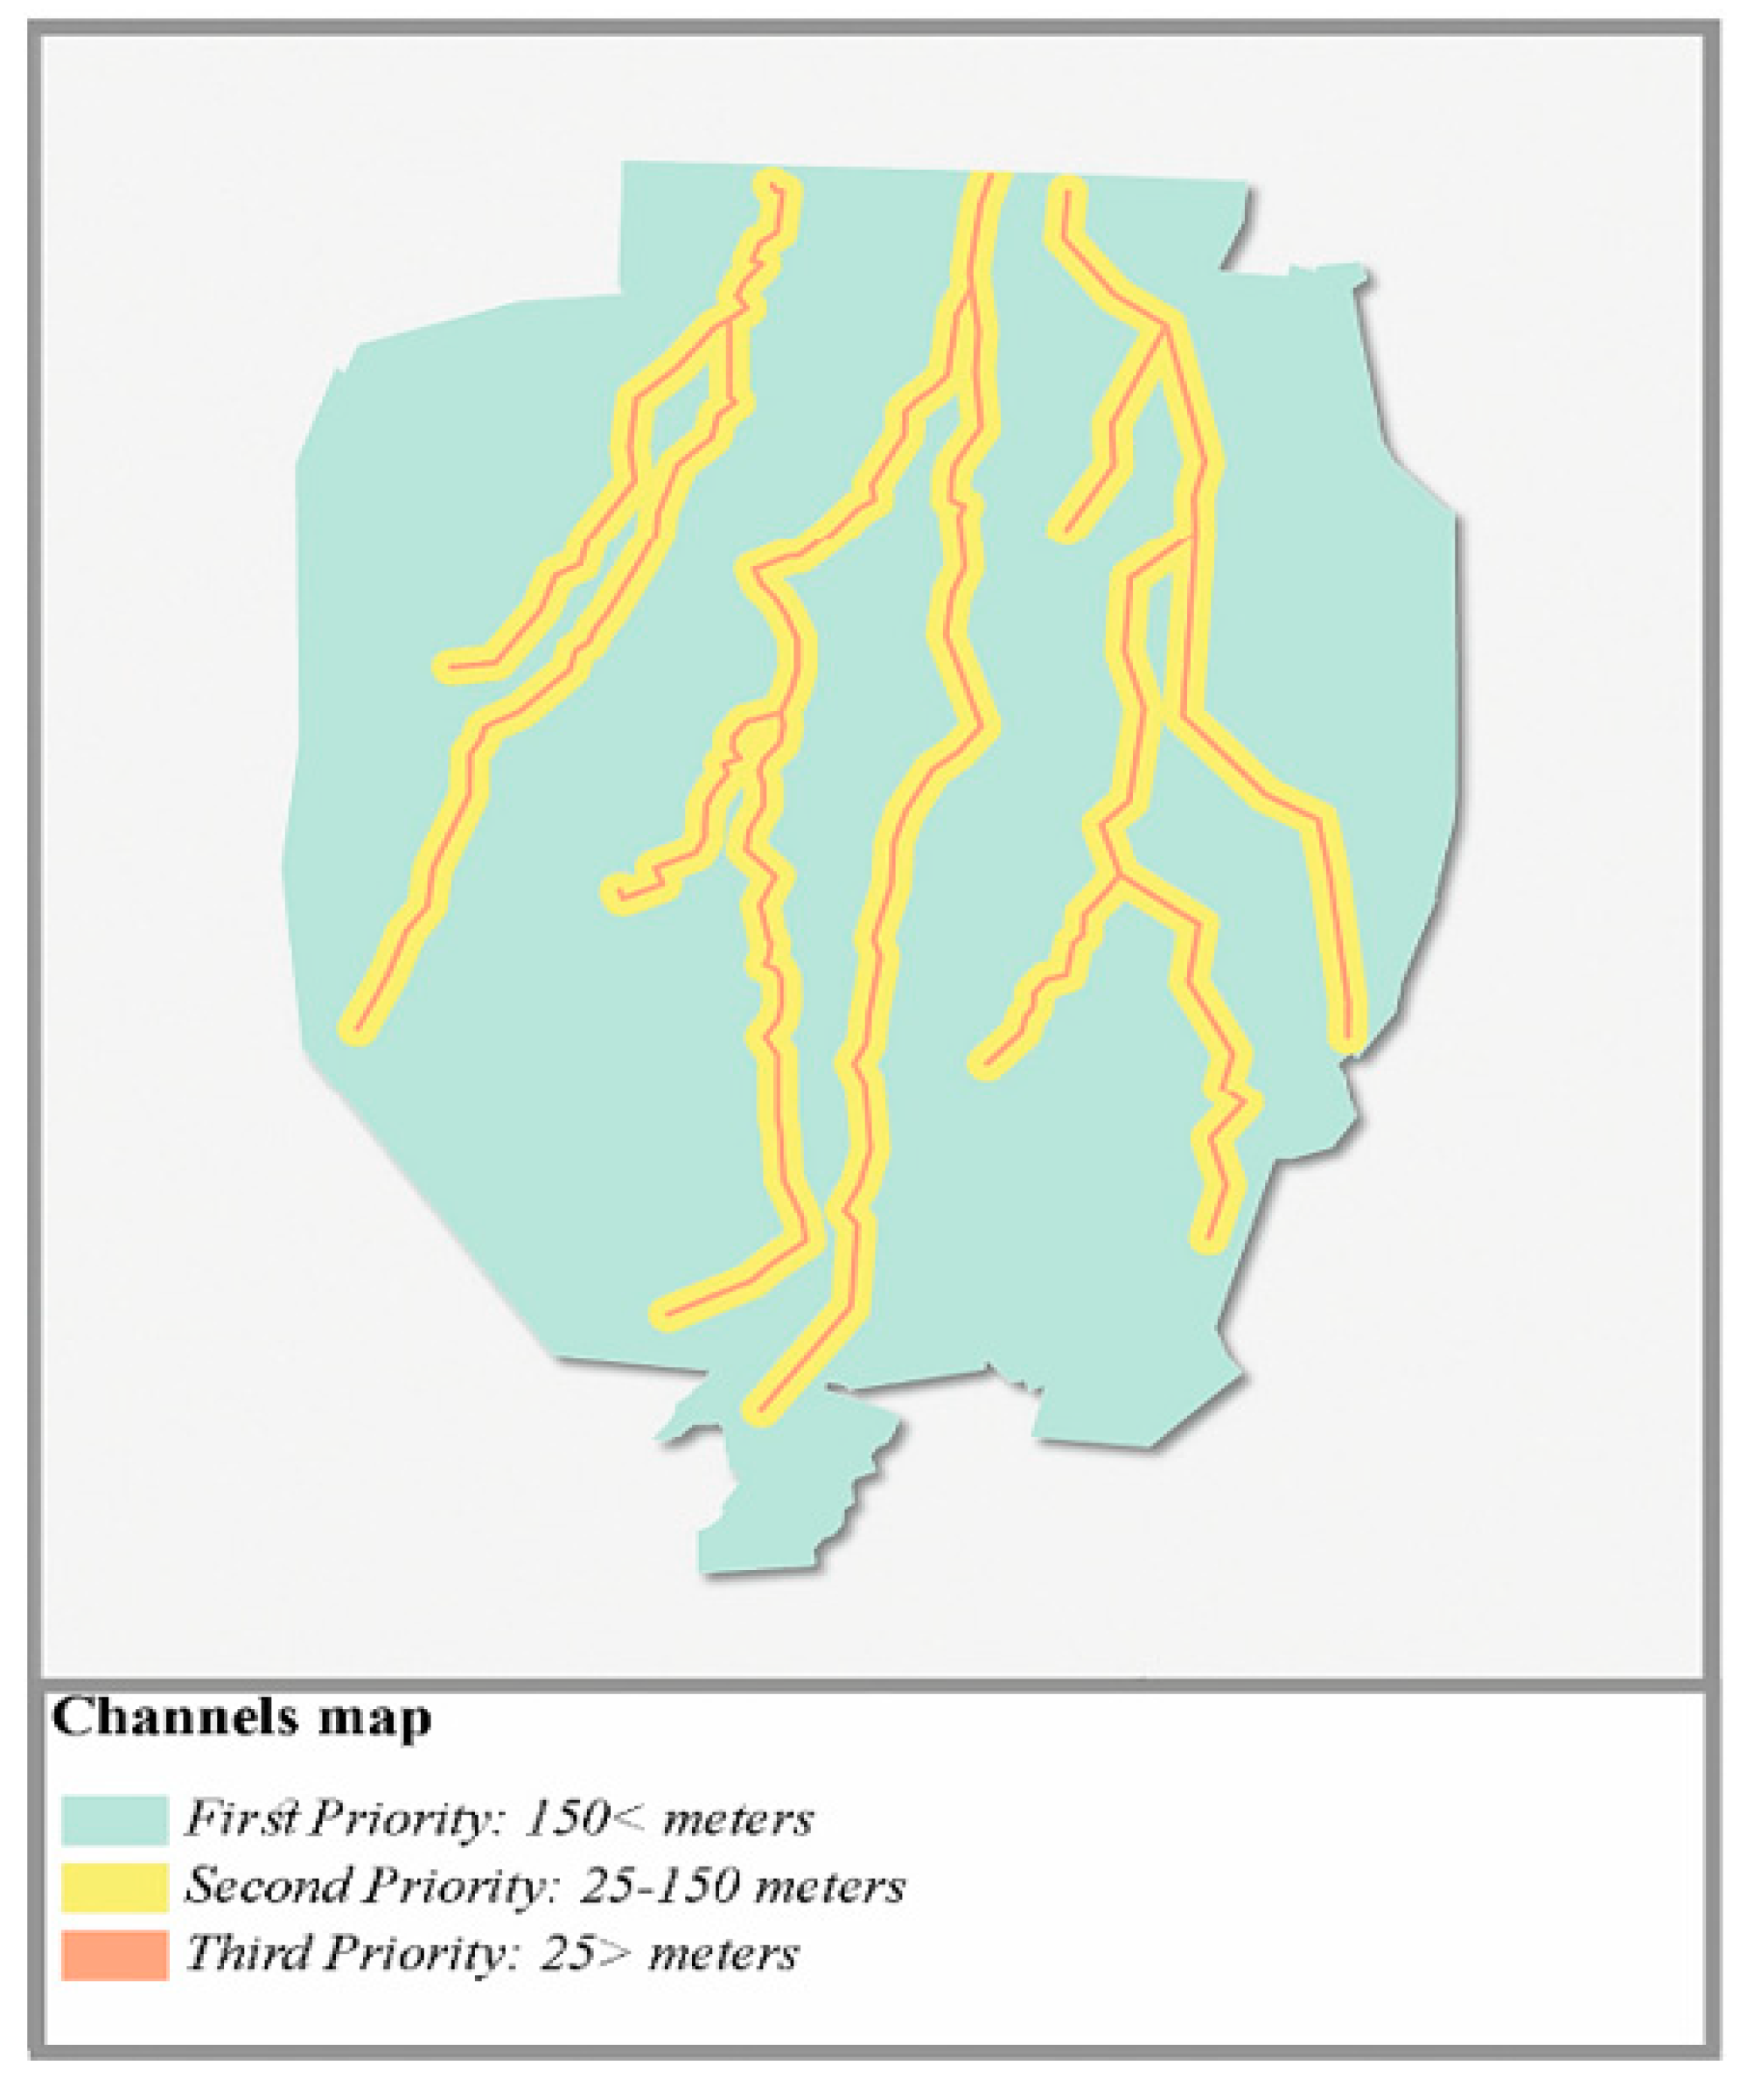
Figure 6.
The channels map of Hamedan based on the sub-criteria measures in
Table 1.
Figure 6.
The channels map of Hamedan based on the sub-criteria measures in
Table 1.
Figure 7.
The fault map of Hamedan based on the sub-criteria measures in
Table 1.
Figure 7.
The fault map of Hamedan based on the sub-criteria measures in
Table 1.
Figure 8.
The soil type map of Hamedan based on the sub-criteria measures in
Table 1.
Figure 8.
The soil type map of Hamedan based on the sub-criteria measures in
Table 1.
Figure 9.
The texture map of Hamedan based on the sub-criteria measures in
Table 1.
Figure 9.
The texture map of Hamedan based on the sub-criteria measures in
Table 1.
Figure 10.
The land parcels map of Hamedan based on the sub-criteria measures in
Table 1.
Figure 10.
The land parcels map of Hamedan based on the sub-criteria measures in
Table 1.
Figure 11.
The traffic map of Hamedan based on the sub-criteria measures in
Table 1.
Figure 11.
The traffic map of Hamedan based on the sub-criteria measures in
Table 1.
Figure 12.
The nodes map of Hamedan based on the sub-criteria measures in
Table 1.
Figure 12.
The nodes map of Hamedan based on the sub-criteria measures in
Table 1.
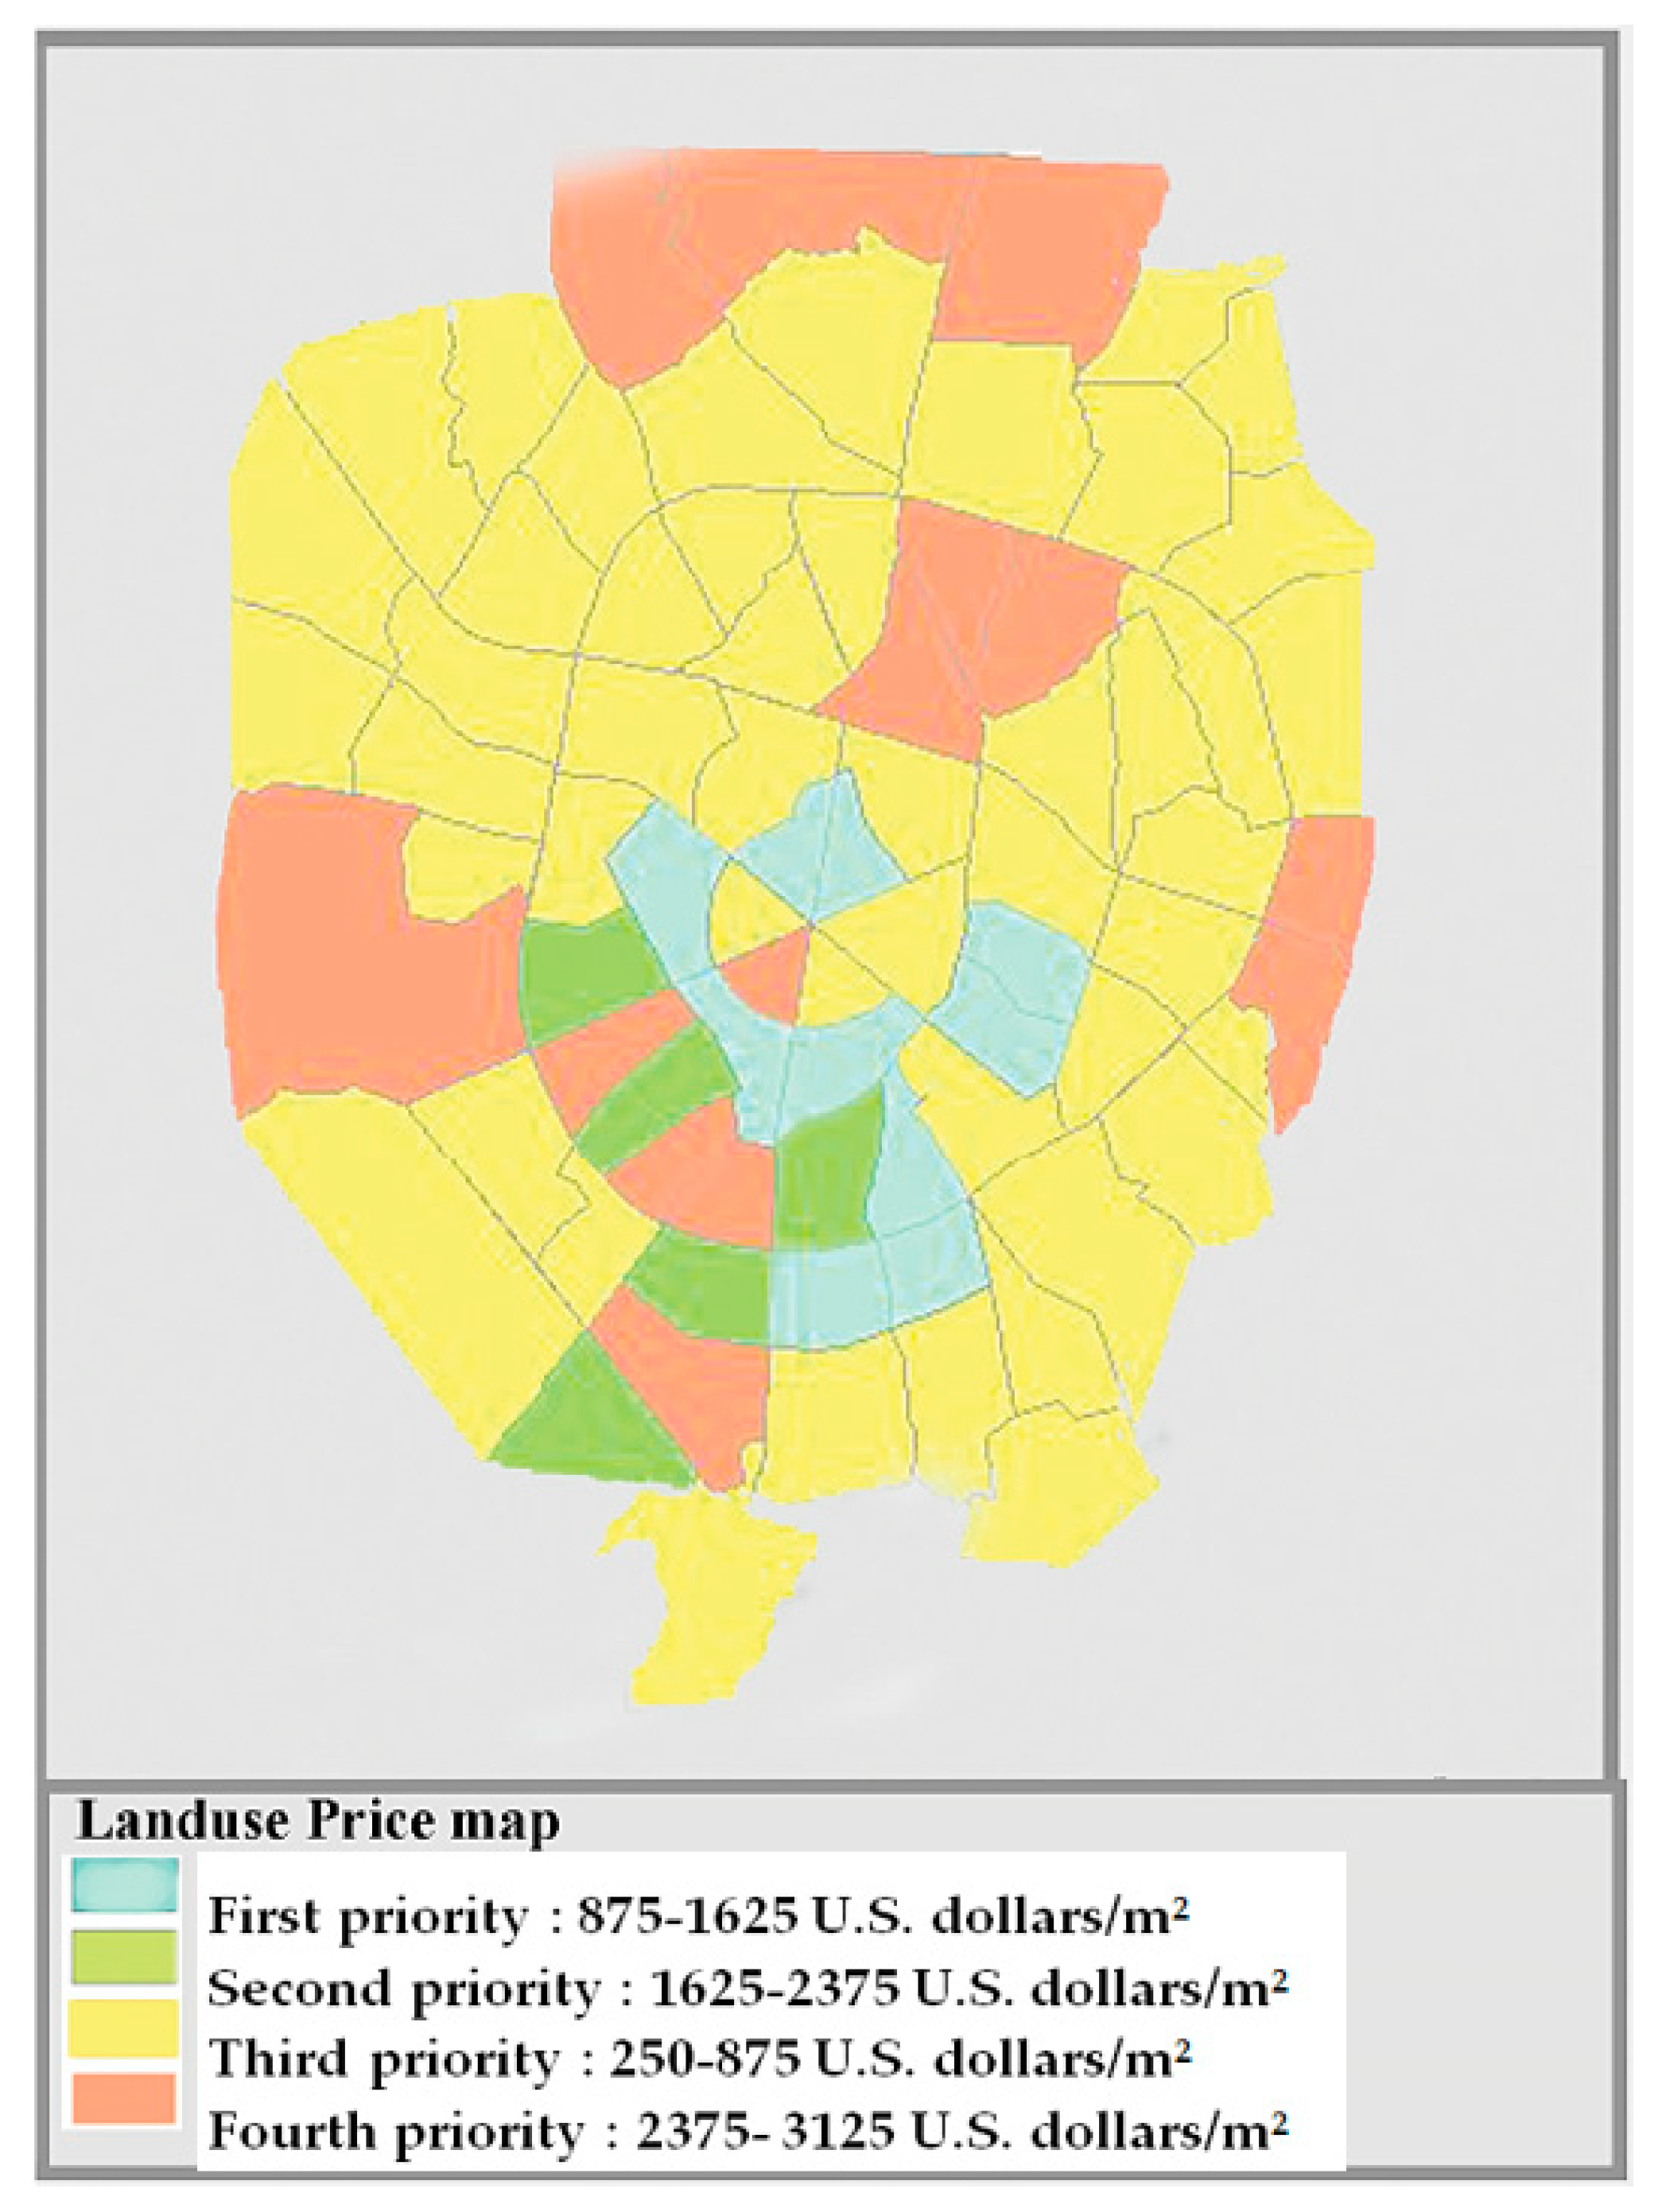
Figure 13.
The land price map of Hamedan based on the sub-criteria measures in
Table 1.
Figure 13.
The land price map of Hamedan based on the sub-criteria measures in
Table 1.
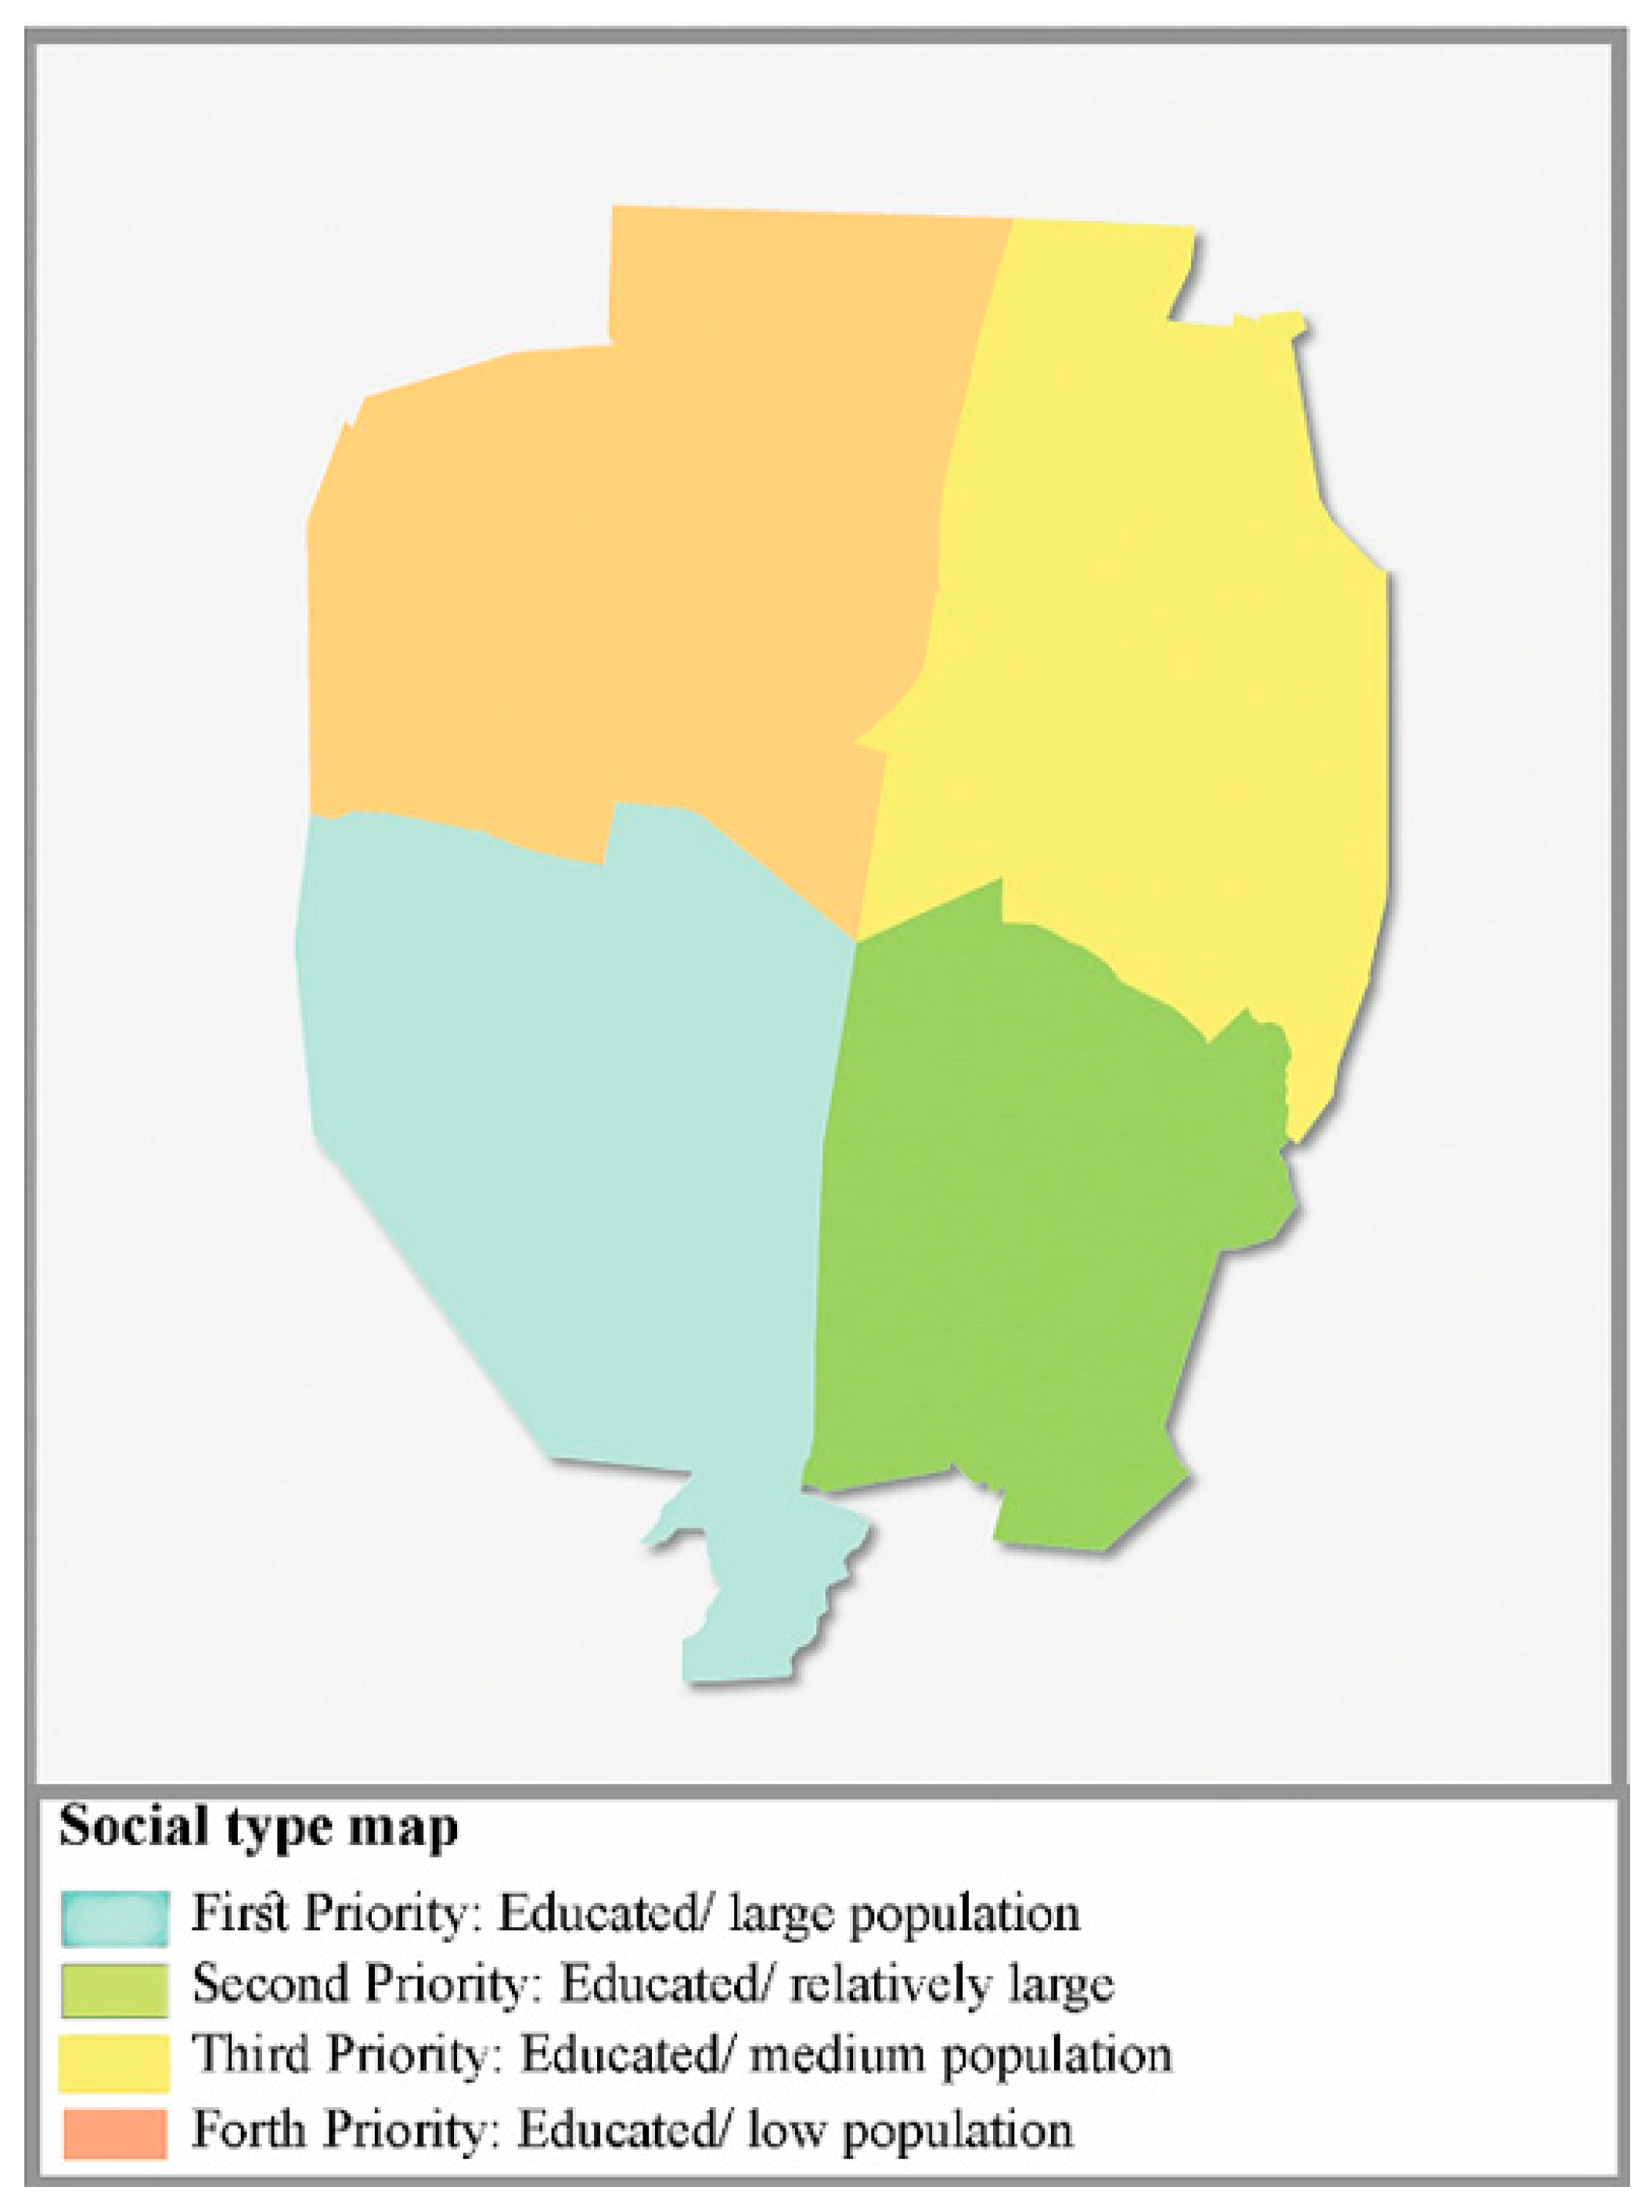
Figure 14.
The social type map of Hamedan based on the sub-criteria measures in
Table 1.
Figure 14.
The social type map of Hamedan based on the sub-criteria measures in
Table 1.
Figure 15.
The population density map of Hamedan based on the sub-criteria measures in
Table 1.
Figure 15.
The population density map of Hamedan based on the sub-criteria measures in
Table 1.
Figure 16.
The buffer map of Hamedan based on the sub-criteria measures in
Table 1.
Figure 16.
The buffer map of Hamedan based on the sub-criteria measures in
Table 1.
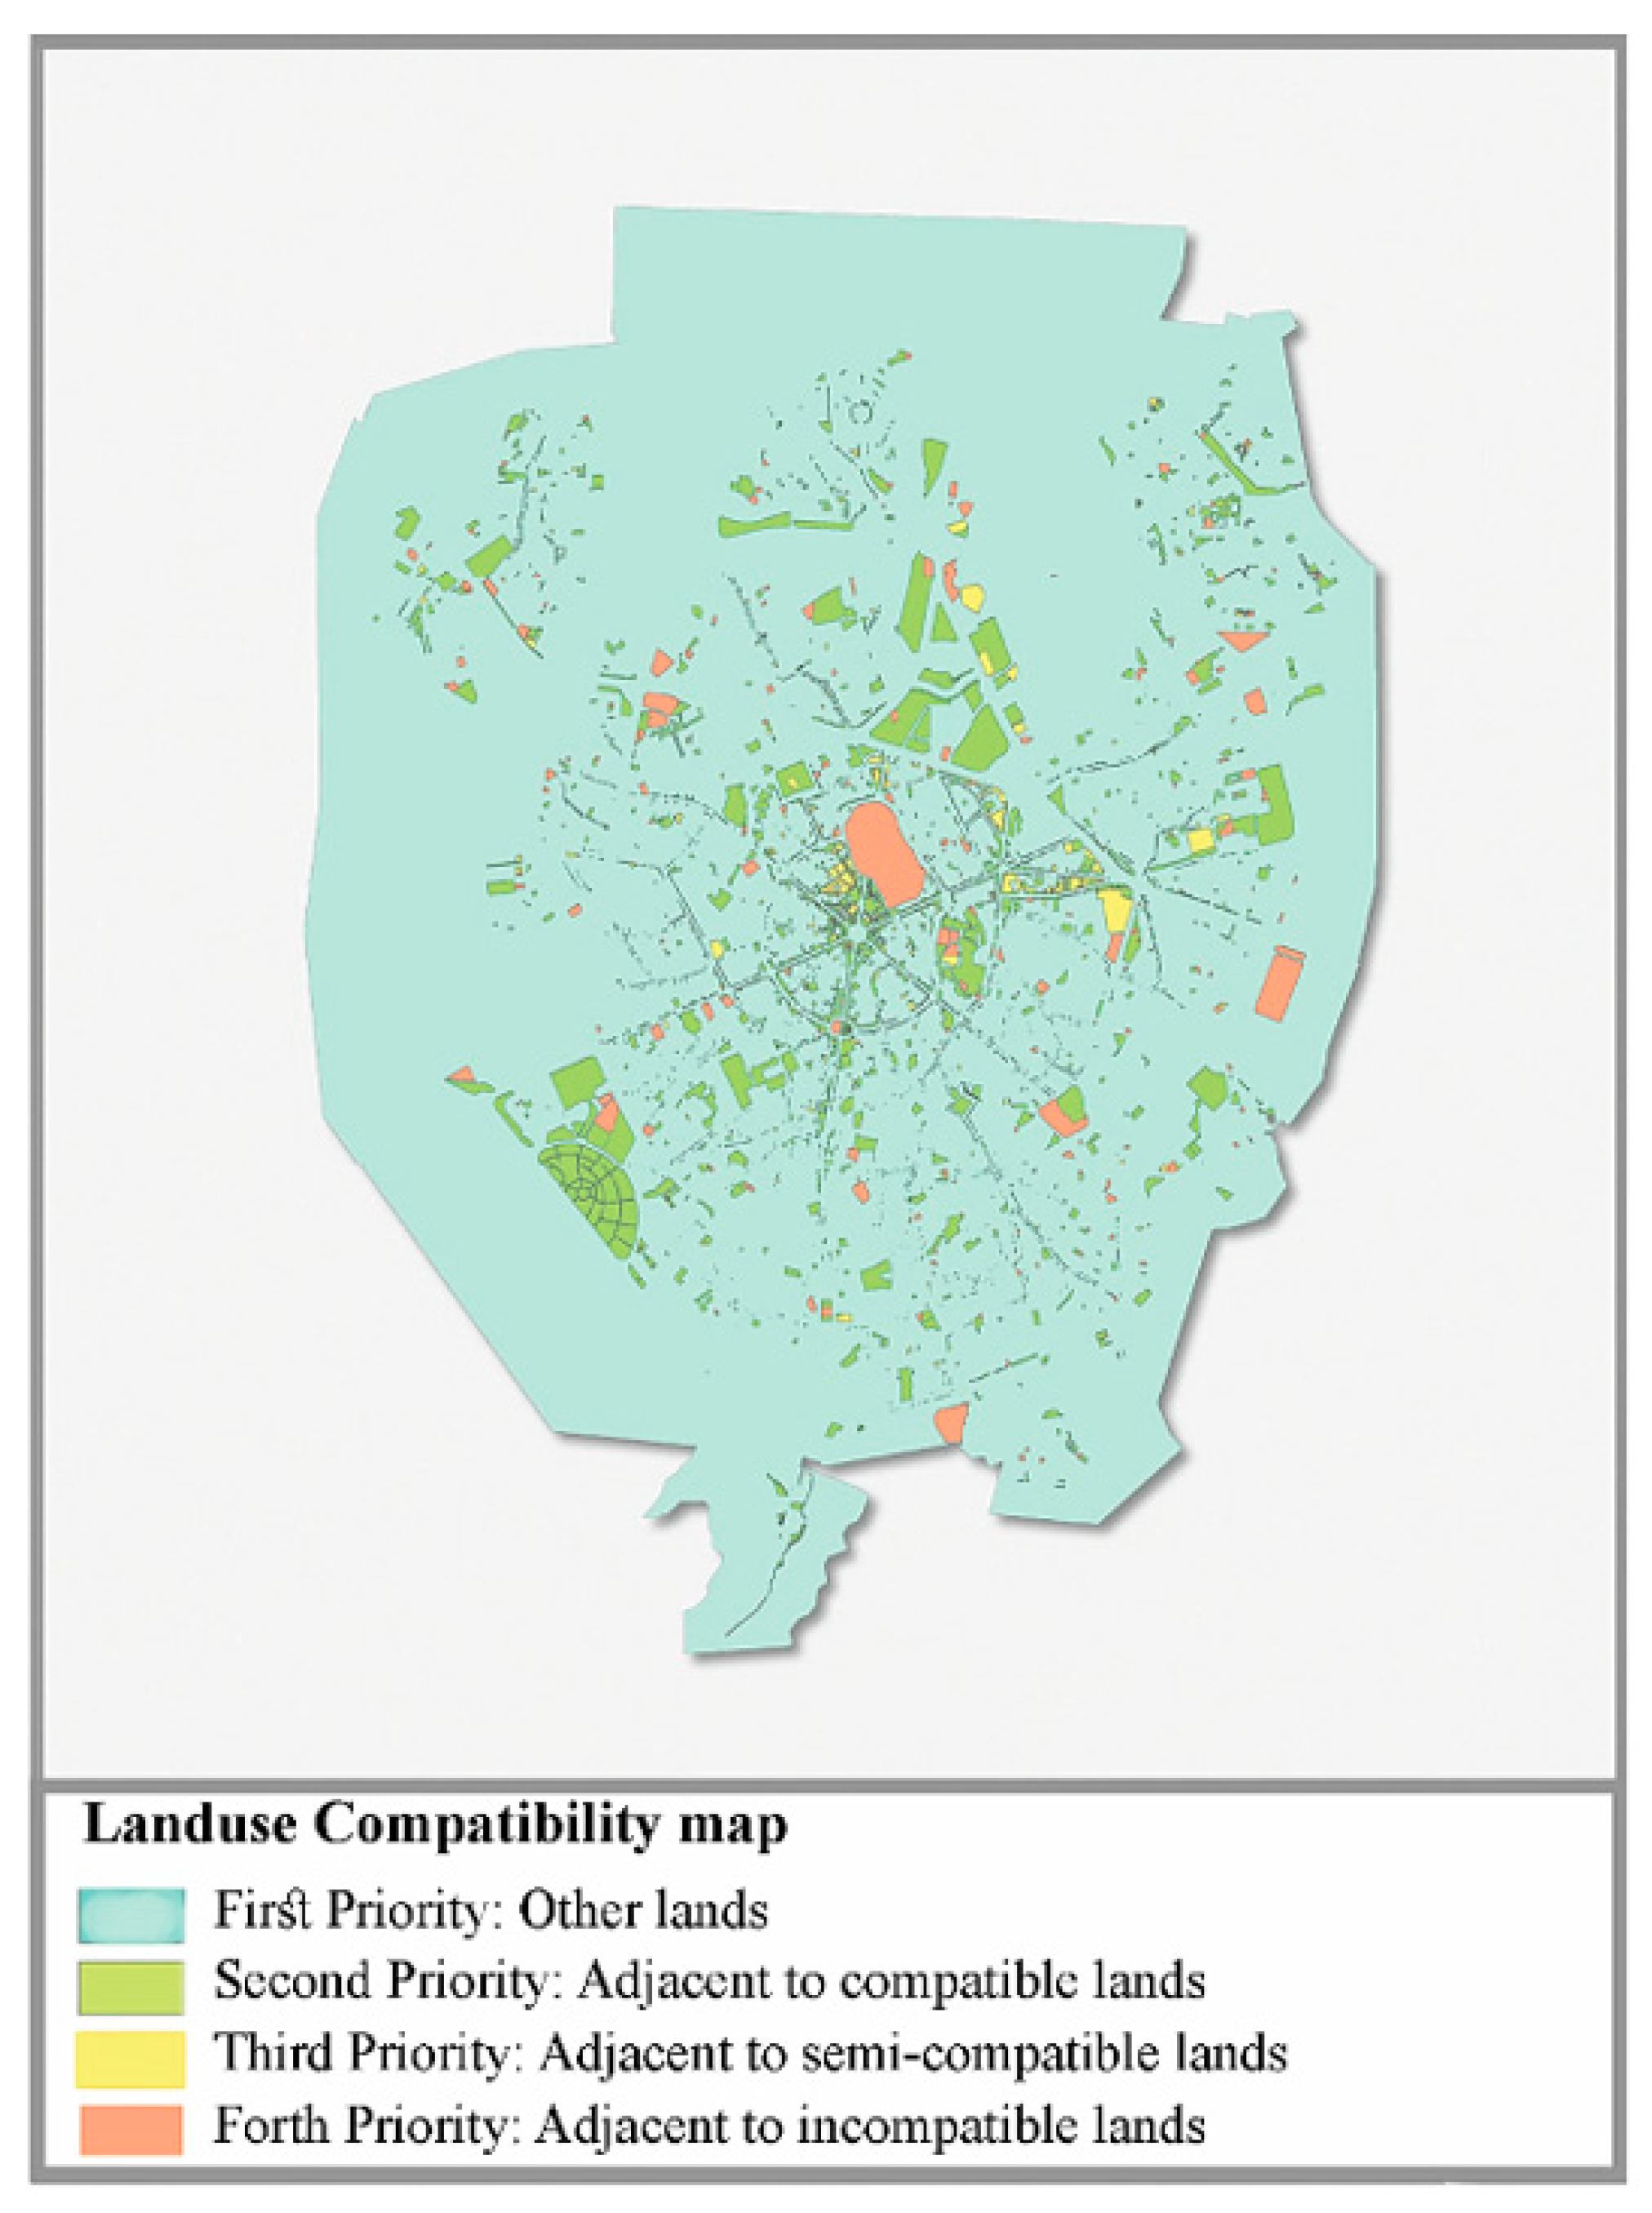
Figure 17.
The land-use compatibility map of Hamedan based on the sub-criteria measures in
Table 1.
Figure 17.
The land-use compatibility map of Hamedan based on the sub-criteria measures in
Table 1.
Figure 18.
The per capta service map of Hamedan based on the sub-criteria measures in
Table 1.
Figure 18.
The per capta service map of Hamedan based on the sub-criteria measures in
Table 1.
Figure 19.
The best urban areas for locating tall buildings. The map shows the priority of suitable places for tall buildings on a scale from dark blue (priority 1) to dark red (priority 8).
Figure 19.
The best urban areas for locating tall buildings. The map shows the priority of suitable places for tall buildings on a scale from dark blue (priority 1) to dark red (priority 8).
Figure 20.
The fuzzy visibility’s programmed process used in the Matlab software.
Figure 20.
The fuzzy visibility’s programmed process used in the Matlab software.
Figure 21.
A 3-D image of the fuzzy visibility’s programmed process. To do this, the larger side of tall buildings has 18 points (3 points in 6 rows), and the smaller side has 6 points; 48 points are defined exclusively, and the observer could see 24 points at best.
Figure 21.
A 3-D image of the fuzzy visibility’s programmed process. To do this, the larger side of tall buildings has 18 points (3 points in 6 rows), and the smaller side has 6 points; 48 points are defined exclusively, and the observer could see 24 points at best.
Figure 22.
Visibility map of hypothetical tall building No. 1.
Figure 22.
Visibility map of hypothetical tall building No. 1.
Figure 23.
Visibility map of hypothetical tall building No. 2.
Figure 23.
Visibility map of hypothetical tall building No. 2.
Figure 24.
Visibility map of hypothetical tall building No. 3.
Figure 24.
Visibility map of hypothetical tall building No. 3.
Figure 25.
Visibility map of hypothetical tall building No. 4.
Figure 25.
Visibility map of hypothetical tall building No. 4.
Figure 26.
Visibility map of hypothetical tall building No. 5.
Figure 26.
Visibility map of hypothetical tall building No. 5.
Figure 27.
Visibility map of hypothetical tall building No. 6.
Figure 27.
Visibility map of hypothetical tall building No. 6.
Figure 28.
Visibility map of hypothetical tall building No. 7.
Figure 28.
Visibility map of hypothetical tall building No. 7.
Table 1.
The criteria and sub-criteria for locating tall buildings and their weights based on expert opinion, formulated using the ANP method and Super Decisions V2.8 software.
Table 1.
The criteria and sub-criteria for locating tall buildings and their weights based on expert opinion, formulated using the ANP method and Super Decisions V2.8 software.
| | Criterion | Criterion Weight | Sub-Criteria | Sub-Criteria Weight | Measure | Priority |
|---|
| 1 | Environmental (natural-geological factors) | 0.04384 | Slope | 0.04355 | 0–5% | 1 |
| 5.1–10% | 2 |
| 10.1–15% | 3 |
| >15% | 4 |
| Channel (surface and underground sewage) | 0.00062 | 0–25 m | 3 |
| 25–150 m | 2 |
| >150 m | 1 |
| Fault | 0.02851 | 0–500 m | 3 |
| 500–1000 m | 2 |
| >1000 m | 1 |
| Soil type | 0.00026 | Clay soil | 1 |
| Sandy soil | 2 |
| 2 | Physical | 0.41614 | Texture | 0.2445 | Low density | 1 |
| Medium density | 2 |
| dense | 3 |
| Non-residential | 4 |
| Land parcels | 0.00328 | >1000 m | 1 |
| 800–1000 m | 2 |
| 600–800 m | 3 |
| Others | 4 |
| 3 | Accessibility and transportation | 0.2547 | Traffic | 0.11677 | Primary road | 1 |
| 30 m street | 2 |
| Street | 3 |
| Others | 4 |
| Nodes | 0.03184 | short distance (first line) | 3 |
| Medium distance (second line) | 2 |
| Long distance (third line and so on) | 1 |
| 4 | Socio-economic | 0.07933 | Land price | 0.25698 | 2375–3125 U.S. dollars /m2 | 4 |
| 1625–2375 U.S. dollars/m2 | 2 |
| 875–1625 U.S. dollars/m2 | 1 |
| 250–875 U.S. dollars/m2 | 3 |
| Social type | 0.00398 | Educated/ low population | 4 |
| Educated/medium population | 3 |
| Educated/relatively large | 2 |
| Educated/large population | 1 |
| Population density | 0.18223 | dense | 4 |
| Medium density | 3 |
| Medium density | 2 |
| Low density | 1 |
| 5 | Land-use | 0.20598 | Buffer | 0.04608 | short distance | 2 |
| Long distance | 1 |
| Land-use compatibility | 0.00446 | Incompatible land-use | 3 |
| Semi-compatible land-use | 2 |
| Compatible land-use | 1 |
| Per capita urban services | 0.03695 | Low service | 4 |
| Medium service | 3 |
| Acceptable service | 2 |
| Optimal service | 1 |
© 2020 by the authors. Licensee MDPI, Basel, Switzerland. This article is an open access article distributed under the terms and conditions of the Creative Commons Attribution (CC BY) license (http://creativecommons.org/licenses/by/4.0/).

 ,
, 


