Article

Effects of Differential Jump Training on Balance Performance in Female Volleyball Players

1
Department of Sport and Exercise Science, University of Salzburg, Schlossallee 49, Hallein-Rif, 5400 Salzburg, Austria
2
Department of Human Sciences, Society and Health, University of Cassino e Lazio Meridionale, Viale dell’Università, 03043 Cassino FR, Lazio, Italy
*
Authors to whom correspondence should be addressed.
Appl. Sci. 2020, 10(17), 5921; https://doi.org/10.3390/app10175921
Submission received: 15 July 2020 / Revised: 18 August 2020 / Accepted: 24 August 2020 / Published: 26 August 2020
(This article belongs to the Special Issue Applied Biomechanics: Sport Performance and Injury Prevention)

Abstract

:

Featured Application

The presented training concept can be applied to combine two seemingly contradictory desired effects that are associated with increased jump performance and injury prevention in an effective and efficient way without adding excess physiological stress.

Abstract

The purpose of this study was to determine whether coordinative jump training that induces neuromuscular stimuli can affect balance performance, associated with injury risk, in elite-level female volleyball players. During the competitive season, the balance performance of 12 elite female players (highest Austrian division) was obtained via a wobble board (WB; 200 Hz) placed on an AMTI force plate (1000 Hz). Three identically repeated measurements defined two intervals (control and intervention phases), both comparable in duration and regular training. The intervention included 6 weeks of differential training (8 sessions of 15–20 min) that delivered variations in dynamics around the ankle joints. Multilevel mixed models were used to assess the effect on postural control. WB performance decreased from 27.0 ± 13.2% to 19.6 ± 11.3% during the control phase and increased to 54.5 ± 16.2% during the intervention (β = 49.1 ± 3.5; p < 0.001). Decreased sway area [cm²] (β = −7.5 ± 1.6; p < 0.001), anterior–posterior (β = −4.1 ± 0.4; p < 0.001) and mediolateral sway [mm] (β = −2.7 ± 0.6; p = 0.12), and mean velocity [mm∙s−1] (β = −9.0 ± 3.6; p < 0.05) were observed during the intervention compared with the control phase. Inter-limb asymmetry was reduced (β = −41.8 ± 14.4; p < 0.05). The applied training concept enhanced balance performance and postural control in elite female volleyball players. Due to the low additional physiological loads of the program and increased injury risk during the competitive season, we recommend this intervention for supporting injury prevention during this period.

1. Introduction

Sport-specific performance training is required in all sports to achieve a high international level. In volleyball, an important performance criterion correlating with competition level and a main objective in volleyball conditioning programs is to increase jump height [1]. This is commonly achieved through various types of strength and power training [2,3]. On the other hand, volleyball is known for its severe risk of ankle injuries during jumping [4] that cannot be prevented by strength training alone [5]. Therefore, traditional performance training should be accompanied by additional injury prevention programs [4]. The most frequent injury is ankle sprains [4], which are associated with chronic ankle instability and an increased chance of recurrence [5]. Neuromuscular impairment due to traumatized mechanoreceptors of the ligaments and muscles in the ankle is expected to cause the recurrence of sprains [5]. Unsurprisingly, neuromuscular and proprioceptive training has shown positive effects and is recommended to prevent ankle injuries [5,6]. Such training consists of balance exercises on stable and unstable platforms or the combination of, e.g., balance, plyometric, and sport-specific exercises [6]. The objective is to improve proprioception and neuromuscular responses. Thus, mechanoreceptors and stabilizing muscles around the ankle sense and process the risk of balance loss early and can react in time to prevent falls and injuries.
Recent technical-coordinative jump training [7] may have targeted both performance and prevention aspects during volleyball spike jumping. The concept was based on differential training [8,9], which applies movement variability and allows for adaptations in neuromuscular activation patterns [10]. Differential training has been shown to provide good transferability of training effects on sport-specific jump performance when compared with traditional concepts [11]. The program focused on spike jump performance determinants [12], centering around approach velocity, feet position, and velocity conversion strategy through the dominant leg (i.e., side of the striking arm). The conversion strategy is associated with neuromuscular activation patterns in the lower limbs [13]. Therefore, the emphasis and implementation of numerous variations in these movement characteristics is expected to constantly create proprioceptive and neuromuscular stimuli for ankle stabilization. The effect of such differential jump training on prevention can be operationalized via balance assessment, since reduced balance performance can be associated with an increased risk of injury [14]. Both injury prevention and balance performance are affected by the proprioceptive and neuromuscular systems that stabilize and maintain balance [5,6,15,16]. Therefore, a transfer of effects on balance performance during such differential jump training can be presumed.
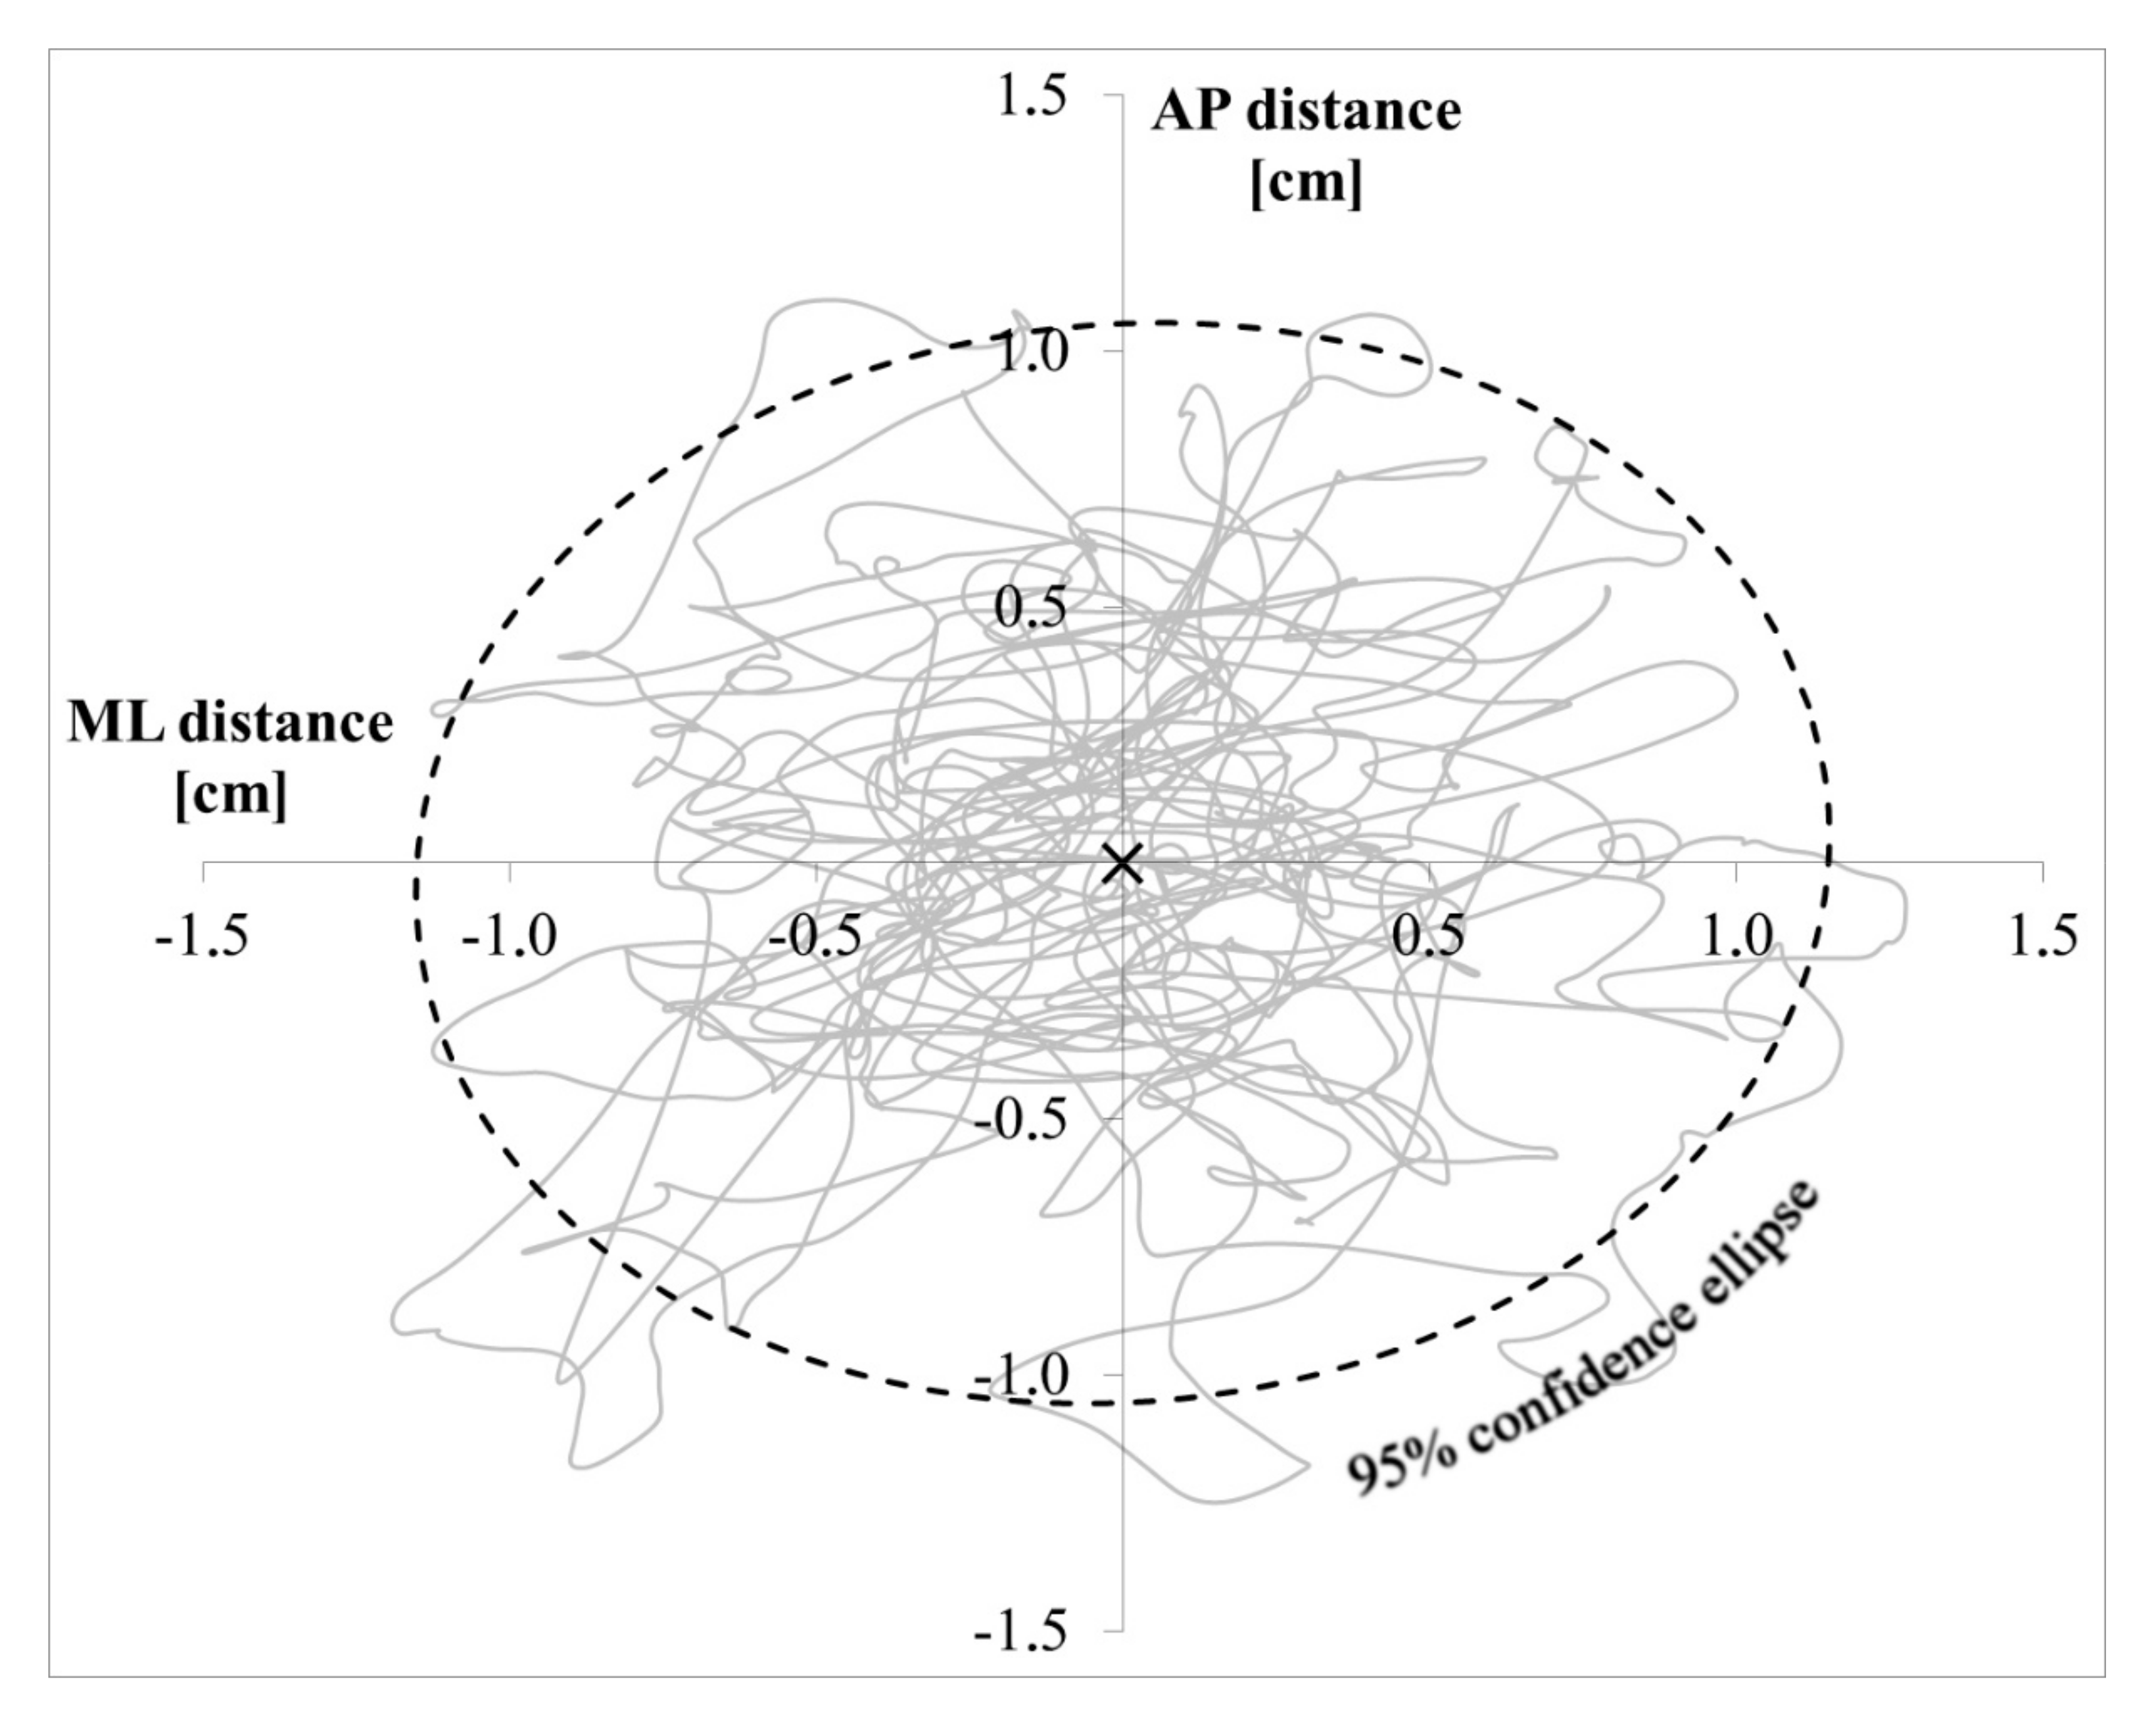
For balance assessment, quantitative posturography via force platforms is considered the gold standard and superior to functional balance tests with respect to sensitivity and objectivity [17]. The most frequently analyzed characteristic is the excursion of the center of pressure (CoP) [18]. However, there are many variables that can be calculated from the CoP. A systematic review of 32 published articles involving CoP analyses recommended including both distance (e.g., sway area) and time–distance (e.g., mean velocity) based variables [19]. Its authors advised against the usage of minimal, maximal, and peak-to-peak values as they represent severe data reduction, great variance, and low reliability [19]. It seems unclear whether to alternatively prioritize analyses on fractal dimensions or on resultant horizontal data [19]. The drawbacks of posturography via CoP are the numerous variables and uncertainty about the best choice among variables to reflect balance performance [19]. Moreover, the high costs, complex handling, and space required for the equipment often complicate its usage in clinical settings [17].
A handy and validated alternative with fair to excellent reliability is found in computerized wobble boards (WBs) [20]. WBs are unstable platforms frequently used in clinical and therapeutic settings. They can be equipped with, e.g., accelerometers to collect the WB tilt angle that can then be processed by software and displayed on a screen in real time. Besides their practical handling, the strength of WBs is the single output variable of balance performance (i.e., time spent at ~0° tilt). Moreover, classical assessment of the CoP when standing on a force platform can also be applied to standing on a WB [21]. Poor correlation between WB performance and the outcome of one of the most frequently used validated balance tests, the Y Balance Test [20], can be explained by the complexity of the underlying mechanisms of postural control [14] and different test-specific skills of postural control [20]. Since WBs are a common tool in sprain prevention programs [5] and are suitable for balance assessment in individuals with chronic ankle instability [16], their usage is reasonable for the context of the current study (i.e., injury prevention in high-risk individuals).
The objective of this study was to determine the effect of a differential-training-based jump intervention on postural control in high-level female volleyball players. It was hypothesized that a 6-week differential jump training regimen that induces proprioceptive and neuromuscular stimuli for ankle stabilization would improve WB balance performance and CoP characteristics.

2. Materials and Methods

2.1. Participants

A female volleyball team (nteam = 12) from the highest league in Austria participated in this study (age: 22.8 ± 3.7 years; training experience: 11.8 ± 3.8 years; body height: 1.78 ± 0.09 m; mass: 69.9 ± 9.4 kg; body mass index: 22.0 ± 1.9 kg∙m−2; spike jump height: 0.44 ± 0.09 m). Depending on player positions and associated jumping skills, players were categorized as spikers (n1 = 6), blockers (n2 = 2), or setters and libera (n3 = 4). The individual’s preferred striking arm during the volleyball spike defined the dominant side. In accordance with the Declaration of Helsinki, the study was approved by the local institutional research ethics committee (approval code: 29/2014). All players were informed about the risks, benefits, and procedure of the study. They signed a consent form and reported being free of injuries at the beginning of the investigation. The sample size was determined by the size of the team and the accessibility of such high-level athletes.

2.2. Study Design and Training Intervention

Three identical testing sessions were conducted during the competitive season (i.e., 1. Control, 2. Post-Control = Pre-Intervention, 3. Post-Intervention). Post-Control and Post-Intervention testing took place 5.5 ± 0.5 and 4.5 ± 0.5 days after the most recent match, respectively. The first interval (6.5 weeks) defined the control phase. The second interval (6 weeks) included an intervention with no systematic differences in the regular training scheme, training loads (8.8 ± 0.3 vs. 7.7 ± 0.2 h per week), and competition loads (both phases: 1 international, 7 national matches). This approach to assess training effects by comparing control and intervention phases has been used before [7,22]. A control group was not feasible for ethical reasons and due to the limited numbers of accessible elite female volleyball players [22].
The intervention consisted of eight sessions of differential training [8,9], 15–20 min per session, and focused on the volleyball-specific spike jump movement. Differential training implements movement variations to allow for individual adaptations towards an individual optimum. The concept was described by its founder [8]; the methodology and positive effects across sports, ages, and levels have been reported [23,24,25]. The objective of the applied training was to induce coordinative adaptations in previously identified performance determinants [12]. Variations in approach speed (thus, dynamics), feet positioning (thus, joint angles), and the distribution of weight and time-related power development through both legs (thus, neuronal activation patterns) create neuromuscular stimuli for stabilizing muscles around the ankles. In contrast to traditional balance training, these variations exploit system fluctuations [26] at the kinematic and kinetic levels. For instance, the athletes were instructed to vary the length of the penultimate step, the ankle joint angle at planting, and the pressure perceived at the left and right feet during planting. The exercises followed two concepts: (1) the athletes alternatingly performed two opposing, detrimental extremes, reducing the discrepancy between both variations after each pair of trials; and (2) starting from one detrimental extreme, the players approached an individual optimum. A detailed description of the program and a full list of variations are available [7].

2.3. Data Collection and Processing

Three identical repeated measurements were made, following a validated protocol and instructions [20].
The participants performed test trials for familiarization with a validated mediolateral and anterior–posterior tilting WB equipped with tri-axis accelerometers (GSJ Service, Rome, Italy) [20]. Subsequently, three trials per leg (30 s per trial) of a single-leg stance on the WB, hands at the hips, were measured at 200 Hz. The sequence was blocked for legs and randomized for participants. In real time, validated software (GSJ Service, Rome, Italy) [20] displayed a motion marker based on the WB tilt angle and circles around a central area (~0° WB tilt) on a screen in front of the participants. Participants aimed to keep the motion marker within the central area for as long as possible over the full span of each trial. To prevent fatigue, there was approximately one minute of break time between trials.
Simultaneously, a force platform (120 × 60 cm; AMTI, Watertown, MA, USA) recorded ground reaction forces at 1000 Hz. The CoP was calculated in Visual3D (C-Motion, Inc., Rockville, MD, USA). Based on residual analyses [27] of the current data and a recommendation for CoP filtering [19], a fourth-order zero-lag Butterworth low-pass filter at 10 Hz was applied (Supplementary Materials).

2.4. Criterion Variables and Definitions

WB performance was defined as the time for which the WB was kept at ~0° tilt, divided by the trial duration [%]. In agreement with a CoP review [19], ground reaction forces were used to compute the sway area (i.e., 95% confidence ellipse; see Figure 1), mediolateral and anterior–posterior sway (i.e., fractal standard deviation), and mean velocity of sway (i.e., total CoP path distance, divided by trial duration). As a characteristic associated with injury risk, the inter-limb asymmetry [%] was also calculated [28]. Development during the phases was defined as the difference between two measurements. Development in WB performance and asymmetry is displayed as percentage points (e.g., a rise from 20% to 40% equals a development of +20% points). For all variables, outliers [mean ± 2 times the standard deviation (SD)] within participants were removed.

2.5. Statistical Analyses

PASW Statistics (version 18.0; SPSS Inc, Chicago, IL, USA) was used for statistical analyses and Office Excel 2019 (Microsoft Corporation, Redmond, WA, USA) was used for visualization. For WB performance, as the primary interest of this investigation, linear multilevel mixed model analyses accounting for the repeated effect of trials were applied. The superiority of such an approach over traditional analysis of variance has been explained by reviews, technical reports, and empirical assessments with real data [29,30,31], and the reasons include the way of handling missing data and interindividual variance. Since both were observed in the current data, this approach was suitable for the specific set of data and purpose. Such a model predicts a dependent variable (i.e., WB performance) in consideration of fixed and random effects of intercepts and independent variables (i.e., measurement session, phase, leg used during the trial, player position). A random intercept was considered for participants and fixed and random effects for independent variables. A fixed intercept was defined as a pre-intervention measurement to allow for comparison with control and post-intervention measurements. Effects were included one after another, and the fit of the derived models was assessed for effects and specifications of covariances via chi-square (X2) statistics based on -2 log-likelihood and degrees of freedom (df) [30,31]. The covariance structures for independent variables were defined after assessment of the correlation matrix and confirmed by the fit of the model when compared to alternative models. The covariance structure of the random intercept was specified as the variance component for all models. Depending on the data type, collinearity was checked via Pearson or Spearman correlation analyses, and none was found. Among models of comparable fit, the one with the smallest number of parameters was accepted as the final model. All analyses were performed using maximum-likelihood estimation [31]. The same statistical approach was applied for comparison of the developments between the control and intervention phases, with development during the control phase as a fixed intercept. Following the same procedure as for WB performance, the most successful single-predictor models with variable-specific specification of the covariance structure were calculated for each other dependent variable (i.e., inter-limb asymmetry, sway area, mediolateral sway, anterior–posterior sway, and CoP velocity). The performances at all measurement sessions are presented as mean ± SD and 95% confidence intervals (CIs). The results are presented as F-value, degree of freedom (df), estimate (β), and standard error (SE). p-values below 0.05 were considered significant.

3. Results

One ankle sprain occurred during the control phase, with no effect on data collection and presentation. One participant missed the first measurement; removal from analyses was not required thanks to the statistical approach.
The performances at the three measurement sessions, covariance specifications of the final models, and the effects of measurements are presented in Table 1.
The best model with measurement as the only predictor for WB performance included a fixed and a random intercept, a fixed slope for measurement, and an error. It detected a main effect for measurements (F(2,58.24) = 173.83, p < 0.001), decrease from control to pre-intervention (β = −8.86, SE = 2.36, p < 0.001), and increase from pre- to post-intervention (β = 40.69, SE = 2.29, p < 0.001). The random intercept for participants yielded 65.95% of this model’s overall variance (p < 0.05).
The final model with the best fit consisted of 18 parameters (X2 = 29.29, ∆df = 13, p < 0.01, compared with the initial model). It was expressed by the following equation, where Yis (WB performance), Xis (measurement), Zis (leg), and εis (error) vary as functions of individual observations (i; level 1 variable) and participants (s; level 2 variable). b0 and u0s represent a fixed and a random intercept, respectively; b1, b2, and b3 define the gradients.
Yis = (b0+ u0s) + b1Xis + b2Zis + b3XisZis + εis
Besides the effects of measurements (Table 1), no effect was found for leg (F(1,26.10) = 0.33, p = 0.57), but an effect was found for the interaction of measurement by leg (F(2,20.19) = 6.98, p < 0.01). The random intercept for participants yielded 0.41% of this model’s overall variance (p < 0.05).
Additional fixed and random effects did not produce significantly improved models (best alternative model including player position as a random effect, compared with the final model: X2 = 1.14, ∆df = 1, p = 0.28).
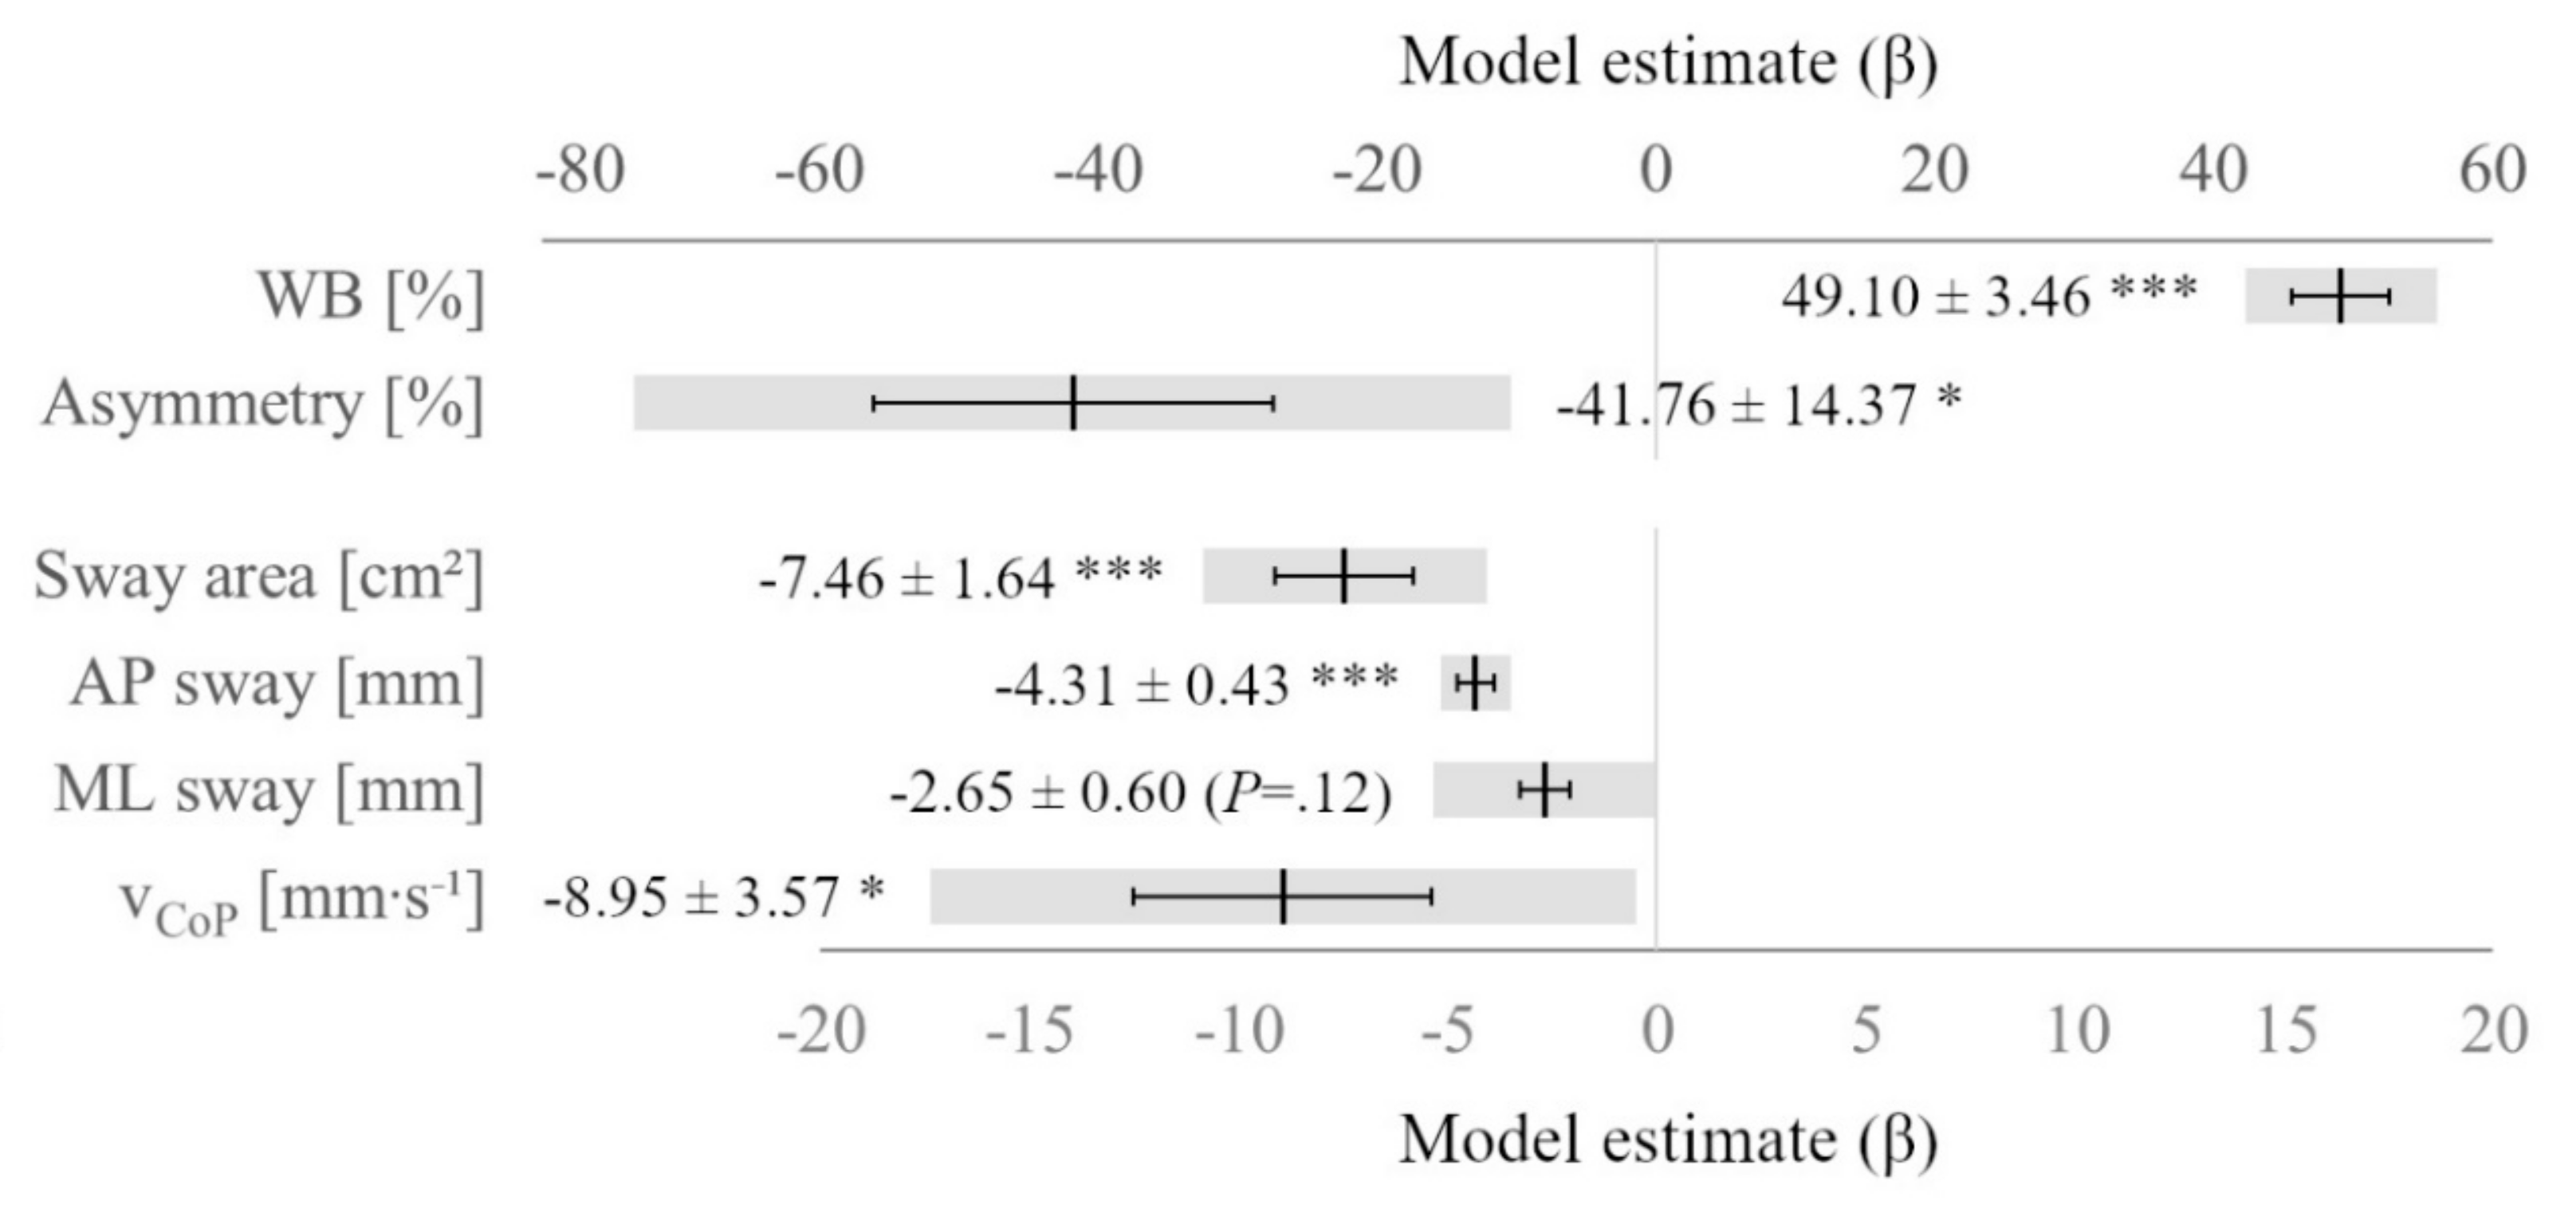
Model-based effects between the control and intervention phases are displayed in Figure 2.
The final model for WB performance over the phases consisted of three parameters and was expressed by the following equation, where Yi (WB performance), Xi (phase), and εi (error) vary as functions of individual observations (i). b0 represents a fixed intercept and b1 represents the gradient.
Yi = b0 + b1Xi + εi
The inclusion of random intercept, phase, leg, player position, and interactions as fixed and/or random effects did not deliver improved models (best models for each additional effect in comparison with the final model: 0 ≤ X2 ≤ 8.06, 1 ≤ ∆df ≤ 20, 0.09 ≤ p ≤ 1). In these alternative models, no effects were found for leg (F(1,46) = 2.87, p = 0.10), leg by phase (F(2,46) = 1.53, p = 0.23), position (F(1,46) = 2.24, p = 0.14), or position by phase (F(2,46) = 1.48, p = 0.24).
For all other criterion variables, the final models included significant random intercepts for participants.

4. Discussion

The objective of this study was to investigate the effects of sport-specific differential jump training on balance performance and associated injury risk in elite female volleyball players. A mixed model analysis was deemed suitable because it is superior to traditional statistical approaches in the current scenario [29,30,31]. The first reason for this was increased power, as mixed models are capable of handling missing data instead of removing a participant from analyses. This applied in the current data since one participant missed the first measurement session. Second, mixed models differentiate between interindividual variance and random error variance. Ignoring occurrent interindividual variability leads to over- or underestimation of statistical significance in repeated measures analysis of variance; in fact, this generates inaccurate results and can affect the overall interpretation [31]. The significant effects of the random intercept for participants indicated interindividual variance [29,31] in the current study and supported the usage of mixed models. In the simple model for WB performance, the random intercept explained two-thirds of the overall variance. This is a great but not exceptional amount (e.g., values of >50% are systematically reported in sleep deprivation) and underlines the relevance of accounting for interindividual variance [31]. The reduced (yet significant) variance in the more complex model is probably due to the added effects explaining variance that was previously absorbed by the random intercept.
The results showed decreased balance performance during the control phase. This was not surprising as decreased performance during the competitive season is known in volleyball and is explained by increased physiological loads [7,22]. Sway area and ML sway increased significantly, which is considered detrimental for postural control. Also, WB performance, AP sway, mean CoP velocity, and inter-limb asymmetry tended (0.08 ≤ p ≤ 0.36) to develop unfavorably. During the intervention, all variables improved significantly (except for AP sway, only indicating (p = 0.35) a beneficial development).
WB performance is a valid single outcome reflecting postural control [20], and it was found to be decreased in subjects with chronic ankle instability, which is associated with increased risk of ankle sprains [16]. Previous data showed that healthy limbs scored 19.6–21.8 s (i.e., 65.33–72.66%) in WB performance [16]. In the current study, WB performance was comparably low during the control (27.02 ± 13.18%) and pre-intervention (19.60 ± 11.31%) measurements. This indicates and corroborates the assertion that volleyball players are at high risk for ankle sprains [4], since reduced balance performance is associated with increased ankle instability [16] and injury incidence [6]. After the 6-week intervention, WB performance (59.49 ± 16.16%) almost reached the level of the previously reported healthy limbs [16]. Interestingly, there is some evidence that it takes 8–10 weeks of neuromuscular training to reduce injury risk to a baseline level [5]. Therefore, it can be presumed that a prolonged intervention of the current type may have closed the gap between the currently achieved WB performance and the baseline level of healthy limbs.
CoP variables were considered insightful in addition to WB performance and were selected in agreement with a review on CoP analyses [19]. This review recommends the consideration of multiple variables because reports are controversial, no single gold standard is apparent, and various variables may reflect different aspects of postural control [19]. In the case of conflicting findings, individual assessment of the CoP variables allowed for specific interpretation of single characteristics. However, the developments of all CoP variables were in line with the change in WB performance, showing detrimental trends during the control phase and beneficial changes during the intervention phase. Based on this, we cannot conclude that specific CoP variables were more suitable for WB performance than others. Moreover, the data do not indicate that specific CoP variables reflect different aspects of postural control on WB. Despite mean velocity being the most reliable CoP variable [19], its values should be interpreted with caution. Mean velocity easily gives the misleading impression of reflecting adaptability (i.e., quick adjustment of CoP to keep the center of mass within the base of stability). However, the mean velocity is calculated as the total path of the CoP normalized by time [19]. Therefore, it reflects total sway and does not provide additional information about adaptability. No recommendation was found in the literature to properly quantify adaptability in balance performance.
Decreased inter-limb asymmetry is considered desirable. Therefore, a detrimental trend during the control phase and a beneficial change during the intervention phase were observed. The recommended equation to calculate asymmetry includes the smaller of the two values from both legs as the denominator [28]. Thus, asymmetry values rapidly approach 100% if the smaller value is close to 0, even when only a small absolute discrepancy between both values exists. Such values usually do not occur in the analyses of net peak vertical ground reaction forces where this equation was applied previously [28]. However, this problem was identified in one case during the current study and should be considered in future investigations. This data point was excluded from further analyses. Removal of this data point did not change the statistical outcome.
The results of the comparison of developments during both phases (Figure 2) are in line with the analyses across the three measurement sessions (Table 1). Throughout all variables, beneficial trends were observed during the intervention when compared with the control phase. ML sway was the only variable where this trend did not reach statistical significance (p = 0.12). However, the full range of the 95% CI was found to be on the negative (i.e., beneficial) side of the scale. Therefore, it can be stated with 95% confidence for this study that the intervention induced a beneficial effect on ML sway compared with the control phase. Considering the large sizes of the model estimates in comparison with the baseline values during the control and pre-intervention measurements, the intervention produced a great, beneficial effect on postural control and inter-limb asymmetry.
The lack of a main effect of leg on performance implies that any leg-specific factors contributing to balance performance (e.g., previous injuries, chronic instability) were distributed equally to both legs. This result indicates that, in general, both legs performed comparably. However, the training program specifically stressed the usage of the dominant leg for approach velocity conversion, and an interaction effect of measurement by leg was observed. Probably, the focus of the jump training on the dominant leg induced different stimuli and resulted in different adaptations in the two legs.
For player position, no main or interaction effects were found. This suggests that, first, position was not a crucial factor in balance performance for volleyball players and, second, training stimuli do not need to be position-specific to achieve improvements.
Neuromuscular prevention training may only be effective in individuals with previous injuries [5]. Volleyball players are known to be a high-risk group with frequent ankle injuries [4]. The current data suggest that the participants’ balance performance prior to intervention was poor, even in comparison with individuals with chronic ankle instability [16]. Therefore, the same effects of training may not be expected in individuals with no history of injuries. However, transferability of the current findings to other high-risk sports and previously injured individuals seems reasonable.
The primary focus of the training program was to improve sports-specific jump performance via coordinative adaptations [7]. Jump height increased by 11.9%, and promising effects on biomechanical determinants were reported in detail [7]. Improvements in balance performance and ankle stabilization were expected side-effects thanks to neuromuscular stimuli that accompanied the implemented movement variations in the program. The positive effects of the differential jump training program on both jump and balance performance support its potential for combining two effects that are usually targeted separately. A repeated effect for balance performance may be expected, as a review on ankle sprains [5] suggested increased risk and training effects after reoccurring injuries. After every ankle sprain, the injury risk can be reduced to baseline risk via neuromuscular training within 8–10 weeks [5]. However, the repeated effect of the same program was not tested in the current study.
The longitudinal design of this study could be discussed as a limitation. This is a common difficulty; previously published investigations [7,22] applied the same study design and, thus, these data serve as a suitable reference. The control and intervention phases were comparable in terms of factors that were deemed potentially influential (except for the intervention program itself). All factors were reported and accounted for during the statistical analyses and interpretations. We are not aware of other factors that contributed to the training effects in a phase-specific fashion. A cross-sectional approach was not feasible for ethical reasons and due to the accessibility of such high-level female athletes.
To achieve the observed improvement in spike jump height, biomechanical understanding of specific performance determinants is required, which could be a challenge for coaches [7]. This is not the case regarding the effect on balance performance. The current training program did not target certain balance determinants specifically. The applied movement variations were expected to affect the dynamics around the ankle joints and thus induce neuromuscular stimuli for ankle stabilization. Therefore, it can be concluded that these nonspecific stimuli are the essential factor to generate the observed adaptations in postural control. This makes the program practical for a range of coaches, given that neuromuscular stimuli are delivered. It may be presumed that the great coordinative challenge in ballistic balance during the jumping variations has a positive effect on the static balance performance.
A longer intervention period (8–10 weeks) may result in even larger effects [5]. Preventive effects were not directly measured in this study but can be expected based on the observed effect on postural control and the associated injury risk [6], especially for interventions conducted immediately after sprains [5] and in high-risk individuals. Due to its low physiological loads and complementary effects in jump height and postural control, the program is feasible during the competitive season for the whole team. It is also recommended for individuals who cannot fully participate in regular training after an ankle sprain.

5. Conclusions

The current program was a differential jump training program that successfully provided complementary improvements in sport-specific jump performance and postural control, which is an indicator of injury risk and especially relevant for high-risk target groups (e.g., volleyball players). The program adds no severe physiological loads and requires no compromises in regular training. This suggests its potential for implementation during the competitive season to enhance performance and injury prevention without the risk of overtraining.

Supplementary Materials

The following are available online at https://www.mdpi.com/2076-3417/10/17/5921/s1, Data S1: data sheet, containing the data used in this study.

Author Contributions

Conceptualization, P.X.F., A.F., C.C. and H.W.; methodology, P.X.F., A.F., C.C. and H.W.; validation, P.X.F., A.F., C.C. and H.W.; formal analysis, P.X.F. and A.F.; investigation, P.X.F. and A.F.; resources, C.C. and H.W.; writing—original draft preparation, P.X.F.; writing—review and editing, P.X.F., A.F., C.C. and H.W.; visualization, P.X.F. and A.F.; supervision, C.C. and H.W.; project administration, P.X.F.; All authors have read and agreed to the published version of the manuscript.

Funding

This research received no external funding.

Acknowledgments

We want to thank the players and the coaches of the PSV Salzburg for participation in this training intervention study. Special thanks also to Kathryn A. Hill for technical support allowing us to advance the analytical measures used in this study.

Conflicts of Interest

The authors declare no conflict of interest.

References

  1. Ziv, G.; Lidor, R. Vertical jump in female and male volleyball players: A review of observational and experimental studies. Scand. J. Med. Sci. Sports 2010, 20, 556–567. [Google Scholar] [CrossRef] [PubMed]
  2. Powers, M.E. Vertical Jump Training for Volleyball. Strength Cond. J. 1996, 18, 18–23. [Google Scholar] [CrossRef]
  3. Sheppard, J.M.; Cronin, J.B.; Gabbett, T.J.; McGuigan, M.R.; Etxebarria, N.; Newton, R.U. Relative importance of strength, power, and anthropometric measures to jump performance of elite volleyball players. J. Strength Cond. Res. 2008, 22, 758–765. [Google Scholar] [CrossRef] [PubMed] [Green Version]
  4. Bahr, R.; Bahr, I. Incidence of acute volleyball injuries: A prospective cohort study of injury mechanisms and risk factors. Scand. J. Med. Sci. Sports 1997, 7, 166–171. [Google Scholar] [CrossRef] [PubMed]
  5. Verhagen, E.; Bay, K. Optimising ankle sprain prevention: A critical review and practical appraisal of the literature. Br. J. Sport Med. 2010, 44, 1082–1088. [Google Scholar] [CrossRef]
  6. Hübscher, M.; Zech, A.; Pfeifer, K.; Hänsel, F.; Vogt, L.; Banzer, W. Neuromuscular Training for Sports Injury Prevention: A Systematic Review. Med. Sci. Sports Exer. 2010, 42, 413–421. [Google Scholar] [CrossRef]
  7. Fuchs, P.X.; Fusco, A.; Bell, J.W.; von Duvillard, S.P.; Cortis, C.; Wagner, H. Effect of Differential Training on female volleyball spike jump technique and performance. Int. J. Sports Physiol. 2020, 15, 1019–1025. [Google Scholar] [CrossRef]
  8. Schöllhorn, W.I. Applications of systems dynamic principles to technique and strength training. Acta Acad. Olymp. Est. 2000, 8, 67–85. [Google Scholar]
  9. Schöllhorn, W.I.; Hegen, P.; Davids, K. The Nonlinear Nature of Learning—A Differential Learning Approach. Open Sports Sci. J. 2012, 5, 100–112. [Google Scholar] [CrossRef]
  10. Haudum, A.; Birklbauer, J.; Kröll, J.; Müller, E. Constraint-led changes in internal variability in running. J. Sports Sci. Med. 2012, 11, 8–15. [Google Scholar]
  11. Pfeiffer, M.; Jaitner, T. Sprungkraft im Nachwuchstraining Handball: Training und Diagnose. Z. Angew. Train. 2003, 10, 86–95. [Google Scholar]
  12. Fuchs, P.X.; Fusco, A.; Bell, J.W.; von Duvillard, S.P.; Cortis, C.; Wagner, H. Movement characteristics of volleyball spike jump performance in females. J. Sci. Med. Sports 2019, 22, 833–837. [Google Scholar] [CrossRef] [PubMed]
  13. Fuchs, P.X.; Menzel, H.-J.K.; Guidotti, F.; Bell, J.; von Duvillard, S.P.; Wagner, H. Spike jump biomechanics in male versus female elite volleyball players. J. Sports Sci. 2019, 37, 2411–2419. [Google Scholar] [CrossRef] [PubMed] [Green Version]
  14. Brown, C.N.; Mynark, R. Balance deficits in recreational athletes with chronic ankle instability. J. Athl. Train. 2007, 42, 367–373. [Google Scholar] [PubMed]
  15. Horak, F.B. Postural orientation and equilibrium: What do we need to know about neural control of balance to prevent falls? Age Ageing 2006, 35, ii7–ii11. [Google Scholar] [CrossRef] [Green Version]
  16. Fusco, A.; Giancotti, G.F.; Fuchs, P.X.; Wagner, H.; Varalda, C.; Cortis, C. Wobble board balance assessment in subjects with chronic ankle instability. Gait Posture 2019, 68, 352–356. [Google Scholar] [CrossRef]
  17. Mancini, M.; Horak, F.B. The relevance of clinical balance assessment tools to differentiate balance deficits. Eur. J. Phys. Rehab. Med. 2010, 46, 239–248. [Google Scholar]
  18. Crétual, A. Which biomechanical models are currently used in standing posture analysis? Neurophysiol. Clin. 2015, 45, 285–295. [Google Scholar] [CrossRef]
  19. Ruhe, A.; Fejer, R.; Walker, B. The test–retest reliability of centre of pressure measures in bipedal static task conditions—A systematic review of the literature. Gait Posture 2010, 32, 436–445. [Google Scholar] [CrossRef] [Green Version]
  20. Fusco, A.; Giancotti, G.F.; Fuchs, P.X.; Wagner, H.; Varalda, C.; Capranica, L.; Cortis, C. Dynamic balance evaluation: Reliability and validity of a computerized wobble board. J. Strength Cond. Res. 2020, 34, 1709–1715. [Google Scholar] [CrossRef]
  21. Janura, M.; Bizovska, L.; Svoboda, Z.; Cerny, M.; Zemkova, E. Assessment of postural stability in stable and unstable conditions. Acta Bioeng. Biomech. 2017, 19, 89–94. [Google Scholar] [CrossRef]
  22. Newton, R.U.; Rogers, R.A.; Volek, J.S.; Häkkinen, K.; Kraemer, W.J. Four weeks of optimal load ballistic resistance training at the end of season attenuates declining jump performance of women volleyball players. J. Strength Cond. Res. 2006, 20, 955–961. [Google Scholar]
  23. Coutinho, D.; Santos, S.; Conçalves, B.; Travassos, B.; Wong, D.P.; Schöllhorn, W.; Sampaio, J. The effects of an enrichment training program for youth football attackers. PLoS ONE 2018, 13, e0199008. [Google Scholar] [CrossRef] [Green Version]
  24. Savelsbergh, G.J.; Kamper, W.J.; Rabius, J.; De Koning, J.J.; Schöllhorn, W. A new method to learn to start in speed skating: A differencial learning approach. Int. J. Sports Psychol. 2010, 41, 415–427. [Google Scholar]
  25. Wagner, H.; Müller, E. The effects of differential and variable training on the quality parameters of a handball throw. Sports Biomech. 2008, 7, 54–71. [Google Scholar] [CrossRef]
  26. Schöllhorn, W.I.; Beckmann, H.; Davids, K. Exploiting system fluctuations. Differential training in physical prevention and rehabilitation programs for health and exercise. Medicina 2010, 46, 365–373. [Google Scholar] [CrossRef] [Green Version]
  27. Sinclair, J.; Taylor, P.J.; Hobbs, S.J. Digital filtering of three-dimensional lower extremity kinematics: An assessment. J. Hum. Kinet. 2013, 39, 25–36. [Google Scholar] [CrossRef] [Green Version]
  28. Bishop, C.; Read, P.; Lake, J.; Chavda, S.; Turner, A. Interlimb asymmetries: Understanding how to calculate differences from bilateral and unilateral tests. Strength Cond. J. 2018, 40, 1–6. [Google Scholar] [CrossRef] [Green Version]
  29. McCulloch, C.; Searle, S. Generalized, Linear, and Mixed Models; John Wiley and Sons: New York, NY, USA, 2000. [Google Scholar] [CrossRef]
  30. Linear Mixed-Effects Modeling in SPSS. Available online: https://www.spss.ch/upload/1126184451_Linear%20Mixed%20Effects%20Modeling%20in%20SPSS.pdf (accessed on 30 June 2020).
  31. Van Dongen, H.P.A.; Olofsen, E.; Dinges, D.F.; Maislin, G. Mixed-Model Regression Analysis and Dealing with Interindividual Differences. Method Enzymol. 2004, 384, 139–171. [Google Scholar] [CrossRef]
Figure 1. Exemplary path of the center of pressure of one participant during one trial and the sway area defined as a 95% confidence ellipse. Note: AP, anterior–posterior; ML, mediolateral.
Applsci 10 05921 g001
Figure 2. Discrepancies between development during the control and intervention phases, displayed as the model estimate (β) ± standard error and 95% confidence interval (i.e., grey bars). Note: WB, wobble board performance; Asymmetry, inter-limb asymmetry; AP, anterior–posterior; ML, mediolateral; vCoP, mean velocity of the center of pressure; * p < 0.05; *** p < 0.001.
Applsci 10 05921 g002
Table 1. Means ± standard deviations (SDs), 95% confidence intervals (CIs), F-statistics for the main effect of measurements, estimates (β), and standard error (SE) for effects between single measurements.
Control PhaseIntervention Phase
ControlPost-Control = Pre-InterventionPost-Intervention
VariableMean ± SDβMean ± SDβMean ± SDFdfp
95% CISE95% CISE95% CI
WB performance [%] †27.02±13.18(−5.20)19.60±11.3142.8759.49±16.1688.032, 14.17<0.001
18.1735.87(2.71)12.0027.193.0548.6470.35
Sway area [cm²] §8.03±3.286.3510.91±3.42−6.638.02±2.8923.412, 2.90<0.05
5.8210.231.018.6113.211.316.019.96
AP sway [mm] †7.04±1.61(1.03)9.18±1.93(−0.79)7.09±1.471.532, 3.330.34
5.968.12(0.66)7.8810.47(0.81)6.108.08
ML sway [mm] ‡6.02±1.230.986.34±0.98−1.245.82±1.128.412, 9.58<0.01
5.196.850.295.697.000.305.066.58
CoP velocity [mm∙s−1] †68.54±6.86(3.51)67.88±8.12−5.8564.08±7.884.772, 14.47<0.05
63.9373.15(2.18)62.4273.342.1158.7869.37
Asymmetry [%] ¥23.64±17.33(6.38)32.69±23.30−25.8910.15±8.269.622, 52.33<0.001
11.2436.03(6.76)16.0249.366.234.2416.07
Note: Control, Post-Control, Pre-Intervention, and Post-Intervention denote measurement timings; WB, wobble board; AP, anterior–posterior; ML, mediolateral; CoP, center of pressure; df, degrees of freedom for the numerator and denominator, separated by a comma; β is converted so that negative values indicate decreased values from the previous to the subsequent measurement; β and SE relate to two adjacent measurements and are in parentheses if the effect was not significant (p > 0.05); Covariance structure specification: †, antedependence first order; §, unstructured; ‡, factor analytic first order; ¥, heterogeneous autoregressive first order.

