1. Introduction
The acoustic nonlinearity parameter (
β) is widely used for diagnosing and inferring material damage and it can be measured using displacement amplitudes of fundamental and second-order harmonics waves [
1,
2,
3,
4,
5,
6,
7,
8,
9,
10,
11]. The exact value of an acoustic nonlinearity parameter is called the absolute acoustic nonlinearity parameter. To measure the absolute acoustic nonlinearity parameter, it is necessary to measure the extremely small displacement amplitudes of the second harmonic frequency component [
12]. However, such experimental measurement methods are complicated and practically difficult to apply in the field. Hence, the relative acoustic nonlinearity parameter available for relative comparison is frequently measured using the voltage amplitude of the device, measuring the detected ultrasonic wave. Nevertheless, measurement of the absolute acoustic nonlinearity parameter is indispensable for quantitative characterization of materials.
There are two ways to obtain the absolute acoustic nonlinearity parameter: a direct method and an indirect method. The direct method is used to measure the displacement amplitude of the ultrasonic wave directly or to use a calibration to convert the detected voltage signal amplitude into the displacement amplitude [
12]. The indirect method is used to estimate the absolute acoustic nonlinearity parameter of a test material by measuring the ratio of relative acoustic nonlinearity parameters between the test material and the reference material, where the absolute acoustic nonlinearity parameter of the reference material is known [
13]. This indirect method, introduced in the aforementioned paper, is simpler than the direct method, but requires the assumption that the voltage-displacement proportionality coefficients (VDCs) of the test and reference materials are the same. The VDC indicates the proportionality coefficient between the detected voltage signal amplitude of ultrasonic wave and the displacement amplitude of that wave, which is dependent on the material properties and the sensitivity of the receiving transducer. If the experimental conditions are kept constant for two similar materials, an indirect method can be applied to them because the VDCs of the two materials are almost the same. On the other hand, if the test and reference materials are dissimilar, an indirect method cannot be applied even if the experimental conditions are kept consistent because the VDCs of the two materials are different. In particular, the material dependency of the VDC is critical in the case of contact detection. For example, in the case of contact reception of ultrasonic waves using piezoelectric transducers, energy loss due to impedance mismatching can occur when ultrasonic energy is converted into electrical energy, so that the VDC varies if the material’s acoustic impedance is different. Therefore, to overcome the limitation of the previously proposed indirect method, a non-contact detection method using a laser interferometer has been proposed for longitudinal waves [
14]. Since the interferometer obtains an output directly proportional to the ultrasonic displacement, its proportionality is independent of the material.
Meanwhile, many studies have investigated the acoustic nonlinearity parameter of surface acoustic waves [
3,
4,
15,
16,
17,
18,
19]. In this regard, an indirect method to measure the acoustic nonlinearity parameter of surface acoustic waves has also been studied for the case of similar test and reference materials [
3]. Unfortunately, however, when a surface acoustic wave is transmitted and received using wedges as a contact technique, this method cannot be applied for dissimilar materials because of the constraints mentioned above.
This paper proposes a fully non-contact surface acoustic wave technique using lasers for the indirect measurement of the acoustic nonlinearity parameter. This technique allows the application of the indirect method even when the test and reference materials are dissimilar. Here, a pulsed Nd:YAG laser was used to generate surface acoustic waves, and a laser beam was irradiated onto the specimens through a line-arrayed slit mask to generate tone burst waves. In the contact method, the initial second harmonic frequency coming from the system, i.e., electronic devices and transducers, can pose a problem. However, in the proposed technique the initial second harmonic frequency can be easily suppressed by adjusting the duty ratio of the line-arrayed slit mask [
17]. This characteristic is an advantage that may be difficult to obtain in the case of using other non-contact excitations, for example EMAT (electromagnetic acoustic transducer) or ACT (air-coupled transducer). For surface acoustic wave reception, a laser interferometer produced an output signal directly proportional to the out-of-plane displacement of the surface waves and maintained a constant VDC regardless of the used material. Furthermore, we established a measurement principle that applies the proposed non-contact technique to the indirect measurement of the absolute acoustic nonlinearity parameter using surface acoustic waves. This study differs from previous studies on longitudinal waves [
14] in that additional compensation is required for the difference in wavenumbers in the test and reference materials.
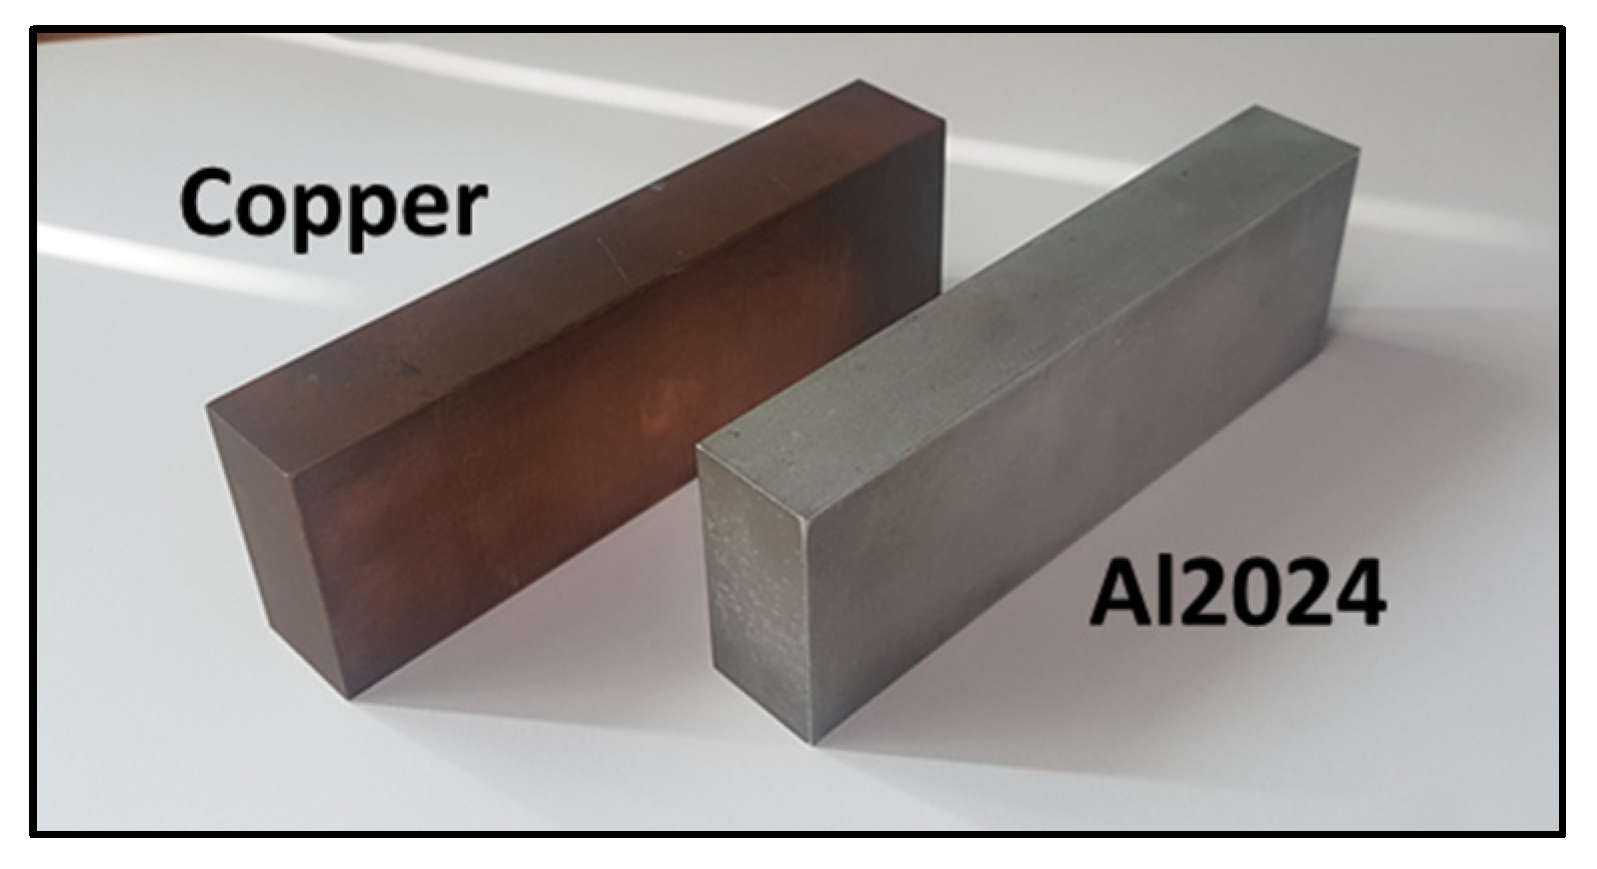
For experimental verification, aluminum and copper specimens were used as reference and test materials, respectively, and the relative acoustic nonlinearity parameters of the two materials were measured from the surface acoustic waves generated and received using lasers. The absolute acoustic nonlinearity parameter of copper was estimated from the ratio of relative acoustic nonlinearity parameters with the compensation of wavenumbers. Additionally, the absolute parameters of aluminum and copper were measured by longitudinal wave using a conventional direct measurement method, with the former being used as a reference value and the latter being used for comparison with the estimation result.
2. Principles
The acoustic nonlinearity parameter of a surface acoustic wave (
β) can be derived in terms of the out-of-plane displacement amplitude for the fundamental and second-order harmonic frequency components of the surface acoustic wave as follows [
1,
6,
18,
19],
Here,
A1 and
A2 are the out-of-plane displacement amplitudes of the fundamental and second-order harmonic components of surface acoustic waves, respectively;
x is the wave propagation distance; and
kL,
kT, and
kS are the wavenumbers of longitudinal, transverse, and surface acoustic waves, respectively. If the term consisting only of wavenumbers in Equation (1) is defined as a parameter
F as in Equation (2),
Equation (1) can then be expressed as Equation (3).
In contrast, the relative acoustic nonlinearity parameter of surface acoustic wave
β’SAW is defined by the voltage amplitudes as follows.
where
A1′ and
A2′ are the detected signal amplitudes of the fundamental and second-order harmonic components of the surface acoustic wave, respectively.
In a previous study, it has been proved that when a laser interferometer is used as a receiver, the detected signal amplitude is proportional to the displacement amplitude regardless of the difference in materials. Thus, the VDC is not dependent on the material, and the displacement amplitudes of the fundamental and second-order harmonic components can be expressed as follows [
14].
Here, the subscripts t and r refer to the test and reference materials, respectively. α1 and α2 are the VDCs of the fundamental and second-order harmonic frequencies, respectively. They are only related to the sensitivity of the laser detector, which is dependent on the frequency but not on the material.
Now, in order to apply the indirect method, we consider the relationship between the ratio of the absolute acoustic nonlinearity parameters of the two materials and the ratio of their relative acoustic nonlinearity parameters, as shown in the following equation.
The second term of Equation (6) was obtained by substituting Equation (5) into Equation (3) for the test and reference materials. This can be simplified to the third term when the propagation distance
x is fixed. The VDCs of the two materials are canceled out. The fourth term is a rearrangement of the third term using Equation (4), where
k′ is a factor representing the ratio of
F values in the two materials and is defined in Equation (7).
Finally, the absolute acoustic nonlinearity parameter of the test material can be determined from the relationship in Equation (6).
Equation (8) indicates that the absolute acoustic nonlinearity parameter of the test material can be estimated from the ratio of the relative acoustic nonlinearity parameters of the test and reference materials. The absolute acoustic nonlinearity parameter of the reference material as well as the wavenumber-dependent factor k′ (referred to as the wavenumber compensation factor in this paper) should be known in advance. If the test material and the reference material are similar, k′ is almost one and thus it can be ignored. However, if they are different, the wavenumbers in the two materials are different and they should be taken into account.
4. Experiments
4.1. Experimental Setup
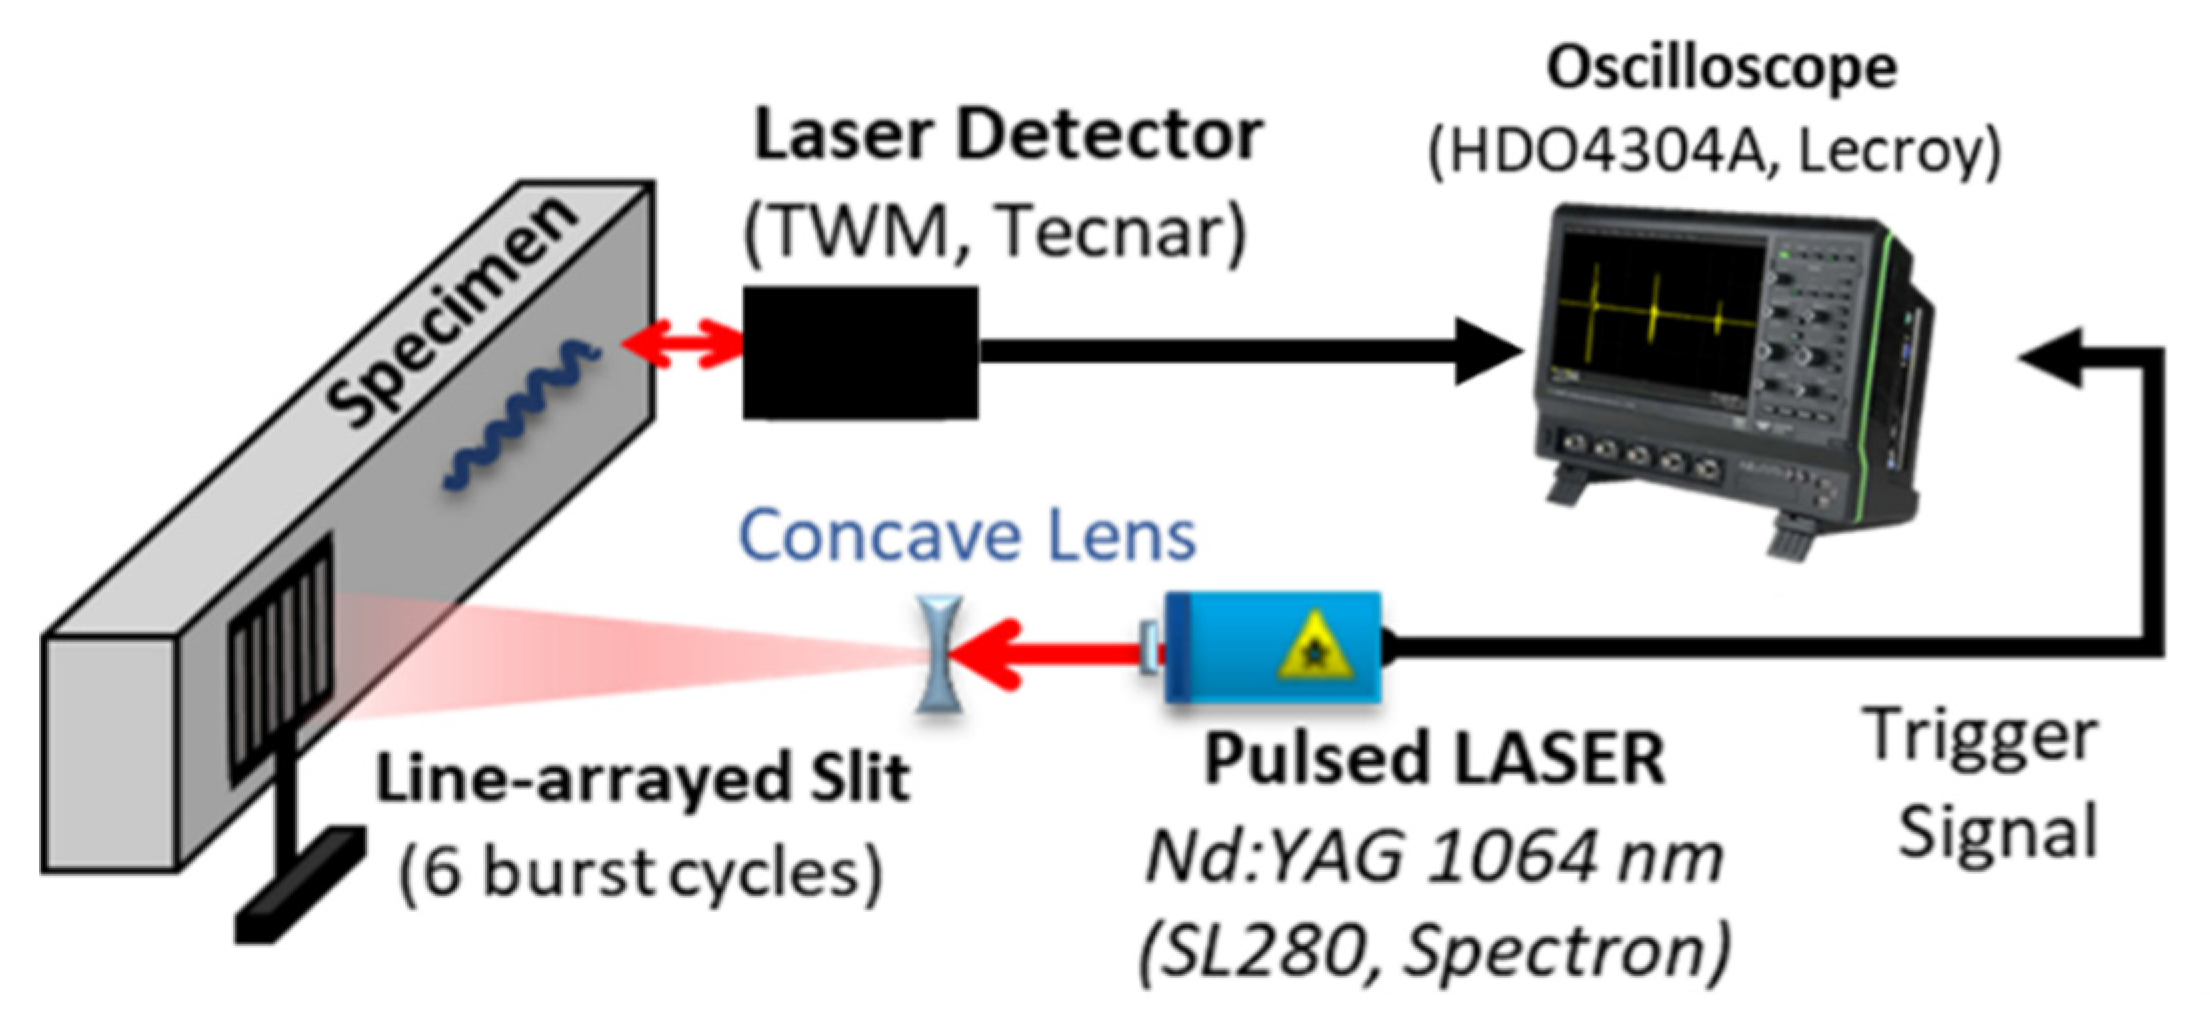
The experimental scheme for the relative acoustic nonlinearity measurements using the fully non-contact surface acoustic wave method is shown in
Figure 2. A pulsed Nd:YAG laser beam of 1064 nm (SL280, Spectron Laser Systems, Warwickshire, UK) was used to excite surface acoustic waves. The pulse duration of the pulsed laser is 10 ns, the repetition rate is 10 Hz, and the maximum energy is 300 mJ. A line-arrayed slit mask was designed to create surface acoustic waves with a wavelength of 2.92 mm, which corresponds to the fundamental frequency of 1 MHz in aluminum and 0.75 MHz in copper. The duty ratio of the slit mask was 50%, which theoretically does not generate a second harmonic component [
12].
The wave propagated on the specimens was received at the other point on the same side of the specimen by a photorefractive interferometer (TWM, Tecnar, Saint-Bruno-de-Montarville, QC, Canada). In general, when detecting the displacement of the surface wave, the diameter of the measuring laser beam should be smaller than the wavelength to avoid a decrease in signal sensitivity. The beam diameter of the interferometer used in the experiment was 0.8 mm, which is sufficiently small compared to the wavelength of the excited surface acoustic wave. The propagation distance was 65 mm. If the propagation distance is too long, the effects of attenuation and diffraction cannot be ignored. The received surface acoustic wave signal was captured by a digital oscilloscope (Lecroy HDO4034A, Teledyne LeCroy, Chestnut Ridge, NY, USA).
The Hanning window was applied to minimize the effect of the side lobe, and the fast Fourier transform was used to obtain the amplitudes of the fundamental frequency component A1′ and the second harmonic frequency component A2′. The Hanning window size is the same as the data length. Sampling frequency was 10 GHz, and the number of data points was 10,000. As a result, the frequency resolution in FFT (Fast fourier transform) spectrum is 0.001 MHz. In order to obtain the magnitudes at the fundamental and second harmonic frequencies, we searched for peaks within the ±0.1 MHz range at each frequency. The frequency of the peak detected in the experimental results was within the range of ±0.02 MHz from the predicted frequency. The measurements were repeated by increasing the laser energy from 95 to 145 mJ in seven steps. The relative nonlinearity parameter β′SAW was determined from the linearity slope of between A1′2 and A2′.
4.2. Measurement of Relative Nonlinearity Parameter
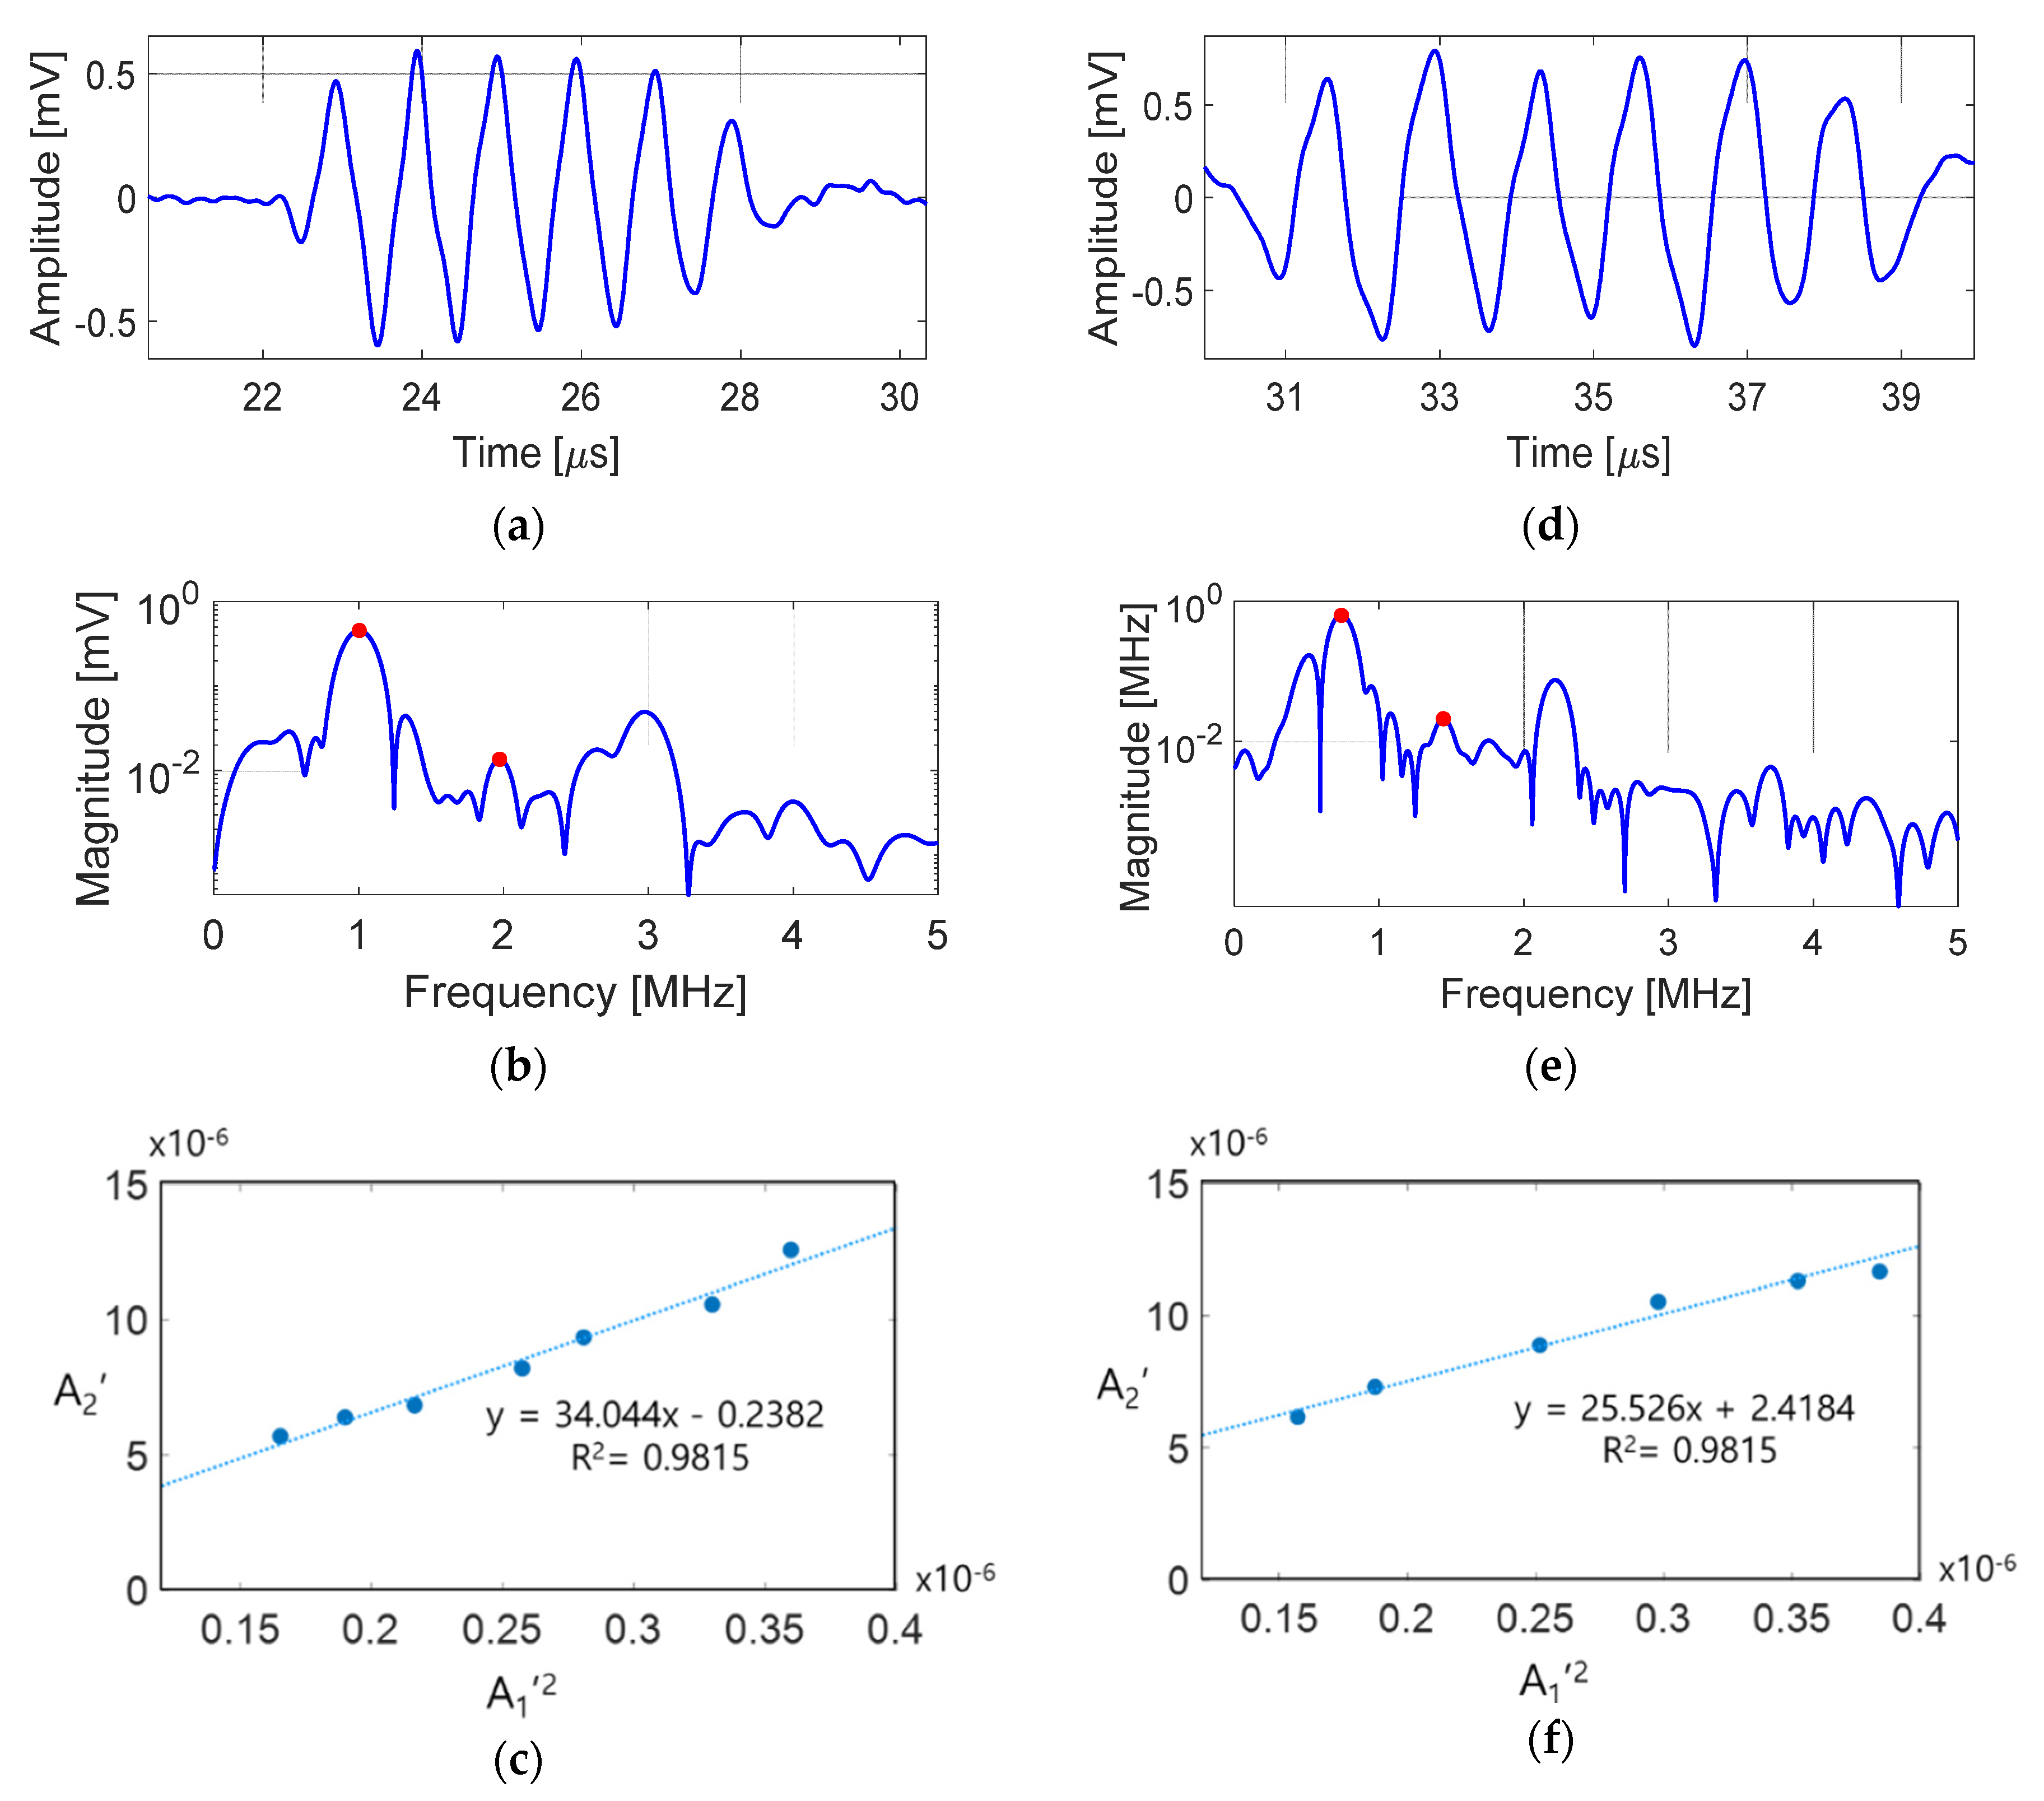
The received surface acoustic wave signals, their frequency spectra, and the linear fitting plots of
A1′
2 and
A2′ are shown in
Figure 3 for aluminum and copper specimens.
Figure 3a–c shows the results of the aluminum specimen and
Figure 3d–f shows the results of the copper specimen. The surface acoustic wave signals shown in
Figure 3a–d were obtained at the highest laser intensity, and
Figure 3b–e shows their frequency spectra. The magnitudes of the fundamental and second-order harmonic frequency components are indicated by red dots. The fundamental frequency in aluminum was detected at 1.0 MHz and the second harmonic frequency was detected at 2.0 MHz, as intended. In copper, the fundamental frequency and second harmonic frequency components were detected at 0.74 MHz and 1.47 MHz, as expected.
Note that a relatively large third harmonic is generated, because the surface acoustic wave close to the square wave form is generated by the line-arrayed slit mask. In this case, even-order harmonics are suppressed; however, the occurrence of odd-order harmonics is unavoidable [
20]. When the third harmonic frequency is put in together with the fundamental frequency, the magnitude of the second harmonic frequency may change owing to the mixing effect. Nevertheless, as the magnitude of odd-order harmonics depends on the fundamental frequency, only the constant ‘8’ in Equation (1) will vary. However, because this constant will be canceled in the calculation of the relative ratio in Equation (6), Equation (8) is valid as it is and does not affect the proposed measurement technique based on the relative ratio.
The linear relationship between
A2′ and
A1′
2 is shown in
Figure 3c,f. In both specimens, the R-squared values are approximately 0.98, which confirms the linearity between
A2′ and
A1′
2. The measurements were repeated four times at each laser power, the deviation was so small that it cannot be seen in the figure.
Table 1 shows the relative nonlinearity parameter measurement results of each specimen and their ratio.
4.3. Measurement of Wavenumber Compensation Factor k′
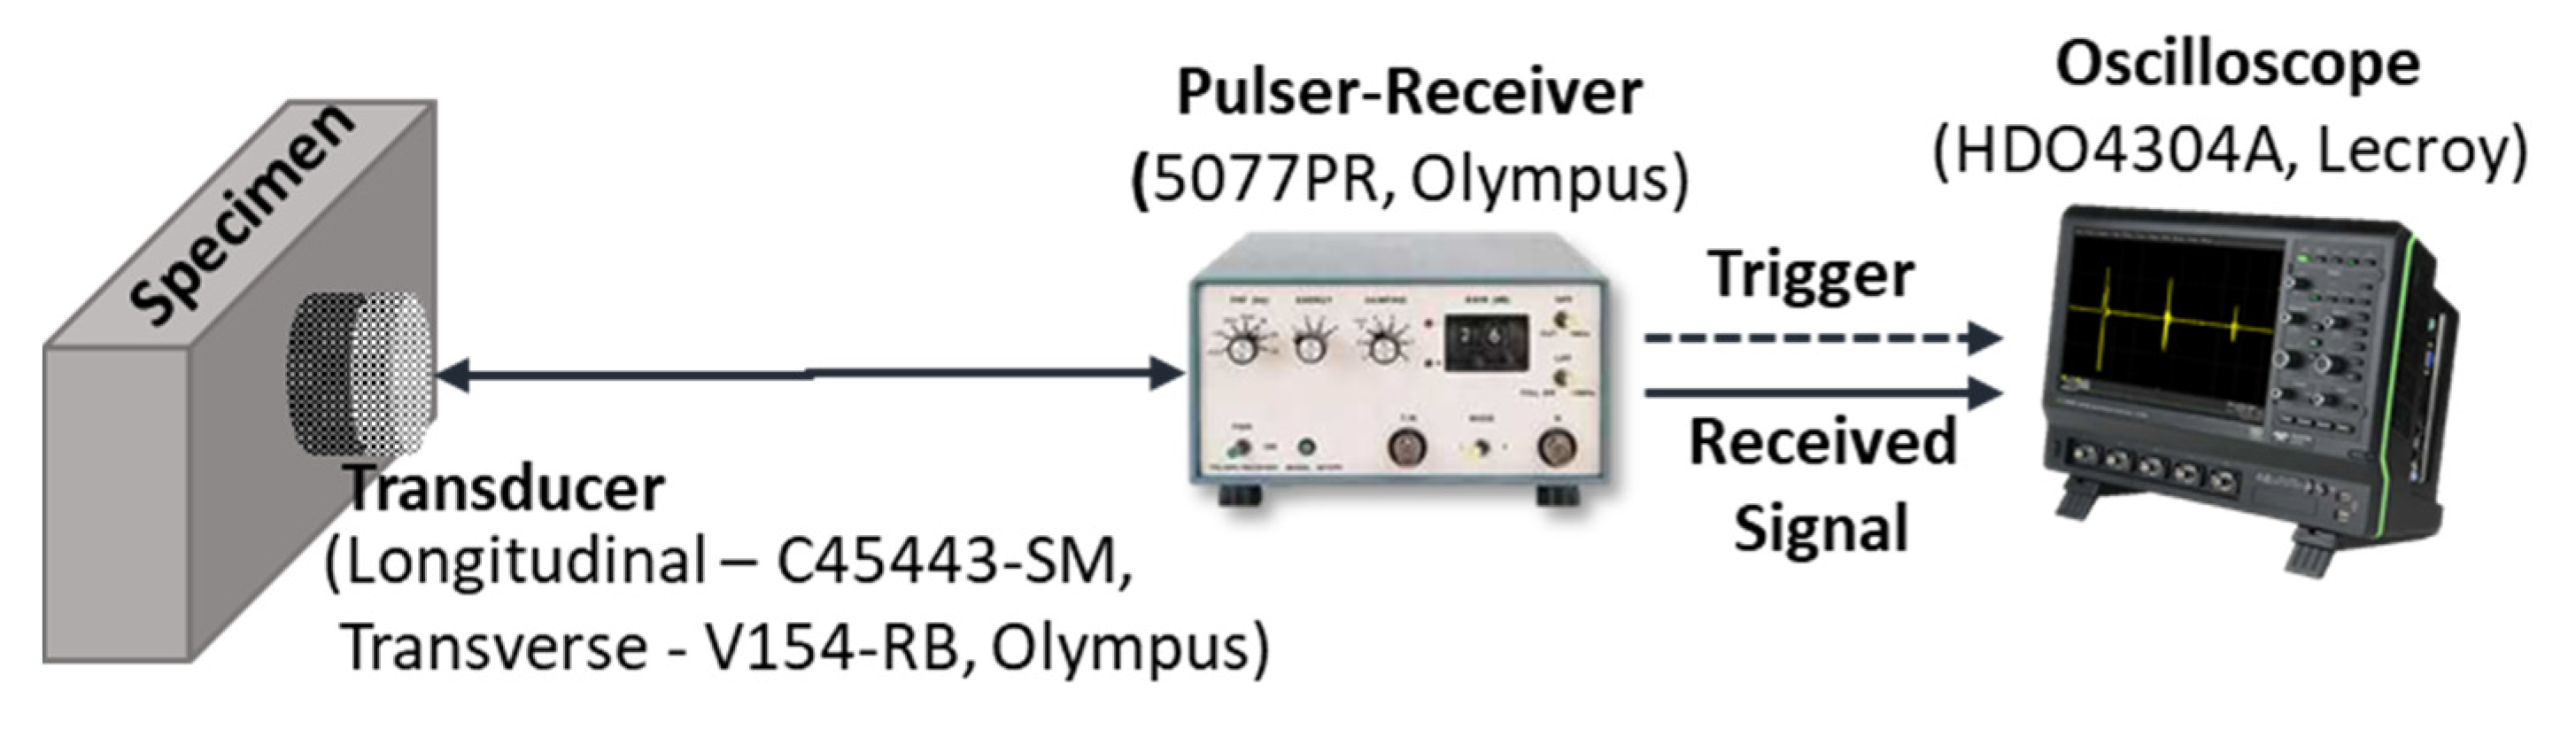
The ultrasonic velocity was measured for each specimen to determine the wavenumber of the longitudinal, transverse, and surface acoustic waves required to calculate the wavenumber compensation factor. The velocities of the longitudinal and transverse waves were obtained by measuring the time-of-flight (TOF) between the back-wall echo signals.
Pulser-receiver (Olympus 5077PR, Tokyo, Japan) and PZT transducers with main-resonance frequencies of 5.0 MHz for longitudinal waves and 2.25 MHz for transverse waves were used in the experiment.
Figure 4 shows the experimental setup for wave velocity measurement. The TOF between the echo signals was measured using the auto-correlation of the received signal [
21]. By using the measured TOF and thickness of the specimen, the velocities of the longitudinal and transverse waves were calculated for each specimen.
The surface wave velocity was measured using the same apparatus shown in
Figure 2. Velocity of the surface acoustic wave is measured by non-contact method using a laser. The velocity was obtained by multiplying the fundamental frequency of the received signal by the wavelength given in the line array interval [
17].
The measured longitudinal, transverse, and surface acoustic wave velocities are shown in
Table 2. The
F values of each material were calculated using Equation (2), and the wavenumber compensation factor
k′ was obtained using Equation (7).
4.4. Estimation of Absolute Nonlinearity Parameter
In order to verify the validity of the proposed method, the absolute nonlinearity parameters of the two materials were measured first using the conventional calibration method [
12], which uses a pre-measured calibration function converting the electrical output of the receiving transducer into the displacement amplitude. The results are shown in
Table 3. The absolute parameter of aluminum was used as a reference value and the absolute parameter of copper was used for comparison with the result estimated by the proposed technique.
Next, the absolute nonlinearity parameter of copper was estimated by substituting the measured wavenumber compensation factor
k′ and the relative nonlinearity parameters of Al2024 and copper in Equation (8), in which the absolute nonlinearity parameter of Al2024 shown in
Table 3 was used as the reference. The result is shown in
Table 4. The absolute nonlinearity parameter measured using the direct method is shown for comparison. Considering the deviation, the estimated value agrees well with the direct measurement result.
The results verify that the proposed indirect method using surface acoustic waves with a fully non-contact laser-ultrasonic technique is effective for estimating acoustic nonlinearity parameters.


