Featured Application
The presented application can measure the anterior–posterior knee instability during laxity assessment.
Abstract
There are widely used standard clinical tests to estimate the instability of an anterior cruciate ligament (ACL) deficient knee by assessing the translation of the tibia with respect to the femur. However, the assessment of those tests could be quite subjective. The goal of this study is to present a universally affordable open-source Android application that is easy and quick. Moreover, it provides the possibility for a quantitative and objective analysis of that instability. The anterior–posterior knee translation of seven subjects was assessed using the open-source Android application developed. A single Android smartphone and the placement of three green skin adhesives are all that is required to use it. The application was developed using the image-processing features of the open-source OpenCV Library. An open-source Android application was developed to measure anterior–posterior (AP) translation in ACL-deficient subjects. The application identified differences in the AP translation between the ipsilateral and the contralateral legs of seven ACL-deficient subjects during Lachman and Pivot–Shift tests. Three out of seven subjects were under anesthesia. Those three were also the ones with significant differences. The application detected differences in the AP translation between the ipsilateral and contralateral legs of subjects with ACL deficiency. The use of the application represents an easy, low-cost, reliable and quick way to assess knee instability quantitatively.
1. Introduction
Injuries of the anterior cruciate ligament (ACL) of the knee lead to negative consequences for joint stability during sport and daily life [1]. There are studies which report that, in both the USA and Europe, around 30 people out of 100,000 inhabitants suffer this injury [2,3]. The standard clinical evaluation of an ACL deficient knee comprises specific tests such as the Pivot–Shift or Lachman tests [4]. Unfortunately, they express instability only with a qualitative evaluation that is influenced by the technique employed by the surgeon and their expertise in grading the degree of instability [5]. A precise quantitative evaluation of knee instability after an ACL rupture would be important in terms of both surgical planning and the postoperative rehabilitation program.
Given that the Lachman test simply consists of anterior tibial plateau translation in the knee close to extension, the measure in millimeters of that translation provides a precise quantitative evaluation of that test. During the Pivot–Shift test, anterior subluxation of the lateral tibial plateau is firstly observed. Then, a spontaneous reduction occurs. Quantitative evaluation of the Pivot Shift test then could be achieved by measuring either anterior tibial translation or tibial reduction acceleration. The systems available for quantitative evaluation of the instability during the tests are not universally accessible. Additionally, most are expensive and present some disadvantages. Commercial accelerometers (such as KiRA [6]) can be used to quantify the instability during the Pivot–Shift or Lachman tests. However, it measures the absolute acceleration of the tibia with respect to the ground. It requires certain conditions to do the measurement. What is more, it may not be easy to interpret during the Pivot–Shift test evaluation. Worth considering is the fact that measurement with arthrometers such as KT-1000 (one of the most popular) might present an inadequate degree of reliability (both intra- and inter-examiner) as shown by several studies in the literature [7]. Fluoroscopy measurements would be the most reliable and accurate even though they are quite invasive and expensive [8].
Image processing has become a low-cost and non-invasive method to measure the anterior–posterior (AP) translation of the knee during Lachman and Pivot–Shift tests. Nowadays, digital cameras used in smartphones and tablet PCs can capture high quality videos. In addition, the algorithms and libraries for image analysis, such as the open-source OpenCV Library [9], are available for everyone in different programming languages. Hoshino et al. [10] demonstrated the possibility of the non-invasive evaluation of lateral translation during the Pivot–Shift test and Lachman test, respectively. The same authors developed an iPad application to capture and process data during the Pivot–Shift test [11]. However, as far as the authors know, no application is freely available, and neither is one available for Android.
This article describes an Android application that can calculate AP translation during the Lachman and Pivot–Shift tests using the video capture of the tests. The application uses the open-source OpenCV library and can be installed on any Android device such as a smartphone or tablet PC. The results are presented for seven subjects. They show the differences between ipsilateral and contralateral legs. Since this method is non-invasive and does not require expensive instruments, it can be easily included in the testing routine in both clinics and operating rooms.
It is important to extend the use of an objective, quantitative and open-source measurement method for knee instability to give everyone the opportunity to express their data with a single measurement parameter to make for effective global data comparisons.
2. Materials and Methods
2.1. Experimental Data
Lachman and Pivot–Shift tests were performed on both legs of seven subjects (six women, age: 33 ± 9.1 years old; one man, age: 40 years old) with one ACL-deficient knee while they were being recorded by a regular smartphone camera (see Videos included as Supplementary Material). The measurements of three subjects were performed under anesthesia. This study was approved by the ethical committee of ICATME (Catalan Institute of Traumatology and Sports Medicine) with protocol number LCA-2017-01, and the subjects gave informed consent.
Three round green stickers with a diameter of 13 mm were attached to specific points on the subjects’ knees. They were the Gerdy’s tubercle, the center of the fibula head, and the lateral epicondyle, as in [10,11]. The distance between Gerdy’s tubercle and the fibula head (Figure 1a) was measured experimentally. The tests were always performed by the same experienced knee surgeon. The high-quality videos (resolution 1080p) were captured using the digital camera of a smartphone. After storing the videos in the gallery, the postprocessing was performed in the Android application.
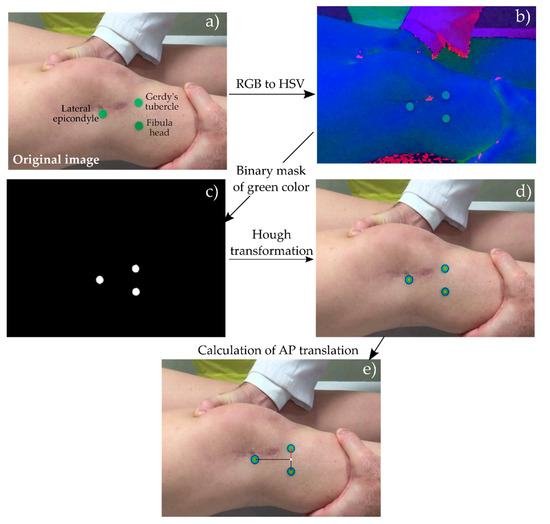
Figure 1.
Steps taken by the application to obtain the anterior–posterior (AP) translation from the image of one video frame. (a) to (b) conversion from RGB (red, green and blue) to HSV (hue, saturation and value) image. (c) Reduction to a binary image to identify green points. (d) Hough transformation to obtain green circles. (e) Identification of all three markers and calculation of AP translation.
2.2. Image Processing
The Android application was developed in Android Studio 3.1.3 (Google, Mountain View, CA, USA, 2018). The main algorithm included in the application to measure AP knee translation consists of five steps. First (Figure 1a), it loads the video requested by the user from the gallery storage of the smartphone. Second, it splits the video into single frames. Third, using the open-source OpenCV library [9] (already used in other biomedical applications [12,13,14]), the algorithm converts the RGB (red, green and blue) image to an HSV (hue, saturation and value) image (Figure 1b) to improve the color detection [15], and then identifies the green objects and creates the binary image of the current frame (Figure 1c). Fourth, the Gaussian filter is applied to the binary image and the detection of the circle edges is performed by applying the Hough Transformation [16] (Figure 1d). Fifth, the algorithm maps each point with the corresponding landmark once the three points are captured. Subsequently, the calculation of AP translation is calculated from the detected XY coordinates of the three points (Figure 1e). The third to fifth steps are performed for each frame.
2.3. Calculation of the AP Translation
AP translation is defined as the distance between the pivot point and Gerdy’s tubercle (Figure 1a,e), as in [10,11]. The pivot point is defined as the intersection of the axis between Gerdy’s tubercle and the fibula head points and the perpendicular of this axis, which crosses the lateral epicondyle point. To determine the AP translation, the experimental distance between the Gerdy’s tubercle point and the fibula head should be provided by the user (Figure 1a). The location of the pivot point is determined for each frame. Then, the AP translation values are calculated for each frame. At the end of the processing, the AP translation values are plotted on the screen (Figure 2).
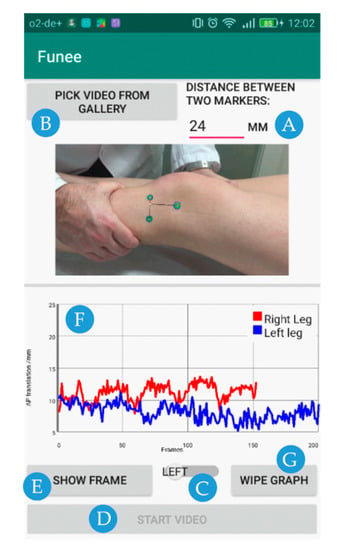
Figure 2.
Main screen of the Android application. (A): Introduction of the distance between tibia’s markers. (B): Selection of the video. (C): Choice of left or right leg. (D): Starting of the video processing. (E): Visualization of the image frame. (F): Box showing the plot of AP translation. (G): Image refreshing.
2.4. User Interface
The user interface, called “Funee” (from “Functional Knee”), consists of a main window where the user first introduces the experimental distance between the markers at the tibia (Gerdy’s tubercle and the fibula head). Then, the user picks the video from the gallery stored in the smartphone and chooses the left or right leg. Video processing can be started and visualized on the screen. At the same time, a curve with the AP translation is shown in the plot (Figure 2). After that, the user can store the results in a txt file.
2.5. Analysis
Mean and standard deviations of the range (the difference between the max and min values) of AP translation during the Lachman and Pivot–Shift tests over five trials were calculated for both legs of the seven subjects. Additionally, we report the results for one subject before and after ACL reconstruction surgery (without anesthesia) for the injured leg. Significant differences were considered if the p-value < 0.05 of paired t-tests when comparing AP translations between the ipsilateral and contralateral legs of ACL-deficient subjects or AP translations before and after the surgery. Additional tests were performed to evaluate the influence of the camera position and orientation on the AP translation calculation, and to evaluate the effect of the marker position deviation on the range of AP translation calculation.
3. Results
The results show differences in the AP translation measured by the application between injured and non-injured legs. The range of AP translation was higher in the injured leg than in the contralateral leg for all seven subjects (S1 to S7). Interestingly, it was significantly higher for five subjects during the Lachman tests (p < 0.001 for S2 and S3, p = 0.005 for S5, p = 0.004 for S6 and p = 0.001 for S7), and for three subjects during the Pivot–Shift tests (p = 0.036 for S5, p = 0.045 for S6 and p = 0.02 for S7) (Figure 3). The three subjects who had significant differences consistently in both tests (S5, S6 and S7) were under anesthesia.
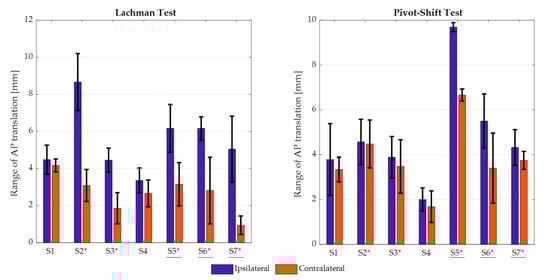
Figure 3.
Range of anterior–posterior translation values (mean ± standard deviation) in the ipsilateral (injured) and contralateral (non-injured) legs of seven anterior cruciate ligament (ACL)-deficient subjects during Lachman and Pivot–Shift tests. Note that the vertical axes do not have the same range of values. The underlined subjects were under anesthesia. The star * indicates significant differences (p < 0.05).
Additionally, we measured the AP translation in one subject (gender: woman, age: 28 years old) pre and post-surgery for an ACL reconstruction while she was awake. The results show that there were significant differences in the range of AP translation of the injured knee before and after the surgery (Figure 4).
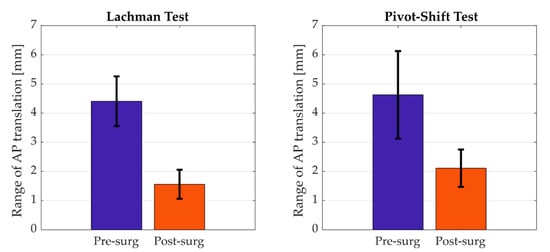
Figure 4.
Range of anterior–posterior translation values (mean ± standard deviation) in the ipsilateral (injured) leg of one ACL-deficient subject before (Pre-surg) and after (Post-surg) the surgery during Lachman and Pivot–Shift tests. The differences were significant (p < 0.05) in both tests.
The processing of one video of about 10 s takes about 5 s. The results were obtained in a regular smartphone emulator (Nexus X5 Android 9.0, API 28).
We also analyzed how the camera position and orientation influence the calculation of AP translation. Figure 4 shows the dependence of the absolute AP translation (calculated as explained in Section 2.3) on the orientation of the camera with respect to the sagittal plane (with orientations from −60° to 60°, Figure 5a) and on the distance between the camera plane and the sagittal plane (with distances from 20 cm to 100 cm, Figure 5b). In those cases, a subject remained in a static position and two videos were recorded changing the orientation or the distance of the camera plane with respect to the sagittal plane. Orientations of the camera plane far from being parallel to the sagittal plane led to high AP translation deviations. The distance between the plane of the camera and the sagittal plane did not highly affect the calculation of the AP translation. Between 20 cm and 80 cm, the difference in AP translation was only 2.2 mm.
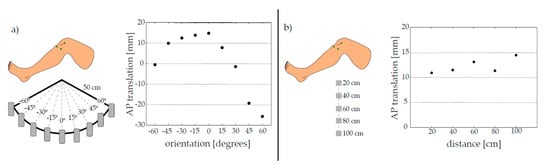
Figure 5.
(a) AP translation as a function of the orientation angle of the camera with respect to the sagittal plane. (b) AP translation as a function of the distance of the camera plane.
The influence of marker positions on the range of AP translation was also tested. An AP translation of 12 mm was imposed in the model configuration as shown in Figure 6a. The same translation of the tibia with respect to the femur was applied but considering 105 cases where markers were deviated following a normal distribution with a mean of 0 mm and a standard deviation of 10 mm (consistent with the inter-subject precision of manual palpation of main knee bony landmarks reported by Della Croce et al. [17]). Figure 6b shows a graphical representation of the calculation of AP translations from the deviated markers (yellow ticks). The results indicated that the mean and standard deviation of the range of AP translation in those cases were 11.1 mm and 1.4 mm, respectively.
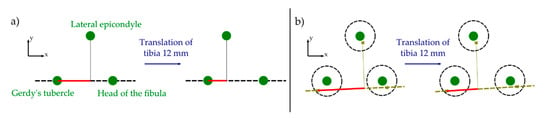
Figure 6.
Graphical representation of the calculation of AP translation ranges (as mentioned in Section 2.3). (a) Calculation of AP translations without deviations (from green dots). (b) Calculation of AP translations with deviations (from yellow ticks).
4. Discussion
This study aimed to present a new Android application able to measure knee instability by assessing AP tibial translation and show that differences can be observed between the injured and non-injured subject knees before surgery. It was also able to detect the difference in an injured knee between pre and post-surgery. This application is based on the open-source OpenCV library used to process images. Three out of the seven subjects were under anesthesia. For those, the results were significantly different between legs for both the Lachman and Pivot–shift tests, which is in agreement with the conclusion of other studies [18].
The method presented here represents an easy, affordable and fast way of assessing the instability in ACL-deficient knees in a quantitative way. It can be used in both clinics and operating rooms, and it does not require bringing bulky devices such as the KT-1000, usually used to assess Lachman tests, into the operating room. Only three adhesive stickers and a smartphone are required to use this method, not like other methods which require sophisticated and expensive devices [19]. The user obtains the AP translation directly, and it is easy to interpret and relate to instability of the knee. This is an advantage compared to measurement with inertial systems [20,21], which usually reports absolute acceleration with respect to the ground.
Despite these benefits, the results obtained with this application should be compared with the ones obtained with biplanar fluoroscopy, the current most reliable method, since it directly measures the instability between bones [22,23]. Only in this way might the reliability of the application in assessing quantitatively the knee instability be validated. Another limitation of the present work is that the given translation information is the projection on the camera plane. Therefore, the information provided by the application is not the actual value of the knee AP translation when performing Pivot–Shift tests, since the tibia and femur are not completely parallel to the camera. However, Hoshino et al. [11] found that significant differences can also be observed for these tests. In our study, the number of analyzed ACL-deficient subjects was not high enough to arrive at strong statistical conclusions. However, the purpose here is to present the application. A clinical study with a larger sample size will be the scope of future works. The main difference with the work of Hoshino et al. [10] is that during the marker tracking process, the image is converted to the HSV scale, which can facilitate the recognition of the markers [24].
The user should capture the videos with a proper orientation and position of the camera. Although no large differences in AP translation between −15° and +15° (Figure 5a) were observed and the data to evaluate are the range of AP translations during Lachman and Pivot–Shift tests instead of AP absolute translations, one should be careful of this issue when recording the video. The user should keep the plane of the camera as parallel as possible to the plane of the stickers during the Lachman tests and at the beginning of Pivot–Shift tests. The distance between the camera plane and the sagittal plane does not highly affect the AP translation (Figure 5b). Between 20 cm to 80 cm, we observed a difference in absolute AP translation of 2.2 mm. However, it is best for the videos to be captured as close as possible to the sagittal plane but within a distance that the whole movement can be seen by the camera lens. We also suggest keeping the same position of the camera during the sessions of the tests. The rounded green points in the background should be avoided to facilitate image processing and prevent confusion, and an invariant and regular level of illumination is recommended [25]. We also analyzed the influence of the marker position on the range of AP translation. We observed that with marker deviations of 10 mm from a model configuration, the mean of range AP translation differences were lower than 1 mm.
The fact that the application can be run in a standard Android smartphone with a short processing time makes the use of this application suitable for assessing the Lachman and Pivot–Shift tests with no extra training for any surgeon. The application as well as its code are available free-of-charge (at https://github.com/gilserrancoli/funee_app).
5. Conclusions
An open-source Android application was developed to measure knee instability in ACL-deficient subjects. Differences in the measurements were observed between injured and non-injured knees as well as in a pre and post-operative injured knee. The use of the application represents an easy, low-cost and quick way to assess knee instability for subjects with an injured knee.
Supplementary Materials
Example videos used to run the application are available online at https://www.mdpi.com/2076-3417/10/17/5896/s1.
Author Contributions
Conceptualization, G.S., S.P., J.C.M.; methodology, G.S.; software, P.B., G.S., G.T.P.; validation, S.P., G.S.; data curation, G.S., J.T.; writing—original draft preparation, G.S.; writing—review and editing, S.P., J.T. and G.S.; supervision, J.C.M. All authors have read and agreed to the published version of the manuscript.
Funding
This research received no external funding.
Acknowledgments
G. Serrancolí acknowledges the support from the Serra Húnter Program.
Conflicts of Interest
The authors declare no conflict of interest.
References
- Arastu, M.H.; Grange, S.; Twyman, R. Prevalence and consequences of delayed diagnosis of anterior cruciate ligament ruptures. Knee Surg. Sport. Traumatol. Arthrosc. 2015, 23, 1201–1205. [Google Scholar] [CrossRef] [PubMed]
- Gianotti, S.M.; Marshall, S.W.; Hume, P.A.; Bunt, L. Incidence of anterior cruciate ligament injury and other knee ligament injuries: A national population-based study. J. Sci. Med. Sport 2009, 12, 622–627. [Google Scholar] [CrossRef] [PubMed]
- Moses, B.; Orchard, J.; Orchard, J. Systematic review: Annual incidence of ACL injury and surgery in various populations. Res. Sport. Med. 2012, 20, 157–179. [Google Scholar] [CrossRef] [PubMed]
- Markolf, K.L.; Jackson, S.R.; McAllister, D.R. Relationship between the pivot shift and Lachman tests a cadaver study. J. Bone Jt. Surg. Ser. A 2010, 92, 2067–2075. [Google Scholar] [CrossRef] [PubMed]
- Kuroda, R.; Hoshino, Y.; Kubo, S.; Araki, D.; Oka, S.; Nagamune, K.; Kurosaka, M. Similarities and differences of diagnostic manual tests for anterior cruciate ligament insufficiency: A global survey and kinematics assessment. Am. J. Sports Med. 2012, 40, 91–99. [Google Scholar] [CrossRef]
- Berruto, M.; Uboldi, F.; Gala, L.; Marelli, B.; Albisetti, W. Is triaxial accelerometer reliable in the evaluation and grading of knee pivot-shift phenomenon? Knee Surg. Sport. Traumatol. Arthrosc. 2013, 21, 981–985. [Google Scholar] [CrossRef]
- Wiertsema, S.H.; van Hooff, H.J.A.; Migchelsen, L.A.A.; Steultjens, M.P.M. Reliability of the KT1000 arthrometer and the Lachman test in patients with an ACL rupture. Knee 2008, 15, 107–110. [Google Scholar] [CrossRef]
- Tashman, S.; Araki, D. Effects of ACL Reconstruction on In-Vivo, Dynamic Knee Function. Clin. Sport. Med. 2013, 32, 47–59. [Google Scholar] [CrossRef]
- Pulli, K.; Baksheev, A.; Kornyakov, K.; Eruhimov, V. Realtime computer vision with OpenCV. Queue 2012, 10, 1–17. [Google Scholar] [CrossRef]
- Hoshino, Y.; Araujo, P.; Irrgang, J.J.; Fu, F.H.; Musahl, V. An image analysis method to quantify the lateral pivot shift test. Knee Surg. Sport. Traumatol. Arthrosc. 2012, 20, 703–707. [Google Scholar] [CrossRef]
- Hoshino, Y.; Araujo, P.; Ahldén, M.; Samuelsson, K.; Muller, B.; Hofbauer, M.; Wolf, M.R.; Irrgang, J.J.; Fu, F.H.; Musahl, V. Quantitative evaluation of the pivot shift by image analysis using the iPad. Knee Surgery, Sport. Traumatol. Arthrosc. 2013, 21, 975–980. [Google Scholar] [CrossRef] [PubMed]
- van Duren, B.H.; Sugand, K.; Wescott, R.; Carrington, R.; Hart, A. Augmented reality fluoroscopy simulation of the guide-wire insertion in DHS surgery: A proof of concept study. Med. Eng. Phys. 2018, 55, 52–59. [Google Scholar] [CrossRef] [PubMed]
- Berber, T.; Alpkocak, A.; Balci, P.; Dicle, O. Breast mass contour segmentation algorithm in digital mammograms. Comput. Methods Programs Biomed. 2013, 110, 150–159. [Google Scholar] [CrossRef] [PubMed]
- Elloumi, Y.; Akil, M.; Kehtarnavaz, N. A mobile computer aided system for optic nerve head detection. Comput. Methods Programs Biomed. 2018, 162, 139–148. [Google Scholar] [CrossRef] [PubMed]
- Sedláček, M. Evaluation of RGB and HSV models in Human Faces Detection. In Proceedings of the Conference of Computer Systems and Image Processing, Budmerice, Slovak, 17 June 2004. [Google Scholar]
- Liu, Y.; Zhang, J.; Tian, J. An image localization system based on gradient Hough transform. In Proceedings of the MIPPR 2015: Remote Sensing Image Processing, Geographic Information Systems, and Other Applications; SPIE Press: Bellingham, DC, USA, 2015; Volume 9815, p. 98151F. [Google Scholar] [CrossRef]
- Della Croce, U.; Cappozzo, A.; Kerrigan, D.C. Pelvis and lower limb anatomical landmark calibration precision and its propagation to bone geometry and joint angles. Med. Biol. Eng. Comput. 1999, 37, 155–161. [Google Scholar] [CrossRef] [PubMed]
- Matsushita, T.; Oka, S.; Nagamune, K.; Matsumoto, T.; Nishizawa, Y.; Hoshino, Y.; Kubo, S.; Kurosaka, M.; Kuroda, R. Differences in knee kinematics between awake and anesthetized patients during the Lachman and pivot-shift Tests for anterior cruciate ligament deficiency. Orthop. J. Sport. Med. 2013, 1, 1–6. [Google Scholar] [CrossRef]
- Sundemo, D.; Alentorn-geli, E.; Hoshino, Y.; Musahl, V.; Karlsson, J.; Samuelsson, K. Objective measures on knee instability: Dynamic tests: A review of devices for assessment of dynamic knee laxity through utilization of the pivot shift test. Curr. Rev. Musculoskelet. Med. 2016, 9, 148–159. [Google Scholar] [CrossRef]
- Kopf, S.; Kauert, R.; Halfpaap, J.; Jung, T.; Becker, R. A new quantitative method for pivot shift grading. Knee Surg. Sport. Traumatol. Arthrosc. 2012, 20, 718–723. [Google Scholar] [CrossRef]
- Lopomo, N.; Signorelli, C.; Bonanzinga, T.; Muccioli, G.M.M.; Visani, A.; Zaffagnini, S. Quantitative assessment of pivot-shift using inertial sensors. Knee Surg. Sport. Traumatol. Arthrosc. 2012, 20, 713–717. [Google Scholar] [CrossRef]
- Freedman, V.A.; Spillman, B.C. Validation of a Method for Combining Biplanar Radiography and Magnetic Resonance Imaging to Estimate Knee Cartilage Contact. Med. Eng. Phys. 2015, 37, 937–947. [Google Scholar] [CrossRef]
- Moewis, P.; Boeth, H.; Heller, M.O.; Yntema, C.; Jung, T.; Doyscher, R.; Ehrig, R.M.; Zhong, Y.; Taylor, W.R. Towards understanding knee joint laxity: Errors in non-invasive assessment of joint rotation can be corrected. Med. Eng. Phys. 2014, 36, 889–895. [Google Scholar] [CrossRef] [PubMed]
- Fitriyah, H.; Wihandika, R.C. An Analysis of RGB, Hue and Grayscale under Various Illuminations. In Proceedings of the 2018 International Conference on Sustainable Information Engineering and Technology (SIET), Malang, Indonesia, 10–12 November 2018; pp. 38–41. [Google Scholar] [CrossRef]
- Yilmaz, A.; Javed, O.; Shah, M. Object tracking: A survey. ACM Comput. Surv. 2006, 38. [Google Scholar] [CrossRef]


© 2020 by the authors. Licensee MDPI, Basel, Switzerland. This article is an open access article distributed under the terms and conditions of the Creative Commons Attribution (CC BY) license (http://creativecommons.org/licenses/by/4.0/).