Analysis of Modal Parameters Using a Statistical Approach for Condition Monitoring of the Wind Turbine Blade


Abstract
1. Introduction
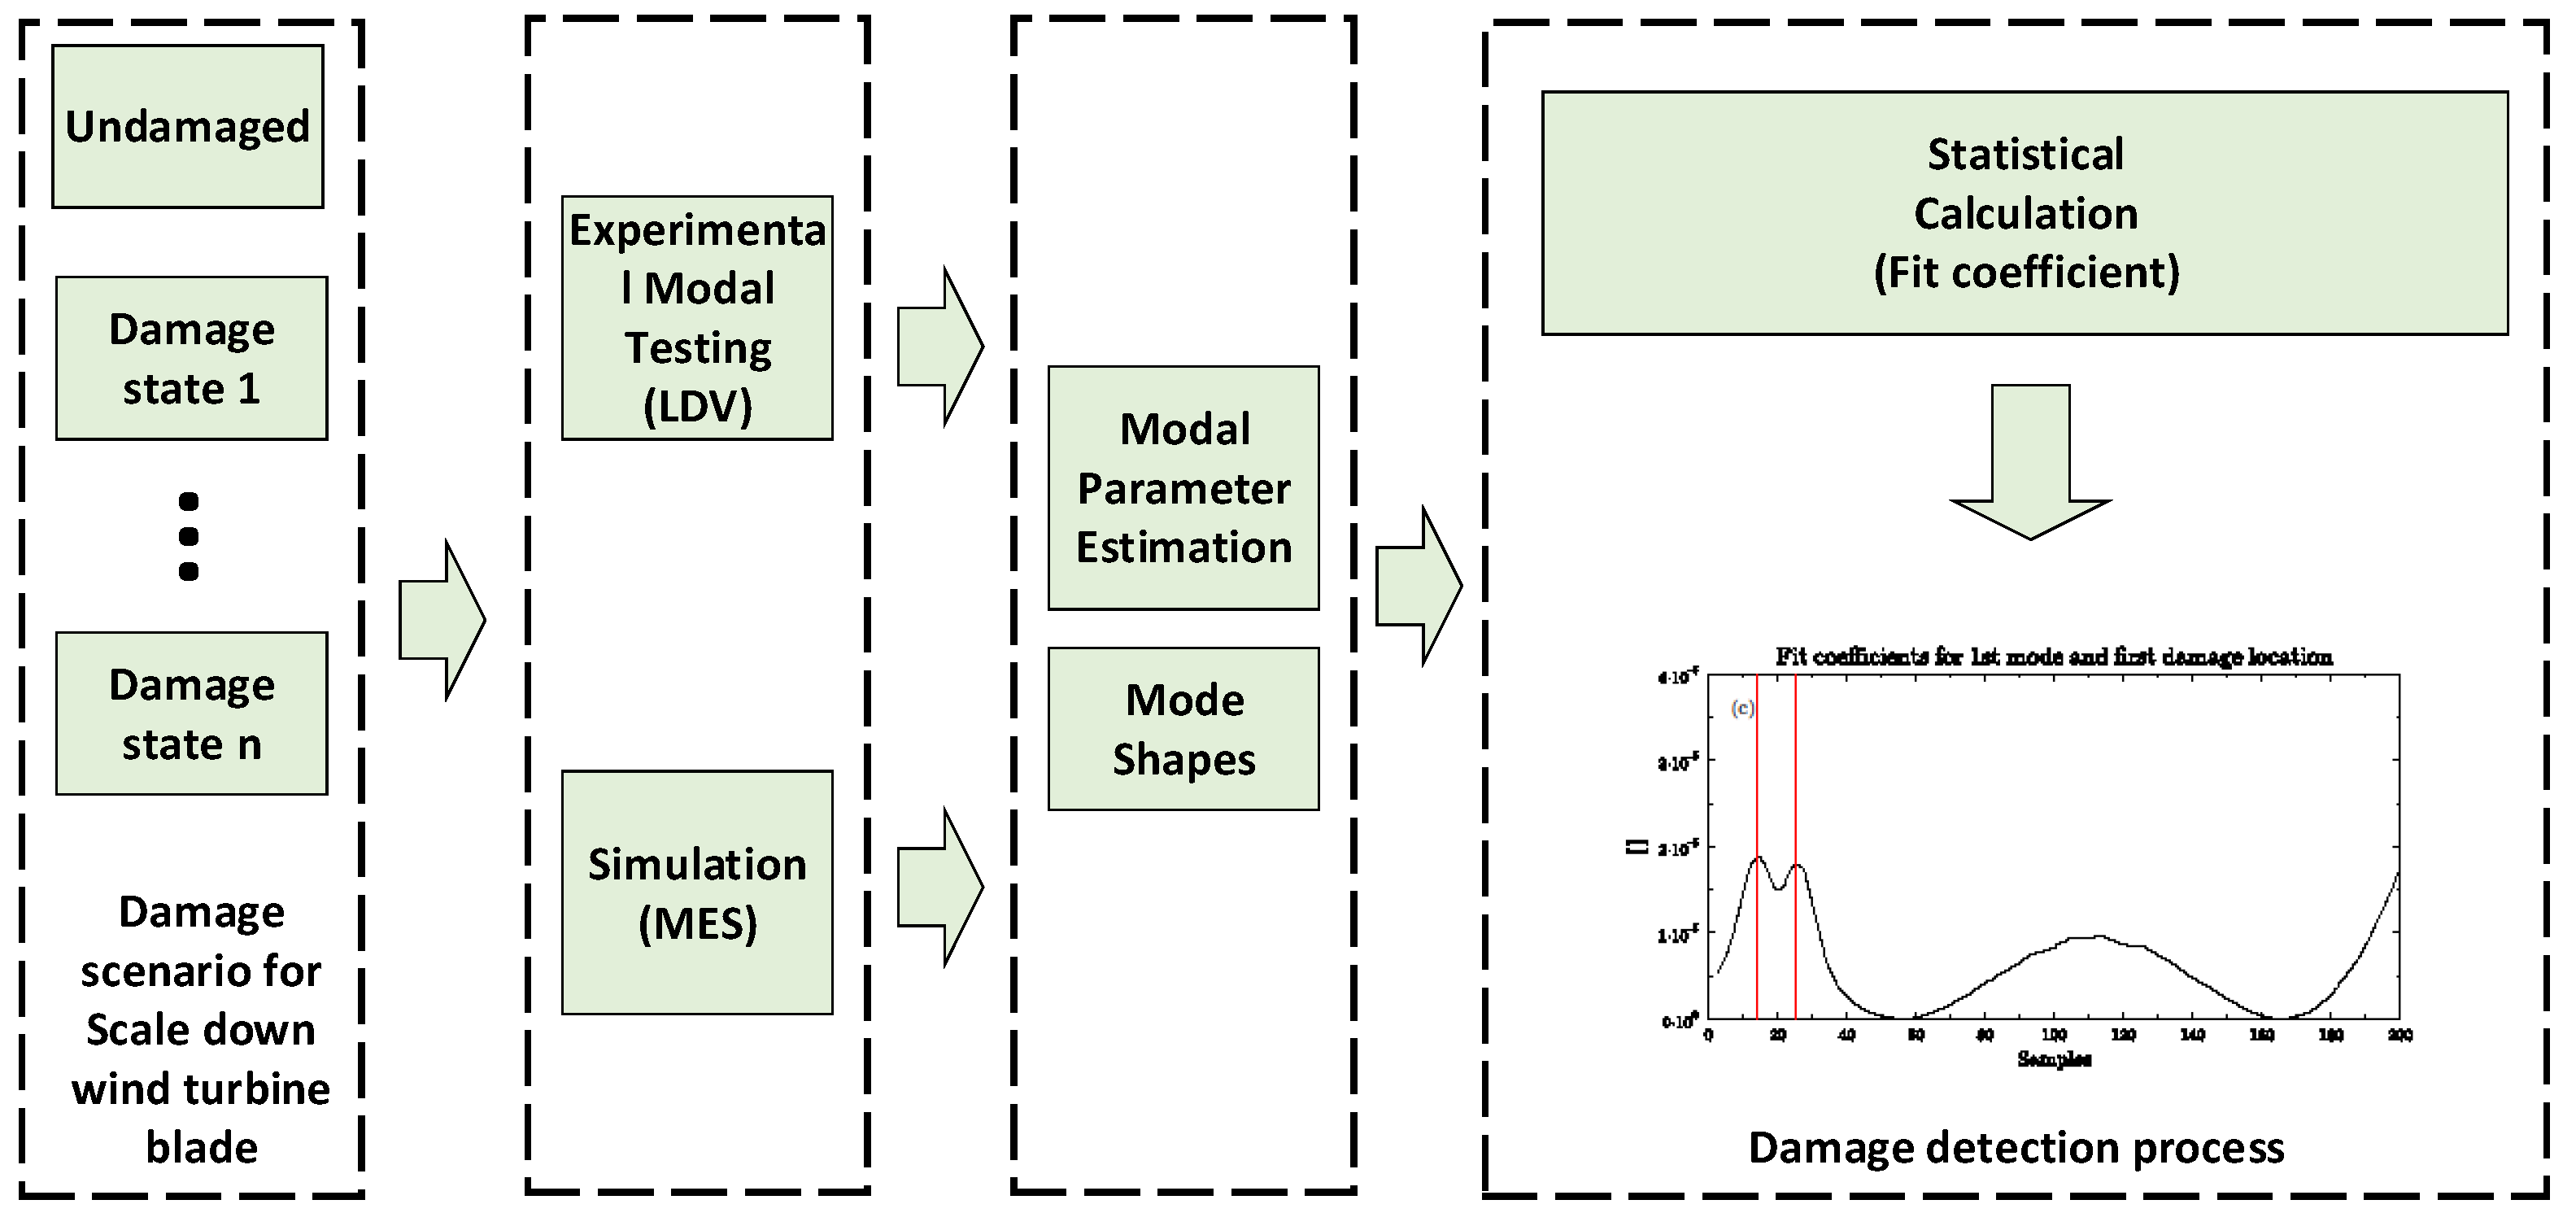
2. Methodology
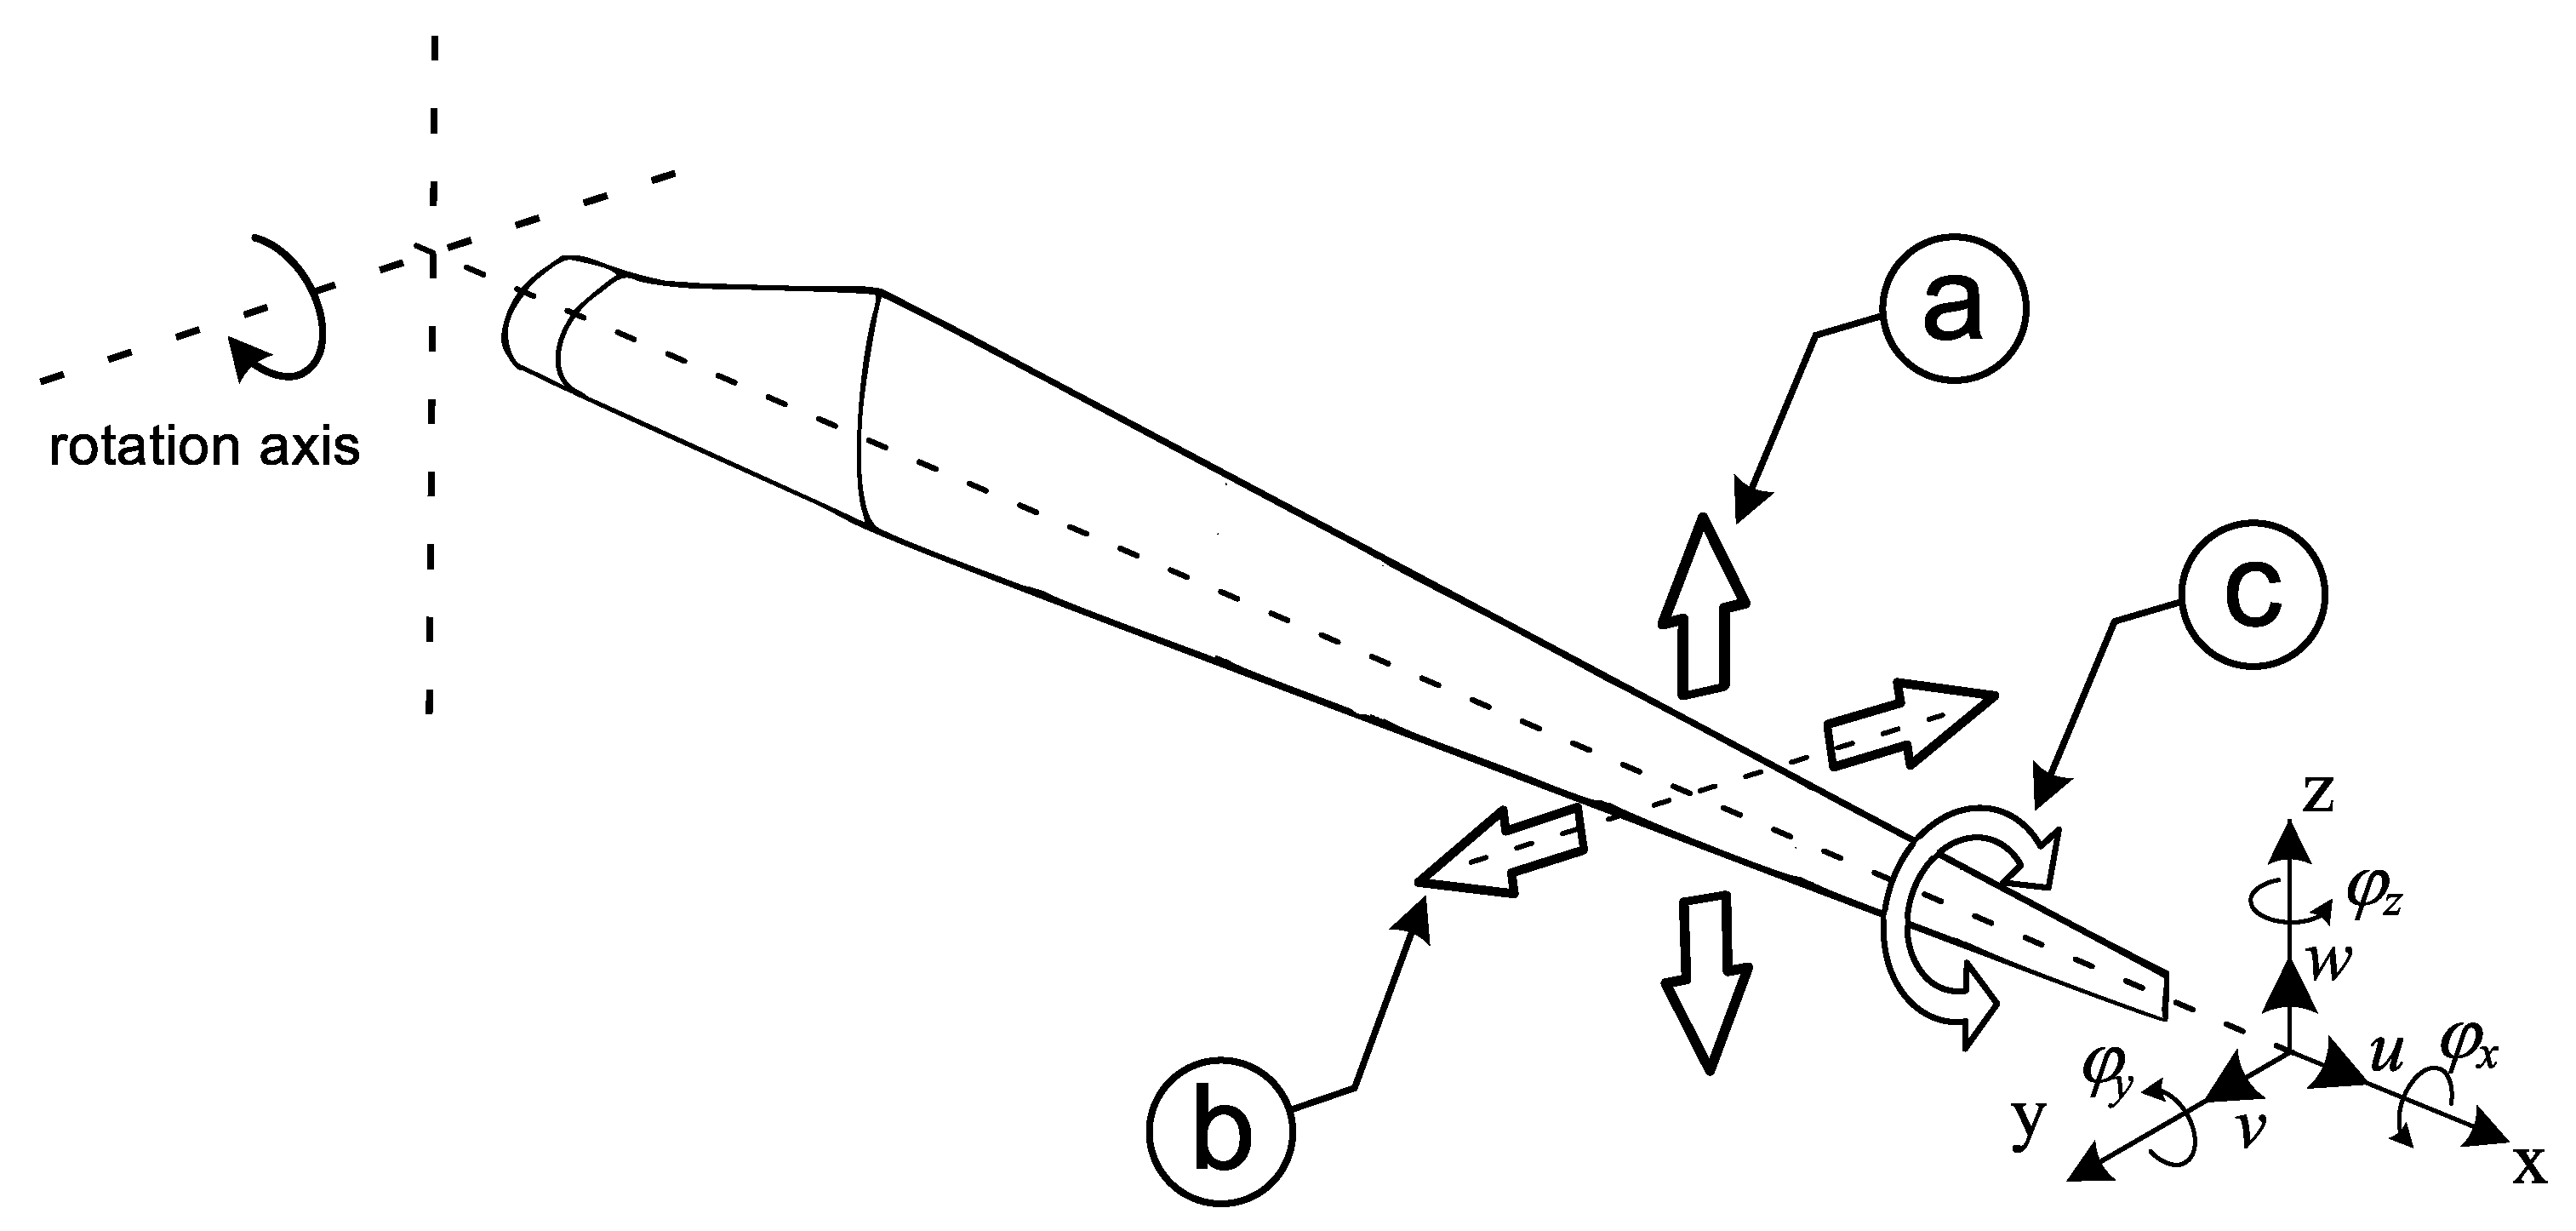
2.1. General Assumptions—Research Object
2.2. Fit Coefficient
2.3. Standardization
2.4. Averaging
3. Results and Discussion
3.1. Case I: Numerical Simulation
3.1.1. Modelling of the Blade Using Finite Element Method
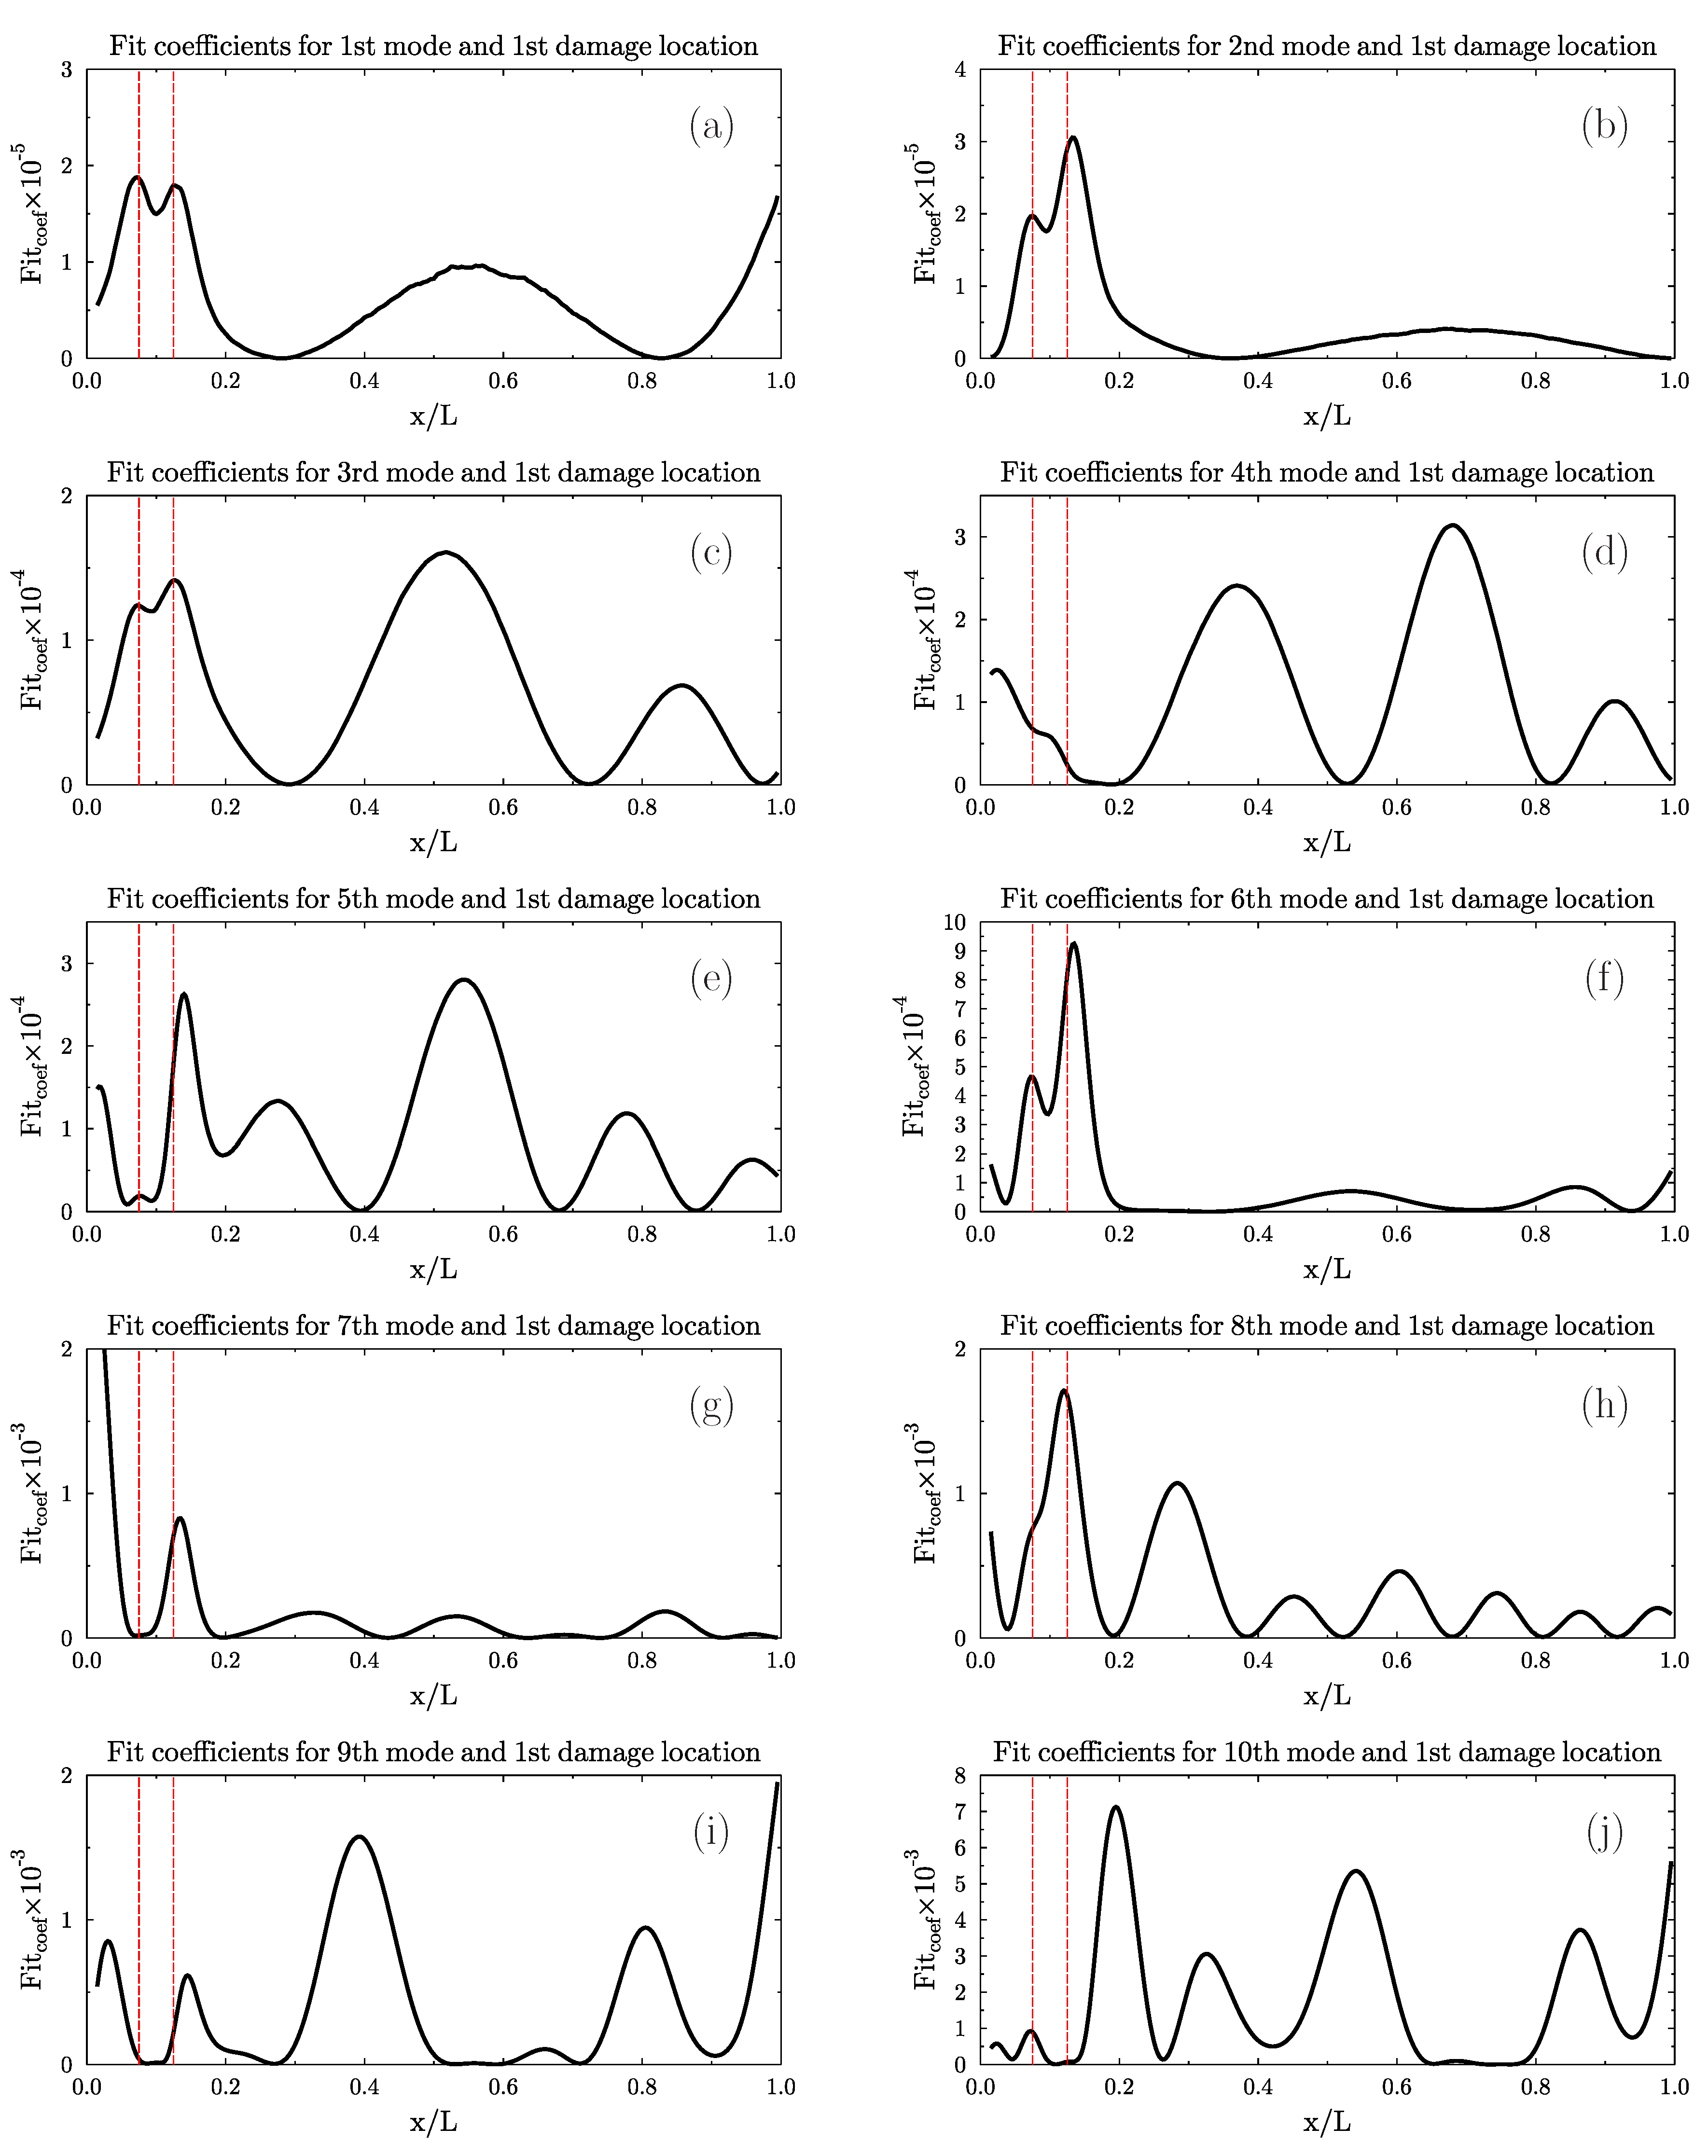
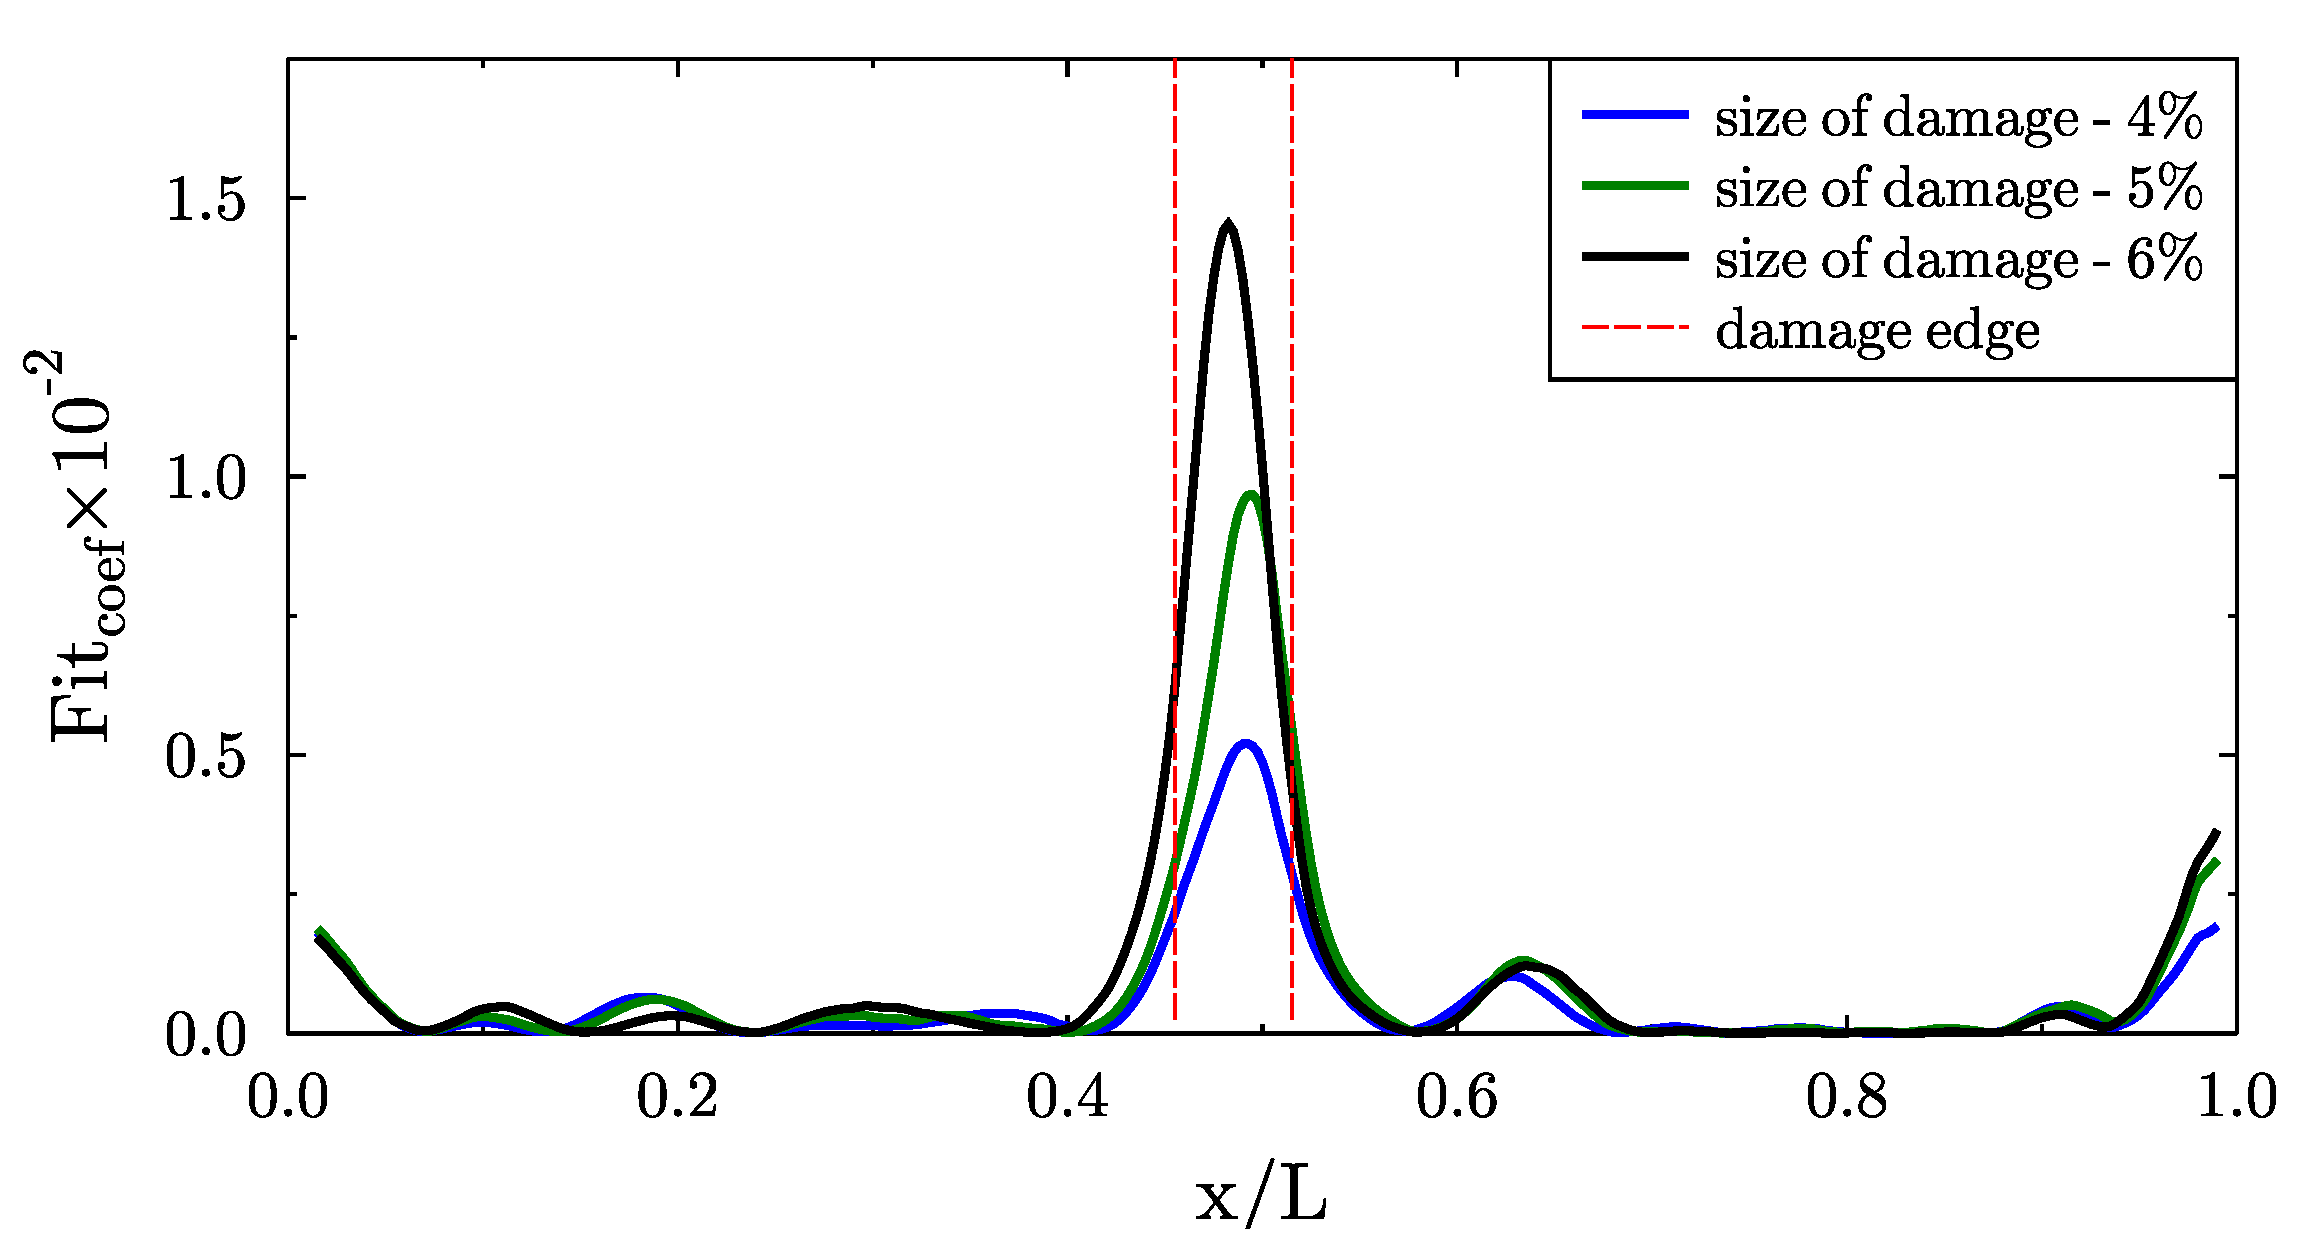
3.1.2. Damage Localization—Results
3.2. Case II: Experimental Work
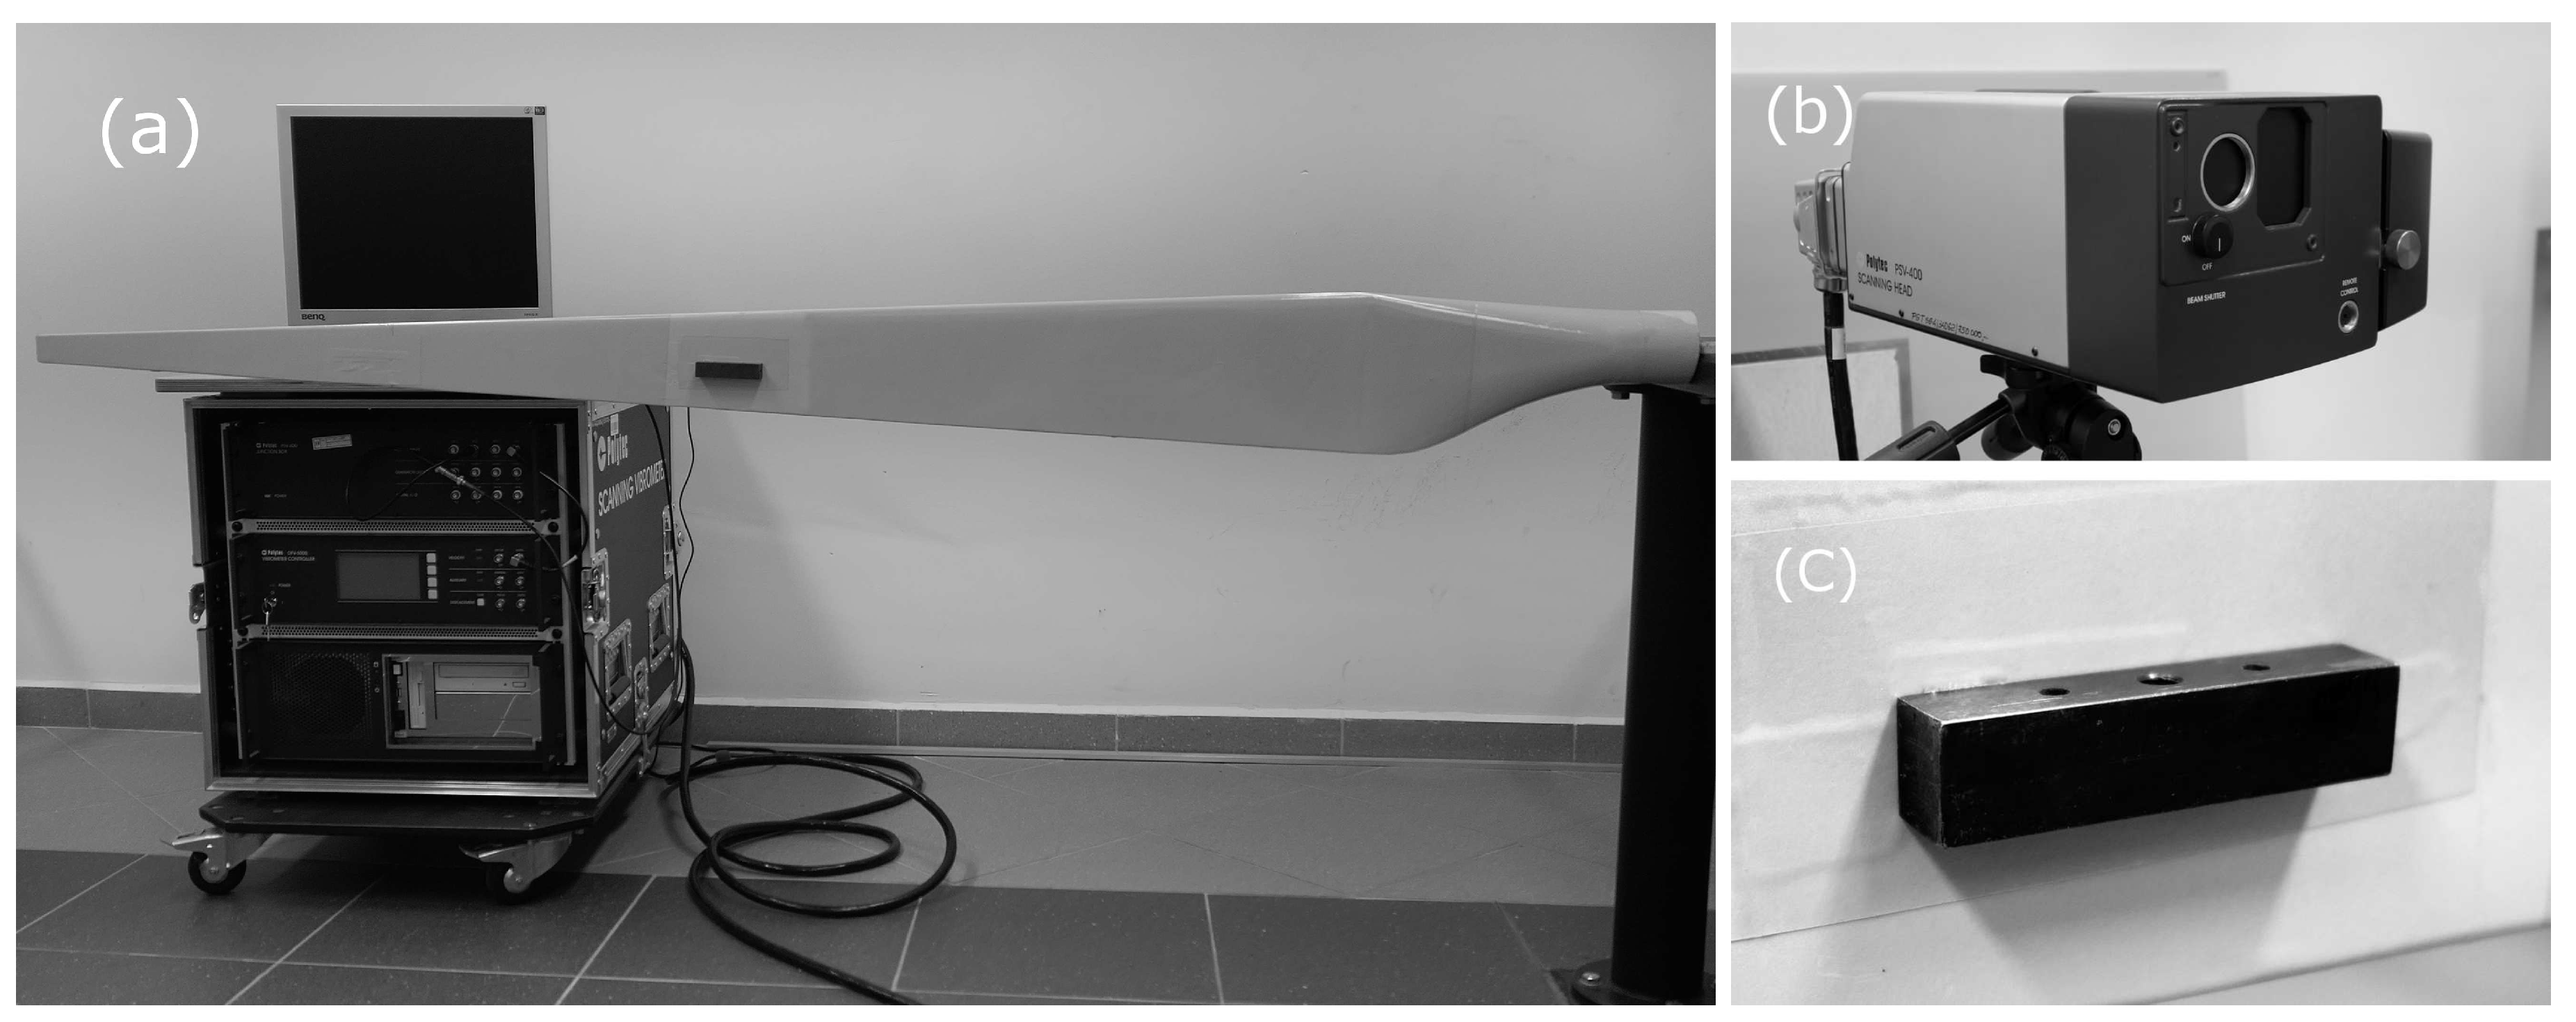
3.2.1. Experimental Setup
3.2.2. Damage Localization—Results
4. Conclusions
- analyzing of the torsional vibration mode shapes of the blade for the statistical calculation,
- testing the influence of measuring noise level on the effectiveness of damage detection and localization,
- the calculation for 2-dimensional forms of vibration,
- increasing the sensitivity of damage edge detecting by combining the statistical method with wavelet analysis,
- testing the effectiveness of the method on data from different measuring techniques.
Author Contributions
Funding
Acknowledgments
Conflicts of Interest
References
- Meng, H.; Lien, F.S.; Glinka, G.; Geiger, P. Study on fatigue life of bend-twist coupling wind turbine blade based on anisotropic beam model and stress-based fatigue analysis method. Compos. Struct. 2019, 208, 678–701. [Google Scholar] [CrossRef]
- Jang, Y.J.; Choi, C.W.; Lee, J.H.; Kang, K.W. Development of fatigue life prediction method and effect of 10-minute mean wind speed distribution on fatigue life of small wind turbine composite blade. Renew. Energy 2015, 79, 187–198. [Google Scholar] [CrossRef]
- Nijssen, R.P.L.; Brøndsted, P. 6-Fatigue as a design driver for composite wind turbine blades. In Woodhead Publishing Series in Energy, Advances in Wind Turbine Blade Design and Materials; Brøndsted, P., Nijssen, R.P.L., Eds.; Woodhead Publishing: Cambridge, UK, 2013; pp. 175–209. [Google Scholar]
- Yang, B.; Sun, D. Testing, inspecting and monitoring technologies for wind turbine blades: A survey. Renew. Sustain. Energy Rev. 2013, 22, 515–526. [Google Scholar] [CrossRef]
- Beganovic, N.; Soffker, D. Structural health management utilization for lifetime prognosis and advanced control strategy deployment of wind turbines: An overview and outlook concerning actual methods, tools, and obtained results. Renew. Sustain. Energy Rev. 2016, 64, 68–83. [Google Scholar] [CrossRef]
- Du, Y.; Zhou, S.; Jing, X.; Peng, Y.; Wu, H.; Kwok, N. Damage detection techniques for wind turbine blades: A review. Mech. Syst. Signal Process. 2020, 141, 106445. [Google Scholar] [CrossRef]
- Sarrafi, A.; Mao, Z.; Niezrecki, C.; Poozesh, P. Vibration-based damage detection in wind turbine blades using Phase-based Motion Estimation and motion magnification. J. Sound Vib. 2018, 421, 300–318. [Google Scholar] [CrossRef]
- Chen, B.; Yu, S.; Yu, Y.; Zhou, Y. Acoustical damage detection of wind turbine blade using the improved incremental support vector data description. Renew. Energy 2020, 156, 548–557. [Google Scholar] [CrossRef]
- Janeliukstis, R.; Rucevskis, S.; Wesolowski, M.; Chat, A. Experimental structural damage localization in beam structure using spatial continuous wavelet transform and mode shape curvature methods. Measurement 2017, 102, 253–270. [Google Scholar] [CrossRef]
- He, M.; Yang, T.; Du, Y. Nondestructive identification of composite beams damage based on the curvature mode difference. Compos. Struct. 2017, 176, 178–186. [Google Scholar] [CrossRef]
- Wu, R.; Zhang, D.; Yu, Q.; Jiang, Y.; Arola, D. Health monitoring of wind turbine blades in operation using three-dimensional digital image correlation. Mech. Syst. Signal Process. 2019, 130, 470–483. [Google Scholar] [CrossRef]
- Sanati, H.; Wood, D.; Sun, Q. Condition Monitoring of Wind Turbine Blades Using Active and Passive Thermography. Appl. Sci. 2018, 8, 2004. [Google Scholar] [CrossRef]
- Shahsavari, V.; Chouinard, L.; Bastien, J. Wavelet-based analysis of mode shapes for statistical detection and localization of damage in beams using likelihood ratio test. Eng. Struct. 2017, 132, 494–507. [Google Scholar] [CrossRef]
- Ulriksen, M.D.; Damkilde, L. Structural damage localization by outlier analysis of signal-processed mode shapes—Analytical and experimental validation. Mech. Syst. Signal Process. 2016, 68–69, 1–14. [Google Scholar] [CrossRef]
- Eder, M.A.; Belloni, F.; Tesauro, A.; Hanis, T. A multi-frequency fatigue testing method for wind turbine rotor blades. J. Sound Vib. 2017, 388, 123–140. [Google Scholar] [CrossRef]
- Reddy, A.; Indragandhi, V.; Ravi, L.; Subramaniyaswamy, V. Detection of Cracks and damage in wind turbine blades using artificial intelligence-based image analytics. Measurement 2019, 147, 106823. [Google Scholar] [CrossRef]
- Ghiasi, R.; Ghasemi, M.R.; Noori, M. Comparative studies of metamodeling and AI-Based techniques in damage detection of structures. Adv. Eng. Softw. 2018, 125, 101–112. [Google Scholar] [CrossRef]
- Yang, K.; Rongong, J.A.; Worden, K. Damage detection in a laboratory wind turbine blade using techniques of ultrasonic NDT and SHM. Strain 2018, 54, e12290. [Google Scholar] [CrossRef]
- Doliński, Ł.; Krawczuk, M.; Żak, A. Detection of Delamination in Laminate Wind Turbine Blades Using One-Dimensional Wavelet Analysis of Modal Responses. Shock Vib. 2018, 2, 1–15. [Google Scholar] [CrossRef]
- Doliński, Ł.; Krawczuk, M.; Żak, A. Damage Detection in the Wind Turbine Blade Using Root Mean Square and Experimental Modal Parameters. In Lecture Notes in Mechanical Engineering, Proceedings of the 13th International Conference on Damage Assessment of Structures, Porto, Portugal, 9–10 July 2019; Wahab, M., Ed.; Springer: Singapore, 2020; pp. 728–742. [Google Scholar]
- Tang, J.; Soua, S.; Mares, C.; Gan, T.H. A Pattern Recognition Approach to Acoustic Emission Data Originating from Fatigue of Wind Turbine Blades. Sensors 2017, 17, 2507. [Google Scholar] [CrossRef]
- Hoell, S.; Omenzetter, P. Fukunaga-Koontz feature transformation for statistical structural damage detection and hierarchical neuro-fuzzy damage localisation. J. Sound Vib. 2017, 400, 329–353. [Google Scholar] [CrossRef]
- Colone, L.; Hovgaard, M.K.; Glavind, L.; Brincker, R. Mass detection, localization and estimation for wind turbine blades based on statistical pattern recognition. Mech. Syst. Signal Process. 2018, 107, 266–277. [Google Scholar] [CrossRef]
- Ansys, Vibration Simulation, Measurement and Analysis. Available online: https://www.ansys.com/products/structures/vibrations (accessed on 24 August 2020).
- MATLAB Documentation. Available online: https://www.mathworks.com/help/matlab/ (accessed on 24 August 2020).
- Bagherpoor, T.; Li, X. Structural optimization design of 2MW composite wind turbine blade. Energy Procedia 2017, 105, 1226–1233. [Google Scholar] [CrossRef]
- Vibrometry-Polytec. Available online: https://www.polytec.com/eu/vibrometry/ (accessed on 24 August 2020).


| Dimension [mm] | |
|---|---|
| Total length | 1740 |
| Max width | 160 |
| Tip width | 32 |
| Measured length | 1440 |
| Thickness of spar | 2.0 |
| Thickness of Section 1 (near blade root) | 2.0 |
| Thickness of Section 2 (middle part of blade) | 1.5 |
| Thickness of Section 3 (near blade tip) | 1.0 |
| Epoxy Resin | Glass Fiber | |
|---|---|---|
| Young modulus, E | 3.43 GPa | 66.5 GPa |
| Poisson ration, | 0.35 | 0.23 |
| Kirchoff modulus, G | 1.27 GPa | 27 GPa |
| density, | 1250 kg/m3 | 2250 kg/m3 |
© 2020 by the authors. Licensee MDPI, Basel, Switzerland. This article is an open access article distributed under the terms and conditions of the Creative Commons Attribution (CC BY) license (http://creativecommons.org/licenses/by/4.0/).
Share and Cite
Dolinski, L.; Krawczuk, M. Analysis of Modal Parameters Using a Statistical Approach for Condition Monitoring of the Wind Turbine Blade. Appl. Sci. 2020, 10, 5878. https://doi.org/10.3390/app10175878
Dolinski L, Krawczuk M. Analysis of Modal Parameters Using a Statistical Approach for Condition Monitoring of the Wind Turbine Blade. Applied Sciences. 2020; 10(17):5878. https://doi.org/10.3390/app10175878
Chicago/Turabian StyleDolinski, Lukasz, and Marek Krawczuk. 2020. "Analysis of Modal Parameters Using a Statistical Approach for Condition Monitoring of the Wind Turbine Blade" Applied Sciences 10, no. 17: 5878. https://doi.org/10.3390/app10175878
APA StyleDolinski, L., & Krawczuk, M. (2020). Analysis of Modal Parameters Using a Statistical Approach for Condition Monitoring of the Wind Turbine Blade. Applied Sciences, 10(17), 5878. https://doi.org/10.3390/app10175878