Review

Climatic Indices over the Mediterranean Sea: A Review

by
Francisco Criado-Aldeanueva
1,* and
Javier Soto-Navarro
2
1
Institute of Oceanic Engineering, University of Málaga, 29071 Málaga, Spain
2
Mediterranean Institute for Advanced Studies (IMEDEA, UIB-CSIC), 07190 Mallorca, Spain
*
Author to whom correspondence should be addressed.
Appl. Sci. 2020, 10(17), 5790; https://doi.org/10.3390/app10175790
Submission received: 8 July 2020 / Revised: 17 August 2020 / Accepted: 19 August 2020 / Published: 21 August 2020
(This article belongs to the Section Earth Sciences)

Abstract

:
The Mediterranean Sea, strategically situated across a dynamic frontier line that separates two regions with different climates (Europe and North Africa), has been the focus of attention of many studies dealing with its thermohaline circulation, deep water formation processes or heat and freshwater budgets. Large-scale atmospheric forcing has been found to play an important role in these topics and attention has been renewed in climatic indices that can be used as a proxy for atmospheric variability. Among them, the North Atlantic oscillation, the East Atlantic or the East Atlantic–West Russia patterns have been widely addressed but much less attention has been devoted to a Mediterranean mode, the Mediterranean oscillation. This overview summarizes the recent advances that have been achieved in the understanding of these climatic indices and their influence on the functioning of the Mediterranean from a physical point of view. The important role of the Mediterranean oscillation is emphasized and the most relevant aspects of the other indices are revisited and discussed.

1. Introduction

The Mediterranean Sea acts as a natural laboratory since, despite its reduced dimensions, most of the processes typical of global ocean circulation, such as deep water formation or thermohaline circulation, take place in the basin. Moreover, semi-enclosed basins such as the Mediterranean are appropriate for characterizing heat and water flux since it makes possible a basin budget closure. There is a lot of research devoted to the Mediterranean heat [1,2,3,4,5,6,7,8,9] and water [1,5,6,9,10,11,12,13,14,15,16,17,18] budgets but, despite these efforts, estimation of the surface freshwater flux has been found to depend on the methodology and datasets used and, hence, is subject to significant uncertainty, particularly in its seasonal and interannual variability. For instance, estimates of the water deficit (evaporation minus precipitation) are found to range from 421 [5] to 1230 mm·y−1 [14], confirming the difficulty of obtaining a reliable estimate.
More than 60 years of climatological datasets were analyzed in recent research [9], with longer time series available. The seasonal cycle of the net heat is positive (that is, toward the ocean) between March and September, with a maximum in June, whereas negative values (that is, toward the atmosphere) are found during the rest of the year, with a minimum in December. On a yearly basis, a nearly neutral budget of 0.7 Wm−2 is reported for the whole Mediterranean but there are remarkable differences between the eastern and western sub-basins: ~12 Wm−2 (toward the ocean) is found for the western Mediterranean and around −6.4 Wm−2 (toward the atmosphere) for the eastern Mediterranean [9], mainly related to the high latent heat losses that take place in this sub-basin (up to 100 Wm−2).
For the freshwater deficit, a seasonal cycle with an amplitude of around 600 mm·y−1, with maximum in August–September and minimum in May, is described [9]. The long-term mean of the basin-averaged deficit is 680 ± 70 mm·y−1 but it is almost 70% higher in the Eastern Mediterranean due to higher evaporation and lower precipitation in this basin. A higher deficit (positive trend) of 1.6 ± 0.9 mm·y−2 is reported for the entire 60-year period in which the decrease in precipitation seems to be the dominant factor, although one study [17] also underlines the role of evaporation changes.
With respect to interannual variability, only a few of the most recent works have focused on this topic and the associated forcing mechanisms, since longer datasets are necessary. For example, in one study [9], several different periods of evaporation and precipitation anomalies are described: from the early 1950s to the late 1960s, a positive trend was reported; then, it changed to negative, until the late 1980s, when a new change was observed. This variability is also found in the net heat flux exchanged between the atmosphere and the ocean and indicates a ~40-year period multidecadal oscillation that is likely to be related to large-scale atmospheric forcing. To explore this linkage, several climatic indices representing this large-scale atmospheric forcing can be tested as a proxy to monitor the long-term variability of climatic variables that influence the Mediterranean. In this review, we revisit the relevance of the most important modes of atmospheric variability in the Mediterranean region from a physical point of view. The work is organized as follows: Section 2 describes the geographical frame; in Section 3, the most outstanding climatic indices are analyzed and the main results presented by different authors are summarized and discussed. Finally, Section 4 provides some concluding remarks and anticipates some future work.

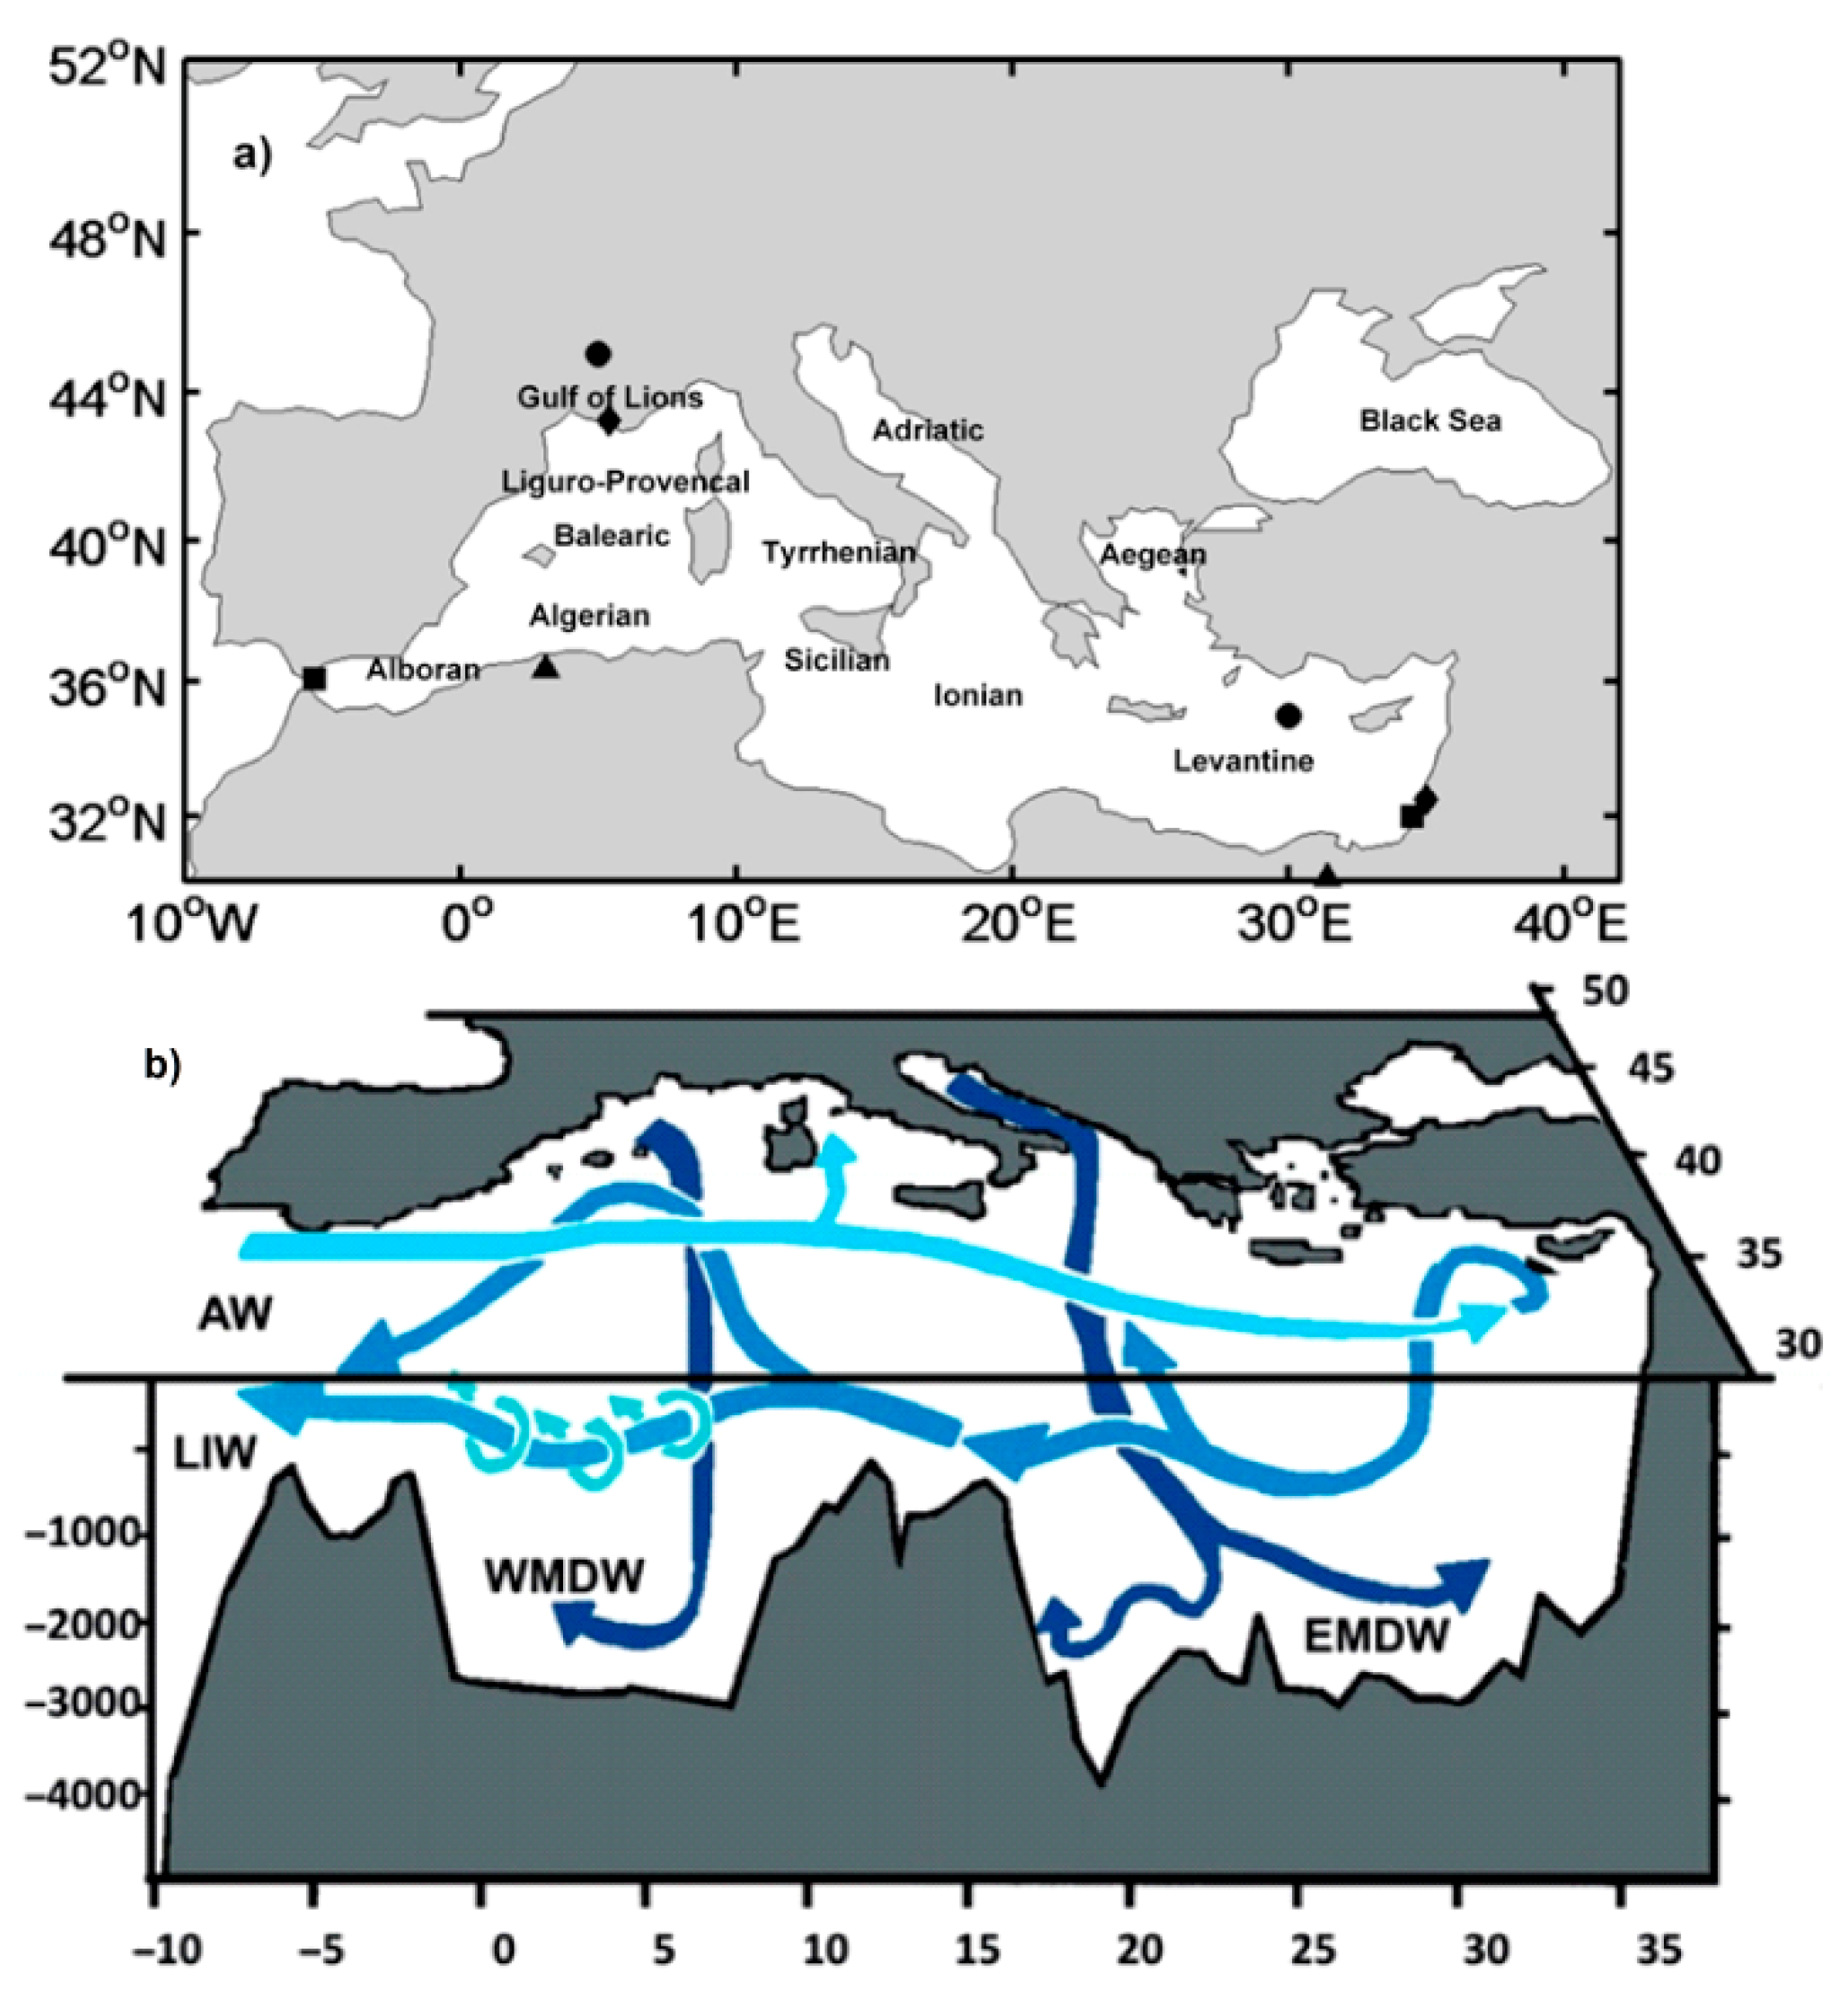
2. Geographical Frame

The Mediterranean Sea (Figure 1a) is a semi-enclosed basin situated along the border that separates the European and North African climatic regions. It has a total surface of 2.5 million of km2, extending for 3000 km in longitude and 1500 in latitude and connecting with the Atlantic Ocean through the Strait of Gibraltar and with the Black Sea through the Dardanelles Strait. The Strait of Sicily separates the basin into two main sub-basins, the Western and Eastern Mediterranean.
The Mediterranean circulation (Figure 1b) is driven, as the leading mechanism, by atmosphere-ocean interactions. This forcing depends on the heat and freshwater exchange and, hence, on the meteorological and oceanic conditions [19]. Since the average precipitation (P) and river runoff (R) do not balance the average evaporation (E) over the basin, a net inflow of Atlantic waters (AW) through the Strait of Gibraltar is necessary to compensate for the deficit. This compensation mechanism generates thermohaline circulation constituted by several cells [20,21]. The main one transports the AW entering the basin in the surface layer eastward, across the western and eastern basins, gradually increasing its salinity and density as a consequence of the evaporative losses. This modified Atlantic water (MAW) reaches the Levantine basin, where winter cooling caused by intense dry winds forces its sinking to intermediate depths (300–500 m), producing the Levantine intermediate water (LIW) [22].
The LIW recirculates westward, crossing the Strait of Sicily and reaching Gibraltar, constituting the main core of the Mediterranean waters leaving the basin [23]. Secondary cells appear during winter in very specific areas where the combination of strong evaporative losses and the preconditioning of the surface and intermediate waters (i.e., waters with increased salinity along their paths to the formation spots) trigger deep convection. In the Eastern Mediterranean, these spots are the Adriatic and Aegean Seas, where the Eastern Mediterranean deep water (EMDW) is produced. In the Western Mediterranean, deep convection takes place in the Gulf of Lions, generating the Western Mediterranean deep water (WMDW), which is incorporated into the Mediterranean outflow through Gibraltar [23,24,25,26,27].

3. Large-Scale Atmospheric Forcing: Climatic Indices

Large-scale atmospheric patterns strongly influence the weather and climate of wide regions. Climatic indices are defined in order to quantify the variability of these general patterns and their effects on local climatic systems. They provide information on how the overall physical variability is linked to the evolution of the local climatic parameters. Hence, they can be used as a proxy to monitor the long-term variability of climatic variables that influence the Mediterranean circulation. For this reason, the improvement of our knowledge of the interrelation between the climatic indices and the Mediterranean climate and circulation is essential in order to understand their variability and evolution under climate change. The most outstanding climatic indices that influence the Mediterranean region, namely the North Atlantic oscillation (NAO), East Atlantic (EA) pattern, East Atlantic–West Russia (EA–WR) pattern and the Mediterranean oscillation (MO), will be reviewed in the following sections. The Scandinavian (SCAN) pattern produces weak variations in the sea level pressure anomaly field and plays a secondary role in the large-scale atmospheric forcing over the Mediterranean [28,29].
The spatial structure of the large-scale atmospheric patterns can be described in numerous ways and, therefore, there are several accepted definitions of the climatic indices that represent their modes of variability and temporal evolution. Two approaches have been historically followed: the combination (usually difference) between the sea level pressure (SLP) anomalies measured at different stations over the region of influence of the atmospheric patterns (e.g., see [29,30,31,32,33,34,35] for MO index; see [33,34,35,36,37] for a complete review of station-based NAO indices) or from the principal components (PC) time series of the first empirical orthogonal function (EOF) of SLP or some other climate variable (see [38,39] for MO index; see [40] for a summary of several NAO definitions).
The definition based on the PC has the advantage of representing the variability of the atmospheric patterns in its whole extension, not being affected by the noise introduced in the SLP measurements by the short-term meteorological events present in the station-based indices (see [40,41,42] or [43] for MO). A widely used analysis of the most outstanding modes of atmospheric variability is carried out at the National Oceanic and Atmospheric Administration (NOAA) Climate Prediction Centre (CPC). They identify the main modes by a rotated PC analysis [44] of the measured monthly mean 500 mb height anomaly fields in the area 20° N–90° N. Their database provides monthly index values for each mode computed by this method (see details in [45]).

3.1. The North Atlantic Oscillation (NAO)

The NAO index is a fundamental mode of the climatic variability in the northern hemisphere ([44,46,47]; see [48] for a review). It represents the dipolar pattern of the SLP characteristic of the North Atlantic-European region, with one center in the Azores high and the other in the Iceland low.
Stronger/weaker phases of the NAO are related to variations in the position and intensity of the North Atlantic jet stream (NAJS) and the storm track, along with large-scale changes in the zonal and meridional heat and moisture transport, which are reflected in changes in the temperature and precipitation patterns of wide regions, including the Mediterranean Sea. To clearly show this, we display the composites of sea level pressure anomalies (mbar) for the positive (higher quartile) and negative (lower quartile) phases of NAO (Figure 2 and the same for all indices in Figure 2, Figure 3, Figure 4 and Figure 5). Monthly mean sea level pressure at 2.5° × 2.5° for the period 1948–2009 from the National Centre for Environmental Prediction (NCEP) has been used.
Positive NAO phases (Figure 2a) are associated with an increase in the SLP over most parts of continental Europe and the Mediterranean Sea. Both poles, the Azores high and the Iceland low, are intensified, modifying the direction of the westerlies and associated storm tracks, thus leading to a decrease in the precipitation over the Mediterranean and Southern Europe (south 45° N) and an increase over Northern Europe. On the other hand, negative NAO (Figure 2b) generates negative SLP anomalies in Southern Europe and the Mediterranean basin, increasing the precipitation in these regions [16,34,35,36,47,49,50,51,52,53,54]. Although the NAO index shows high interannual and multidecadal variability, long periods of positive and negative phases are common (see Figure 6). Switches from negative to positive NAO phases are followed by noticeable changes in the average precipitation of the Mediterranean basin, such as the decrease observed between the mid-1960s and the 1990s.
Positive NAO phases favor negative evaporation anomalies that can reach −160 mm/y in the Gulf of Lions and the Levantine basin [53,54], areas of formation of the WMDW and LIW, respectively. As a consequence, the reduction of latent heat losses associated with evaporation may result in a decrease in the amount of LIW and WMDW produced (see [32,55] for a detailed discussion of convective processes). Anti-correlation is expected since, under a negative state, anomalously low pressure over the whole basin is observed (see Figure 2b) and more severe weather conditions over the Eastern and Northern Mediterranean are generated by the colder and drier air masses that flow from continental regions. Under this scenario, the enhancement of evaporative losses to the atmosphere is expected. In contrast, positive values are followed by higher than average pressure over the Mediterranean and North Africa (Figure 2a) that induce a change in the wind trajectories toward lower latitudes. Moister and warmer air masses are then advected to the Mediterranean, producing milder winters and, consequently, a decrease in the evaporative losses [34].

3.2. The East Atlantic (EA) Pattern

The EA pattern is defined as the SLP anomaly in the region between the two centers of the NAO dipole (approximately between Greenland and the British Islands–Baltic Sea area, Figure 3). When the EA is in a positive phase, this region is characterized by a negative SLP anomaly, enhancing strong cyclonic winds in the North Atlantic (Figure 3a). Conversely, a negative EA phase results in positive SLP anomalies (Figure 3b) that induce northeasterly flow of cold dry air, increasing the air–sea temperature and humidity gradients and leading to strong positive anomalies in the heat loss over the Mediterranean basin.
In a recent research [54], it is estimated that, on an annual basis, the climatological effect of the EA and NAO are of the same magnitude (~5.5 Wm−2 in 46% of the basin). One study [28] found a stronger effect of the EA pattern on winter heat losses and a minor impact of NAO. Since they analyzed a similar time period (1958–2006) of the same dataset, differences are probably attributable to the seasonal variability of the EA pattern that is reinforced in wintertime and weakens in spring and summer [44,56]. The enhanced EA high (in its negative state) and a slight drift towards the east during winter may lead to a more important influence over the whole basin in this season and a prominent role in the heat loss represented by intermediate and deep water formation processes [28,29,32].

3.3. The East Atlantic–West Russia (EA–WR) Pattern

The EA–WR pattern comprises a center of high/low SLP anomalies located in the North Sea flanked by two centers of opposite SLP anomalies (low/high) over the Western North Atlantic (between 45° and 55° N) and West Russia (Figure 4). Positive phases of EA–WR enhance northerlies over the Eastern Mediterranean and southerlies over the western basin.
The opposite effect of the EA–WR mode in the wind regime of the Eastern and Western Mediterranean generates a dipolar pattern in the net heat anomalies over the basin. A positive EA–WR mode is associated with higher latent heat losses in the Eastern Mediterranean, with positive anomalies up to 15 Wm−2 in the Levantine basin, while negative latent heat loss anomalies are simultaneously observed in the Balearic and Adriatic seas [54]. This dipolar pattern can be explained considering the sea level pressure anomaly (SLPA) associated with the positive phase of EA–WR (Figure 4a): the higher SLPA over Northern Europe forces a northerly flow of cold dry air over the eastern basin but a southerly flow of relatively warm moist air over the western basin, this producing net heat anomalies of different signs. In the negative phase, opposite conditions prevail (Figure 4b) and thus sign variations of EA–WR have the potential to induce a see-saw behavior in the heat budgets of the eastern and western sub-basins, a result also presented by other authors [28], who discussed the relevant impact of this mode on winter heat flux.

3.4. The Mediterranean Oscillation (MO)

The first definition of the Mediterranean oscillation (MO) [30] described it as a dipolar behavior of the atmosphere between the Western and Eastern Mediterranean. Since then, some authors have attributed the differences in key atmospheric and oceanographic parameters between both basins to this mode [30,57,58,59]. The index measuring the intensity of the dipole was primarily defined as the normalized 500 hPa height difference anomalies between Algiers (36.4° N, 3.1° E) and Cairo (30.1° N, 31.4° E) [30]. An alternative definition [31] estimated the MO index as the difference in the normalized SLP between the northern frontier of the Strait of Gibraltar (36.1° N, 5.3° W) and the Lod Airport in Israel (32.0° N, 34.5° E) [60]. A third definition [61] is offered for a better representation of the Central Mediterranean behavior, choosing the normalized SLP difference between Marseille and Jerusalem. Using this index, the authors found good (anti-)correlation with the precipitation and the number of wet days in Italy (around −0.4 on a yearly basis and up to −0.7 for wintertime depending on the location). More recently [29,32], the Mediterranean index has been introduced as the sea level pressure difference between South France (45° N, 5° E) and the Levantine Sea (35° N, 30° E). These two points are orientated in a NW-SE direction and are likely to reflect more accurately the realistic dipole pressure pattern. An approach based on the analysis of the EOF of the SLP anomaly fields over an extended Mediterranean region has been proposed [38]. Elsewhere [39], this paradigm is also used to analyze the influence of the MO index on the variability of the flow exchange through the Strait of Gibraltar.
More recently [43], it was analyzed in detail these different paradigms of the Mediterranean oscillation teleconnection index: station-based definitions (Algiers–Cairo, MOAC, Gibraltar–Israel, MOGI, Marseille–Jerusalem, MOMJ or France–Levantine, MOFL) and the principal component (PC) approach in which the MOPC index was obtained as the time series of the first mode of normalized SLP anomalies over the extended Mediterranean region included in the limits [30° W–40° E, 30° N–60° N], which exhibits a single center located over the Central and Western Mediterranean that remains fairly steady in all seasons. They correlated interannual to interdecadal precipitation (P), evaporation (E), E-P and net heat flux with the different MO indices to compare their relative importance in the long-term variability of heat and freshwater budgets over the Mediterranean Sea. The accuracy of the index based on the different definitions to describe the interannual and interdecadal variability of the basin freshwater and heat budget components has also been analyzed [43].
They concluded that the most effective representation of the basin large-scale atmospheric forcing is achieved by the MO index based on PC analysis since it provides optimal representation of the full spatial pattern. Station-based indices show very poor correlation with the climatic variables analyzed (P, E and E-P) and only affect a reduced region of the basin. The noise introduced by the local small-scale and transient meteorological events in the SLP measurements causes the poorer results of the station-based indices [41,42]. During winter, when the dynamic activity of the atmosphere increases and the impact of the large-scale atmospheric variability is higher, the large-scale patterns over the basin are more marked and stable, improving the capacity of the station-based indices to capture the atmospheric variability. Unfortunately, this capacity is strongly reduced for the rest of the year. On the other hand, the PC analysis captures the variability of the whole region, filtering out the small-scale events and hence providing a better representation of the climatological evolution of the atmospheric processes over the basin independent of the season. MOAC shows better correlation for most winter-averaged variables and reveals more clearly the well-known dipole response of the eastern and western basins. However, all MO indices show fairly similar results, especially at decadal timescales [43].
It is worth pointing out that, while NAO, EA and EA–WR can be considered independent modes of the same EOF analysis, this is not the case for the MO. The NAO and MO patterns have important similarities, both with positive (negative) phases characterized by higher (lower) SLP anomalies over the Mediterranean (Figure 5). The two indices are strongly influenced by the Northeast Atlantic low systems that force the Mediterranean cyclogenesis [62], and thus their annual time series are highly correlated (~0.6 [54]; see also Figure 6). The MO can be understood as an oscillation of sea level pressure anomalies in the Central and Western Mediterranean, an important source of cyclogenesis. Since the appearance of these cyclones is partially connected with the activity of North Atlantic fronts governed by NAO, a high correlation is expectable. During winter, the southern center of the NAO is placed closer to the Mediterranean and, hence, the best correlation for all variables is always achieved by the winter NAO index. However, in summer and spring, the southern center of the NAO moves westward [34] and lower correlation is observed. On the contrary, since its center remains rather stable, the influence of MO in the Mediterranean is noticeable in all seasons. The MO index is also able to capture the effects of other low-frequency atmospheric modes in the Mediterranean SLP field. In particular, the influence of the EA (annual correlation of 0.43) but also the winter EA–WR and Scandinavian (SCAN) modes [29] are noticeable. Therefore, this provides a more complete picture of the large-scale atmospheric impact over the Mediterranean, emerging as a rather accurate index to describe the basin climatological freshwater and (especially) heat budgets.
Particularly, it is important to point out some achievements of the MO index with respect to the other indices [54]: (i) the annual correlations between the MO index and the climatic variables (E, P, E-P and heat flux) are higher than for the other indices; (ii) specifically, the influence of the MO negative phase is stronger than the NAO and is linked to an increase in precipitation and, in particular, intensification of the evaporation in the Levantine basin. In both MO phases, the SLP pattern induces wind trajectories that are closely related to the evaporation and net heat flux variability (Figure 5): warmer and moister air masses are transported to the Central and Western Mediterranean in the MO positive phase, as a consequence of the positive SLP anomaly dipole structure between North Africa and Central Europe (Figure 5a), resulting in milder winters and the subsequent decrease in evaporation and heat loss. Conversely, negative MO phases are characterized by a dipole of low SLP anomalies between Turkey and Central Europe (Figure 5b), enhancing the flow of cold and dry air masses from continental regions to the Mediterranean. This results in severe winters in the Aegean and Levantine basins that increase evaporation and heat losses, favoring the convective processes that generate the LIW.

4. Concluding Remarks and Future Work

This overview has revisited the recent advances in the understanding of several prominent climatic indices that influence the functioning of the Mediterranean Sea from a physical point of view. The NAO index is widely recognized as representative of one the most important modes of atmospheric variability in the northern hemisphere and hence the Mediterranean basin. Both phases of the NAO are associated with basin-wide changes and, for instance, the observed decrease in the basin averaged precipitation from the mid-1960s to early 1990s is likely to be linked to the multidecadal oscillation of the NAO index that switched from negative to positive phase. The EA pattern plays an interesting role in heat losses since its negative phase induces northeasterly flow of cold dry air, increasing the air–sea temperature and humidity gradients, which leads to strong positive anomalies in the heat loss over the whole basin, especially in wintertime. The most interesting effect of EA–WR is that the associated sign variations produce significant differences in the basin heat loss distribution, generating opposite sign anomalies in the western and eastern basins. Finally, the MO, although not independent from the others, has turned out to be a valuable tool for measuring the atmospheric forcing over the basin since, on an annual basis, it provides the highest correlation with the main climatic variables that influence the freshwater and heat budgets in the Mediterranean Sea and, hence, its thermohaline circulation.
In relation to future work, it is obvious that such a complex system as the Mediterranean Sea cannot be characterized only by experimental observations. With advanced computational power, numerical models will become an extremely useful tool since they are able to provide information about the entire system and all the processes involved. The ability of climatic indices to capture a lot of atmospheric information in a single parameter makes them very valuable for computing purposes, and the development of models that may use them as inputs for their calculations is a promising challenge.

Author Contributions

Both authors contributed to all sections. All authors have read and agreed to the published version of the manuscript.

Funding

This research received funding from the University of Malaga for its open access publication.

Acknowledgments

Most of the work used for this review article was carried out for the authors in the frame of the P07-RNM-02938 and P12-RNM-01412 Junta de Andalucía Spanish-funded projects.

Conflicts of Interest

The authors declare no conflict of interest.

List of Acronyms

AWAtlantic waters
CPCClimate Prediction Centre
EEvaporation
EAEast Atlantic
EA–WREast Atlantic–West Russia
EMDWEastern Mediterranean deep water
EOFEmpirical orthogonal function
E-PEvaporation minus precipitation (freshwater deficit)
LIWLevantine intermediate water
MAWModified Atlantic water
MOMediterranean oscillation
MOACMediterranean oscillation (Algiers–Cairo)
MOFLMediterranean oscillation (France–Levantine)
MOGIMediterranean oscillation (Gibraltar–Israel)
MOMJMediterranean oscillation (Marseille–Jerusalem)
NAJSNorth Atlantic jet stream
NAONorth Atlantic oscillation
NCEPNational Centre for Environmental Prediction
NOAANational Oceanic and Atmospheric Administration
PPrecipitation
PCPrincipal components
RRiver runoff
SCANScandinavian
SLPSea level pressure
SLPASea level pressure anomalies
WMDWWestern Mediterranean deep water

References

  1. Bethoux, J.P. Budgets of the Mediterranean Sea: Their dependence on the local climate and on the characteristics of Atlantic waters. Ocean. Acta 1979, 2, 157–163. [Google Scholar]
  2. Bunker, A.F.; Charnock, H.; Goldsmith, R.A. A note on the heat balance of the Mediterranean and Red Seas. J. Mar. Res. 1982, 40, 73–84. [Google Scholar]
  3. May, P.W. A Brief Explanation of Mediterranean Heat and Momentum Flux Calculations; Technical Report; Naval Oceanographic and Atmospheric Research Laboratory (NORDA): NSTL Station, MS, USA, 1986. [Google Scholar]
  4. Garrett, C.; Outerbridge, R.; Thompson, K. Interannual variability in Mediterranean heat and buoyancy fluxes. J. Clim. 1993, 6, 900–910. [Google Scholar] [CrossRef]
  5. Gilman, C.; Garrett, C. Heat flux parameterization for the Mediterranean Sea: The role of atmospheric aerosols and constraints from the water budget. J. Geophys. Res. 1994, 99, 5119–5134. [Google Scholar] [CrossRef]
  6. Castellari, S.; Pinardi, N.; Leaman, K. A model study of air-sea interactions in the Mediterranean Sea. J. Mar. Syst. 1998, 18, 89–114. [Google Scholar] [CrossRef]
  7. Matsoukas, C.; Banks, A.C.; Hatzianastassiou, N.; Pavlakis, K.G.; Hatzidimitriou, D.; Drakakis, E.; Stackhouse, P.W.; Vardavas, I. Seasonal heat budget of the Mediterranean Sea. J. Geophys. Res. 2005, 110. [Google Scholar] [CrossRef]
  8. Ruiz, S.; Gomis, D.; Sotillo, M.G.; Josey, S.A. Characterization of surface heat fluxes in the Mediterranean Sea from a 44-year high-resolution atmospheric data set. Glob. Planet. Chang. 2008, 63, 256–274. [Google Scholar] [CrossRef]
  9. Criado-Aldeanueva, F.; Soto-Navarro, J.; García-Lafuente, J. Seasonal and interannual variability of surface heat and freshwater fluxes in the Mediterranean Sea: Budgets and exchange through the Strait of Gibraltar. Int. J. Climatol. 2012, 32, 286–302. [Google Scholar] [CrossRef]
  10. Peixoto, J.P.; de Almeida, M.; Rosen, R.D.; Salstein, D.A. Atmospheric moisture transport and the water balance of the Mediterranean Sea. Water Resour. Res. 1982, 18, 83–90. [Google Scholar] [CrossRef]
  11. Bryden, H.L.; Kinder, T.H. Steady two-layer exchange through the Strait of Gibraltar. Deep Sea Res. 1991, 38, S445–S463. [Google Scholar] [CrossRef]
  12. Harzallah, A.; Cadet, D.L.; Crepon, M. Possible forcing effects of net evaporation, atmospheric pressure and transients on water transports in the Mediterranean Sea. J. Geophys. Res. 1993, 98, 12341–12350. [Google Scholar] [CrossRef]
  13. Angelucci, M.G.; Pinardi, N.; Castellari, S. Air–sea fluxes from operational analyses fields: Intercomparison between ECMWF and NCEP analyses over the Mediterranean area. Phys. Chem. Earth 1998, 23, 569–574. [Google Scholar] [CrossRef]
  14. Bethoux, J.P.; Gentili, B. Functioning of the Mediterranean Sea: Past and Present Changes related to freshwater input and climatic changes. J. Mar. Syst. 1999, 20, 33–47. [Google Scholar] [CrossRef]
  15. Boukthir, M.; Barnier, B. Seasonal and inter-annual variations in the surface freshwater flux in the Mediterranean Sea from the ECMWF re-analysis project. J. Mar. Syst. 2000, 24, 343–354. [Google Scholar] [CrossRef]
  16. Mariotti, A.; Struglia, M.V.; Zeng, N.; Lau, K.-M. The hydrological cycle in the Mediterranean region and implications for the water budget of the Mediterranean Sea. J. Clim. 2002, 15, 1674–1690. [Google Scholar] [CrossRef] [Green Version]
  17. Mariotti, A. Recent Changes in the Mediterranean Water Cycle: A Pathway toward Long-Term Regional Hydroclimatic Change? J. Clim. 2010, 23, 1513–1525. [Google Scholar] [CrossRef]
  18. Romanou, A.; Tselioudis, G.; Zerefos, C.S.; Clayson, C.A.; Curry, J.A.; Anderson, A. Evaporation-precipitation variability over the Mediterranean and the Black Seas from satellite and reanalysis estimates. J. Clim. 2010, 23, 5268–5287. [Google Scholar] [CrossRef]
  19. Tsimplis, M.; Zervakis, V.; Josey, S.A.; Peneva, E.L.; Struglia, M.V.; Stanev, E.; Teocharis, A.; Lionello, P.; Malanotte-Rizzoli, P.; Artale, V.; et al. Changes in the oceanography of the Mediterranean Sea and their link to climate variability. In Developments in Earth and Environmental Sciences; Lionello, P., Malanotte-Rizzoli, P., Boscolo, R., Eds.; Elsevier: Amsterdam, The Netherlands, 2006; pp. 226–281. [Google Scholar]
  20. Bethoux, J.P.; Gentili, B.; Taillez, D. Warming and freshwater budget change in the Mediterranean since the 1940s, their possible relation to the greenhouse effect. Geophys. Res. Lett. 1999, 25, 1023–1026. [Google Scholar] [CrossRef]
  21. Cusinato, E.; Zanchettin, D.; Sannino, G.; Rubino, A. Mediterranean thermohaline response to large-scale winter atmospheric forcing in a high-resolution ocean model simulation. Pure Appl. Geophys. 2018, 175, 4083–4110. [Google Scholar] [CrossRef]
  22. Robinson, A.R.; Golnaraghi, M.; Leslie, W.G.; Artegiani, A.; Hecht, A.; Lazzoni, E.; Michelato, A.; Sansone, E.; Theocharis, A.; Ünlüata, Ü. The eastern Mediterranean general circulation: Features, structure and variability. Dyn. Atmos. Ocean 1991, 15, 215–240. [Google Scholar] [CrossRef]
  23. Millot, C.; Candela, J.; Fuda, J.-L.; Tber, Y. Large warming and salinification of the Mediterranean outflow due to changes in its composition. Deep Sea Res. 2006, 53, 656–666. [Google Scholar] [CrossRef]
  24. Bryden, H.L.; Stommel, H.M. Origin of the Mediterranean outflow. J. Mar. Res. 1982, 40, 55–71. [Google Scholar]
  25. Astraldi, M.; Conversano, F.; Civitarese, G.; Gasparini, G.; D’Alcalà, M.R.; Vetrano, A. Water mass properties and chemical signature in the central Mediterranean region. J. Mar. Syst. 2002, 33–34, 155–177. [Google Scholar] [CrossRef]
  26. García-Lafuente, J.; Sánchez-Román, A.; Díaz del Río, G.; Sannino, G.; Sánchez-Garrido, J.C. Recent observations of seasonal variability of the Mediterranean outflow in the Strait of Gibraltar. J. Geophys. Res. 2007, 112. [Google Scholar] [CrossRef]
  27. García-Lafuente, J.; Delgado, J.; Sánchez-Román, A.; Soto, J.; Carracedo, L.; Díaz del Río, G. Interannual variability of the Mediterranean outflow observed in Espartel sill, western Strait of Gibraltar. J. Geophys. Res. 2009, 114. [Google Scholar] [CrossRef] [Green Version]
  28. Josey, S.A.; Somot, S.; Tsimplis, M. Impacts of atmospheric modes of variability on Mediterranean Sea surface heat exchange. J. Geophys. Res. 2011, 116. [Google Scholar] [CrossRef]
  29. Papadopoulos, V.; Kontoyiannis, H.; Ruiz, S.; Zarokanellos, N. Influence of atmospheric circulation on turbulent air-sea heat fluxes over the Mediterranean Sea during winter. J. Geophys. Res. 2012, 117. [Google Scholar] [CrossRef]
  30. Conte, M.; Giuffrida, A.; Tedesco, S. The Mediterranean Oscillation, Impact on Precipitation and Hydrology in Italy; Conference on Climate Water; Publications of the Academy of Finland: Helsinki, Finland, 1989; pp. 121–137. [Google Scholar]
  31. Palutikof, J.P. Analysis of Mediterranean climate data: Measured and modelled. In Mediterranean Climate: Variability and Trends; Bolle, H.J., Ed.; Springer: Berlin, Germany, 2003. [Google Scholar]
  32. Papadopoulos, V.; Josey, S.; Bartzokas, A.; Somot, S.; Ruiz, S.; Drakopoulou, P. Large-scale atmospheric circulation favoring deep- and intermediate- water formation in the Mediterranean Sea. J. Clim. 2012, 25, 6079–6091. [Google Scholar] [CrossRef] [Green Version]
  33. Rogers, J.C. The association between the North Atlantic Oscillation and the Southern Oscillation in the northern hemisphere. Mon. Weather Rev. 1984, 112, 1999–2015. [Google Scholar] [CrossRef]
  34. Hurrell, J.W. Decadal trends in the North Atlantic Oscillation—Regional temperatures and precipitation. Science 1995, 269, 676–679. [Google Scholar] [CrossRef] [Green Version]
  35. Jones, P.D.; Jonsson, T.; Wheeler, D. Extension to the North Atlantic Oscillation using early instrument pressure observations from Gibraltar and south-west Iceland. Int. J. Climatol. 1997, 17, 1433–1450. [Google Scholar] [CrossRef]
  36. Slonosky, V.C.; Yiou, P. Secular changes in the North Atlantic Oscillation and its influence on 20th century warming. Geophys. Res. Lett. 2001, 28, 807–810. [Google Scholar] [CrossRef]
  37. Jones, P.D.; Osborn, T.J.; Briffa, K.R. Pressure-based measures of the North Atlantic Oscillation (NAO), a comparison and assessment of changes in the strength of the NAO and its influence on surface climate parameters. In The North Atlantic Oscillation, Climatic Significance and Environmental Impact; Hurrell, J.W., Kushnir, Y., Ottersen, G., Visbeck, M., Eds.; AGU: Washington, DC, USA, 2003; Volume 134, pp. 51–62. [Google Scholar]
  38. Suselj, K.; Bergant, K. Mediterranean Oscillation Index. Geophys. Res. Abstr. 2006, 8, 02145. [Google Scholar]
  39. Gomis, D.; Tsimplis, M.N.; Martín-Míguez, B.; Ratsimandresy, A.W.; García-Lafuente, J.; Josey, S.A. Mediterranean sea level and barotropic flow through the Strait of Gibraltar for the period 1958–2001 and reconstructed since 1659. J. Geophys. Res. 2006, 111. [Google Scholar] [CrossRef] [Green Version]
  40. Hurrell, J.W.; Deser, C. North Atlantic climate variability: The role of the North Atlantic Oscillation. J. Mar. Sys. 2010, 79, 231–244. [Google Scholar] [CrossRef]
  41. Trenberth, K.E. Signal versus noise in the Southern Oscillation. Mon. Weather Rev. 1984, 112, 326–332. [Google Scholar] [CrossRef] [Green Version]
  42. Hurrell, J.W.; van Loon, H. Decadal variations in climate associated with the North Atlantic Oscillation. Clim. Chang. 1997, 36, 301–326. [Google Scholar] [CrossRef]
  43. Criado-Aldeanueva, F.; Soto-Navarro, F.J. The Mediterranean Oscillation teleconnection index: Station-based versus principal component paradigms. Adv. Meteorol. 2013, 738501. [Google Scholar] [CrossRef] [Green Version]
  44. Barnston, A.G.; Livezey, R.E. Classification, seasonality and persistence of low-frequency atmospheric circulation patterns. Mon. Weather Rev. 1987, 115, 1083–1126. [Google Scholar] [CrossRef]
  45. CPC NOAA. Available online: http://www.cpc.ncep.noaa.gov/data/teledoc/teleindcalc.shtml (accessed on 2 July 2020).
  46. Walker, G.T.; Bliss, W.E. World Weather, V. Mem. R. Meteorol. Soc. 1932, 44, 53–84. [Google Scholar]
  47. Van Loon, H.; Rogers, J.C. The see-saw of winter temperatures between Greenland and northern Europe. Part I: General descriptions. Mon. Weather Rev. 1978, 106, 296–310. [Google Scholar] [CrossRef] [Green Version]
  48. Hurrell, J.W.; Kushnir, Y.; Ottersen, G.; Visbeck, M. The North Atlantic Oscillation: Climate significance and environmental impact. Geophys. Monogr. Ser. 2003, 134. [Google Scholar] [CrossRef]
  49. Rogers, J.C.; van Loon, H. The see-saw of winter temperatures between Greenland and northern Europe. Part II: Some oceanic and atmospheric effects in middle and high latitudes. Mon. Weather Rev. 1979, 107, 509–519. [Google Scholar] [CrossRef]
  50. Serreze, M.C.; Carse, F.; Barry, R.G.; Rogers, J.C. Icelandic low cyclone activity: Climatological features, linkages with the NAO and relationships with recent changes in the northern hemisphere circulation. J. Clim. 1997, 10, 453–464. [Google Scholar] [CrossRef]
  51. Dai, A.; Fung, I.Y.; del Genio, A.D. Surface observed global land precipitation variations during 1900–88. J. Clim. 1997, 10, 2943–2962. [Google Scholar] [CrossRef]
  52. Mariotti, A.; Arkin, P. The North Atlantic Oscillation and oceanic precipitation variability. Clim. Dyn. 2007, 28, 35–51. [Google Scholar] [CrossRef]
  53. Criado-Aldeanueva, F.; Soto-Navarro, F.J.; García-Lafuente, J. Climatic indices influencing the long-term variability of Mediterranean heat and water fluxes: The North Atlantic and the Mediterranean Oscillations. Atmosphere-Ocean 2014, 52, 103–114. [Google Scholar] [CrossRef]
  54. Criado-Aldeanueva, F.; Soto-Navarro, F.J.; García-Lafuente, J. Large-scale atmospheric forcing influencing the long-term variability of Mediterranean heat and freshwater budgets: Climatic indices. J. Hydrometeorol. 2014, 15, 650–663. [Google Scholar] [CrossRef]
  55. Josey, S.A. Changes in the heat and freshwater forcing of the eastern Mediterranean and their Influence on deep water formation. J. Geophys. Res. 2003, 108, 3237. [Google Scholar] [CrossRef]
  56. Rogers, J.C. Patterns of low-frequency monthly sea-level pressure variability (1899–1986) and associated wave cyclone frequencies. J. Clim. 1990, 3, 1364–1379. [Google Scholar] [CrossRef] [Green Version]
  57. Kutiel, H.; Maheras, P.; Guika, S. Circulation indices over the Mediterranean and Europe and their relationship with rainfall conditions across the Mediterranean. Theor. Appl. Climatol. 1996, 54, 125–138. [Google Scholar] [CrossRef]
  58. Maheras, P.; Xoplaki, E.; Kutiel, H. Wet and dry monthly anomalies across the Mediterranean basin and their relationship with circulation 1860–1990. Theor. Appl. Climatol. 1999, 64, 189–199. [Google Scholar] [CrossRef]
  59. Supic, N.; Grbec, B.; Vilibic, I.; Ivancic, I. Long-term changes in hydrographic conditions in northern Adriatic and its relationship to hydrological and atmospheric processes. Ann. Geophys. 2004, 22, 733–745. [Google Scholar] [CrossRef] [Green Version]
  60. Climate Research Unit. Available online: http://www.cru.uea.ac.uk/cru/data/moi/ (accessed on 2 July 2020).
  61. Brunetti, M.; Maugeri, M.; Nanni, T. Atmospheric circulation and precipitation in Italy for the last 50 years. Int. J. Climatol. 2002, 22, 1455–1471. [Google Scholar] [CrossRef]
  62. Trigo, I.F.; Bigg, G.R.; Davies, T.D. Climatology of cyclogenesis mechanisms in the Mediterranean. Mon. Weather Rev. 2002, 130, 549–569. [Google Scholar] [CrossRef]
Figure 1. (a) Map of the Mediterranean Sea with the main basins and sub-basins. Symbols indicate the locations selected for measuring pressure differences in the station-based Mediterranean Oscillation (MO) indices (a triangle for Algiers–Cairo, a square for Gibraltar–Israel, a circle for France–Levantine and a diamond for Marseille–Jerusalem); (b) Sketch of the Mediterranean thermohaline circulation.
Applsci 10 05790 g001
Figure 2. Composites of sea level pressure anomalies (mbar) in the period 1948–2008. Panel (a) reflects the positive phase (higher quartile) and panel (b) the negative phase (lower quartile) of the NAO.
Applsci 10 05790 g002
Figure 3. Composites of sea level pressure anomalies (mbar) in the period 1948–2008. Panel (a) reflects the positive phase (higher quartile) and panel (b) the negative phase (lower quartile) of the EA.
Applsci 10 05790 g003
Figure 4. Composites of sea level pressure anomalies (mbar) in the period 1948–2008. Panel (a) reflects the positive phase (higher quartile) and panel (b) the negative phase (lower quartile) of the EA–WR.
Applsci 10 05790 g004
Figure 5. Composites of sea level pressure anomalies (mbar) in the period 1948–2008. Panel (a) reflects the positive phase (higher quartile) and panel (b) the negative phase (lower quartile) of the MO.
Applsci 10 05790 g005
Figure 6. Time series of the yearly (dashed lines) and decadal (5-year running means, solid lines) variability of the main climatic indices over the Mediterranean region. Notice that the interannual variability is of more interest than the value itself.
Applsci 10 05790 g006

