Abstract
To shorten the measurement period and reduce experiment costs, we investigated the parameter conversion between the experiment results of the controlled pass-by (CPB) method and alternative close proximity (A-CPX) method for automotive applications. The CPB and A-CPX methods were used to experiment with tire noise. The correlation between the tire noises of the two experimental methods was analyzed. Then, the quantitative transformation relationship between the tire noises of the two methods was obtained using an acoustic radiation propagation experiment in the semi-free field. The results indicate a good linear correlation between the experimental results of the two experimental methods. In the case of ignoring the shielding effect of the car body, the average difference between the measured value of the CPB method and the predicted value of the experimental tire is about 1.1 dB. When considering the shielding effect of the car body, the average difference between the measured value of the CPB method and the predicted value of the experimental tire is about 2.7 dB.
1. Introduction
The rapid growth in the number of motor vehicles has increasingly worsened road traffic noise pollution, which seriously threatens people’s everyday lives and physical and mental health. When a vehicle is driving on the road, the traffic noise caused by the vehicle is mainly composed of engine noise and tire noise. The contribution rate of tire noise is high when the vehicle is running at a constant speed of 50 km/h, reaching 86–100%, indicating tire noise is the main noise source [1]. Therefore, reducing tire noise is important for reducing the overall noise of the vehicle and controlling noise pollution [2].
Tire noise experiments are important for developing a low-noise tire. According to the experiment environment, the existing tire noise experiment methods can be divided into roadside, on-board, and laboratory experiments. The representative roadside experiments are coast-by (CB), statistical pass-by (SPB), and controlled pass-by (CPB). The on-board experiment mainly includes on-board sound pressure (OBSP), trailer coast-by (TCB), close proximity trailer (CPX), and on-board sound intensity (OBSI). Laboratory drum (DR) is the most widely used laboratory tire noise experiment. Each experiment method has its advantages and disadvantages. The selection of measurement method should be based on available equipment, measurement objectives, and experiment environment [2].
The research on the relationship between different tire noise measurement methods can be traced back to the 1970s. The research is mainly divided into that conducted within the same category and different categories of measurement methods. Generally, the measurement methods in the same category have a stronger correlation than those in different categories [2].
Donavan [3] conducted OBSI and CPB tests on seven kinds of tires on dense-graded asphalt concrete (DGAC) road and identified the relationship between the test results of the two methods. The test results showed that the spectral correlation between the two methods is very good. Bolton et al. [4] analyzed the tire noise results of 14 test tracks on International Organization for Standardization (ISO) 10844 porous asphalt concrete (AC) and the Society for Automotive Engineering (SAE) J1470 asphalt. The results showed that the test results of OBSI and PBN are linearly related, and the wind noise affects the test of the trailing edge. Donavan [5] analyzed the OBSI and PBN test results of five tires on ISO 10844 and SAE J1470 asphalt road, and the results showed that the tire noise on SAE road was 2 dB higher than that on ISO road. Donavan et al. [6] evaluated the contribution of tire/road noise to other noise sources of vehicles at a constant speed or acceleration by establishing the relationship between the on-board sound intensity measured near the tire and the sound pressure level measured by a 7.5 m externally fixed microphone. McNerney et al. [7] set the microphone at the 135° and 180° positions to the driving direction. The correlation coefficient between the microphone at 135° and the OBSP and the PBN was 0.52, that between the microphone at 180° and the OBSP and the PBN was 0.58, and that between the two microphones was 0.93.
Donavan and Rymer [8] adjusted the probe location height to 75 mm and explored the linear relationship between the OBSI and PBN test results for the standard Goodyear Aquatred 3 P205/70R15 test tire at the standard 97 km/h (60 mph) test speed on AC highway pavement. Then, the correlation between the test results of the two test methods on six AC and six polymer cement concrete (PCC) pavements were analyzed. Chuang et al. [1] set the microphone at 90° to the driving direction in the OBSP test. The correlation between the OBSP method and PBN tire noise was found to be 0.99 when the vehicle speed was 40, 60, and 80 km/h. Donavan and Lodico [9] studied the relationship between the CPX method and the OBSI method in the same category, and the CPB method and the OBSI method in different categories, and the correlation coefficients were 0.93 and 0.79, respectively. Rasmussen and Sohaney [10] compared the OBSI and SPBI sound levels of 15.24 × 1.524 m (50 × 5 ft) microphone positions at 97 km/h (60mph). The results showed that the sound level of SPBI was 28.2 dB (A) lower than that of OBSI. Shi [11] conducted a large number of experimental comparisons on each tire noise measurement method and fully analyzed the relationship between different measurement methods using material analogy, force analogy, and acoustic analogy. Bravo et al. [12,13] used analysis and experiments to identify the driving factors of the maximum noise level (MNL). They also built a vehicle test system to collect the near-field sound level contribution of a single vehicle. The relationship between the near-field measurement level and the level extrapolated to the receiver position was discussed. Świeczko-Żurek et al. [14] used the CPX and DR methods when they used similar or identical surfaces. The results showed that the difference between the A-weighted sound level measured by the DR method and that measured by the CPX method is no more than ±1 dB as long as the drum of the drum device is covered with a simulated road surface similar to the real road surface. The tire grades of the two test methods usually remain the same and the spectrum also shows good similarity, but the level of some frequencies may differ by 4 dB. Tonin and Saurer [15] analyzed the correlation between the measurement of CPX and OBSI on the whole sound level and the one-third octave spectrum at a speed of 60–110 km/h on various concrete and asphalt wear-resistant pavements. After considering the average correction factor between the two, they concluded that the difference between them was minimal. Khan and Biligiri [16] used SPB and CPX methods to explore and analyze the acoustic characteristics of asphalt concrete and cement concrete surface types. The test showed that the noise generated by the cement concrete surface is 5 dB (A) higher than that of asphalt concrete surface, and the noise difference between SPB and CPX methods is about 5 dB (A) for cement concrete road sections; for asphalt concrete pavement, the noise difference between the two methods is about 10 dB (A). Campillo-Davo et al. [17,18] defined the alternative close proximity trailer method (A-CPX) to evaluate the sound power level emitted by a specific tire/road combination and to extrapolate the sound pressure level obtained by taxiing on the roadside.
The CPB method used for measuring the maximum sound pressure level of a vehicle passing by is simple, and uses a microphone placed on the side of the road. Its disadvantages include a long experiment cycle and high experiment cost. The CPB method cannot obtain a stable and accurate noise spectrum. The alternative close proximity (A-CPX) method considers the accuracy and cost-effectiveness of the experiment. Its advantage is that it can exclude or ignore other noise components except tire noise. Through data processing, it can obtain an accurate and stable spectrum. The experiment cycle is short, and the experiment cost and the dependence on the experiment road surface form are low. If the relationship between the experiment results of these two methods can be determined [1,7], the CPB experiment results can be predicted from the A-CPX noise experiment data. This would shorten the experiment cycle and reduce the cost of tire noise experiments [2].
Based on previous research, we conducted CPB and A-CPX experiments on five mainstream passenger car tires on the market. The correlation between the noise data of the two experimental methods was analyzed. To study the parameter conversion between the experiment results of the two experiment methods, we conducted acoustic radiation propagation experiments in the half-free field.
2. Real Vehicle Experiment
2.1. Experimental Site
CPB and A-CPX were conducted on a common cement road, Dangssang Road, Gunsan, Korea. The experimental track of CPB and the A-CPX method was a straight road section at least 1.2 m away from large objects on the side of the road. Figure 1 shows the measurement location and road surface of the CPB and the A-CPX methods.
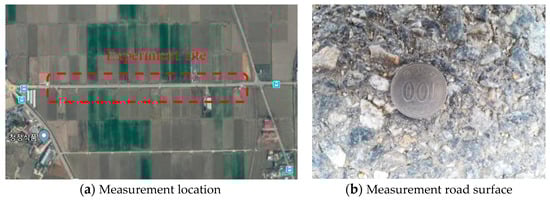
Figure 1.
Measurement location and road surface of the controlled pass-by (CPB) and the alternative close proximity (A-CPX) method.
2.2. Experimental Vehicle and Tires for CPB and A-CPX Methods
To ensure that the tire/road surface noise was not affected by the structure of the experimental vehicle, the vehicle was cleaned before the experiment to ensure that it was free of soil and pollutants, and the sound-absorbing materials inadvertently added in the experimental phase were removed.
The experimental vehicle was a Korando sports (SsangYong Company, Pyeongtaekho, Korea). The wheelbase of the vehicle was 3060 mm. The rim width code was 8.5J × 18 and the tire specification was 235/60R18. The parameters of the tires selected for the experiment are shown in Table 1. The reference inflation pressure of the experimental tire was 250 kPa.

Table 1.
Parameters of experimental tires.
2.3. Experimental Equipment
In the CPB experiment, the noise measuring equipment was NL 42 (RION, Tokyo, Japan), a common sound level meter. The vehicle speed was measured using VELOCITY (Bushnell, Overland Park, KS, USA) multi-functional handheld radar speedometer. The track temperature was measured using a 561 (FLUKE, Everett, WA, USA). Wind speed was measured using an AVM-01/03 anemometer (TES, Taiwan, China). Tire inflation pressure was measured using an H.S-NO.90 needle inflator gage (HYUP SUNG PRECISION Company, Incheon, Korea).
In the A-CPX experiment, vehicle speed and track temperature were measured with the same equipment as in the CPB method. Tire inflation and pressure measurements used an automatic E21 inflation and deflator (MAX, Seoul, Korea). The specific parameters of sound measurement devices are listed in Table 2.
Table 2.
Parameters of sound measurement devices of A-CPX method.
2.4. Experimental Conditions
The average tire load used in the CPB and A-CPX experiment was 55% (467.5 kg) of the reference load, which met the requirement for the experimental load of each tire being in the range of 50–90% of the reference load. The average inflation pressure of the tire was 55% (190 kPa), which was no higher than the reference inflation pressure. The background noise was less than the experimental noise, at 10 dB. The wind speed was lower than the required 5 m/s. The atmospheric temperature met the required range of 5–40 °C, and the surface temperature met the required range of 5–50 °C. The background noise and meteorological conditions met the experimental requirements.
2.5. Experimental Procedure
Before the experiment, we closed the trunk lid, skylight, all windows, and ventilation devices for air intake and exhaust. There were no other sundries in the vehicle except for the experimental personnel and equipment. Before the series of experimental runs, the vehicle was driven for 15 min to warm up the tires. During each experiment, the driving direction of the vehicle was consistent and the experimental section was fixed to maintain the reliability of the experiment [19].
During the CPB experiment, when the front end of the vehicle reached the starting line of the experimental area, the experimental vehicle, which was equipped with the experimental tire, passed the specified experimental area at the specified experimental speed at a constant speed with the engine on. The test distance was about 50 m. Two sound level meters were placed on both sides of the track 7.5 m from the track centerline and 1.2 m above the ground. During the experiment, the sound level meter recorded the maximum sound pressure level of the A-weighted noise as a single measurement result. Experiments were conducted four times at a speed lower and higher than the reference speed of 80 km/h.
During the A-CPX experiment, to conveniently, quickly, and safely complete the tire/road noise experiment, a bracket for mounting the microphone acoustic probe was installed on the spindle of the right rear wheel. The position of the microphone in the A-CPX method refers to the position of the microphone in the American Standard OBSI test program [20]. The acoustic probe was positioned 90 mm above the road surface and 150 mm away from the tire sidewall, 100 mm behind the centerline of the tire [21]. The bracket for holding the acoustic probe was constructed so that the sound pressure could be measured close to the trailing edges of the tire/pavement contact patch. Probe location and equipment configuration of the A-CPX is shown in Figure 2. The test distance was about 250 m. The vehicle traveled the experimental section at a uniform speed under the experimental conditions with the engine on. The experiment was conducted three times under the same working conditions. The equivalent sound pressure levels of the two microphones were recorded, and the average value was taken as a single experimental result.
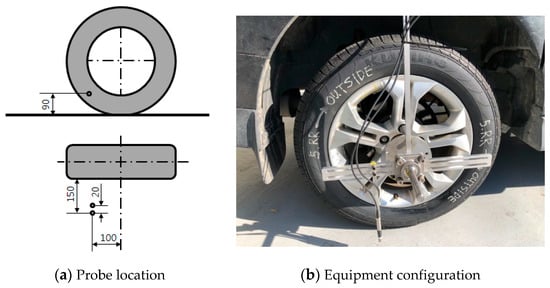
Figure 2.
Probe location and equipment configuration of the A-CPX method.
3. Results and Correlation Analysis
The tire noises recorded between CPB and the A-CPX method after linear regression correction are compared in Table 3. We found that the tire/pavement noise recorded by the A-CPX method on the cement road was about 32 dB higher than that of the CPB (Table 3). However, the ranking of the tire assigned by the two experimental methods was the same.
Table 3.
Comparison of tire noise between CPB and A-CPX methods.
To study the feasibility of using the A-CPX experiment results to predict the CPB tire noise value, we first examined the correlation between the experimental results of the two methods. The correlation coefficient between the noise experiment results of CPB and A-CPX is shown in Figure 3, which was 0.973. Therefore, the noise experiment results of the CPB method can be predicted using the noise experiment results obtained using the A-CPX method.
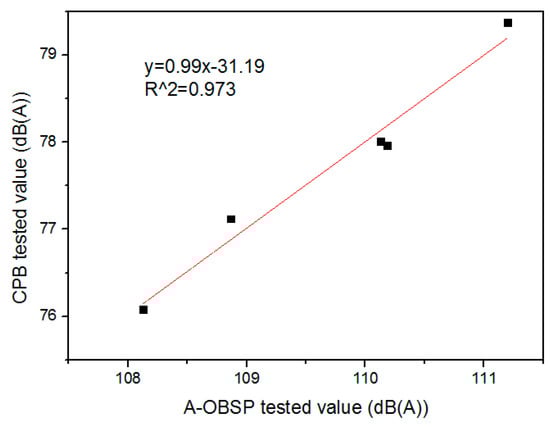
Figure 3.
Tire noise correlation of CPB and A-CPX methods.
4. Analysis of Parameter Conversion Relationship between the Noise Experiment Results of CPB and A-CPX
The CPB method is used to determine four tires’ pass-by noise in a semi-free field. The A-CPX method is used to determine the noise of a single tire. To determine the quantitative relationship between the two methods, the attenuation relationship in the propagation path must be determined, including the attenuation of the sound pressure level at each frequency and the correction of the number of sound sources and other factors [22].
Because the A-CPX method is a near-field experiment and the CPB method is a far-field experiment, the process of predicting far-field noise from near-field noise is essentially an extrapolation process [12]. The physical configuration of near-field noise extrapolated to far-field noise is shown in Figure 4 [12]. To discuss the transmission relationship between near-field noise and far-field noise and to simplify the theoretical derivation of the extrapolation process, we assumed that the statistical characteristics of the four tires’ sources were consistent and all of them were incoherent noise. We also assumed that the contributions of the front and rear tires of the vehicle to the far-field sound pressure measurement were the same.
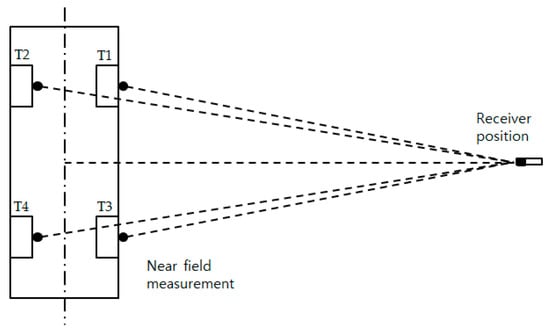
Figure 4.
The physical configuration for the extrapolation of signals acquired by the proximity of the tire signals.
4.1. Theoretical Derivation of the Propagation Relationship between Near-Field and Far-Field Noise
We assumed that tire noise is a spherical wave. The expression of spherical wave attenuation with distance at normal temperature is:
where SPLCPBi is the far-field noise of the i-th tire measured by the CPB method (dB); SPLCPXi is the near-field noise of the i-th tire measured by the A-CPX method (dB); ri is the distance from the near-field microphone to the far-field microphone (m), where i = 1,2,3,4; and k is the correction factor. In free space, k = 11; in semi-free space, k = 8.
When the distances between the near-field and far-field microphones are r1 and r2, the far-field tire noise measured by the CPB method can be expressed as follows:
The difference in the sound pressure level between them can be expressed as follows:
Ignoring the shielding effect of the vehicle body on tire noise, the above equation is used to calculate the sound attenuation values in the sound propagation path from the near-field microphone to the far-field microphone corresponding to the four tires. The theoretical value of far-field tire noise can be obtained by removing the sound attenuation value in the propagation path from the value of near-field tire noise.
Since the distance between the near-field and the far-field microphones of T1 and T3, and T2 and T4 tires is the same, the theoretically calculated noise attenuation values in the propagation path are the same. The total noise prediction value at the far-field measurement point can be calculated using the four tires’ noises using the superposition equation. The noise superposition equation can be expressed as:
where SPLCPB is the far-field noise of four tires measured by the CPB method (dB).
The difference between the predicted noise and the measured noise at the far-field experiment point of five tread patterns is shown in Table 4. Table 4 shows that although assumptions were made in theoretical analysis, the difference between the measured value and the theoretically predicted value was still large. The average difference was about 6.56 dB. Therefore, it is not advisable to theoretically deduce the quantitative relationship between the noise experiment results of the two methods.
Table 4.
Prediction value and difference value between predicted value and experimental value at far field measurement point.
4.2. Tire Noise Radiation Experiment in the Semi-Free Field
According to the same assumption above, the relationship between the noise experiment results of the two methods was determined using tire noise lateral transfer experiments in the semi-free field. The layout of the measuring points in the experimental sound field is shown in Figure 5 [22]. The layout of measuring points in both the A-CPX and CPB methods was considered [22]: S1 was the corresponding measuring point for A-CPX and S2 was the corresponding point for CPB.
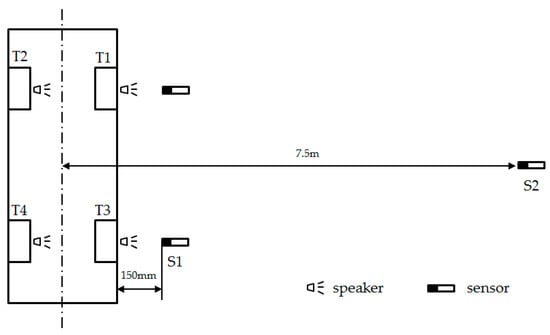
Figure 5.
Tire noise radiation experiment in the semi-free field.
On the side of the tire facing the microphone, a speaker similar in size to that of the tire contact area was used as the noise source of the tire noise. The noise signal from the speaker was white noise. Although the spectral characteristics of the white noise and the actual tire noise source were different, for the S2 measurement point for the same frequency, the propagation and attenuation laws of the sound waves emitted by the actual tire noise source and the white noise source used in this experiment were consistent [22].
During the experiment, the loudspeakers were first placed in the two preset sound source positions (T1 and T3) sequentially to conduct a noise experiment to study the tire noise sound field propagation relationship between the semi-free field measurement points S1 and S2 when the sound source was emitted at T1 and T3. Figure 6 shows the experiment curve of the one-third octave sound pressure level difference between the two measurement points for this case.
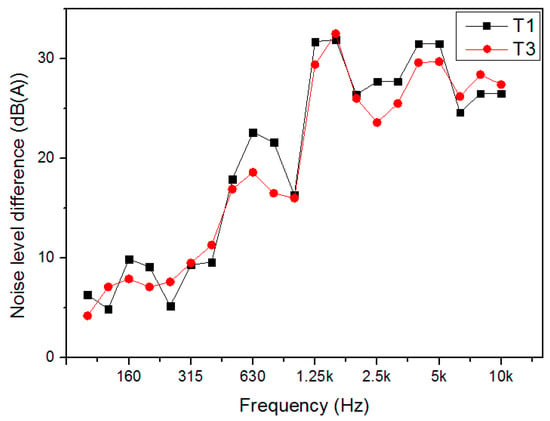
Figure 6.
Difference of sound pressure levels between S1 and S2 experiment points.
Theoretically, the sound propagation attenuation curves at T1 and T3 should be completely consistent. Figure 6 shows that the two actual semi-free field sound propagation experiment curves were not the same. The reason for this may be that the white noise signal of the sound source was a real-time limited time signal and the spectrum of this white noise signal was not completely consistent originally [22].
4.3. Parameter Conversion of Noise Experiment Results between CPB and A-CPX
4.3.1. Ignoring the Shielding Effect of the Vehicle Body on Noise Propagation
Taking the two different curves in Figure 6 as the correction basis (∆L), by subtracting the correction difference of the corresponding frequency from SPLCPX1 and SPLCPX3 the noise spectrum prediction values SPLCPB1 and SPLCPB3, respectively, were obtained.
In the above, we assumed that the statistical characteristics of the sound sources of the four tires of the entire vehicle were the same if ignoring the shielding effect of the vehicle body on noise propagation. Then, the noise values for the left and right tire noises transmitted to the S2 measurement point would be the same. The noise spectrum prediction values SPLCPB2 and SPLCPB4 for the T2 and T4 tire at the S2 measuring point can be expressed as follows:
By using Equations (8) and (9), the noise prediction values of each tire at the S2 measuring point were obtained by subtracting the sound attenuation values in the propagation path from the measured near-field noise values corresponding to the four tires. The spectrum distribution of the total tire noise prediction value was obtained by superposing the tire noise prediction values at the S2 measuring point according to the same frequency. Then, the total tire noise prediction value at the S2 experiment point was obtained using the noise superposition equation. The difference between the measured and predicted values of far-field tire noise is shown in Table 5 when the shielding effect of the vehicle body on tire noise propagation is ignored.
Table 5.
Difference between the measured value and the predicted value of CPB tire noise when ignoring the shielding effect of the vehicle body on noise propagation.
From the difference between the measured value and the predicted value of the far-field tire noise in Table 5, we found that the difference between the measured and the predicted values was slightly different according to the different tire pattern, and the average difference was about 1.1 dB.
4.3.2. Considering the Shielding Effect of the Vehicle Body on Noise Propagation
Considering the blocking effect of the vehicle body during the experiment, the speakers were placed in the preset sound source positions (T1, T2, T3, and T4) in order, and the noise experiments were performed sequentially to analyze the tire noise sound field propagation relationship between the measured points S1 and S2 in the semi-free field. According to the S2 experiment point data when the sound sources on the left and right sides of the vehicle produced sound separately, the ratio of the radiating sound energy of the left sound source to the right sound source at S2 was found. By multiplying the predicted value of the sound energy radiated to the S2 measuring point at T1 and T3 by the ratio, the predicted value of sound energy radiated to the S2 measuring point at T2 and T4 was obtained. During the experiment, we ensured the consistency of the sound power of the power amplifier and made the speaker sound for a long time to ensure that the sound source signals of the four positions were as consistent as possible.
We can suppose that the total energy of the sound source at T1 and T2 is E. The sound energy radiated by the sound source at T1 and T2 to the S2 measurement point is ET1 = αE and ET2 = βE, where α is the propagation coefficient of the sound energy at the T1 position radiating sound energy to S2 and β is the propagation coefficient of the sound energy at the T2 position radiating sound energy to S2. ET1 and ET2 can also be expressed as follows [22]:
where PCPB1 is the sound pressure measured at S2 when the loudspeaker is placed at T1 to make sound alone (dB), PCPB2 is the sound pressure measured at S2 when the loudspeaker is placed at T2 to make sound alone (dB), and Pe is the effective value of sound pressure, Pe = 2 × 10⁻⁵ Pa. SPLT1 and SPLT2 are the noise values measured at the S2 measurement points when the speakers were placed at T1 and T2 to make sounds individually.
Dividing Equation (11) by Equation (10) and substituting the experimentally obtained values of SPLT1 and SPLT2, the propagation coefficients ratio β/α at different frequencies was obtained. Similarly, by placing sound sources at T3 and T4 positions individually, the propagation coefficient ratio (β1/α1) of the T3 and T4 sound sources radiating sound energy to S2 was obtained (where α1 and β1 are the propagation coefficients of T3 and T4 sound sources radiating sound energy to S2, respectively).
Table 6 shows the ratios of the sound energy propagation coefficients β⁄α and β1⁄α1 at each frequency. With these ratios, the sound pressure levels SPLCPB2 and SPLCPB4 at the S2 measurement point were predicted using the noise values SPLCPX1 and SPLCPX3 measured at the S1 measurement point as follows:
Table 6.
Transmission coefficient ratios at different frequencies.
Equations (14) and (15) were used to obtain the predicted tire noise values at the far-field S2 measuring point. The predicted tire noise values at the S2 measuring point were superposed at the same frequency to obtain the spectral distribution of the predicted total tire noise values. Then, the prediction value of the total tire noise pressure level at the S2 measuring point was calculated using the noise superposition equation. When considering the shielding effect of the vehicle body on tire noise propagation, the difference between the measured and predicted values of tire noise using CPB is shown in Table 7.
Table 7.
The difference value between the measured value and the predicted value of CPB tire noise when considering the shielding effect of the vehicle body on noise propagation.
Table 7 shows that when considering the shielding effect of the vehicle body on noise propagation, the average difference value was 2.7 dB. Comparing Table 5 and Table 7, we inferred that when considering the shielding effect of the vehicle body, the difference between the measured value and the predicted value using CPB is larger than when the shielding effect of the vehicle body is ignored.
5. Conclusions
In this study, we constructed a new method called the alternative close proximity (A-CPX) method. This method was designed to evaluate the far-field sound pressure level emitted by a rolling tire mounted on a car at a constant speed through near-field sound pressure level measurement. The test results showed that the order of the tire noise obtained by the two test methods is consistent, and the tire noise obtained by the two test methods has a strong linear correlation. Theoretical research showed that the analysis method based on the propagation relationship between near-field and far-field noise is not feasible, and the average deviation between the theoretically predicted value and the measured value of far-field tire noise is large. Using the white noise sound signal as the noise source, the semi-free field noise propagation rule test obtained the correction value of the test results between the two test methods. When considering the occlusion effect of the vehicle body, two parameter conversion relationships of the measurement results between test methods were identified. The results showed that the deviation between the predicted value and the measured value of the far-field tire noise is very small, verifying the technical feasibility of the method.
Since the experimental tire has only four all-season tires and one ordinary tire, and the test road is an ordinary cement road, the experiment has certain limitations. To further verify the experimental results, more types of tires and roads need to be tested in the future.
Author Contributions
Design experiment and conceptualization, B.S.K. and H.J.; methodology and performed experiments, B.S.K., H.J., and M.Z.; investigation and editing, H.J. and B.S.K.; writing paper H.J. All authors have read and agreed to the published version of the manuscript.
Funding
This research received no external funding.
Acknowledgments
This paper was supported by WonkWang University in 2020.
Conflicts of Interest
The authors declare no conflict of interest.
References
- Chuang, J.S.C.; Lin, H.-H.; Chen, Y.-Y.; Su, T.-K. Study of Tire Noise for Vehicle Noise Control. In Proceedings of the SAE 2005 Noise and Vibration Conference and Exhibition, Traverse City, MI, USA, 16–19 May 2005. [Google Scholar] [CrossRef]
- Li, T. A state-of-the-art review of measurement techniques on tire-pavement interaction noise. Measurement 2018, 128, 325–351. [Google Scholar] [CrossRef]
- Donavan, P.R. Tire-Pavement Interaction Noise Measurement Under Vehicle Operating Conditions of Cruise and Acceleration. SAE Technical Paper 931276. 1993. Available online: https://doi.org/10.4271/931276 (accessed on 15 August 2020).
- Bolton, J.S.; Hall, H.R.; Schumacher, R.F.; Stott, J. Correlation of Tire Intensity Levels and Passby Sound Pressure Levels. SAE Technical Paper 951355. 1993. Available online: https://doi.org/10.4271/951355 (accessed on 15 August 2020).
- Donavan, P.R. An Assessment of theTire Noise Generation and Sound Propagation Characteristics of an IS0 10844 Road Surface. SAE Technical Paper 971990. 1993. Available online: https://doi.org/10.4271/971990 (accessed on 15 August 2020).
- Donavan, P.R.; Schumacher, R.F.; Stott, J.R. Assessment of Tire~avement Interaction Noise under Vehicle Passby Test Conditions Using Sound Intensity Measurement Methods. J. Acoust. Soc. Am. 1998, 103, 1497–1498. [Google Scholar] [CrossRef]
- McNerney, M.T.; Landsberger, B.J.; Turen, T.; Pandelides, A. Comparative Field Measurements of Tire Pavement Noise of Selected Texas Pavements; Report No. 7-2957-2; Center for Transportation Research, the University of Texas at Austin: Austin, TX, USA, 2000. [Google Scholar]
- Donavan, P.R.; Rymer, B. Assessment of Highway Pavements for Tire/Road Noise Generation. SAE Technical Paper 2003-01-1536. 2003. Available online: https://doi.org/10.4271/2003-01-1536 (accessed on 15 August 2020).
- Donavan, P.R.; Lodico, D.M. Measuring Tire-Pavement Noise at the Source; NCHRP Report 630; NCHRP: Washington, DC, USA, 2009. [Google Scholar]
- Rasmussen, R.O.; Sohaney, R.C. Tire Pavement and Environmental Traffic Noise Research Study; Report No. CDOT-2012-5; Colorado Department of Transportation Dtd Applied Research and Innovation Branch: Austin, TX, USA, 2012. [Google Scholar]
- Zuoteng, S. The relationship between different measurement methods of testing tire noise. J. Acoust. Soc. Am. 2012, 131, 3298. [Google Scholar] [CrossRef]
- Bravo, T.; Ibarra, D.; Cobo, P. Extrapolation of maximum noise levels from near-field measurements to far-field positions. In Proceedings of the Internoise 2012/ASME NCAD Meeting, New York, NY, USA, 19–22 August 2012; pp. 169–180. [Google Scholar] [CrossRef]
- Bravo, T.; Ibarra, D.; Cobo, P. Far-field extrapolation of Maximum Noise Levels produced by individual vehicles. Appl. Acoust. 2013, 74, 1463–1472. [Google Scholar] [CrossRef]
- Świeczko-żurek, B.; Ejsmont, J.; Ronowski, G.; Taryma, S. Comparison of road and laboratory measurements of tyre/road noise. In Proceedings of the Internoise, Melbourne, Australia, 16–19 November 2014. [Google Scholar]
- Tonin, R.; Saurer, T. Comparison of CPX and OBSI noise measurements for different road surfaces. In Proceedings of the Internoise, Hong Kong, China, 27–30 August 2017. [Google Scholar]
- Khan, V.; Biligiri, K.P. Evolution of tyre/road noise research in India: Investigations using statistical pass-by method and noise trailer. Int. J. Pavement Res. Technol. 2018, 11, 253–264. [Google Scholar] [CrossRef]
- Campillo-Davo, N.; Peral-Orts, R.; Campello-Vicente, H.; Velasco-Sanchez, E. An alternative close-proximity test to evaluate sound power level emitted by a rolling tyre. Appl. Acoust. 2019, 143, 7–18. [Google Scholar] [CrossRef]
- Campillo-Davo, N.; Peral-Orts, R.; Campello-Vicente, H.; Velasco-Sanchez, E. A methodology for the extrapolation of coast-by noise of tyres from sound power level measurements. Appl. Acoust. 2020, 159, 107077. [Google Scholar] [CrossRef]
- Yuan, Y. The Sound Intensity (OBSI) Tire/road Noise Test. Mod. Transp. Technol. 2011, 8, 80–82. [Google Scholar]
- AASHTO. Standard Method of Test for Measurement of Tire/Pavement Noise Using the On-Board Sound Intensity OBSI Method; TP 76; AASHTO: Washington, DC, USA, 2013; Available online: https://standards.globalspec.com/std/9945275/AASHTO%20TP%2076 (accessed on 14 August 2020).
- Ji, H.J.; Kim, B.S.; Wang, C.Y. Tire Noise Analysis due to On-Board Sound Intensity Test Method. J. Korean Soc. Mech. Technol. 2019, 21, 69–75. [Google Scholar] [CrossRef]
- Lu, Y.; Ge, J.; Shi, Z.; Chen, Z. Parameters Transformation of Two Tire Noise Measurement Methods. China J. Highw. Transp. 2014, 27, 115–120. [Google Scholar]
© 2020 by the authors. Licensee MDPI, Basel, Switzerland. This article is an open access article distributed under the terms and conditions of the Creative Commons Attribution (CC BY) license (http://creativecommons.org/licenses/by/4.0/).