Abstract
The integration of large-scale wind farms and large-scale charging stations for electric vehicles (EVs) into electricity grids necessitates energy storage support for both technologies. Matching the variability of the energy generation of wind farms with the demand variability of the EVs could potentially minimize the size and need for expensive energy storage technologies required to stabilize the grid. This paper investigates the feasibility of using the wind as a direct energy source to power EV charging stations. An interval-based approach corresponding to the time slot taken for EV charging is introduced for wind energy conversion and analyzed using different constraints and criteria, including the wind speed averaging time interval, various turbines manufacturers, and standard high-resolution wind speed datasets. A quasi-continuous wind turbine’s output energy is performed using a piecewise recursive approach to measure the EV charging effectiveness. Wind turbine analysis using two years of wind speed data shows that the application of direct wind-to-EV is able to provide sufficient constant power to supply the large-scale charging stations. The results presented in this paper confirm that the potential of direct powering of EV charging stations by wind has merits and that research in this direction is worth pursuing.
1. Introduction
The rapid adoption of electric vehicles (EVs) is making significant progress in addressing the continuous increase of greenhouse gas (GHG) emissions worldwide [1,2]. However, with this considerable progress come enormous challenges. Charging infrastructure is expected to increase with the increasing number of EVs, resulting in huge electricity demand. Moreover, power quality issues related to grid connections and integration with these newly added nonlinear loads and high-frequency switching converters are expected to arise [3,4]. Hence, the demand for different types of renewable-energy-based EV charging stations is growing in many countries [5].
Although the currently implemented EV charging stations are mostly powered by electric power distributed by utility grids [6,7], other charging station designs powered by various renewable energy sources have been reported in the technical literature. EV charging stations powered by solar or grid electric power are reviewed in [8]. Several studies have used wind energy for EV grid-connected mode [9,10] and off-grid stations [11]. Other studies [12,13] discussed design problems and proposed optimization methodologies for the size of EV charging stations in both solar and wind microgrids, and concluded that a mix of renewable energy sources and storage systems is best for the optimal design of EV charging stations. Stand-alone solar and wind generators are not suitable sources to supply near-constant power for long periods, at least for slow power charging stations [8,11].
Fast-charging technology is key to increasing the expansion of EV adoption, because it removes one of the barriers that have stopped many consumers from purchasing their first EVs. However, establishing fast-charging points not only requires a parallel increase in the power supply from the utility companies but also induces significant adverse impacts on the grid and degrades its power quality [4,14]. Hardman et al. reviewed the consumer preferences for EV charging infrastructure, including the fast-charging technology and its impact on the electricity grid [15]. However, with this extensive review, the authors could not draw definite conclusions on several aspects, such as payment for charging, charging locations, the time at which charging occurs, and any impacts these fast charges may have on electricity grids, suggesting that further research in the field is needed. It is known that DC fast chargers are considerably more expensive than other lower rate chargers and have a very high power demand when large numbers of EVs are charged at the same time, inducing problems in the utility supply. These impacts can be seen as deviations in the power line voltage, frequency, and total harmonic distortion (THD). The use of renewable energy systems is one promising method for mitigating these impacts [11].
In previous studies, integrating energy storage (i.e., backup batteries) into the electricity grid was the easiest way to reduce the intermittency, unpredictability, and power fluctuations, therefore providing a stable and continuous renewable electricity supply [16]. An energy hub (EH) that combines different types of energy sources (e.g., wind and energy storage) requires optimal management to reduce the wind uncertainties. In this context, Najafi et al. proposed an information gap decision theory (IGDT) considering the demand response (DR) and an energy storage system (ESS) to decrease the uncertainty, hence achieving greater wind turbine generation [17]. The necessity of adding battery banks for energy storage is considered the primary drawback of stand-alone charging stations. The reason for such a drawback is the high installation and maintenance costs, the relatively short life-span when frequently charged and discharged, and the high cost of the associated energy conversion power electronics [18,19]. Several attempts to extend the life-span of lithium-ion batteries have been made in previous studies, for example by using battery degradation prediction methods for the reliable estimation of a battery’s state of health (SOH) [20,21] and optimizing charging patterns to increase the efficiency and the life-span of lithium-ion batteries [22,23,24]. A recent study [25] suggested replacing the conventional battery storage with a permanent lifetime fuel cell system as a supporting power source. However, despite the high reliability and efficiency of fuel cells, this technology is expensive, lacks distribution infrastructure, and is still in the development stage, which presently makes it an unviable solution. An alternative approach is to reduce the dependency on battery storage and rely more on the direct charging of EV using wind energy. An accurate prediction of wind power and the implementation of adaptive maximum power point tracking (MPPT) algorithms are vital parts of the successful establishment of these solutions.
In this paper, the feasibility of powering an EV charging station that incorporates fast-charging technology with wind energy generation is documented. Unlike previous studies that implemented energy system analysis using simulated hourly distributions, we use real wind speed measurements averaged on a minute basis obtained from two sites over two different years. We perform extensive data analysis and benchmark comparisons using different scenarios of possible constraints on the introduced EV charging methodology. A piecewise recursive approach is implemented to study the wind data on an interval-based manner to provide precise estimates of the wind power stability over short time intervals, as well as the EV charging station capacity. A case study using the fast-charging-supported Tesla Model 3 Standard Range Plus is discussed.
The main contributions of this work are the following: (1) we rigorously evaluate the possibility of using stand-alone wind energy sources for direct fast EV charging; (2) we conduct wind speed and power analysis using real-world high sampled datasets from two years; (3) we evaluate different wind turbines using a large library (i.e., 68 turbines) of power curves; and (4) we examine different averaging time intervals for wind speed and their effects on the power output certainty of wind turbines.
The rest of the paper is organized as follows. Section 2 presents the wind data used in this study and outlines the related data preprocessing steps. Section 3 describes the performance of different technologies for direct use of wind energy as a stand-alone source to power either large-scale or fast-charging EV stations. Section 4 reports the analysis and comparative evaluation between the introduced methods under different criteria, as well as the verification and discussion of such results. Finally, Section 5 concludes the study.
2. Wind Data and Preprocessing
We used the publicly available database obtained from the National Renewable Energy Laboratory’s National Wind Technology Center (NWTC) [26]. The NWTC is located approximately 8 km (5 miles) south of Boulder, Colorado, 36 km (20 miles) northwest of Denver (United States). We use both M2 and M4 tower datasets. The M2 tower is located at the western end, while M4 is located at the southwest corner of the NWTC grounds. The data from M4 were obtained at 20 Hz, including various atmospheric properties (i.e., wind speed, wind direction, temperature, dew point, pressure, acceleration, and precipitation) collected from different heights (3 to 134 m). On the other hand, the data from M2 were taken every two seconds and averaged over one minute. All data were measured at different heights, starting from 2 to 80 m. Finally, based on the data quality, one-year data from each tower were selected for this study from the years 2004 and 2018 for M2 and M4, respectively.
The wind speed data were preprocessed by imputing the not-a-number (NaN) and encoded values using a sliding window average. Let the wind speed data y have missing data at time t. The average of the sliding window was used for imputations, considering the location (head or tail of data) and consecutive missing values. The high-resolution (20 Hz) wind speed data were then averaged over different time intervals (i.e., one, two, and three minutes) to investigate the wind speed and power output variability. The World Meteorological Organization (WMO) standard for estimating the mean wind is the 10-min average [27]. For smaller intervals, WMO has recommended wind speed conversion gust factors for four different land classes. The recommended gust factors are higher than 1 for the averaging intervals implemented in this study. Therefore, in this paper, the average wind speed is calculated by using a simple scalar average of the wind speed observations, regardless of gust effects. Figure 1 shows the one-minute average wind speed data for both the M2 and M4 towers. It is worth noting that the wind speed data for the M4 tower have some missing observations for long periods (sometimes days at a time, as shown in Figure 1b). However, we visually inspected the data and only considered the observations with fewer missing values and less noise.
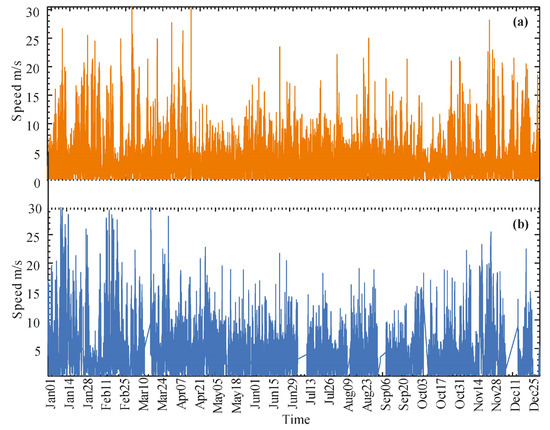
Figure 1.
Example of one minute of wind speed data: (a) M2 tower; (b) M4 tower.
3. Methodology
There are two ways to utilize wind energy to charge EVs as a source. The first one is via the electricity grids, where energy storage is required for both wind and the grid. The second could potentially be an off-grid solution to avoid expensive energy storage equipment, power conversion equipment, and conversion stages, because a direct current (DC) bus system can be used in the second case.
Figure 2 shows the general procedure of an isolated wind energy, direct EV fast-charging system. The system objective is to perform power analyses of different wind turbines to investigate their ability to provide a near-constant power supply over specific time intervals. As shown in Figure 2, the wind speed data were first extrapolated to match the hub height of the selected wind turbine. The output power of the wind turbine was then calculated over overlapping time intervals. The time interval corresponds to the charging time of the EV battery (e.g., from 20% to 80% state-of-charge (SoC)) with a fast charging capability. The interval-based output power converted from the entire wind speed data was then analyzed to satisfy the near-constant power criteria. The power intervals were then used to calculate the daily energy output of the wind turbine. Using the output energy and the EV charging point characteristics, the number of EVs that could be directly fast-charged was calculated.
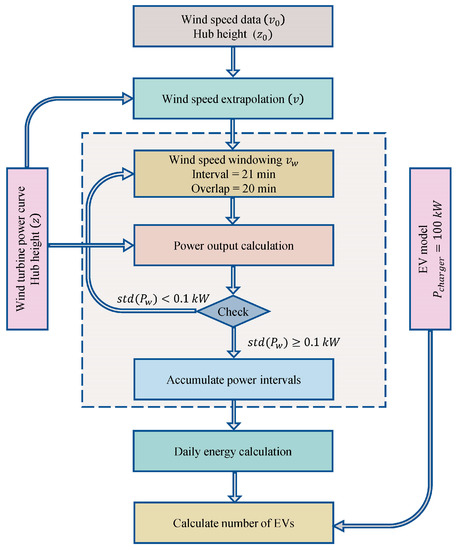
Figure 2.
Schematic view of the data analysis procedure for off-grid wind-to-EV charging stations, where std is the sample standard deviation, Pcharger is the charging point avg power, Pw is the instantaneous output power of a wind turbine.
3.1. Wind Turbine Selection
We used an open source database available online from the Open Energy Platform (OEP) [28] for a library of 68 turbines from the leading turbine manufacturers. The data constitute nominal power, rotor diameter, swept area, and power curve values (i.e., wind speed vs. output power). Figure 3 shows the power curves of all turbines with diverse nominal power, cut-in, and cut-out values. The International Electrotechnical Commission (IEC) [29] has widely established accepted standards for wind turbines, including the determination of the measured power curves. Commonly, the power curve of the wind turbine is represented using the average wind speed with intervals of 0.5 m/s [30]. In this study, the wind speed intervals (bins) of all wind turbine power curves were limited to 0.5 m/s. To select the turbines that show minimal variations in output power within a specific time interval (e.g., 21 min), we conducted statistical analysis on the annual wind speed data. For each time interval window, the output power was constrained to have a standard deviation of less than 0.1 kW. The wind turbine with the highest total annual time intervals with constant power was selected for the analysis in this study. The equations involved in this calculation are detailed in the following subsection.
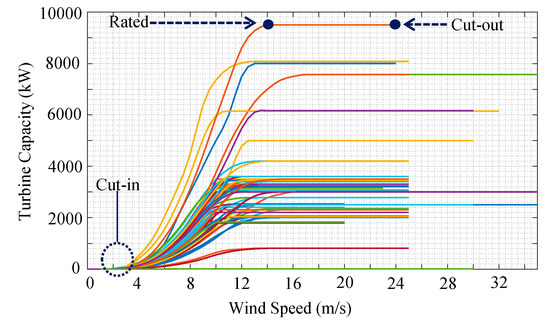
Figure 3.
Power curves of 68 wind turbines with different capacities (10 to 9500 kW).
3.2. Wind Energy Calculation
The 68 utilized wind turbines operate at different hub heights. The wind speed data for these hub heights are mostly not available. The wind speed observations of the hub heights 20 m and 26 m above ground for M2 and M4, respectively, were selected for wind turbine power analysis. The power law wind profile (Hellmann exponential law) was used to extrapolate the wind speed observations to higher hub heights, which is expressed by:
where v is the wind speed at height, z, v0 is the measured speed, height z0 is known, and is the power law exponent (shear exponent or Hellman exponent) describing the terrain topology, varying with atmosphere stability (temperature changes), which is commonly set to 1/7 or 0.143 for open land [31]. However, in this study the exponent parameter was of less concern than the stability of the wind speed itself for charging EVs. Therefore, was chosen for this assessment. The instantaneous output power of a wind turbine as a function of the wind speed at a turbine hub height , given the power curve , is described by:
where , , and are, respectively, the cut-in, cut-out, and nominal (rated) speed of the wind turbine (see Figure 3). represents the turbine output power at rated wind speed . However, the actual wind power output is usually more than the theoretically calculated power, as in Equation (2), which may produce an estimation error of about 3%. This is because the gained momentum by the rotating turbine blades sustains the continual rotation when a sudden decrease in wind speed occurs with no major change in the angular wind direction [32]. The output power quantifies the variable turbine power at each time point (in minutes). However, the charging time of each EV battery depends on the stability of the supplied power, the battery capacity , the battery SoC, and the charging point specifications. In order for the EV battery to be fully charged, the charging time can be obtained according to [13] by:
Fast charging is a technology that allows higher currents to be delivered to the battery before it reaches its peak voltage (usually 80% SoC). Each EV model has its predefined parameters, such as and for different capacities. In this study, we assumed that the value is known for carrying out the wind power analysis. Due to the intermittency of wind energy over time, the isolated EV charging station was restricted to the stability of the supplied piecewise energy. As shown in Figure 2 and described in Algorithm 1, the wind energy fed to the EV station is subject to several constraints, as detailed in the rest of this subsection.
The instantaneous power contained in each interval must ensure the stability of the power supply to EVs with minimum variability, i.e., the standard deviation must not exceed 0.1 kW. The interval-based average output power is selected such that
| Algorithm 1: EV wind power supply | ||
| Inputs: | , | The instantaneous wind power; |
| , | EV battery time to charge; | |
| , | Overlap time of intervals; | |
| EV charger power; | ||
| Output: | Constant supplied energy; | |
| , | Number of EVs | |
| /* Calculate the number of overlap intervals */ | ||
| 1: | ||
| 2: for to step do | ||
| 3: | ||
| 4: | ||
| /* Check the stability of wind power*/ | ||
| 5: if std 0.1 or std0.1 then | ||
| 6: Continue | ||
| 7: end if | ||
| /* Find non-overlap intervals*/ | ||
| 8: if then | ||
| 9: | ||
| 10: end if | ||
| 11: end for | ||
| /* Calculate the total energy*/ | ||
| 12: | ||
| /* Calculate number of EVs*/ | ||
| 13: | ||
The total wind energy per unit of time (i.e., one day) was calculated from the intervals that show power stability and do not intersect (overlap) in time. Let be the instantaneous power intervals of duration (i.e., charging time of EV battery) distributed over the entire day. These intervals are found by using overlapped sliding windows, where the overlapped intervals are required to be omitted prior to calculating the total energy for the whole day. The non-overlap total energy is found by:
where is the total non-overlap interval (lines 8–10 in Algorithm 1) within a specific period of time that satisfies the condition for each of the consecutive intervals and . The sum of wind energy generated within a time interval is more than the EV charger energy per the smallest time unit (i.e., one minute) for partial charging or is more than the EV charger energy per time for full charging (80%).
3.3. Charging Station Capacity
In this work, the considered EV fast-charging station consists of renewable sources (wind turbines) and DC power chargers to charge the EV batteries. The defined criteria and constraints in Section 3.2 for the wind-to-EV charging system are generalized on a specific EV model. In this study, we selected the Tesla Model 3 Standard Range Plus EV, or any other EV with similar specifications. Table 1 summarizes the relevant characteristics of Tesla Model 3 + EV.

Table 1.
Relevant Tesla Model 3 Standard Range Plus specifications.
4. Results
4.1. Wind Speed Data Averaging
Three case scenarios for wind speed averaging were used to typify possible variations of wind power stability by using one, two, and three minutes. For each case, during the averaging process, no time interval includes observations from two data segments with missing wind speed values. The monthly percentage of missing data was calculated for M4, while no missing data were found from M2. The missing data at M4 were not scattered over time but were found to be sustained for long periods—sometimes days—and it was not practical to perform data imputations to fill the data gaps. For this reason, the power analysis in the following subsections was performed on a daily basis.
Figure 4 shows the boxplots of the entire one-year data of M2 and M4 using the three averaging scenarios. Obviously, the M2 data have a lower annual wind speed average with fewer variations compared to that of M4. The three averaging intervals also show almost identical statistics, with a mean ± standard deviation of 3.7002 ± 2.9095, 3.7002 ± 2.8803, and 3.7002 ± 2.8616 for one, two, and three minutes, respectively. Similarly, for the M4 data, the figure shows higher wind averages of 4.4040 ± 3.5194, 4.4031 ± 3.4893, and 4.4023 ± 3.4702, respectively, for the same three averaging intervals. The stationary analysis of wind averaging was also investigated using the obtained wind angular directions and Weibull distribution parameters, as shown in Figure 5. The wind directions of M2, as in Figure 5a–c, show new patterns with different averaging intervals, which could be explained as extreme variations in the wind directions within small time intervals of one to three minutes. On the contrary, the wind directions of M4, as illustrated in Figure 5g–i, are stable over the three averaging intervals. The wind histograms and Weibull distribution parameters show slight changes when varying the averaging intervals, as explained in the caption of Figure 5. These results do not provide a shred of evidence on which averaging interval is more suitable for wind energy harvesting when considering the stability of the power output. Since wind time series data are highly non-stationary, the dynamic analysis of statistical parameters over shorter periods may reveal more underlying behaviors of wind changes. This will be provided in the following subsections, where the moving window power analysis is presented over the three averaging scenarios.
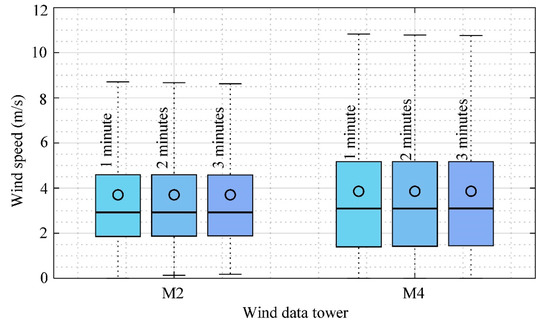
Figure 4.
Boxplot of the M2 and M4 tower wind speed (without outliers) grouped via averaging.
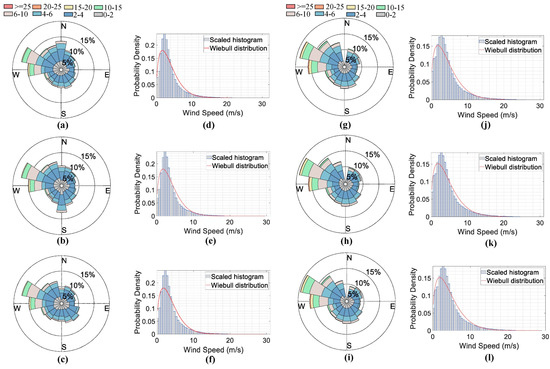
Figure 5.
Windrose plots and wind speed distributions for M2 (a–f) and M4 (g–l) when averaged over one (a,d,j,i), two (b,e,h,k), and three (c,f,i,l) minutes. (d) Wind speed distribution for M2 averaged over one minute and fitted on Weibull distribution of scale = 4.0849 and shape = 1.3948. (e) Two minutes averaged wind speed distribution of the M2 tower data with Weibull scale = 4.0930 and shape = 1.410. (f) The M2 tower wind speed data averaged over three minutes interval with Weibull scale = 4.0986 and shape = 1.421. (j) The M4 tower wind speed of one minute average with Weibull distribution scale = 4.8212 and shape = 1.3444. (k) The M4 wind speed data when averaging over two minutes with Weibull scale = 4.8299 and shape = 1.3576. (l) The wind speed distribution of the M4 tower averaged over three minutes with Weibull distribution scale = 4.8357 and shape = 1.3669.
4.2. Wind Turbine Selection
Most wind turbines in the market are of variable speed and produce variable-frequency power, while AC–DC–AC converters are required to rectify the output power and stabilize the frequency. Variable-speed wind turbines are designed to achieve maximal aerodynamic efficiency to make use of a wide range of wind speeds. In this study, we performed a benchmark performance analysis of the 68 wind turbines to determine the turbines with the most stable power outputs. Table 2 summarizes the nine selected turbines and the corresponding power stability measured as the percentage of the total intervals over different averaging intervals for both M2 and M4 tower data. The optimal selection of wind turbines may depend on other indicators, such as the total energy production, cost of produced energy, reliability, and installation cost. However, the main concern of this study is the availability of stable output power; hence, the turbines with more near-constant power intervals were selected for EV charging analysis. In Table 2, the selected turbines show nominal power in the range of 2200–3500 kW, with hub heights ranging from 99.5 to 137 m.

Table 2.
Selected wind turbines output power stability (%) using M2 and M4 wind speed data with different averaging intervals.
4.3. Charging Station Capacity
The wind-powered EV charging station is strongly dependent on the availability of constant power supply from wind turbines, which limits the station in terms of providing smart charging compared with an immediate charging scenario. Grid power compensation could partially solve this issue and provide enough power to charge the EVs when turbines fail to satisfy the EVs’ power demands. In this study, the direct wind-to-EV charging using DC fast-charging technology was preferable due to the significant reduction in power conversion stages. Moreover, the study aimed to reduce the reliance on grid and storage systems. Excess wind power that is not used for fast charging can be injected into the utility grid. The (re-)scheduling of the charging events is triggered whenever the charging system predicts stable wind energy that falls within user-defined EV charging specifications (energy volume and charging duration). All time intervals (the holding time of EV for charging) were statistically analyzed, and the intervals that did not show stable or enough power within the EV charging standards were filtered. Finally, the cumulative daily wind energy and the estimated number of EVs that the station could handle were obtained from the remaining charging intervals.
Figure 6 summarizes the average monthly number of EVs calculated from each individual wind turbine power output over one-, two-, and three-minute wind speed averaging for the M2 and M4 datasets. For all scenarios, turbine no124 shows the best performance from the selected nine turbines, followed by turbine no44. Even though the wind speed data variations and power curve sampling are the same for all turbines, instantaneously mapping the wind speed to wind power using the power curve gives more stability in the output wind power, which strongly depends on the shape of the power curve itself.
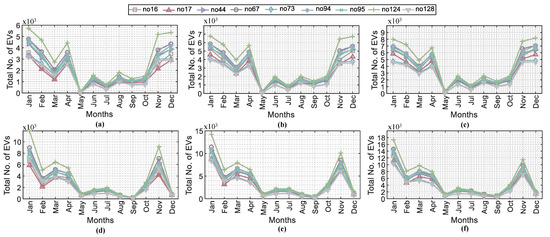
Figure 6.
Selected turbines and total number of EVs calculated over different averaging intervals for M2 (a–c) and M4 (d–f) data. (a,d) The monthly estimated total EVs when using one-minute wind speed averaging. (b,d) The number of EVs using two-minute averaging intervals. (c,f) The three-minute averaging results of total EVs.
The comparison results using different wind speed averaging intervals revealed that as the averaging interval (in minutes) increases, the stability of wind power output increases, which verifies the blades’ momentum effects. Comparing the results of one-minute averaging (Figure 6a,c) with the two-minute averaging (Figure 6b,d), it is evident that there is a significant increase in power stability, which leads to a higher number of EVs that the station can serve on a monthly basis. Taking turbine no16 (e.g., January) as an example, the two-minute averaging intervals show 47% and 45% increases in total EVs for the M2 and M4 datasets, respectively. Similarly, the three-minute intervals compared to the one-minute averaging intervals show superior improvement in the system, producing almost 81% and 91% increases in the system’s monthly coverage of EVs.
Furthermore, Figure 6 illustrates the comparison results of using two different wind speed datasets (M2-2018 and M4-2014). According to the results, it can be seen that M4 data (Figure 6d,c,f) provide a greater wind turbine power output, and therefore a greater number of EVs can be charged. However, the performance is not stable throughout the months of the year. The M2 dataset shows the best performance during January, February, March, April, November, and December, with lesser performance during the other months. The M4 data lead to the same conclusion as M2, except for December, where almost 12 days of the data were missing and were excluded from the calculations.
Figure 7 and Figure 8 show examples of a direct wind energy EV charging conversion procedure over one month for both M2 (January 2018) and M4 (January 2014) data, respectively. The wind speed data were averaged using three minute intervals, as concluded from Figure 6, while Figure 7a and Figure 8a show the heat maps of interval-based wind speed progression (m/s) rearranged in daily vectors to observe the correlation between wind speed observations and wind turbine output power. For each predefined charging time slot ( min), the algorithm converts the wind speeds to turbine power outputs using an overlapped sliding window procedure (Figure 7b and Figure 8b). It can be concluded that the regions of the wind speed heat maps that show no changes in the color (wind speed) are reflected as stable power outputs in the corresponding power heat maps. The filtered wind power time slots ( min) are shown in Figure 7c and Figure 8c. We can see that the power time slots that are constrained for EV charging are scattered throughout the day, with the M4 dataset showing a greater availability of EV charging time slots. For power time slots available at night and for better charging system efficiency, prior alerts must be sent to the customers when the power is expected to be available and when parking lots are available in the charging station. The conversion of wind power to energy can be seen in Figure 7d,e and Figure 8d,e. The M2 and M4 datasets show different patterns of daily energy availability, with minimal EV charging energy on some days, especially for the M2 data. It will be beneficial to add another renewable energy source, connect to the grid, or combine these scenarios to tackle this energy uncertainty. The excess power harvested from the wind can be injected into the utility grid during the windy days, which will compensate for the system energy cost provided to the customers. As shown in Figure 7f and Figure 8f, only a few days had zero wind energy, which was harvested from an individual wind turbine, where wind energy aggregation from the multi-turbine grid could enhance the overall system efficiency. Furthermore, for certain days, the wind energy availability for EV charging could be beyond the charging station’s capacity, which in turn could be sold to the utility grid and be re-used when wind energy is not available, thus reducing the reliance on battery storage systems.
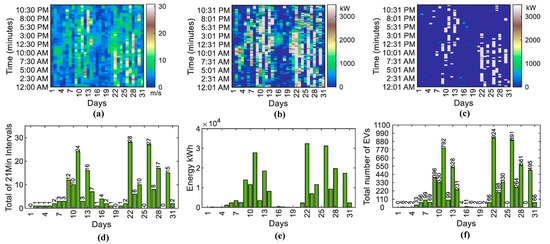
Figure 7.
Wind energy EV charging conversion results for M2 tower data during January 2018 for selected turbine no16. (a) Wind speed (average ± standard deviation is 5.6898 ± 4.1389 m/s) heat map rearranged to show daily 21-min intervals. (b) The corresponding wind turbine power output for each 21-min interval. (c) The usable interval for EV charging. (d) The total number of 21-min intervals per day. (e) Total available daily energy for full-EV charging. (f) Total number of EVs per day.
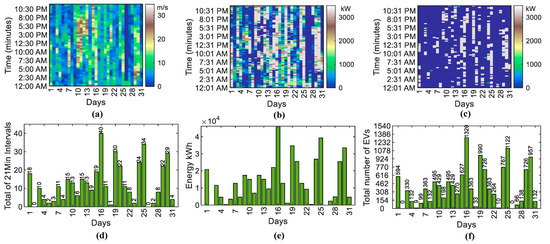
Figure 8.
Wind energy EV charging conversion results for the M4 tower data during January 2014 for selected turbine no16. (a) Wind speed (average ± standard deviation is 8.3917 ± 6.2554 m/s) heat map rearranged to show daily 21-min intervals. (b) The corresponding wind turbine power output for each 21-min interval. (c) The usable interval for EV charging. (d) Total number of 21-min intervals per day. (e) Total available daily energy for full-EV charging. (f) Total number of EVs per day.
5. Conclusions
In this paper, we described a large-scale fast EV charging approach that considers wind turbines as a direct energy source. The benefits of this approach can be seen from the reduced dependency on electricity grids, battery storage systems, and energy conversion power electronics. We conducted wind speed and power data analysis of high-resolution datasets acquired from two different sites within two distanced years. We performed investigations on wind averaging intervals. The results showed that averaging wind speed over intervals of three minutes gives superior EV charging performance. We also conducted a comparison of different wind turbines using a large data library (68 turbines) of power curves. Analysis of the results revealed that only nine turbines showed continuous power availability. We presented the proposed charging approach by using a standard EV (Tesla Model 3 standard range plus) to analytically measure the overall performance of the charging approach. The analysis concluded that the introduced charging approach is able to provide convincing results.
Author Contributions
Conceptualization, V.A., A.A.A., and F.N.; methodology, F.N.; software, F.N.; validation, V.A., A.A.A., and K.S.T.; formal analysis, G.A.; investigation, K.S.T.; resources, A.A.A.; data curation, F.N.; writing—original draft preparation, F.N.; writing—review and editing, A.A.A., V.A., and K.S.T.; visualization, G.A. and J.E.; supervision, A.A.A.; project administration, K.S.T.; funding acquisition, A.A.A. and K.S.T. All authors have read and agreed to the published version of the manuscript.
Funding
This research was funded by Universiti Tenaga Nasional under the BOLD2025 Fund.
Conflicts of Interest
The authors declare that there is no conflict of interest. The funders had no role in the design of the study; in the collection, analyses, or interpretation of data; in the writing of the manuscript; or in the decision to publish the results.
References
- Cerna, F.V.; Pourakbari-Kasmaei, M.; Contreras, J.; Gallego, L.A. Optimal selection of navigation modes of HEVs considering CO2 emissions reduction. IEEE Trans. Veh. Technol. 2019, 68, 2196–2206. [Google Scholar] [CrossRef]
- Sun, X.; Li, Z.; Wang, X.; Li, C. Technology development of electric vehicles: A review. Energies 2020, 13, 90. [Google Scholar] [CrossRef]
- Das, H.; Rahman, M.; Li, S.; Tan, C. Electric vehicles standards, charging infrastructure, and impact on grid integration: A technological review. Renew. Sustain. Energy Rev. 2019, 120, 109618. [Google Scholar] [CrossRef]
- Khalid, M.R.; Alam, M.S.; Sarwar, A.; Asghar, M.J. A comprehensive review on electric vehicles charging infrastructures and their impacts on power-quality of the utility grid. ETransportation 2019, 1, 100006. [Google Scholar] [CrossRef]
- Fathabadi, H. Utilizing solar and wind energy in plug-in hybrid electric vehicles. Energy Convers. Manag. 2018, 156, 317–328. [Google Scholar] [CrossRef]
- Dong, Q.; Niyato, D.; Wang, P.; Han, Z. The PHEV charging scheduling and power supply optimization for charging stations. IEEE Trans. Veh. Technol. 2015, 65, 566–580. [Google Scholar] [CrossRef]
- Luo, L.; Gu, W.; Wu, Z.; Zhou, S. Joint planning of distributed generation and electric vehicle charging stations considering real-time charging navigation. Appl. Energy 2019, 242, 1274–1284. [Google Scholar] [CrossRef]
- Ashique, R.H.; Salam, Z.; Aziz, M.J.B.A.; Bhatti, A.R. Integrated photovoltaic-grid dc fast charging system for electric vehicle: A review of the architecture and control. Renew. Sustain. Energy Rev. 2017, 69, 1243–1257. [Google Scholar] [CrossRef]
- Fathabadi, H. Novel wind powered electric vehicle charging station with vehicle-to-grid (V2G) connection capability. Energy Convers. Manag. 2017, 136, 229–239. [Google Scholar] [CrossRef]
- Goli, P.; Shireen, W. Wind powered smart charging facility for PHEVs. In Proceedings of the 2014 IEEE Energy Conversion Congress and Exposition (ECCE). IEEE, Pittsburgh, PA, USA, 14–18 September 2014; pp. 1986–1991. [Google Scholar]
- Ahadi, A.; Sarma, S.; Moon, J.S.; Kang, S.; Lee, J.H. A robust optimization for designing a charging station based on solar and wind energy for electric vehicles of a smart home in small villages. Energies 2018, 11, 1728. [Google Scholar] [CrossRef]
- Al-Falahi, M.D.; Jayasinghe, S.; Enshaei, H. A review on recent size optimization methodologies for stand-alone solar and wind hybrid renewable energy system. Energy Convers. Manag. 2017, 143, 252–274. [Google Scholar] [CrossRef]
- Domínguez-Navarro, J.; Dufo-López, R.; Yusta-Loyo, J.; Artal-Sevil, J.; Bernal-Agustín, J. Design of an electric vehicle fast-charging station with integration of renewable energy and storage systems. Int. J. Electr. Power Energy Syst. 2019, 105, 46–58. [Google Scholar] [CrossRef]
- Zheng, Y.; Niu, S.; Shang, Y.; Shao, Z.; Jian, L. Integrating plug-in electric vehicles into power grids: A comprehensive review on power interaction mode, scheduling methodology and mathematical foundation. Renew. Sustain. Energy Rev. 2019, 112, 424–439. [Google Scholar] [CrossRef]
- Hardman, S.; Jenn, A.; Tal, G.; Axsen, J.; Beard, G.; Daina, N.; Figenbaum, E.; Jakobsson, N.; Jochem, P.; Kinnear, N.; et al. A review of consumer preferences of and interactions with electric vehicle charging infrastructure. Transp. Res. Part D Transp. Environ. 2018, 62, 508–523. [Google Scholar] [CrossRef]
- Sánchez-Sáinz, H.; García-Vázquez, C.A.; Llorens Iborra, F.; Fernández-Ramírez, L.M. Methodology for the optimal design of a hybrid charging station of electric and fuel cell vehicles supplied by renewable energies and an energy storage system. Sustainability 2019, 11, 5743. [Google Scholar] [CrossRef]
- Najafi, A.; Marzband, M.; Mohamadi-Ivatloo, B.; Contreras, J.; Pourakbari-Kasmaei, M.; Lehtonen, M.; Godina, R. Uncertainty-Based models for optimal management of energy hubs considering demand response. Energies 2019, 12, 1413. [Google Scholar] [CrossRef]
- Teleke, S.; Baran, M.E.; Huang, A.Q.; Bhattacharya, S.; Anderson, L. Control strategies for battery energy storage for wind farm dispatching. IEEE Trans. Energy Convers. 2009, 24, 725–732. [Google Scholar] [CrossRef]
- Zhao, X.; Yan, Z.; Xue, Y.; Zhang, X.P. Wind power smoothing by controlling the inertial energy of turbines with optimized energy yield. IEEE Access 2017, 5, 23374–23382. [Google Scholar] [CrossRef]
- Liu, K.; Shang, Y.; Ouyang, Q.; Widanage, W. A data-driven approach with uncertainty quantification for predicting future capacities and remaining useful life of lithium-ion battery. IEEE Trans. Ind. Electron. 2020. [Google Scholar] [CrossRef]
- Liu, K.; Hu, X.; Wei, Z.; Li, Y.; Jiang, Y. Modified Gaussian process regression models for cyclic capacity prediction of lithium-ion batteries. IEEE Trans. Transp. Electrif. 2019, 5, 1225–1236. [Google Scholar] [CrossRef]
- Liu, K.; Zou, C.; Li, K.; Wik, T. Charging pattern optimization for lithium-ion batteries with an electrothermal-aging model. IEEE Trans. Ind. Inform. 2018, 14, 5463–5474. [Google Scholar] [CrossRef]
- Liu, K.; Hu, X.; Yang, Z.; Xie, Y.; Feng, S. Lithium-Ion battery charging management considering economic costs of electrical energy loss and battery degradation. Energy Convers. Manag. 2019, 195, 167–179. [Google Scholar] [CrossRef]
- Ouyang, Q.; Wang, Z.; Liu, K.; Xu, G.; Li, Y. Optimal charging control for lithium-ion battery packs: A distributed average tracking approach. IEEE Trans. Ind. Inform. 2019, 16, 3430–3438. [Google Scholar] [CrossRef]
- Fathabadi, H. Novel stand-alone, completely autonomous and renewable energy based charging station for charging plug-in hybrid electric vehicles (PHEVs). Appl. Energy 2020, 260, 114194. [Google Scholar] [CrossRef]
- Clifton, A. 135-M Meteorological Masts at the National Wind Technology Center: Instrumentation, Data Acquisition, and Processing. Technical Report; July 2014. Available online: https://wind.nrel.gov (accessed on 30 January 2020).
- Harper, B.; Kepert, J.; Ginger, J. Guidelines for Converting between Various Wind Averaging Periods in Tropical Cyclone Conditions; WMO: Geneva, Switzerland, 2010. [Google Scholar]
- Malte, P.; Christian, H.; Jonas, H.; Ludee. Wind Turbine Library. 2019. Available online: https://openenergy-platform.org/ (accessed on 3 February 2020).
- International Electrotechnical Commission. Wind Energy Generation Systems—Part 12-1: Power Performance Measurements of Electricity Producing Wind Turbines; IEC 61400-12-1:2017; International Electrotechnical Commission: Geneva, Switzerland, 2017. [Google Scholar]
- Astolfi, D.; Castellani, F.; Terzi, L. Wind turbine power curve upgrades. Energies 2018, 11, 1300. [Google Scholar] [CrossRef]
- Hossain, M.; Mekhilef, S.; Afifi, F.; Halabi, L.M.; Olatomiwa, L.; Seyedmahmoudian, M.; Horan, B.; Stojcevski, A. Application of the hybrid ANFIS models for long term wind power density prediction with extrapolation capability. PLoS ONE 2018, 13, e0193772. [Google Scholar] [CrossRef]
- Abolude, A.T.; Zhou, W. Assessment and performance evaluation of a wind turbine power output. Energies 2018, 11, 1992. [Google Scholar] [CrossRef]
© 2020 by the authors. Licensee MDPI, Basel, Switzerland. This article is an open access article distributed under the terms and conditions of the Creative Commons Attribution (CC BY) license (http://creativecommons.org/licenses/by/4.0/).