Abstract
We experimentally studied the Rydberg level shift caused by the electric field, which is generated by Rydberg atom collision induced ionization in a cesium atomic ensemble. The density of charged particles caused by collisions between Rydberg atoms is changed by controlling the ground-state atomic density and optical excitation process. We measured the Rydberg level shift using Rydberg electromagnetically-induced-transparency (EIT) spectroscopy, and interpreted the physical origin using a semi-classical model. The experimental results are in good agreement with the numerical simulation. These energy shifts are important for the self-calibrated sensing of microwave field by the employing of Rydberg EIT. Moreover, in contrast to the resonant excitation case, narrow-linewidth spectroscopy with high signal-to-noise ratio would be useful for high-precision measurements.
1. Introduction
Recent progress in technical control has offered possibilities for studying the interactions between pure quantum mechanical systems and their coupling to reservoirs, which can be extended as unique tools for quantum sensing [1]. Alkali metal atoms are convenient, in terms of the technical requirements needed for sensors. Neutral atoms in chip-scale atomic vapor have been utilized as a device for many applications, including atomic clocks [2], atomic magnetometers cell [3], and for radio-frequency (RF) fields sensors [4]. Atom-based electromagnetic field sensor technologies hold great promise for realizing such applications. The most advanced experimental demonstrations include high dynamic field ranges (exceeding 120 dB), high-intensity RF fields (up to 10 kV/m) [5], broadband RF detection (on the order of THz) [6], and high sensitivity (V· cm−1/Hz1/2 [4,7]. Recent advances have experimentally achieved sensitivities of 55 nV · cm−1/ Hz1/2, which approaches the quantum projection noise limit [8]; however, going beyond this, it is possible by using squeezed states or Schrodinger-cat states of light field [9].
Recent advances have provided new capabilities in RF or microwave (MW) sensing. Typical high-frequency microwave fields have a wavelength range on the order of millimeters or centimeters. In chip-scale atomic vapor cell, the signal is limited by atomic density. In contrast to the characteristics of atomic spin, Rydberg atoms with high principal quantum number have exaggerated characteristics including dipole–dipole or Van der Waals interactions [10]. Using a buffer-gas-filled cell to improve atomic coherence is not feasible, as collision will destroy the electric dipole coherence. The high atomic density can be obtained by ultraviolet light desorption effect or heating the atomic vapor cell. Under high-density atomic gas, the sensing accuracy and sensitivity are limited by the spectral broadening [11], including Doppler broadening, collision broadening, and interaction dephasing induced by Rydberg atom collisions. The dephasing observed in the experiments has been explained by averaging the effects resulting from Van den Waals interaction of Rydberg–Rydberg interaction or coupling between Rydberg atoms and the inner surface of the glass cell [12,13,14].
In this paper, by measuring the Rydberg electromagnetically-induced-transparency (EIT) signal, we observed Rydberg level shift caused by Stark interaction of Rydberg atoms and the mean electric field which is generated by Rydberg atom collision induced ionization in a cesium atomic ensemble. The results are obtained by means of Doppler-free spectroscopy with high signal-to-noise ratio, which is essential for high-precision measurements. Understanding the microscopic mechanism of charged particles production in thermal Rydberg atomic vapor and its corresponding electric field distribution is an important part of future experiments and applications.
2. Setup and Measurement
The experimental setup is shown in Figure 1. An external-cavity diode laser (ECDL) at 852 nm is used as a probe laser with a typical linewidth of ∼90 kHz. The optical power of a 1018-nm ECDL is amplified to ∼5 W by a fiber amplifier(FA), and then frequency-doubled by a single-passed periodically poled lithium niobate (PPLN) crystal to 509 nm. The two beams are overlapped in cesium (Cs) atomic vapor in a counter-propagating configuration. The spherical cesium cell has a radius of ∼1.2 cm to match the Rayleigh length of the focused beams (∼40 m waist radius). We first performed the saturation absorption spectroscopy and determined the zero detuning of the 852-nm probe laser. The wavelength meter (HighFinesse WS-7, with wavelength deviation sensitivity of about 10 MHz) was calibrated using the Cs hyperfine transition line. With the calibrated wavelength meter, we measured the wavelength of probe beam (when set to a certain detuning) and the coupling beam. The ladder-type Rydberg EIT signal is observed by scanning the frequency of 509-nm coupling laser while the 852-nm probe laser’s frequency is fixed. The background-free EIT spectrum with high signal-to-noise ratio can be regarded as a low-noise detection system, which decreases the intensity noise and phase noise. Figure 2 shows the relevant energy level schematic and the transmitted intensity of a typical Rydberg EIT signal at 25 °C. The linewidth of the EIT signal is about 10 MHz, as measured by a RF modulation spectroscopy.
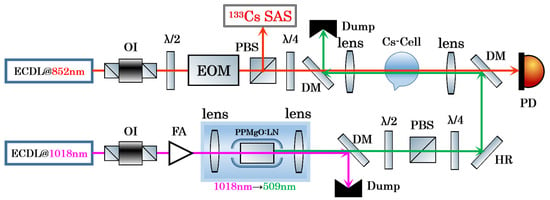
Figure 1.
Schematic diagram of the experimental setup.An ECDL at 852 nm is used as a probe laser, and an ECDL at 1018 nm is frequency-doubled and used as a 509-nm coupling laser. The frequency-doubling crystal is a PPLN. A SAS (saturation absorption spectroscopy) setup is used as a frequency reference for the hyperfine structure of the Cs D2 line, where OI is optical isolator; EOM, electro-optic modulator; /2, half-wave plate; /4, quarter-wave plate; PBS, polarization beam splitter cube; DM, dichroic mirror; FA, fiber amplifier; PD, photodiode (New Focus, model 2051); HR, high reflection mirror; SAS, saturation absorption spectroscopy.
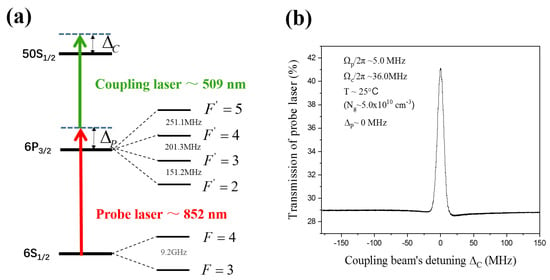
Figure 2.
(a) Energy level schematic of the ladder-type EIT of Cs atoms with Rydberg state (50). is the detuning of probe laser, is the detuning of coupling laser; (b) Typical Rydberg EIT signal. The 852-nm probe laser is detuned by from the Cs transition (here, ), while the 509-nm coupling laser is scanned across the Cs Rydberg transition.
We study the relationship between the Rydberg EIT signal and the temperature as well as laser detuning in a ladder-type system. Figure 3a shows the dependence of the Rydberg EIT signal on probe detuning at a cell temperature of 40 °C, where each small peak in the figure represents an EIT signal. Zero detuning of the probe laser is identical with the Cs cascade resonance transition. We fix the 852-nm laser frequency at a chosen detuning and scan the 509-nm laser frequency in order to get EIT signal. When the detuning of the probe laser is ∼260 MHz, the EIT signal’s strength is the largest, which is caused by the electric field generated by the collisions of Rydberg atoms causing the Rydberg level shift, a detailed explanation can be found in the discussion part. In Figure 3b, only the envelope curves are shown, for 40, 60, and 80 °C. Figure 3c shows that the 852-nm laser detuning for the maximum intensity of EIT signals changed with temperature (ground-state atomic density). It can be seen that probe laser detuning with the maximum EIT signal intensity increased nearly linear with increasing temperature. For example, at temperature of 90 °C, the probe laser detuning with the maximum EIT signal intensity is ∼510 MHz. Under high temperature conditions, the Rydberg EIT signal for the Cs cascade transition (zero detuning of the probe laser) is very weak. We observe that the linewidth of the EIT signal does not change significantly as the temperature increases, and is ∼10 MHz. There is no obvious linewidth broadening, which means that the electric field-induced shift is not a dissipative process.
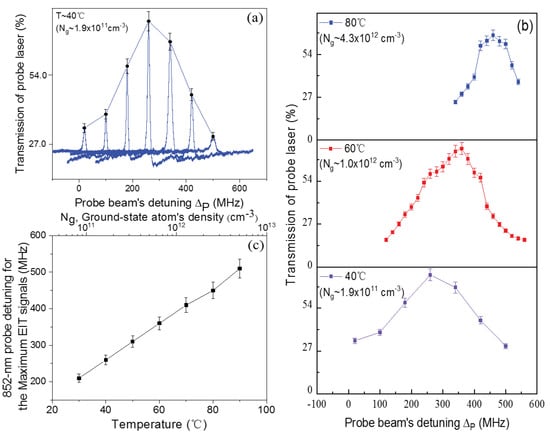
Figure 3.
(a) At temperature of 40 °C, the Rydberg EIT signal is obtained by scanning the 509-nm coupling laser frequency with different 852-nm probe laser detuning; (b) Rydberg EIT signal intensity versus probe laser detuning for different atomic cell temperature; (c) The 852-nnm probe laser detuning of the maximum intensity EIT signal changes with temperature (ground-state atomic density), including the three temperature corresponding data points in (b). Rabi frequency of 852-nm probe laser is ∼5.0 MHz, and that of the 509-nm coupling laser is ∼36.0 MHz.
3. Analysis and Discussions
The most advanced experiments demonstrate that collisions in a Rydberg atomic ensemble will yield ionization which will produce positive ions and electrons [15]. We know that, under the conditions of a weak electric field, the Rydberg level shift will be dominated by Stark shift. The dependence of the Rydberg level shift on the weak electric field can be measured by Rydberg EIT spectroscopy. We expand this idea and use a semi-classical model to explain the physical phenomena of the Rydberg level shift. In a thermal Rydberg atomic ensemble, the collisions between Rydberg atoms and the collisions between Rydberg atoms and ground-state atoms induce charged particles (positive ions and electrons), which cause avalanche ionization [15,16,17]. Here, the photo-ionization process is very weak, it can be ignored. In our system, the Rydberg atomic density is obtained by the combined effect of the ground-state cesium atomic density and the two-step Rydberg excitation , under the premise that the other experimental conditions (i.e., probe Rabi frequency and coupling Rabi frequency) remain unchanged, and ionization leads to the reduction of the Rydberg atomic density.
In the theoretical model, positive ions and electrons will generate an inhomogeneous local electric field in the local space of the atomic vapor, and the local electric field interesting with Rydberg atoms will reduce the Rydberg energy and cause a Rydberg level shift. We assume the electron density and the positive ion density to be equal, and both parameters are given by . The dependence of charged particles’density and Rydberg atomic density can be obtained by solving the following rate equations [15]:
where and are Rydberg atom density and induced density of charged particles, respectively. is the ground-state atomic density; is cross-section for Rydberg-ground state atomic collisions, is geometric cross-section of Rydberg atomic collisions [18,19], is the mean relative velocity of Rydberg atoms colliding with ground-state atoms, and is the mean relative velocity of Rydberg atoms colliding with other Rydberg atoms. The expected value of is 0.06[15], with [15,20] (where is the Bohr radius) being the geometric cross-section of Rydberg state with an effective principal quantum number . is the Rydberg component in superposition dark state of EIT, where is two-photon detuning. Here, contains charged particles recombination and decay, and the rate represents the losses in the charged particle. is the charged particle diffusion rate. The most obvious contribution is that describes the motional decay parameters of charged particles leaving the interaction volume due to thermal motion, which vary slightly with temperature. The value of is ∼0.25 MHz. The second term in is represented by 2, which describes the recombination of ions with electrons into neutral particles. Here, is the Boltzmann constant, is the electron mass, is the charged particles population, and we take 1 in our model. The expected value for can be estimated [21] in a semi-classical treatment with Kramer’s formula. Compared with the ion diffusion rate of 0.25 MHz, 2 is very small and can be ignored.
We obtain the densities of charged particles and Rydberg atoms according to the rate equations, as shown in Figure 4a. It can be seen that the Rydberg atomic density increases first nearly linear with increasing temperature, but at relatively high temperature, this changes to a slowly increase. This may be caused by the different two-step Rydberg excitation (i.e., laser Rabi frequency remains constant, but the single-photon detuning is quite different). The single-photon detuning is relatively small under low temperature conditions, so that the two-step Rydberg excitation is relatively strong, which is just the opposite situation under high-temperature conditions. According to Rydberg atomic density, we can calculate Rydberg level shift for the 50 state [22], within a short-distance range, it is a dipole–dipole interaction, which is proportional to 1/. The theoretical result is shown in Figure 4b. In the long-distance range, it is Van der Waals interaction, which is proportional to 1/. It can be seen that the Rydberg level shift due to dipole–dipole interaction is much smaller than our measured values. Therefore, it is impossible to cause a Rydberg level shift of several hundred MHz. Therefore, the Rydberg level shift caused by the interaction between Rydberg atoms is not the main factor than our measured values. Here, considering the quantum defect of the Rydberg atoms, we know that there are two types of interaction between the outermost electron of the alkali-metal Rydberg atom and its nucleus: penetration and polarization. As a result of these two effects, the atomic binding energy increases and total energy reduces (quantum defect) [23,24]. However, in general, the energy loss caused by the quantum defect is very small, so the effect of quantum defect can also be ignored.
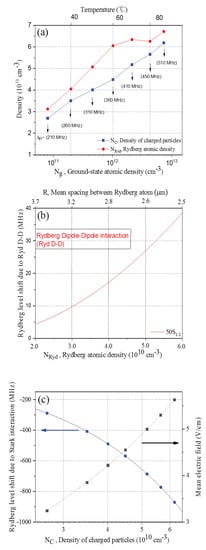
Figure 4.
(a) The densities of charged particles and Cs 50 Rydberg atoms. The blue squares indicate the densities of charged particles, while the red solid circles indicate Rydberg atomic densities; (b) Rydberg level shift due to Rydberg dipole–dipole interaction of Cs atoms for 50 state versus the calculated Rydberg atomic density; (c) Rydberg level shift versus for Cs 50 Rydberg state. The blue solid circles are Rydberg level shifts caused by the calculated density of charged particles, according to seven temperature conditions of Figure 3c, while the blue solid line shows Equation (3). The black squares indicate the mean electric fields based on the calculated density of charged particles.
Based on the calculated density of charged particles, the inhomogeneous electric field is [25,26], where is the vacuum dielectric constant, e is the charge of electron. In low electric fields, Stark shift of the Rydberg state is given by second order perturbation theory [27] to be , where is the atomic polarizability of Rydberg state. Referring to the related literature ref. [28], the value for can be estimated; the polarizability of 50 Rydberg state is ∼54.33 MHz·cm2/V2. The dependence of Rydberg level shift on the density of charged particles can be given as follows [25,26,27]:
We calculate Rydberg level shift according to Equation (3), as shown in Figure 4c. with = 5.0 MHz, = 36.0 MHz. The blue solid circles in the figure are Rydberg level shifts obtained under seven temperature conditions in Figure 3c; the black squares show the calculated mean electric fields.
Laser beams with different frequencies will interact with atoms of different velocity groups [29,30]. We can change the frequency detuning of the coupling laser by controlling the frequency detuning of the probe laser , as the Rydberg level shift can also react to the frequency detuning of the probe laser. Therefore, according to the theoretical simulation, we find , where is the 852-nm probe detuning of the maximum EIT signal intensity. Therefore, Rydberg level shift is caused by the mean electric field generated by the collisions induced ionization, such that the probe laser is in resonance with the Cs transition, while the coupling laser is in resonance with the Cs Rydberg transition, satisfying the two-photon resonance condition, the intensity of EIT signal is the strongest under this condition.
We study the relationship between the Rydberg level shift and detuning of the probe laser that produces the EIT signal of maximum intensity multiplied by the Doppler mismatch factor, as shown in Figure 5. The blue solid circles indicate the change of Rydberg level shift with density of charged particles, while the red squares indicate the change of probe laser detuning multiplied by the Doppler mismatch factor with density of charged particles, that is, how varied with density of charged particles. It can be seen that, with the change of density of charged particles, Rydberg level shift and detuning of probe laser multiplied by the Doppler mismatch factor are approximately equal. The solid black line is the fitting of the change of with the density of charged particles by using Equation (3). In our experimental system, the main deviation is inaccuracy of the temperature control of the atomic vapor cell. For the red detuning for Rydberg state 50, there is also an energy shift and maximum intensity of Rydberg EIT signal. For the case of the Cs Rydberg transition, the red detuning of ~500 MHz is corresponding to the blue detuning of the Cs Rydberg transition. With Rydberg EIT spectra, it is difficult to eliminate the influence of hyperfine folds in 6 state. Therefore, the detailed discussion is not performed on the red detuning case for 50 Rydberg state.
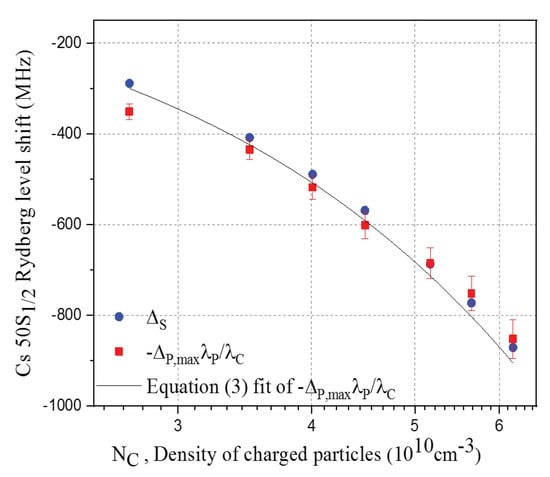
Figure 5.
Comparison of the relationship between and , where is the calculated Rydberg level shift, is the detuning of the probe laser that produces the EIT signal of maximum intensity multiplied by the Doppler mismatch factor. The blue solid circles indicate the calculated Rydberg level shift versus for the Cs 50 Rydberg state, the red squares with error bars indicate the measured probe detuning multiplied by the Doppler mismatch factor versus for the Cs 50 Rydberg state. The solid black line is the fitting of Equation (3) to .
4. Conclusions
In conclusion, we experimentally investigated the variation of Rydberg EIT signal intensity upon laser detuning and we found that the intensity of the EIT signal was the highest under a specific detuning of the probe laser, when the other experimental conditions were fixed. Then, we analyzed the Rydberg level shift generated by the mean electric field induced by collisions between Rydberg atoms and between Rydberg atoms and ground-state atoms. The Rydberg level shift relates to the maximum EIT signal due to the detuning of probe laser. Furthermore, we solved the rate equations by using a semi-classical model, and obtained the densities of Rydberg atoms and charged particles generated by Rydberg atoms collision induced ionization. Our results have direct consequences for quantum sensing devices, where Rydberg EIT is employed for sensing radio-frequency and microwave fields.
Author Contributions
X.W. and J.H. set up the ladder-type Rydberg EIT system, and measured and collected experimental data. J.W. investigated the theoretical model and analyzed experimental data. J.B. calculated the interaction between Rydberg atoms and the self-ionization rate equations. X.W., J.H., and J.W. wrote and revised the manuscript. All authors have read and agreed to the published version of the manuscript.
Funding
This research is partially funded by the National Key R&D Program of China (2017YFA03040502), the National Natural Science Foundation of China (61875111, 11774210, 11974226, and 61905133), the S&T Innovation Programs of Higher Education Institutions in Shanxi Province(2017101), and the Shanxi Provincial 1331 Project for Key Subjects Construction.
Conflicts of Interest
The authors declare no conflict of interest.
References
- Degen, C.L.; Reinhard, F.; Cappellaro, P. Quantum sensing. Rev. Mod. Phys. 2017, 89, 5002. [Google Scholar] [CrossRef]
- Vanier, J.; Audoin, C. Atomic clocks. (Book reviews: The quantum physics of atomic frequency standards). Science 1990, 249, 685. [Google Scholar]
- Kominis, I.K.; Kornack, T.W.; Allred, J.C.; Romalis, M.V. A subfemtotesla multichannel atomic magnetometer. Nature 2003, 422, 596. [Google Scholar] [CrossRef] [PubMed]
- Sedlacek, J.A.; Schwettmann, A.; Kübler, H.; Löw, R.; Pfau, T.; Shaffer, J.P. Microwave electrometry with Rydberg atoms in a vapour cell using bright atomic resonances. Nat. Phys. 2012, 8, 819. [Google Scholar] [CrossRef]
- Anderson, D.A.; Raithel, G. Continuous-frequency measurements of high-intensity microwave electric fields with atomic vapor cells. Appl. Phys. Lett. 2017, 111, 053504. [Google Scholar] [CrossRef]
- Holloway, C.; Gordon, J.; Jefferts, S.; Schwarzkopf, A.; Anderson, D.; Miller, S.; Thaicharoen, N.; Raithel, G. Broadband Rydberg atombased electric-field probe for SI-traceable, self-calibrated measurements. IEEE Trans. Antennas Propag. 2014, 62, 6169. [Google Scholar] [CrossRef]
- Kumar, S.; Fan, H.; Kübler, H.; Jahangiri, A.J.; Shaffer, J.P. Rydberg-atom based radio-frequency electrometry using frequency modulation spectroscopy in room temperature vapor cells. Opt. Express 2017, 25, 008625. [Google Scholar] [CrossRef]
- Jing, M.Y.; Hu, Y.; Ma, J.; Zhang, H.; Zhang, L.J.; Xiao, L.T.; Jia, S.T. Atomic superheterodyne receiver based on microwave-dressed Rydberg spectroscopy. Nat. Phys. 2020. [Google Scholar] [CrossRef]
- Facon, A.; Dietsche, E.K.; Grosso, D.; Haroche, S.; Raimond, J.M.; Brune, M.; Gleyzes, S. A sensitive electrometer based on a Rydberg atom in a Schrodinger-cat state. Nature 2016, 535, 262. [Google Scholar] [CrossRef]
- Baluktsian, T.; Huber, B.; Löw, R.; Pfau, T. Evidence for strong van der Waals type Rydberg-Rydberg interaction in a thermal vapor. Phys. Rev. Lett. 2013, 110, 123001. [Google Scholar] [CrossRef]
- Kumar, S.; Fan, H.; Kübler, H.; Sheng, J.; Shaffer, J.P. Atom-based sensing of weak radio frequency electric fields using homodyne readout. Sci. Rep. 2017, 7, 42981. [Google Scholar] [CrossRef] [PubMed]
- Singer, K.; Stanojevic, J.; Weidemüller, M.; Cote, R. Long-range interactions between alkali Rydberg atom pairs correlated to the ns-ns, np-np and nd-nd asymptotes. J. Phys. B 2005, 38, S295. [Google Scholar] [CrossRef]
- Kübler, H.; Shaffer, J.P.; Baluktsian, T.; Löw, R.; Pfau, T. Coherent excitation of Rydberg atoms in micrometer-sized atomic vapour cells. Nat. Photon. 2010, 4, 112. [Google Scholar] [CrossRef]
- Sedlacek, J.A.; Kim, E.; Rittenhouse, S.T.; Weck, P.F.; Sadeghpour, H.R.; Shaffer, J.P. Electric field cancellation on quarta by Rb adsorbate-induced negative electron affinity. Phys. Rev. Lett. 2016, 116, 133201. [Google Scholar] [CrossRef]
- Weller, D.; Shaffer, J.P.; Pfau, T.; Löw, R.; Kübler, H. Interplay between thermal Rydberg gases and plasmas. Phys. Rev. A 2019, 99, 043418. [Google Scholar] [CrossRef]
- Letscher, F.; Thomas, O.; Niederprüm, T.; Fleischhauer, M.; Ott, H. Bistability versus metastability in driven dissipative Rydberg gases. Phys. Rev. X 2017, 7, 021020. [Google Scholar] [CrossRef]
- Barredo, D.; Kübler, H.; Daschner, R.; Löw, R.; Pfau, T. Electrical readout for coherent phenomena involving Rydberg atoms in thermal vapor cells. Phys. Rev. Lett. 2013, 110, 123002. [Google Scholar] [CrossRef]
- Nagesha, K.; MacAdam, K.B. Electron impact ionization of sodium Rydberg atoms below 2 eV. Phys. Rev. Lett. 2003, 91, 113202. [Google Scholar] [CrossRef]
- Deutsch, H.; MacAdam, K.; Becker, K.; Zhang, H.; Märk, T. Calculated cross sections for the electron-impact ionization of na (ns) and na (nd) Rydberg atoms. J. Phys. B 2005, 39, 343. [Google Scholar] [CrossRef]
- Weller, D.; Urvoy, A.; Rico, A.; Löw, R.; Kübler, H. Charge-induced optical bistability in thermal Rydberg vapor. Phys. Rev. A 2016, 94, 063820. [Google Scholar] [CrossRef]
- Kramers, H.A. XCIII. On the theory of X-ray absorption and of the continuous X-ray spectrum. Lond. Edinb. Dublin Phil. Mag. J. Sci. 1923, 46, 836. [Google Scholar] [CrossRef]
- Saffman, M.; Walker, T.G.; Mølmer, K. Quantum information with Rydberg atoms. Rev. Mod. Phys. 2010, 82, 2313. [Google Scholar] [CrossRef]
- Seaton, M.J. Quantum defect theory. Rep. Prog. Phys. 1983, 46, 167. [Google Scholar] [CrossRef]
- Lorenzen, C.J.; Niemax, K. Precise quantum defects of nS, nP and nD levels in Cs I. Z. Phys. Atoms Nucl. 1984, 315, 127. [Google Scholar] [CrossRef]
- Anderson, D.A.; Raithel, G.; Simons, M.; Holloway, C.L. Quantum-optical spectroscopy for plasma electric field measurements and diagnostics. arXiv 2017, arXiv:1712.08717v1. [Google Scholar]
- Taylor, D.R. Holtsmark electric field distributions and associated broadening effects due to charged defects in crystals. Can. J. Phys. 1978, 56, 1308. [Google Scholar] [CrossRef]
- Zimmerman, M.L.; Littman, M.G.; Kash, M.M.; Kleppner, D. Stark structure of the Rydberg states of alkali-metal atoms. Phys. Rev. A 1979, 20, 2251. [Google Scholar] [CrossRef]
- šibalić, N.; Pritchard, J.D.; Adams, C.S.; Weatherill, K.J. ARC: An open-source library for calculating properties of alkali Rydberg atoms. Comput. Phys. Commun. 2017, 220, 319–331. [Google Scholar] [CrossRef]
- Yang, B.D.; Gao, J.; Zhang, T.C.; Wang, J.M. Electromagnetically induced transparency without a Doppler background in a multilevel ladder-type cesium atomic system. Phys. Rev. A 2011, 83, 013818. [Google Scholar] [CrossRef]
- Yoon, T.H.; Park, C.Y.; Park, S.J. Laser-induced birefringence in a wavelength-mismatched cascade system of inhomogeneously broadened Yb atom. Phys. Rev. A 2004, 70, 061803. [Google Scholar] [CrossRef]
© 2020 by the authors. Licensee MDPI, Basel, Switzerland. This article is an open access article distributed under the terms and conditions of the Creative Commons Attribution (CC BY) license (http://creativecommons.org/licenses/by/4.0/).