Featured Application
This multiscale methodology allows the characterization of new steel fiber-reinforced concrete mixes and their structural performance.
Abstract
In this work we follow a multiscale methodology to characterize the structural performance of post-tensioned steel fiber-reinforced concrete dry joints. At the material level, we use an experimentally validated lattice-particle model whose input parameters are the properties of the different phases themselves (i.e., mortar, aggregates, fibers) and mixing information. This model is used to obtain the mechanical properties used in the structural-level simulations of the joints in terms of constitutive laws. The structural analyses are performed using the concrete damage plasticity model, which allows us to quantify the effect of fiber addition on the shear strength of the dry joints and their ductility. Our simulations agree well with other macroscopic models in the case of plain concrete and show, once again, that the American Association of State Highway Transportation Officials (AASHTO) code overestimates the nominal shear capacity of multiple-keyed joints. Regarding the fiber addition, we observe that it promotes an important increase in the shear capacity, but the prestress level is still more relevant in this sense. Based on our simulations, we propose an updated shear capacity estimate accounting for the fiber volume fraction. Finally, a clear increase in the ductility of the joint is observed when the fiber volume content is increased.
1. Introduction
Recent computational advances have led to a substantial improvement in numerical modeling of reinforced concrete structures. In this context, multiscale numerical strategies [1,2,3] are becoming widely extended as they help us better understand relevant physical phenomena that may take place at small scales of observation but evidenced at the macroscopic scale. Examples of this are concrete structures, whose structural performance depends on certain material properties linked to lower scales [4]. For instance, its mechanical properties are strongly dependent on microstructural features (e.g., degree of hydration, sieve curve, water to cement ratio), and their influence can be directly observed on the structural performance of concrete elements [5,6]. Therefore, it seems that advanced modeling techniques are useful for understanding the subjacent principles that govern their structural behavior, and thus, improve structural designs [7].
Multiscale approaches have been successfully implemented in a number of concrete applications such as material characterization [8,9,10] or structural evaluation in ordinary components, e.g., beams [11,12] or L-shaped slabs [13,14]. Nevertheless, its application in large concrete structures (e.g., bridges, pavements) is more recent, see for instance references [15,16]. It is within this new scenario that we present an application of multiscale analysis in large concrete structures, namely the numerical evaluation of the shear strength of dry joints between two segments in a post-tensioned concrete box girder.
Despite the fact that the shear capacity of the joint is crucial in the ultimate load of a bridge, formulations of different design codes cannot predict shear strength adequately [17,18,19,20]. This is due to the fact that these do not consider the dependence of the damage behavior on the number of keys [17]. Moreover, different studies [17,20,21,22] suggest that the American Association of State Highway Transportation Officials (AASHTO) code formula [23] underestimates the shear strength of multiple keys joints because the keys fail sequentially and cannot completely develop their capacity.
In this work we analyze, from a numerical point of view, the influence of the introduction of steel fibers on the shear capacity and ductility of the joints. It is well known that the addition of fibers to concrete structures increases their ductility [24]; therefore, it can alleviate the problem of sequential failure while increases the capacity of the joint. For this purpose, we propose a multiscale methodology based on reference [12], analyzing the effect of fiber volume fraction, as well as prestressing values and number of keys. Two scales are covered in this work to evaluate the structural performance of dry joints, which are described next.
The lowest scale of observation is the so-called mesoscale (i.e., ~1 mm). At this scale, we use the lattice-particle model developed by the authors [12], which accounts for mixing information such as water to cement (w/c) and aggregate to cement (a/c) ratios; sieve curve; fiber size, shape, orientation, and volume content; and mechanical properties such as elastic moduli or tensile strength of the different phases. Therefore, once the material information is known, it is possible to determine macroscopic properties that will be used at the structural level.
The highest scale of observation is the macroscale (i.e., ~1 m). At this scale we use the continuum damage plasticity (CDP) model [25], which is currently available in the commercial software Abaqus [26]. This type of models usually requires a large number of input parameters, which may not be always at hand. Although some of the data may be found in the literature, commonly from experimental tests, some information could be missing. In order to overcome the partial lack of the material information, an extensive virtual testing campaign, based on the material model, is proposed herein. Thus, the material information required at the macroscale can be derived from mesoscale simulations that are completed in terms of input parameters.
2. Multiscale Analysis of Fiber-Reinforced Concrete Structures
In this section we present the multiscale framework proposed for the analysis of steel fiber-reinforced concrete structures. This methodology has been successfully used in the design of cementitious composites, paying special attention to the improvement of the fracture properties of the resulting material [12,27]. In this work, we follow the same procedure for the analysis of steel fiber-reinforced concrete (SFRC) structures. Namely, we make use of a mesoscale lattice-particle model introduced in [27], which allows the introduction of fibers and extracts the material properties required by higher-scale models, such as that of the structure. Therefore, the structural behavior is characterized by means of finite element (FE) simulations whose material laws are based on lower-scale simulations.
2.1. Material Modeling of Steel Fiber-Reinforced Concrete (SFRC): Fiber-Reinforced Lattice-Particle Model
At the mesoscale, SFRC presents three well-distinguished materials phases: mortar, aggregates, and steel fibers. Moreover, in a close view, we can also identify two additional interfaces: mortar-aggregate, known as the interface transition zone (ITZ), which is a highly porous intermediate layer enclosing the aggregates; and fiber-matrix. Material properties such as the elastic modulus and tensile strength, or geometrical features such as the size or shape of these phases play an important role in the global response of SFRC. The lattice-particle model used in this work, which is described in detail in [27], accounts for this type of information.
The generation of virtual SFRC mesostructures can be accomplished by different means: computational models including relevant mixing information [9,10,28], simulations of the casting process [29], or digitalization of actual mesostructures via X-ray computed tomography [30]. In this work, we use computational models to generate virtual mesostructures resembling actual ones using input parameters such as the sieve curve, water to cement (w/c) ratio, or fiber size and shape.
In the first place, coarse aggregates are placed within the specimen using the take-and-place method [31], following a Fuller’s parabola for the sieve curve. The shape of the aggregates is assumed to be spherical, although other shapes are currently possible (e.g., convex polyhedra). Once the aggregates are correctly placed (no overlap is possible), we continue introducing the fibers, which are modeled as 1D elements with a specific length (Lf) and diameter (df), until a target volume fraction (Vf) is met. Fibers can be trimmed at the boundaries of the specimen. One important feature of fiber generation is the possibility to define a misorientation angle (θ), which controls the maximum misorientation angle of the fiber with respect to a specific casting direction, although the maximum misorientation observed experimentally is up to θ = 40° [32]. This allows accounting for different orientation levels, ranging from perfectly oriented to totally misoriented fibers with respect to the casting direction (Figure 1).
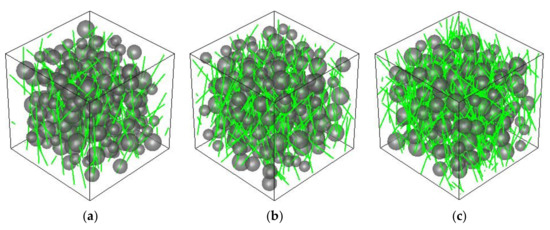
Figure 1.
Virtual generation of steel fiber-reinforced concrete (SFRC) specimens with size 50 × 50 × 50 mm3: (a) Vf = 0.5% and θ = 40°; (b) Vf = 1.0% and θ = 40°; (c) Vf = 1.5% and θ = 40°.
In the present formulation of the fiber-reinforced lattice-particle model, three different types of elements are defined, namely: matrix, fiber, and bond. Matrix elements account for the mechanical interactions that take place between aggregates, while the fiber elements accounts for the mechanical behavior of the fiber itself. The bond element represents the fiber–matrix interaction.
The nodes of the matrix elements correspond to the centroids of the aggregates and the interactions are identified using Delaunay’s triangulation. Their mechanical behavior is characterized by a pair of normal and tangential springs acting at the contact point, whose stiffnesses are:
where Eij is the elastic modulus of the matrix element, Aij is the cross-sectional area, Lij is the length of the element, and αn and αs are the so-called normal and shear adjustment parameters. For further details the reader is directed to [27].
Fiber elements are modeled as trusses (although bending behavior can be also taken into account, it is negligible) carrying out normal forces only:
where Ef is the elastic modulus of the fiber and Af is the cross-sectional area.
Regarding the bond elements, these represent the tangential behavior between the fiber and the matrix, and are modeled via shear elements:
where Eb is the elastic modulus of the contact zone, Ab is the contact area, and Lb the bond length, which depends on the position of the fiber and matrix nodes. It must be remarked that bond elements are typically adjusted through fiber pull-out simulations [12] and implicitly take into account the shape of the fiber. Although in our model we consider a constant bonding behavior along the length of the fiber, it is possible to define a non-uniform interaction to represent other type of shapes.
Every type of element has its own inelastic material law. In the case of matrix elements, we use a linear softening rule, defined by a tensile strength ft,m and fracture energy GF,m. For the bond and fiber elements, a general bilinear law, ranging from softening to hardening, is chosen, specified by shear stresses τ1 and τ2, and ultimate to inelastic strain ratio εf/εi. The material law is used together with a Mohr–Coulomb failure surface with tension cut-off and compression cap (as proposed in [33]). Figure 2 presents two examples of SFRC specimens under (double edge notch) tensile and compressive failure.
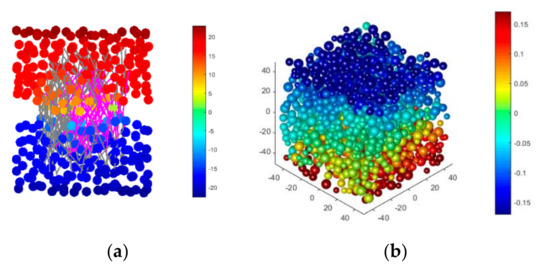
Figure 2.
Virtual testing of SFRC specimens: (a) double-edge-notched (DEN) uniaxial tension test; (b) uniaxial compression test. From [27].
2.2. Structural Modeling of Fiber-Reinforced Concrete Components: Concrete Damage Plasticity Model
We use the concrete damage plasticity (CDP) model by Lubliner et al. [25] to analyze the fracture behavior of keyed dry joints under shear. This material model, including the modifications by Lee and Fenves [34], is available in the commercial software Abaqus [26] and has been used successfully to simulate damage in reinforced concrete structures [35,36,37].
The CDP model combines isotropic elastic damage theory with isotropic tensile and compressive plasticity to model the inelastic behavior of concrete. This model is suitable for materials with quasi-brittle behavior, as well as for all kinds of elements (trusses, beams, plates, and solids). Furthermore, it is suitable for modeling for both plain and reinforced concrete and allows static, cyclic, and dynamic loads. Two main fracture mechanisms are considered in the CDP model: tensile cracking and compressive crushing. The evolution of the failure surface is controlled by two hardening variables: tensile and compressive equivalent plastic strains, and respectively. The continuum damage formulation in elasticity [38] can be expressed as:
where σ is the Cauchy stress tensor, d is the damage variable (which can be defined both for tension and compression, dt and dc, respectively), is the undamaged elastic stiffness tensor, ε is the total strain tensor and the inelastic strain tensor, which takes into account the irreversible nature of concrete cracking. For instance, in the case of uniaxial tension, the equivalent inelastic strain is defined as:
where ft is the tensile strength, E0 the undamaged elastic modulus, and the cracking strain defined as:
Although the application plotted in this work presents some important zones under compression (mainly due to prestressing), these are far from crushing whereas tensile cracking is the principal fracture mechanism. Such tensile behavior can be directly described by means of stress-cracking strain curves, for instance. In this work, we use a linear softening approximation defined in terms of the tensile strength (ft) and fracture energy (GF), which also reduces mesh-dependency [10].
Finally, the yield surface of the model depends on four parameters: dilation angles (ψ), eccentricity (ϵ), yield surface parameter (K), and compressive biaxial-to-uniaxial strength ratio (f).
2.3. Multiscale Analysis of SFRC Structures
The models described above can be used independently to characterize SFRC components, at the material and structure scales, respectively. Moreover, these can be combined in a sequential fashion, obtaining relevant material information required at the structural analysis, in a multiscale fashion. This approach is especially useful in materials design since the lack of material information can be overcome by virtual testing. For the sake of reliability, it is highly recommendable that the material model had been validated experimentally, as in our case.
To evaluate the influence of steel fiber reinforcement in concrete structures, we carry out FE simulations by means of the CDP model described in Section 2.2. As pointed out above, this model requires different elastic and inelastic material information. This material information will be provided by lower scale simulations using the fiber-reinforced lattice particle model described in Section 2.1. Thus, several virtual tests will be carried out at the material level, whose output information (e.g., elastic modulus, tensile strength) will feed the structure level simulations. Table 1 summarizes the virtual tests required to determine the information required at the structure level.

Table 1.
Summary of virtual tests with their corresponding inputs and outputs. Subscript: m-mortar, a-aggregate, f-fiber, b-bond.
Once the mix properties are defined (including the concrete composition and fiber distribution information), we can eventually carry out these tests in order to determine the homogenized material properties used in the structural simulations. We will set Vf as a design parameter and, consequently, the output parameters will be defined in terms of such a variable.
3. Application to SFRC Post-Tensioned Dry Joints
In this section we apply the methodology described in Section 2 to analyze the effect of steel fiber reinforcement in post-tensioned dry joints, evaluating the increase in the shear capacity of the joint and comparing it with respect to other design parameters such as the number of keys (Nk) or prestress value (σn).
3.1. Material Characterization of SFRC
In the first place, we carried out several numerical tests, as presented in Table 1, in order to determine the set of material properties required by the structural model, which are presented in Table 2.

Table 2.
Simulated elastic and inelastic properties for SFRC at different fiber volume fractions.
For the concrete mix, we considered a maximum aggregate size of 8 mm and a Fuller’s parabola with exponent 0.5 for the sieve curve. Coarse aggregate distributions with volume content of 40% were generated. The elastic properties used for the concrete matrix were Em = 20 GPa and Ea = 70 GPa, with parameters αn = 1 and αs = 0.2. Regarding the fracture properties, the following were used: ft,m = 4 MPa, fc,m = −48 MPa, cm = 8 MPa, φm = 35°, and GF,m = 10 N/m. Smooth steel fibers with Lf = 35 mm and df = 0.5 mm were randomly placed (θ = 60°) within the specimens, as in [27]. An elastic modulus Es = 210 GPa was used. The bond behavior was characterized by an elastic modulus of Eb = 5 GPa, shear stress pair of τ1 = 1 MPa and τ2 = 0.1 MPa, and ratio εf/εi = 15. The following values of Vf were considered: 0.0%, 0.5%, 1.0%, and 1.5%.
The elastic and inelastic properties determined by through the uniaxial tensile and compressive tests are presented in Table 2. The raw data is fitted using a linear model dependent on Vf, determining the elastic modulus (E), tensile and compressive strength (ft and fc, respectively), and mode I fracture energy (GF) of the resulting SFRC material.
3.2. Structural Characterization of the Dry Joint
Several models of a dry joint, with three and five keys, were analyzed. The models are based on the experimental shear test carried out by Zhou for one-keyed joint and three-keyed joint, and including a five-keyed joint FE model analyzed by Alcalde et al. [17,21]. The overall dimensions of the three keys specimen are 900 × 950 mm2, and 1600 × 1700 mm2 in the case of the five keys specimen, with 250 mm thickness in both cases, as depicted in Figure 3. The keys are displayed at a distance of 100 mm between them, and have a penetration length of 50 mm.
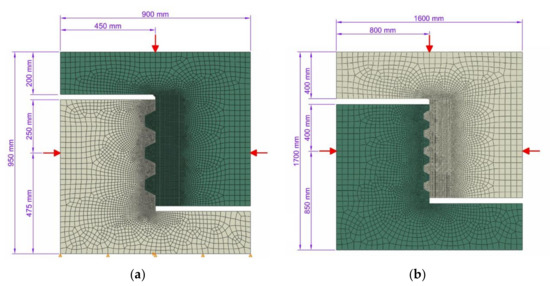
Figure 3.
Scheme of the dry joints: (a) Nk = 3 configuration; (b) Nk = 5 configuration [17].
For the FE discretization, four-node bilinear plane stress elements with reduced integration and with hourglass control (CPS4R) have been used, with an average element size of 10 mm. The mesh is refined in the area where cracking is expected, using an element size of 4.5 mm.
The boundary conditions applied to the bottom surface do not allow vertical displacements. Additionally, the horizontal displacement of a central node was restrained. In a first step, the confining prestress was applied via two external loads on both edges of the model, compressing the joint. In a subsequent step, a vertical load was applied in the central point of the upper surface by imposing a vertical displacement, rising from zero to the value that causes the failure of the joint.
Hard contact model has been used in the surface normal direction to model the contact. It allows the separation between the surfaces and does not permit penetration. The tangential behavior is based on the Coulomb friction model. A value of μ = 0.72 was assigned to the friction coefficient, according to the experimental results by Zhou [20].
A total number of 40 simulations were carried out in Abaqus/Explicit [26], accounting for three different design parameters: (i) fiber volume fraction (Vf = 0, 0.5, 1.0, and 1.5%); (ii) number of keys (Nk = 3 and 5); and (iii) prestress (σn = 0.5, 1, 1.5, 2, and 3 MPa). From these simulations, we can obtain, among other variables, the shear capacity (i.e., the vertical force at which the joint starts to fail), tensile damage distribution or equivalent plastic strains, as well as the crack patterns within the joint. The effect of the aforementioned design parameters (Vf, Nk, and σn) on these output variables at the structure level are presented and discussed in the next section.
4. Influence on the Shear Strength of SFRC Post-Tensioned Dry Joints
4.1. Influence of the Number of Keys
The number of keys in the joint, Nk, is one of the most influential design parameters regarding the shear capacity of the joint. Although code formulae, such as that from AASHTO [23], may only take into account the average shear stress by considering the base and contact areas of the joint plane, Ak and Asm. However, this approach overestimates the actual capacity of a joint with multiple keys. This is due to the fact that the AASHTO formula considers that the capacity of a key in a multiple-keyed joint is the same as that of a single-keyed joint. However, it does not take into account that, due to sequential failure of keys, not all the keys can fully develop their capacity in multiple-keyed joints [17,21], and some works already remark on the influence of Nk. This was studied in [17] and a new formula for the estimation of the shear capacity was proposed in terms of Nk and σn, and the base and contact areas of the joint plane, Ak and Asm, respectively:
Equation (8) was obtained by fitting the numerical results using a smeared cracking model [39] for plain concrete. In this study, however, we use the CDP model. Both models are compared in Figure 4, for the case of no fibers (Vf = 0.0%). As we can see in this figure, all models follow the same trend: the shear capacity of the joint, Vn, increases with the prestress σn. However, it can be seen that the CDP model exhibits lower estimates for Vn than those by the smeared cracking model from Alcalde et al. [17].
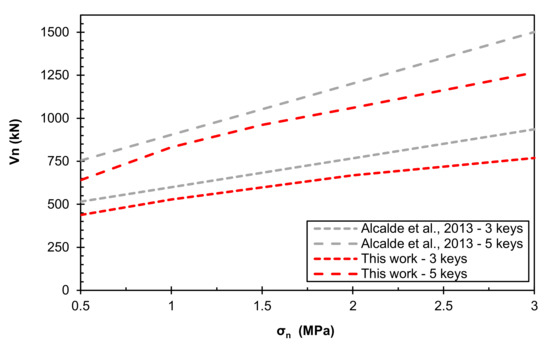
Figure 4.
Nominal shear capacity as a function of prestress, Vf = 0.0%.
The number of keys has a strong influence on the shear capacity, higher values of Nk leads to higher shear capacities. From our simulations, we can quantify increments of 57.6% in average when increasing the number of keys from 3 to 5. Obviously, the higher Nk, the higher Ak. However, if we compute the unitary shear strength, i.e., the nominal shear divided by the number of keys (Vun = Vn/Nk), we observe that this value decreases as Nk increases (Figure 5). This is due to the sequential failure, i.e., not all the keys develop their full capacity.
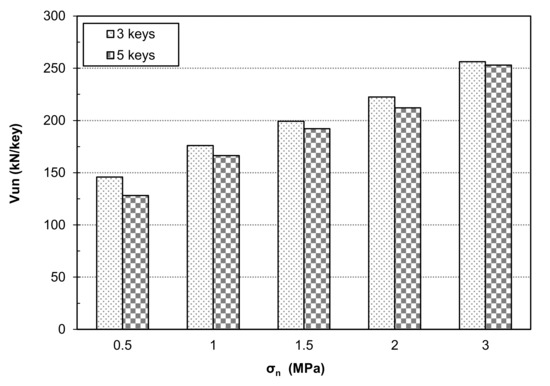
Figure 5.
Effect of the number of keys on unitary shear capacity (Vn/Nk) for Vf = 0.0% and different prestress values.
4.2. Influence of the Prestressing Values
The prestress value σn is another important parameter that affects the shear capacity of the joint. In Figure 6, we compare the effect of the prestress value without fiber reinforcement (Vf = 0.0%) with respect to other results reported in the literature for 5 keys. As expected, an increase in σn supposes an increase in Vn. Our results are clearly below the prediction by AASHTO [23] and also Alcalde et al. [17]. Among all the models analyzed, that by ATEP [40] is the lowest one (thus, being more conservative). We also include the estimates for Nk = 5 and Vf = 0.5%, which is the lowest fraction considered in the study, to distinguish the actual effect of fibers. It can be clearly seen that the introduction of fibers increases the shear capacity with respect to the plain concrete mix. This is analyzed in more detail in Section 4.3.
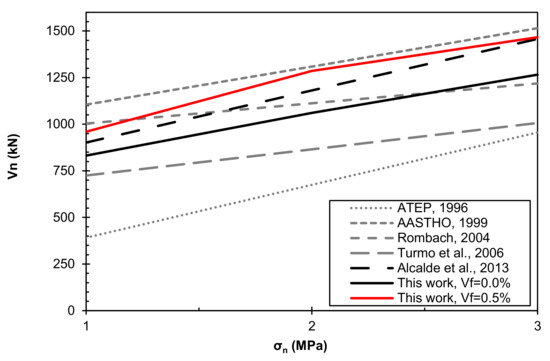
Figure 6.
Comparison of different models to estimate the nominal shear capacity in terms of the prestress value, Nk = 5, Vf = 0.0 and 0.5% (numerical prediction).
4.3. Influence of the Introduction of Fibers
As pointed out above, the addition of fibers increases the shear capacity. For instance, an increase of 0.5% in the fiber content (i.e., Vf = 0.5%) promotes an increase of c.a. 18.4% of Vn, in average and both cases of Nk. This increment is substantial, yet smaller when compared to the effect of Nk or σn. Figure 7 presents the numerical estimates for the shear capacity in terms of σn in the case of 5 keys. It becomes evident that the use of steel fibers leads to an increase of Vn, as expected.
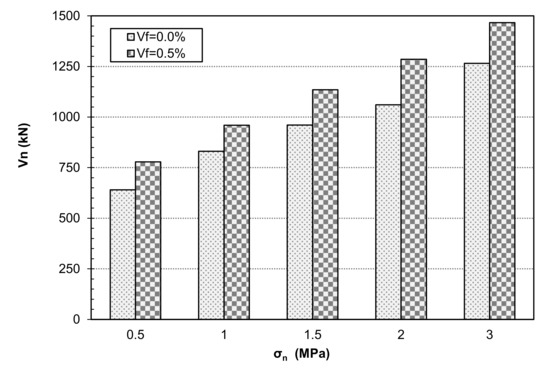
Figure 7.
Effect of the use of fibers on the nominal shear capacity in terms of the prestress, Nk = 5.
4.4. Influence of the Fiber Volume Fraction
Once we have determined the influence of the introduction of fibers, we analyze the effect of the increase of Vf. Figure 8 presents the influence of this parameter, for different values of Nk and σn. We observe that the substantial change takes place within the 0.0% to 0.5% range. However, an increase of Vf from this point will present a limited effect on the shear capacity, of up to 3% in further mixes.
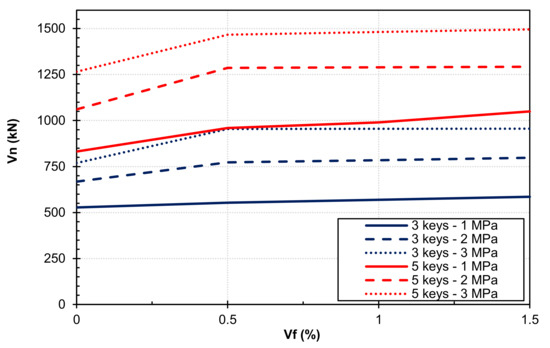
Figure 8.
Nominal shear capacity in terms of Vf and Nk.
Regarding the damage distribution within the joint, as observed in Figure 9 and Figure 10, an increase of Vf will lead to less prominent and wider damaged zones, as a result of the ductility provided by the fibers. Therefore, although the influence of Vf on the shear capacity is somehow limited after a certain fraction, the structure becomes more ductile. Also, Nk is an important factor since the damage distribution is less prominent in the case of Nk = 5 (Figure 10).
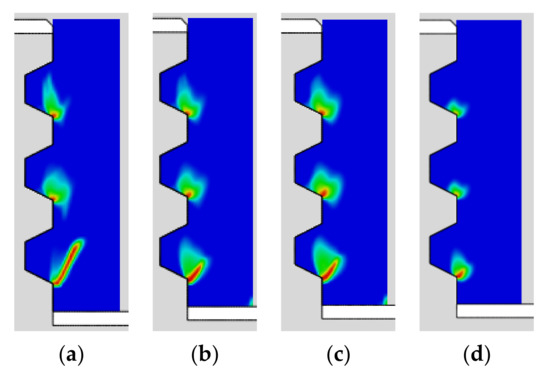
Figure 9.
Damage evolution in a 3-keyed joint with σn = 0.5 MPa: (a) Vf = 0.0%; (b) Vf = 0.5%; (c) Vf = 1.0%; (d) Vf = 1.5%.
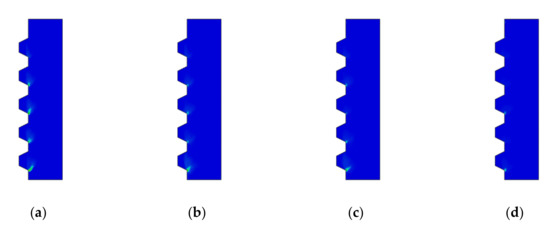
Figure 10.
Damage evolution in a 5-keyed joint with σn = 0.5 MPa: (a) Vf = 0.0%; (b) Vf = 0.5%; (c) Vf = 1.0%; (d) Vf = 1.5%.
Finally, the crack patterns are also affected by this increase of Vf. As observed in Figure 11 and Figure 12, for lower values of Vf, several larger cracks develop. The ductility provided by the increase of Vf has a restraining effect, as well as Nk (Figure 13).
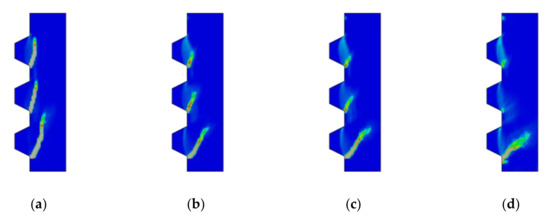
Figure 11.
Crack pattern evolution in a 3-keyed joint with Vf = 0.0%: (a) σn = 0.5 MPa; (b) σn = 1.5 MPa; (c) σn = 2.0 MPa; (d) σn = 3.0 MPa.
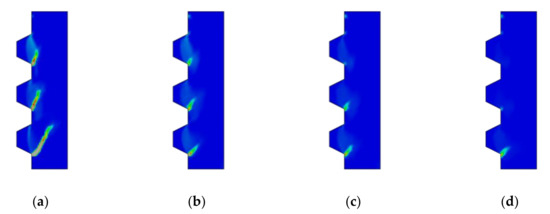
Figure 12.
Crack pattern evolution in a 3-keyed joint with σn = 1.5 MPa: (a) Vf = 0.0%; (b) Vf = 0.5%; (c) Vf = 1.0%; (d) Vf = 1.5%.
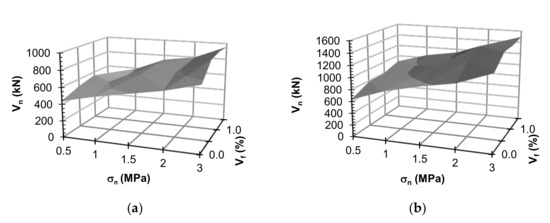
Figure 13.
Nominal shear capacity in terms of prestress and fiber volume fraction: (a) Nk = 3, (b) Nk = 5.
4.5. Identification of a New Law for Estimating Vn in SFRC
The numerical simulations carried out provide Vn surfaces in terms of the three chosen design parameters: Nk, σn, and Vf. In Figure 13 we present Vn in terms of σn and Vf for Nk = 3 and Nk = 5, respectively. We can observe in both plots that the influence of σn is practically linear, while the influence of Vf resembles bilinear behavior. As discussed above, the increase of Vf saturates the shear capacity, which is a strength parameter, although the ductility of the structure increases. These two surfaces are fitted using linear regression to provide an updated formula to that from [17] in the case of SFRC, but accounting for the fiber volume fraction:
where Ak and Asm are in mm2, σn in MPa, Vf is a fraction of unity, and Vn in N. It must be remarked that this formula is only valid for the SFRC mix used in this work; however, it is provided to highlight the design potential of the methodology proposed herein.
5. Conclusions
In this work, we have presented a multiscale methodology for the assessment of the performance of steel-fiber reinforced concrete structures. We combine a material model to obtain the macroscopic properties, both elastic and fracture, and a structural model to quantify the effect of fiber addition. We apply this numerical approach for the analysis of post-tensioned SFRC dry joints, showing the ability of the framework to take into account different material compositions (e.g., concrete mix, fiber volume fraction) up to the macroscale, evaluating the shear capacity and ductility of the joint. This is remarkable since different design codes have proven to fail when predicting the shear strength and, most important, overestimate it in some cases.
The results obtained for the nominal shear capacity of the joint are in agreement with other works in the literature in the case of no fiber addition. We report an increase of 57.6% of the shear capacity on average, when increasing the numbers of keys from 3 to 5.
We have used this experimentally validated methodology to measure the effect of fiber addition in the structural performance. From our numerical simulations we observe that the addition of fibers increases the nominal shear capacity of the joint. In this sense, adding 0.5% of steel fibers, from a plain mix, leads to an average increase of 18.4% of the shear capacity. Further additions have less influence (of ca. 3%). Also, we propose an updated formula to that by Alcalde et al. [17] but accounting for the volume fraction of fibers. However, the prestress value happens to be more influential on the shear capacity.
Regarding the damage distribution, we observe a clear rise in ductility when the fiber content increases. This helps distribute better the shear capacity of the multiple keys. Fibers located at hot spots help arrest cracks, providing a more ductile response. Therefore, fibers could only be placed close the contact zone.
The simulations presented in this study are only limited to one type of steel fiber. Thus, further investigations should be towards the analyses of different types of fiber mixes and other reinforced concrete structures (e.g., monitoring damage in girder box bridges, structural assessment of prestressed storage tanks, optimization of tunnel lining segment designs), since our methodology can be used without any loss of generality.
Author Contributions
Conceptualization, F.M.-C. and M.A.; methodology, F.M.-C. and H.C.; material simulations, F.M.-C.; structural simulations, J.M.-M. and M.A.; data processing, J.M.-M.; computer infrastructures and experimental data, H.C. All the authors wrote the manuscript. All authors have read and agreed to the published version of the manuscript.
Funding
This research received partial funding from the project BIA2016-75431-R (Ministry of Economy and Competitiveness of Spain). The APC was funded by Universidad Loyola Andalucía.
Acknowledgments
The authors acknowledge all the funding provided for the development of the research reported in this study.
Conflicts of Interest
The authors declare no conflict of interest.
References
- Feyel, F. Multiscale FE2 elastoviscoplastic analysis of composite structures. Comput. Mater. Sci. 1999, 16, 344–354. [Google Scholar] [CrossRef]
- Kouznetsova, V.; Brekelmans, W.A.M.; Baaijens, F.P.T. An approach to micro-macro modeling of heterogeneous materials. Comput. Mech. 2001, 27, 37–48. [Google Scholar] [CrossRef]
- Miehe, C.; Koch, A. Computational micro-to-macro transitions of discretized microstructures undergoing small strains. Arch. Appl. Mech. 2002, 72, 300–317. [Google Scholar] [CrossRef]
- Van Mier, J.G.M. Fracture Processes of Concrete; CRC Press: Boca Raton, FL, USA, 2017; ISBN 978-0-203-75676-8. [Google Scholar]
- Van Mier, J.G.M. Concrete Fracture: A Multiscale Approach; CRC Press: Boca Raton, FL, USA, 2012; ISBN 978-0-429-09805-5. [Google Scholar]
- Maekawa, K.; Ishida, T.; Kishi, T. Multi-Scale Modeling of Concrete Performance. J. Adv. Concr. Technol. 2003, 1, 91–126. [Google Scholar] [CrossRef]
- Bazant, Z.P. Can Multiscale-Multiphysics Methods Predict Softening Damage and Structural Failure? Int. J. Multiscale Comput. Eng. 2010, 8, 61–67. [Google Scholar] [CrossRef]
- Kim, S.-M.; Abu Al-Rub, R.K. Meso-scale computational modeling of the plastic-damage response of cementitious composites. Cem. Concr. Res. 2011, 41, 339–358. [Google Scholar] [CrossRef]
- Wriggers, P.; Moftah, S.O. Mesoscale models for concrete: Homogenisation and damage behaviour. Finite Elem. Anal. Des. 2006, 42, 623–636. [Google Scholar] [CrossRef]
- Montero-Chacón, F.; Marín-Montín, J.; Medina, F. Mesomechanical characterization of porosity in cementitious composites by means of a voxel-based finite element model. Comput. Mater. Sci. 2014, 90, 157–170. [Google Scholar] [CrossRef]
- Cusatis, G.; Cedolin, L. Two-scale study of concrete fracturing behavior. Eng. Fract. Mech. 2007, 74, 3–17. [Google Scholar] [CrossRef]
- Montero-Chacón, F.; Schlangen, E.; Cifuentes, H.; Medina, F. A numerical approach for the design of multiscale fibre-reinforced cementitious composites. Philos. Mag. 2015, 95, 3305–3327. [Google Scholar] [CrossRef]
- Eckardt, S.; Könke, C. Adaptive Damage Simulation of Concrete Using Heterogeneous Multiscale Models. J. Algorithms Comput. Technol. 2008, 2, 275–298. [Google Scholar] [CrossRef]
- Lloberas-Valls, O.; Rixen, D.J.; Simone, A.; Sluys, L.J. Domain decomposition techniques for the efficient modeling of brittle heterogeneous materials. Comput. Methods Appl. Mech. Eng. 2011, 200, 1577–1590. [Google Scholar] [CrossRef]
- Jendele, L.; Šmilauer, V.; Červenka, J. Multiscale hydro-thermo-mechanical model for early-age and mature concrete structures. Adv. Eng. Softw. 2014, 72, 134–146. [Google Scholar] [CrossRef]
- Chen, L.; Qian, Z.; Wang, J. Multiscale Numerical Modeling of Steel Bridge Deck Pavements Considering Vehicle–Pavement Interaction. Int. J. Geomech. 2016, 16, B4015002. [Google Scholar] [CrossRef]
- Alcalde, M.; Cifuentes, H.; Medina, F. Influencia del número de llaves en la resistencia a cortante de juntas secas postensadas. Mater. Constr. 2013, 63, 297–307. [Google Scholar] [CrossRef]
- Turmo, J.; Ramos, G.; Aparicio, A.C. Resistencia de juntas secas conjugadas de puentes de dovelas prefabricadas de hormigón: Propuesta para el Eurocódigo 2. Mater. Constr. 2006, 56, 45–52. [Google Scholar] [CrossRef]
- Rombach, G.A. Dry Joint Behavior of Hollow Box Girder Segmental Bridges Design of Unreinforced Joints. In Proceedings of the FIP Symposium “Segmental Construction in Concrete”, New Delhi, India, 26–29 November 2004; pp. 26–29. [Google Scholar]
- Zhou, X.; Mickleborough, N.; Li, Z. Shear strength of joints in precast concrete segmental bridges. ACI Struct. J. 2005, 102, 3–11. [Google Scholar] [CrossRef]
- Turmo, J.; Ramos, G.; Aparicio, Á.C. Shear strength of joints in precast concrete segmental bridges. ACI Struct. J. 2005, 102, 901–904. [Google Scholar]
- Shamass, R.; Zhou, X.; Alfano, G. Finite-Element Analysis of Shear-Off Failure of Keyed Dry Joints in Precast Concrete Segmental Bridges. J. Bridge Eng. 2015, 20, 04014084. [Google Scholar] [CrossRef]
- AASHTO. Guide Specifications for Design and Construction of Segmental Concrete Bridges, 2nd ed.; American Association of State Highway and Transportation Officials: Washington, DC, USA, 1999; ISBN 5-9604-5804-7. [Google Scholar]
- Bentur, A.; Mindess, S. Fibre Reinforced Cementitious Composites, 2nd ed.; CRC Press: Boca Raton, FL, USA, 2006; ISBN 978-0-203-08872-2. [Google Scholar]
- Lubliner, J.; Oliver, J.; Oller, S.; Oñate, E. A plastic-damage model for concrete. Int. J. Solids Struct. 1989, 25, 299–326. [Google Scholar] [CrossRef]
- SIMULIA Corp. Abaqus Analysis User’s Guide; SIMULIA Corp: Johnston, RI, USA, 2016. [Google Scholar]
- Montero-Chacón, F.; Cifuentes, H.; Medina, F. Mesoscale Characterization of Fracture Properties of Steel Fiber-Reinforced Concrete Using a Lattice–Particle Model. Materials 2017, 10, 207. [Google Scholar] [CrossRef] [PubMed]
- Kang, J.; Bolander, J.E. Multiscale modeling of strain-hardening cementitious composites. Mech. Res. Commun. 2016, 78, 47–54. [Google Scholar] [CrossRef]
- Gudžulić, V.; Dang, T.S.; Meschke, G. Computational modeling of fiber flow during casting of fresh concrete. Comput. Mech. 2019, 63, 1111–1129. [Google Scholar] [CrossRef]
- Du Plessis, A.; Boshoff, W.P. A review of X-ray computed tomography of concrete and asphalt construction materials. Constr. Build. Mater. 2019, 199, 637–651. [Google Scholar] [CrossRef]
- De Schutter, G.; Taerwe, L. Random particle model for concrete based on Delaunay triangulation. Mater. Struct. 1993, 26, 67–73. [Google Scholar] [CrossRef]
- Laranjeira, F.; Grünewald, S.; Walraven, J.; Blom, C.; Molins, C.; Aguado, A. Characterization of the orientation profile of steel fiber reinforced concrete. Mater. Struct. 2011, 44, 1093–1111. [Google Scholar] [CrossRef]
- Bolander, J.E.; Saito, S. Fracture analyses using spring networks with random geometry. Eng. Fract. Mech. 1998, 61, 569–591. [Google Scholar] [CrossRef]
- Lee, J.; Fenves, G.L. Plastic-Damage Model for Cyclic Loading of Concrete Structures. J. Eng. Mech. 1998, 124, 892–900. [Google Scholar] [CrossRef]
- Cifuentes, H.; Montero-Chacón, F.; Galán, J.; Cabezas, J.; la Concha, A.M.-D. A Finite Element-Based Methodology for the Thermo-mechanical Analysis of Early Age Behavior in Concrete Structures. Int. J. Concr. Struct. Mater. 2019, 13, 41. [Google Scholar] [CrossRef]
- Genikomsou, A.S.; Polak, M.A. Finite element analysis of punching shear of concrete slabs using damaged plasticity model in ABAQUS. Eng. Struct. 2015, 98, 38–48. [Google Scholar] [CrossRef]
- Shokoohfar, A.; Rahai, A. Nonlinear analysis of pre-stressed concrete containment vessel (PCCV) using the damage plasticity model. Nucl. Eng. Des. 2016, 298, 41–50. [Google Scholar] [CrossRef]
- Kachanov, M. Continuum Model of Medium with Cracks. J. Eng. Mech. Div. 1980, 106, 1039–1051. [Google Scholar]
- Rots, J.G.; Nauta, P.; Kuster, G.M.A.; Blaauwendraad, J. Smeared Crack Approach and Fracture Localization in Concrete. HERON 1985, 30, 1–48. [Google Scholar]
- Colegio de Ingenieros de Caminos, Canales y Puertos (Madrid); Asociación Técnica Española del Pretensado; Instituto de Ciencias de la Construcción Eduardo Torroja. Proyecto y Construcción de Puentes y Estructuras con Pretensado Exterior: H.P. 10-96; Colegio de Ingenieros de Caminos, Canales y Puertos: Madrid, Spain, 1996; ISBN 84-380-0120-3. [Google Scholar]
© 2020 by the authors. Licensee MDPI, Basel, Switzerland. This article is an open access article distributed under the terms and conditions of the Creative Commons Attribution (CC BY) license (http://creativecommons.org/licenses/by/4.0/).