Article

A Hybrid Diffractive Optical Element Design Algorithm Combining Particle Swarm Optimization and a Simulated Annealing Algorithm

1
Shenzhen International Graduate School, Tsinghua University, Shenzhen 518055, China
2
Department of Precision Instrument, Tsinghua University, Beijing 100084, China
*
Author to whom correspondence should be addressed.
Appl. Sci. 2020, 10(16), 5485; https://doi.org/10.3390/app10165485
Submission received: 12 July 2020 / Revised: 31 July 2020 / Accepted: 5 August 2020 / Published: 7 August 2020
(This article belongs to the Special Issue Practical Computer-Generated Hologram for 3D Display)

Abstract

:
With the rapid development of computer hardware and the emergence of the parallel calculation of diffraction fields, a breakthrough has been made in terms of the limitation of the unacceptable amount of computational cost to design diffractive optical elements (DOEs), and more accurate global search algorithms can be introduced to the design of complex DOEs and holographic projections instead of traditional iterative algorithms. In this paper, a hybrid algorithm which combines particle swarm optimization (PSO) with a simulated annealing (SA) algorithm is proposed for the designing of DOEs and projecting holographic images with less noise. PSO is used to reduce the invalid disturbance in SA, and SA can jump out from local extreme points to find the global extreme points. Compared with the traditional Gerchberg–Saxton (GS) algorithm, the simulation and experimental results demonstrate that the proposed SA–PSO hybrid algorithm can improve uniformity by more than 10%.

1. Introduction

Diffractive optical elements (DOEs) have already played an important role in the fields of laser collimation [1,2], optical storage [3,4], projection systems [5,6,7], infrared focal plane arrays [8,9], bioimaging [10,11], terahertz [12], and so forth. However, the diffracted light pattern of the DOEs is not accurate due to the errors in design, fabrication and other factors. Among these factors, the impact of the design is particularly important. Basically, there are two methods for designing DOEs, one is a direct calculation based on single inverse diffraction, and the other is phase retrieval. The quality of the reconstruction is determined by the phase retrieval method being better than the single inverse diffraction method. The design accuracy of traditional phase retrieval algorithms, for example, the Gerchberg–Saxton (GS) algorithm [13,14] and its modified versions [15,16,17,18], and the Yang–Gu algorithm [19,20], is relatively low, because such algorithms tend to fall into local extreme points and cannot jump out, leading to a failure in terms of good design performance. For the DOEs designed by the above algorithm, the diffraction pattern is often poor in uniformity, with more noise. Furthermore, maskless lithography [21] and 3D printing based on photopolymer resins [22,23] need higher accurate and uniform exposure patterns as much as possible, which are formed by a liquid crystal on silicon chips (LCoS; work as dynamic DOEs). Hence, in the case that traditional design methods cannot meet the accuracy and uniformity requirement, it is necessary to explore new design methods.
The search algorithms, including local search algorithms and global search algorithms, theoretically can get a better solution, compared with the traditional iterative algorithms. However, the former, including the steepest descent [24], conjugate gradient [25], and direct binary search (DBS) [26] algorithms, tend to fall into local extreme points and cannot jump out. The latter mainly includes the simulated annealing (SA) algorithm [27], genetics algorithm (GA) [28,29,30], particle swarm optimization (PSO) [31,32,33], etc. Because the SA algorithm needs to search enough time at each synthetic temperature to reach the global optimal solution, the entire annealing process is extremely time consuming. The GA has fast and random search capabilities and potential parallel computing possibilities, however, the convergent effect is highly dependent on the initial parameters set by experience and the choice of initial values. Although the PSO has certain intelligence that can make it perform exceptionally well when solving continuous function optimization problems, when it is used to design DOEs, PSO is proven to be premature, i.e., it has a poor local search ability. Generally speaking, in order to improve the quality of holographic projection, a hybrid search algorithm is needed to devise the design of DOEs with better performances.
In this paper, we propose a hybrid algorithm combining PSO with SA, named the SA–PSO hybrid algorithm, which overcomes the time-consuming and low-efficiency random disturbances, and avoids falling into local optimal solutions. The simulation result shows that the performance has been improved compared with the traditional GS algorithm.
The rest of the paper is organized as follows. In Section 2, the SA–PSO hybrid algorithm for designing DOEs is proposed. We use a flow chart to illustrate how the algorithm works. In Section 3, we use the SA–PSO hybrid algorithm to shape a plane wave into a Gaussian beam, and the results show a better uniformity than the GS algorithm. Section 4 presents the experiments to verify the good performance of the SA–PSO algorithm in optimizing the uniformity of the diffraction pattern. Finally, the conclusions are presented in Section 5.

2. Algorithm

The cost function of the SA–PSO hybrid algorithm is the distance between the target light intensity and the intensity diffracted by the calculated DOE, as defined by Equation (1).
f = m , n = 1 m = M , n = N ( I m , n I m , n , e x ) 2
where I m , n is the intensity diffracted by the calculated DOE, I m , n , e x is the expected target light intensity, and M and N represent the number of rows and columns of the matrix, respectively.
During the annealing process, the initial solution and the new solution after random perturbation are compared by using an acceptance probability term. According to the Metropolis principle [34], the acceptance probability P t is related to the current synthetic temperature t .
P t ( i j ) = { 1                                 f j f i                                 e x p [ f i f j t ]               f j > f i
where f i is the cost function value of the solution before the disturbance, and f j is the cost function value of the new solution. It should be noted that, the “solution” represents the phase distribution of the DOE. The light intensity distribution on the target plane is calculated from a forward diffraction from the phase distribution of the DOE, and then f can be obtained by using Equation (1). The diffraction model can be the angular spectrum, the Fresnel or the Fraunhofer, depending on the distance from the DOE to the target plane [35]. By using the Metropolis principle, it is more likely to accept worse solutions at higher synthetic temperatures, but almost only better solutions can be accepted at lower synthetic temperatures. We set a disturbance coefficient l a to control the disturbance’s severity.
l a = α × t + β
where α is the linear attenuation coefficient and β represents the smallest disturbance value. Through adjusting the values of α and β , intense disturbances at higher synthetic temperatures and slow disturbances at lower synthetic temperatures can be obtained. In this way, the initial particle swarm at synthetic temperature t is obtained, and the size of particle swarm is 30. The choice of α and β depends on the initial synthetic temperature and the ending synthetic temperature. If the linear change strategy in Equation (3) is used, the values of α and β can be calculated by the method of undetermined coefficients.
In the PSO process, the cost function in Equation (1) is still used to evaluate the initialized population, and then the population is updated according to the following rules:
V i d ( n + 1 ) = ω V i d ( n ) + C 1 × ϕ 1 × ( P i d X i d ( n ) ) + C 2 × ϕ 2 × ( P g d X i d ( n ) )
X i d ( n + 1 ) = X i d ( n ) + V i d ( n + 1 )
where ω is the variable speed update rate, which denotes that the new generation of particle swarms is affected by the overall speed of the previous generation. The value of 𝜔 is a constant between 0.8 and 1.2 based on experience. P i d is the optimal solution of single particles and P g d is the optimal solution of particle swarms. C 1 and C 2 are constants between 1 and 2, which respectively represent the influence weight of P i d and P g d on V i d ( n + 1 ) , the larger value, with the greater influence on V i d ( n + 1 ) . ϕ 1 and ϕ 2 are random numbers between 0 and 1, randomly changed in every updating in PSO. X i d ( n ) represents the solution, i.e., the phase distribution of the DOE obtained after the n-th update. V i d ( n + 1 ) represents the amount of change when X i d ( n ) is updated.
The disturbance coefficient l a is also introduced to ensure that the first several evolutions can shuttle quickly in the solution space, while later evolutions can search finely in the solution space at a slower speed. It should be pointed out that the random perturbation strategy is where the number of random disturbance points decreases linearly with a decreasing synthetic temperature. This strategy is similar to the annealing process, which is fast at the beginning of the search, but becomes stable at the end of the search.
In theory, C1 and C2 will affect the local search ability and global search ability of the particle swarm algorithm; the higher the number of particles, the larger the search range, and the more likely it is to get the global optimal solution. However, the results of searching algorithms are uncertain, and it is impossible to obtain the best parameter value strictly by a mathematical formula. Therefore, we have explored the law through many calculations, and given the parameter values that meet our requirements based on experience.
We use a flow chart to illustrate how the algorithm works, as shown in Figure 1. The algorithm stops running when one of the following two conditions happens. The first is that the calculation value reaches the threshold close to the target value, and the second is that the number of loops reaches the maximum.

3. Simulation

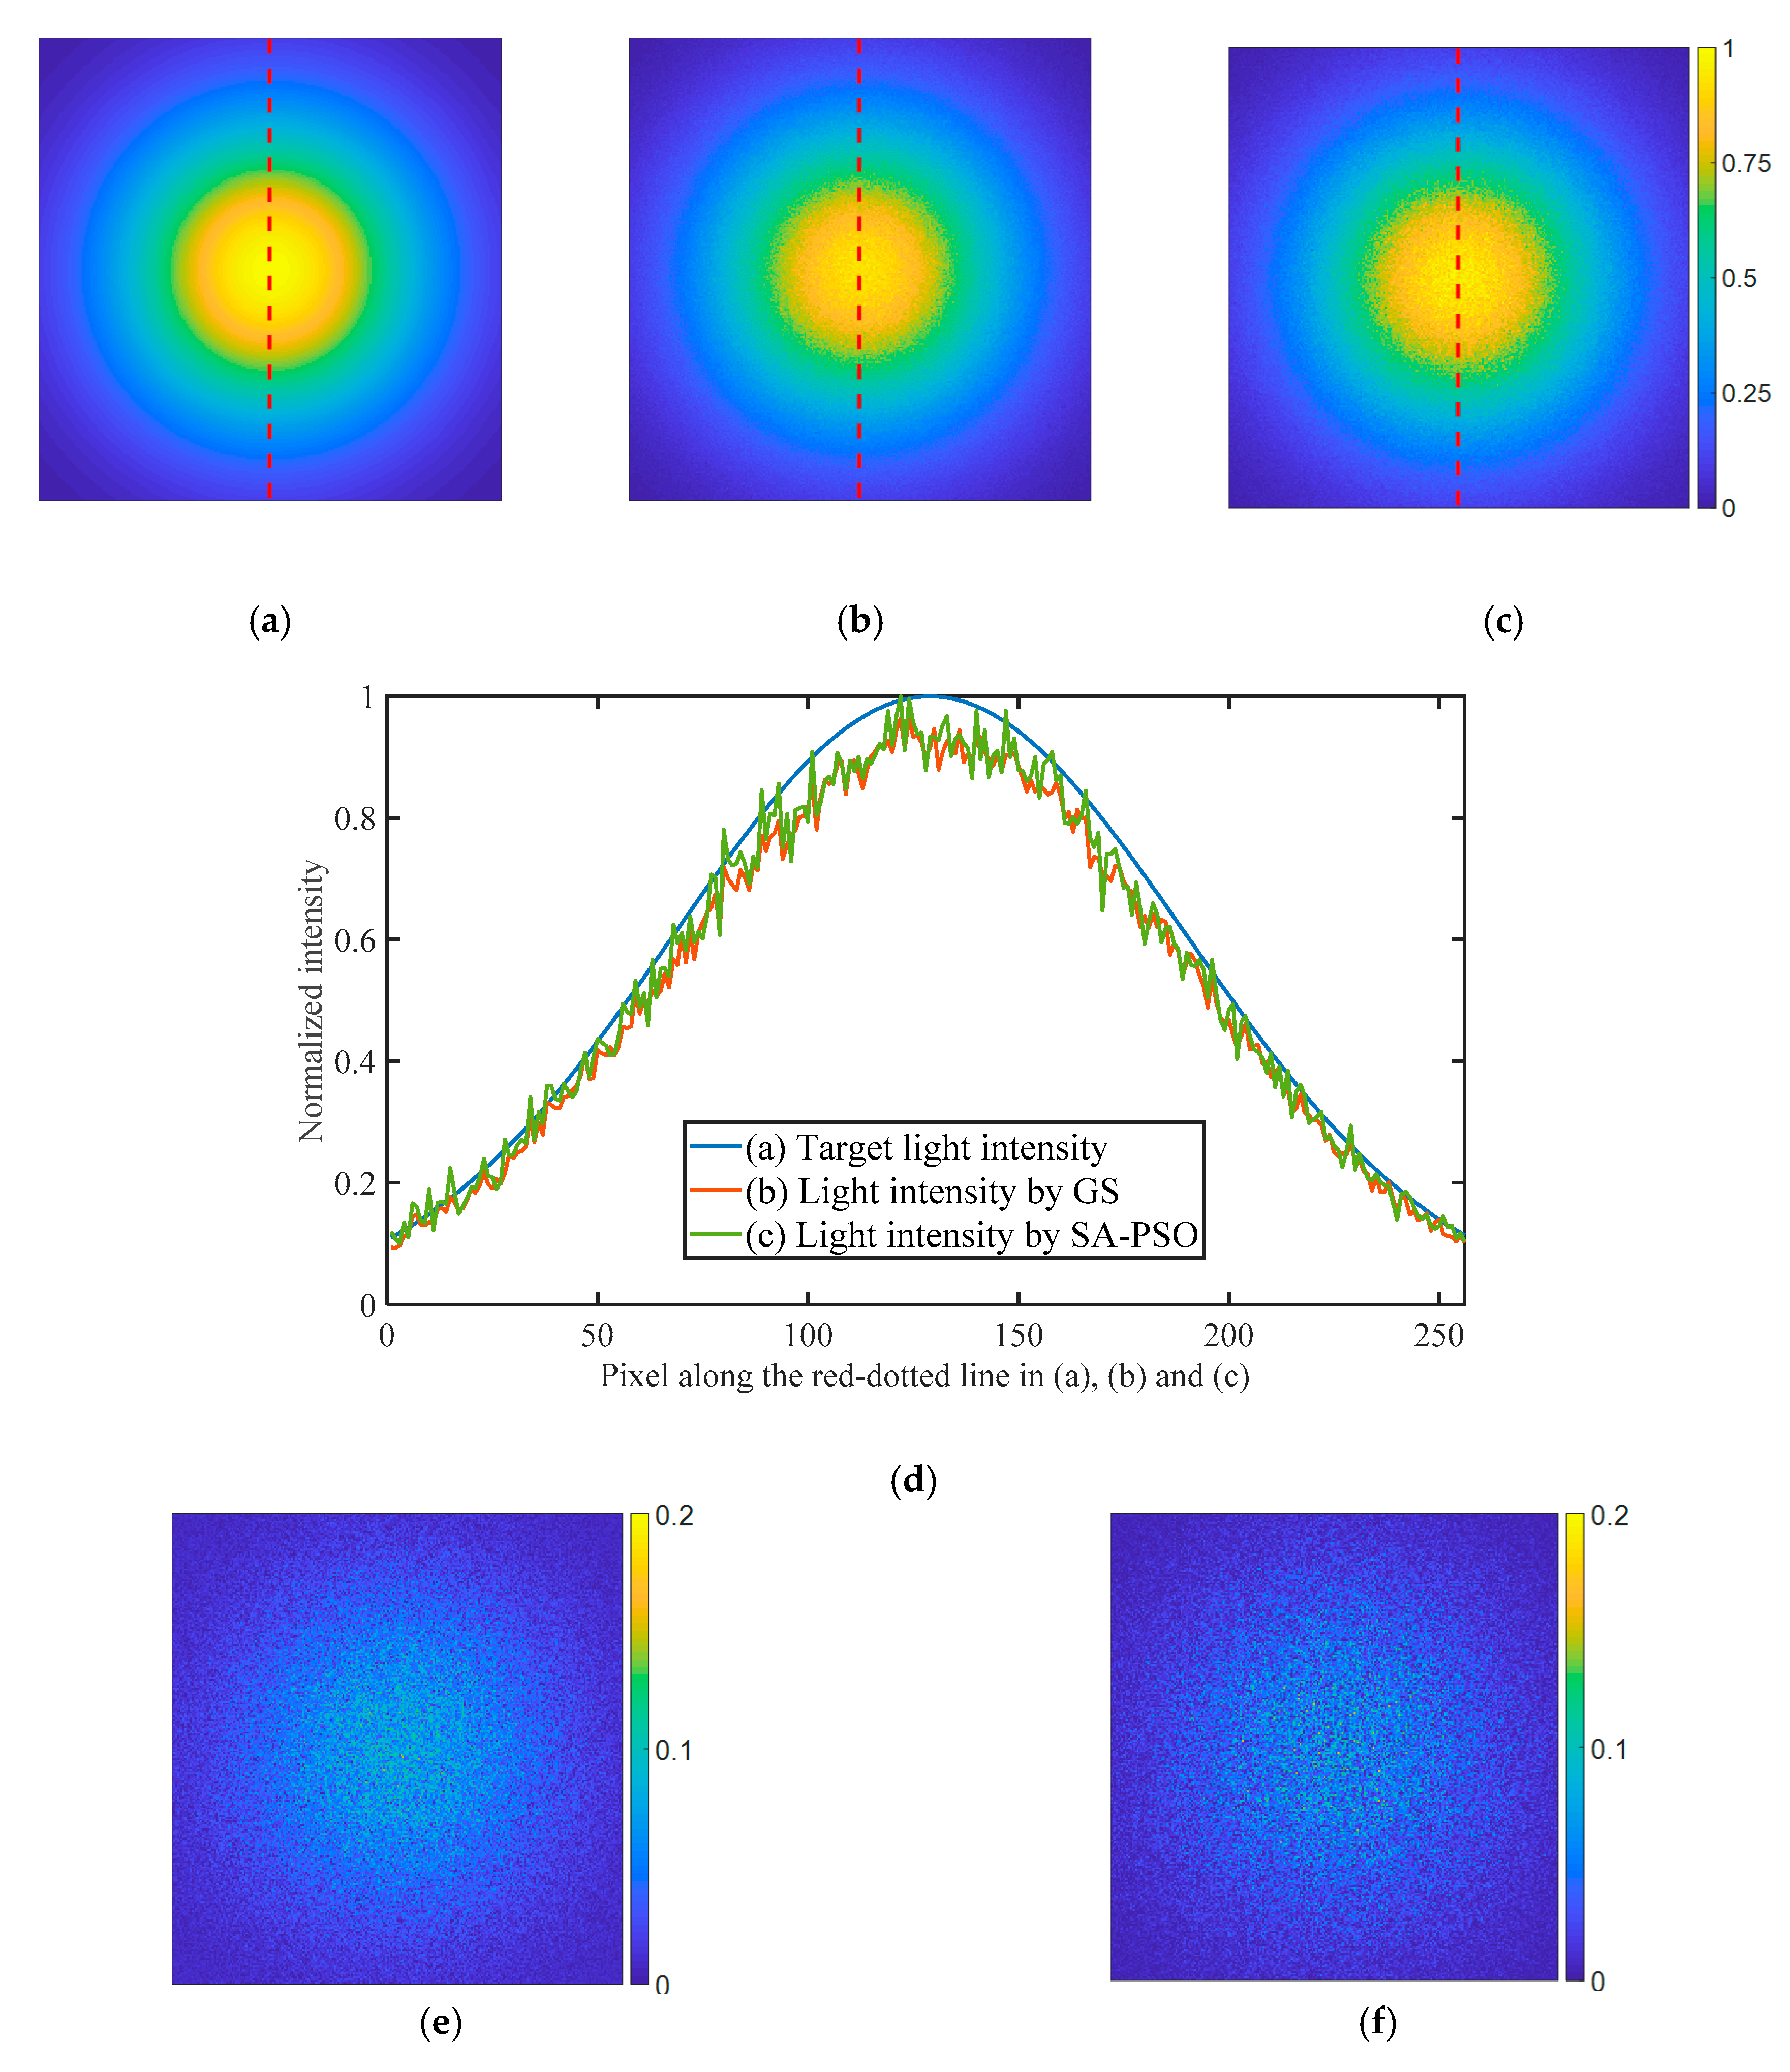
The performance of the SA–PSO hybrid algorithm is compared with the traditional GS algorithm. For the diffraction process from DOEs to the target plane, the Fresnel diffraction equation or the Fraunhofer diffraction equation [35] can be used to calculate the intensity distribution on the target plane. The goal of the simulation is to shape a plane wave into a Gaussian beam. The diffraction model used in the process is Fresnel diffraction and the numerical algorithm used in the simulation is a single fast Fourier transform (SFFT). The intensity distribution on the target plane is shown in Figure 2a. The specific parameters used in the simulation are shown in Table 1.
Two DOEs are calculated by using the GS algorithm and the SA–PSO hybrid algorithm, respectively. The diffracted intensity distributions on the target plane are calculated, as shown in Figure 2b,c. The shaping effects are compared in Figure 2d. The deviation to the target by the GS algorithm and the SA–PSO hybrid algorithm are shown in Figure 2e,f. It can be seen that the SA–PSO algorithm has a better shaping effect than the GS algorithm, especially in the central high-light intensity area. The cost function values of the light intensity by the GS algorithm and the SA–PSO hybrid algorithm are 9.30 and 8.09, respectively. So, the relative reduction by the SA–PSO hybrid algorithm is 13.00%.

4. Experiment

In the experiment, we load the calculated 256-step phase distribution on an LCoS (liquid crystal on silicon) as a DOE. The parameters in the calculation and experiment are shown in Table 2. The target intensity pattern is a rectangle with a size of 282 × 150 , as shown in Figure 3. In order to reduce the influence of the zero-order light on the experimental results, we use a lens to converge the zero-order light in the center, while placing the rectangle in the upper left corner to be far away from the zero-order light; this requires the use of the Fraunhofer diffraction equation to calculate the target plane light intensity distribution. Two 256-step phase distributions of the DOE are calculated by the GS algorithm and the SA–PSO hybrid algorithms, and then the simulated Fraunhofer diffraction results on the target plane are shown in Figure 4a,b, respectively. The calculation by the GS algorithm takes 20 s, and the one by the SA–PSO takes 1 h. The cost function values of the diffracted pattern in Figure 4a,b are 100.33 and 89.71, respectively, so the relative reduction by the SA–PSO algorithm is 10.59%.
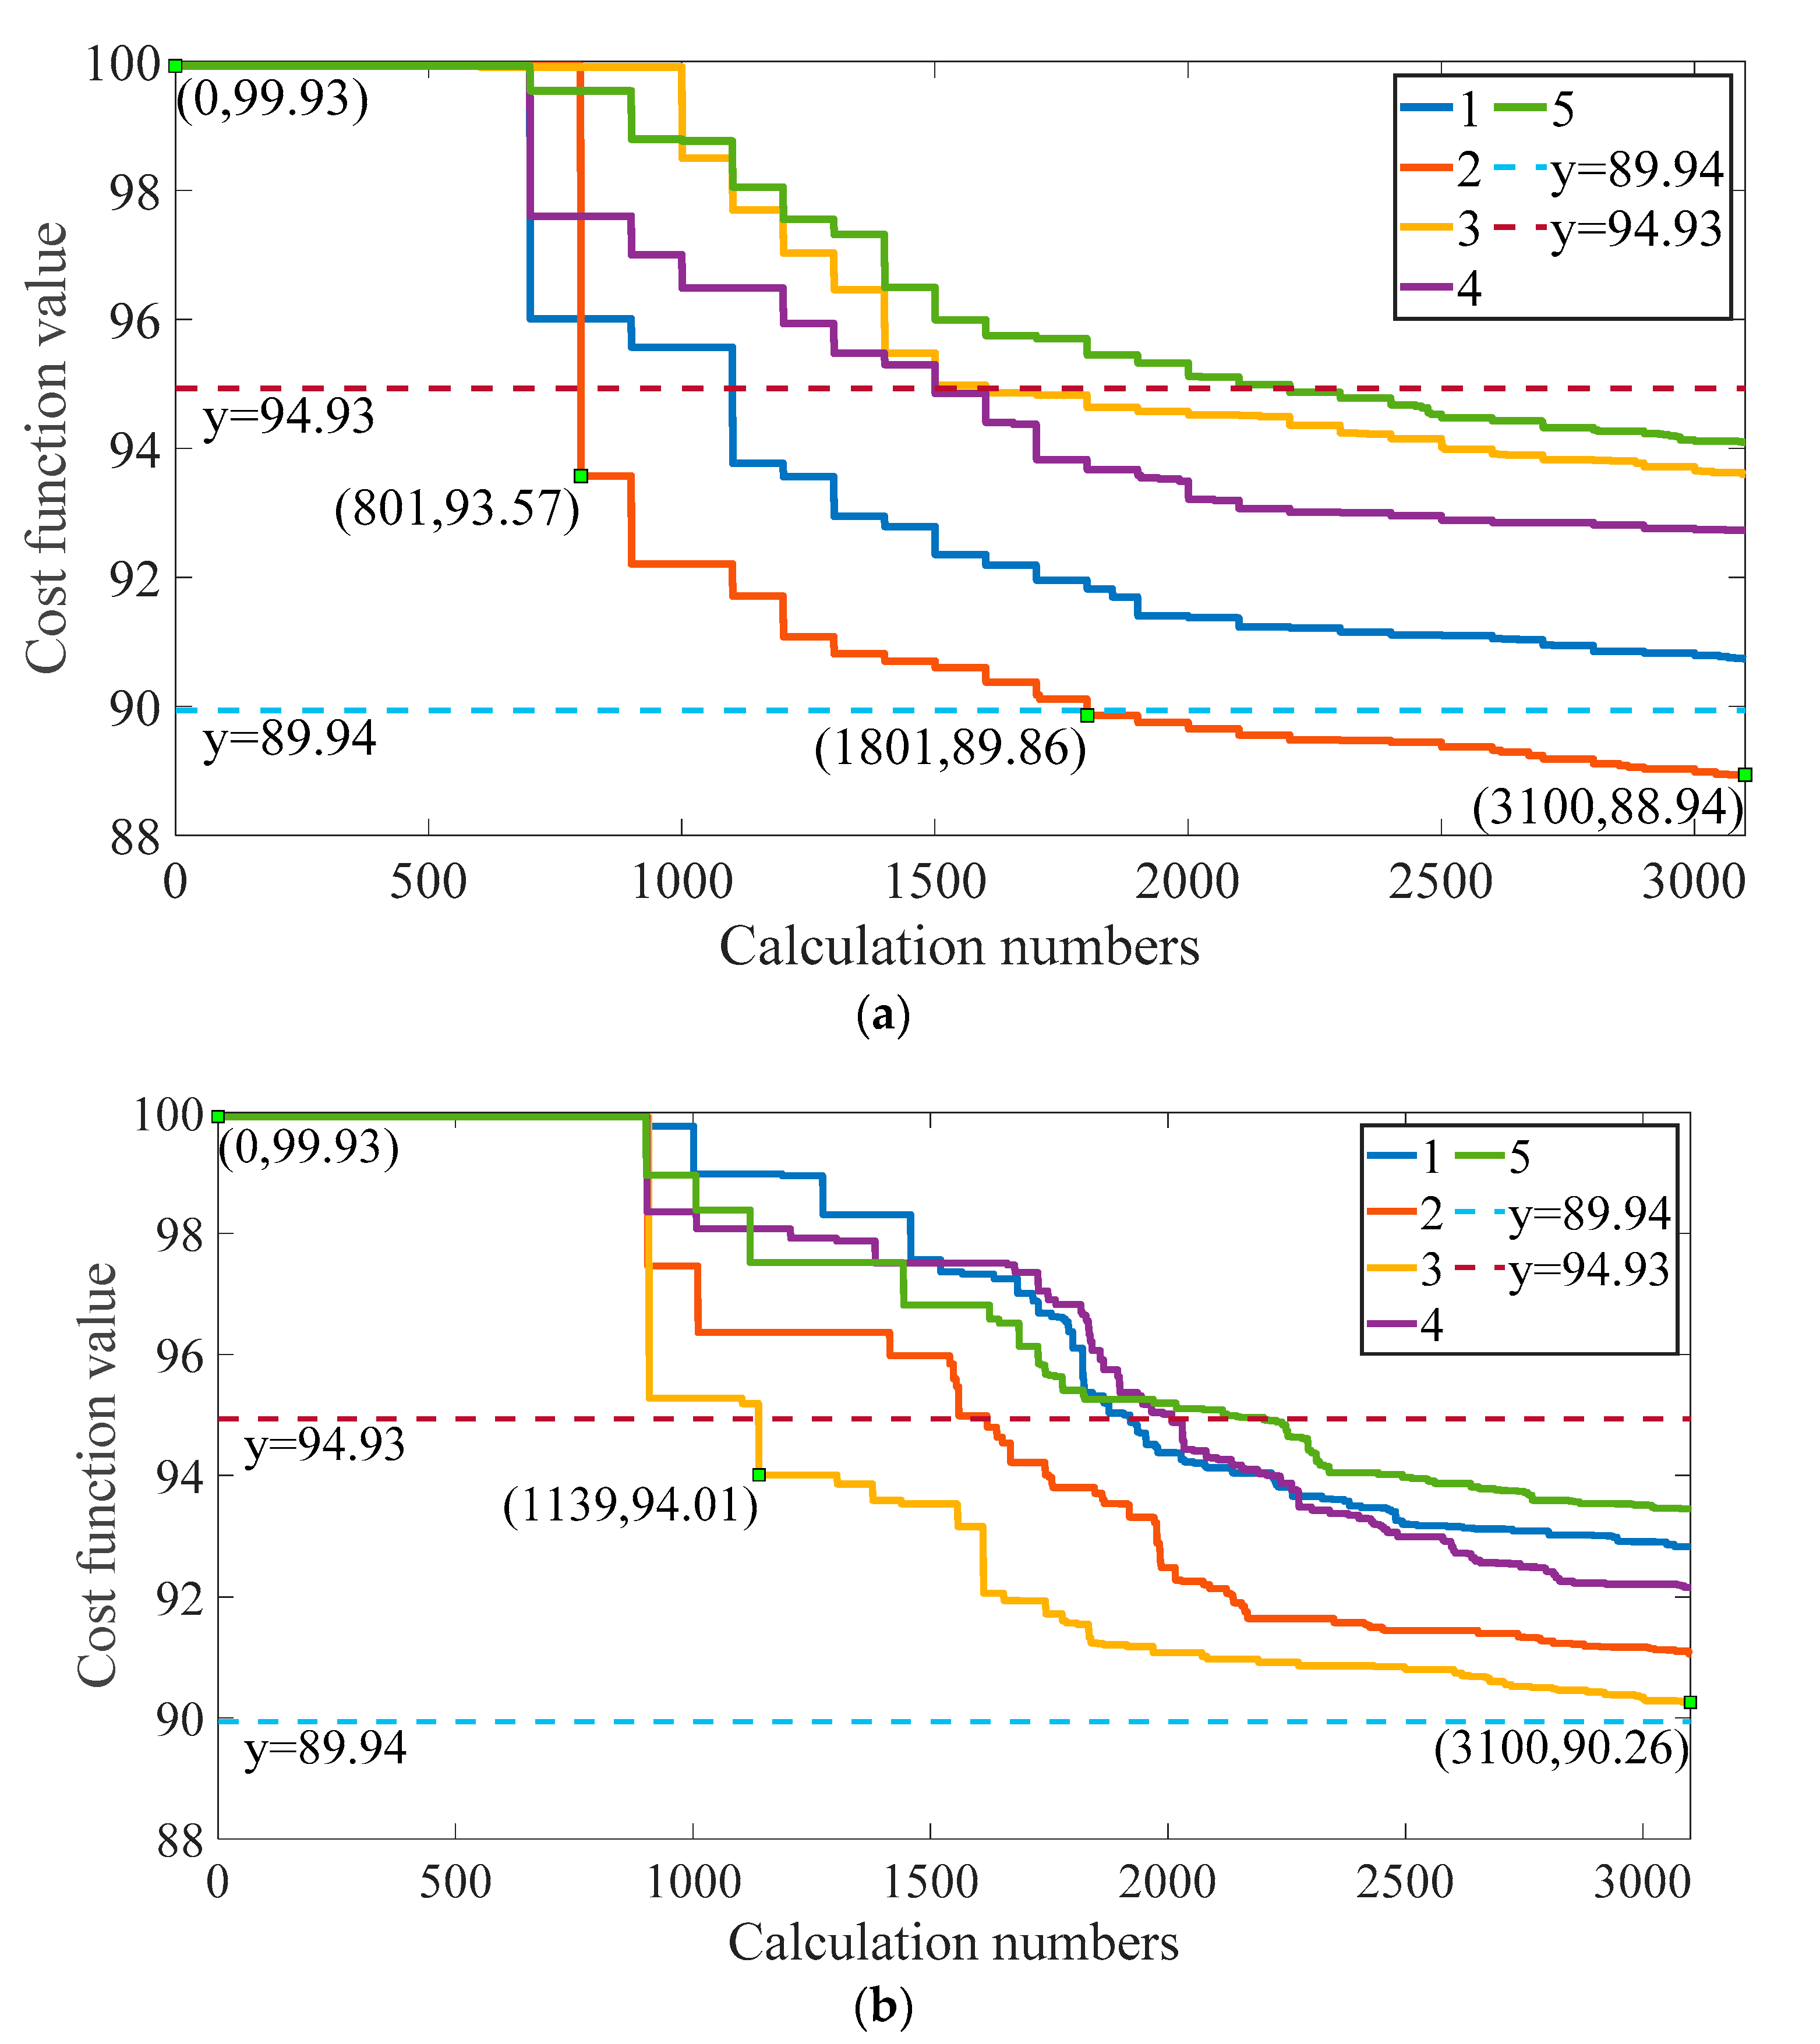
We also compared the convergence speed of the SA–PSO algorithm and SA algorithm. It can be seen from Figure 1 that, at each synthetic temperature, the particle swarm search is performed first, and then the optimal solution is used as the initial value to perform 100 simulated annealing searches, and finally the search at this synthetic temperature ends. Therefore, after removing the particle swarm search process, the simulated annealing process is obtained. Both the two algorithms start the search from the same initial value (obtained by the GS algorithm). In both the SA and SA–PSO algorithms, at a synthetic temperature, we record the cost function value when the simulated annealing process begins. The entire simulated annealing process experiences 31 synthetic temperatures. Each of the two algorithms is performed five times. The changes of the cost function values during the searching processes in the SA–PSO and the SA algorithm are shown in Figure 5a,b, respectively.
The initial cost function value is 99.93, and this value becomes 94.93 and 89.94 by a reduction of 5% and 10%, respectively. In order to compare the convergence speed of the two algorithms, the y = 94.93 and y = 89.94 lines are used as the baseline. In each figure, we pick out the curve with the fastest convergence speed and marked the data points that just passed the baseline. It can be calculated that the calculation numbers, to achieve a reduction of 5%, reduce by 29.7% with the SA–PSO algorithm, and that value for a 10% reduction is even larger. Therefore, the convergence speed of the SA–PSO is faster, and the final cost function value of the SA–PSO is also smaller than SA.
However, because the SA–PSO algorithm has an extra particle swarm search process than the SA algorithm, its program running time is longer than the SA algorithm. The program running times of the SA–PSO and the SA algorithms are 1 h and 15 min, respectively.
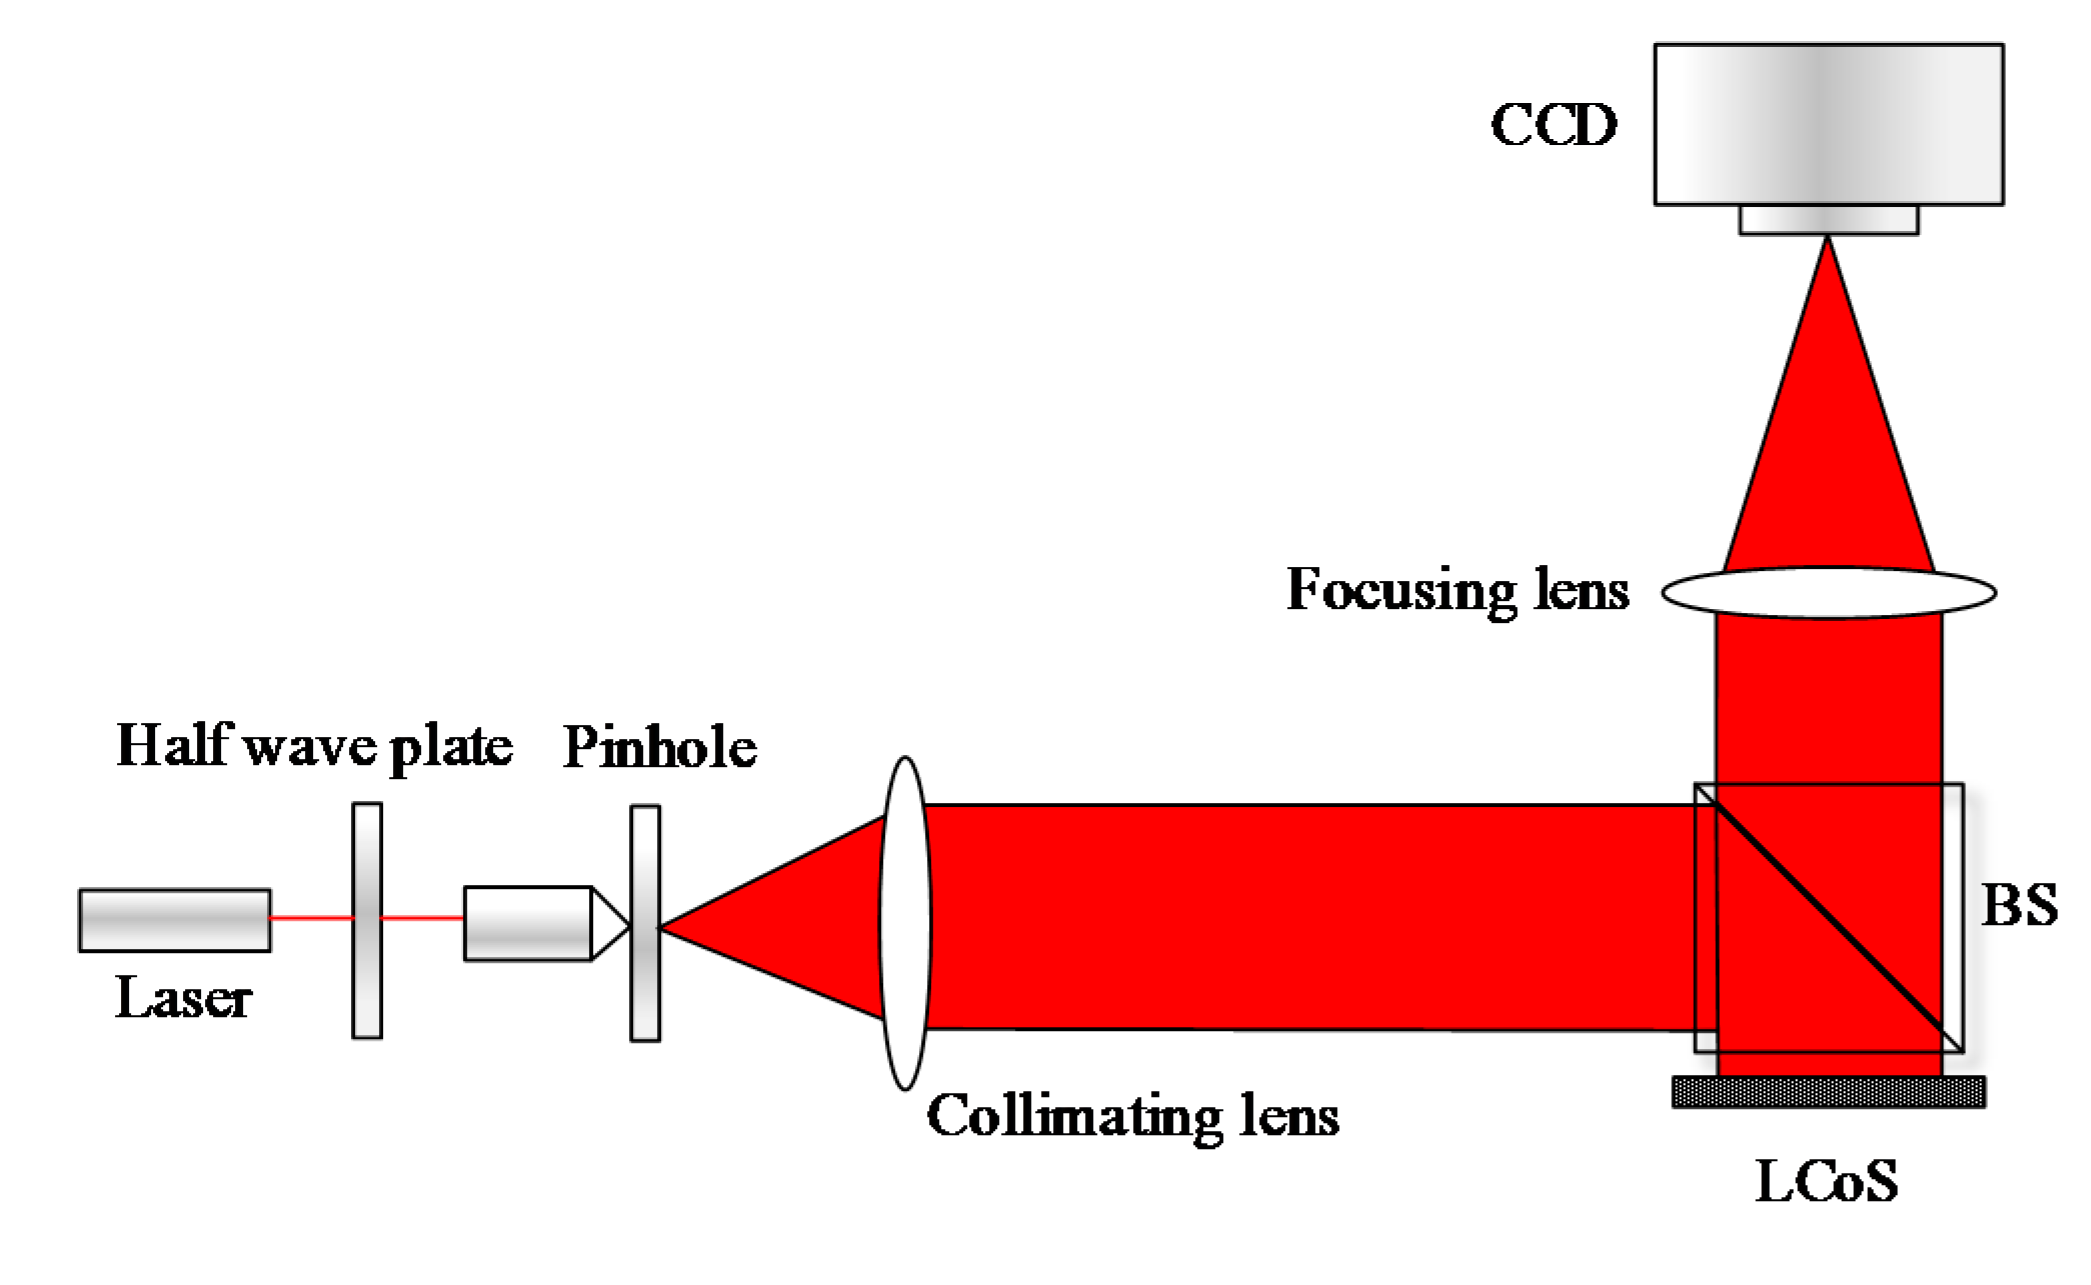
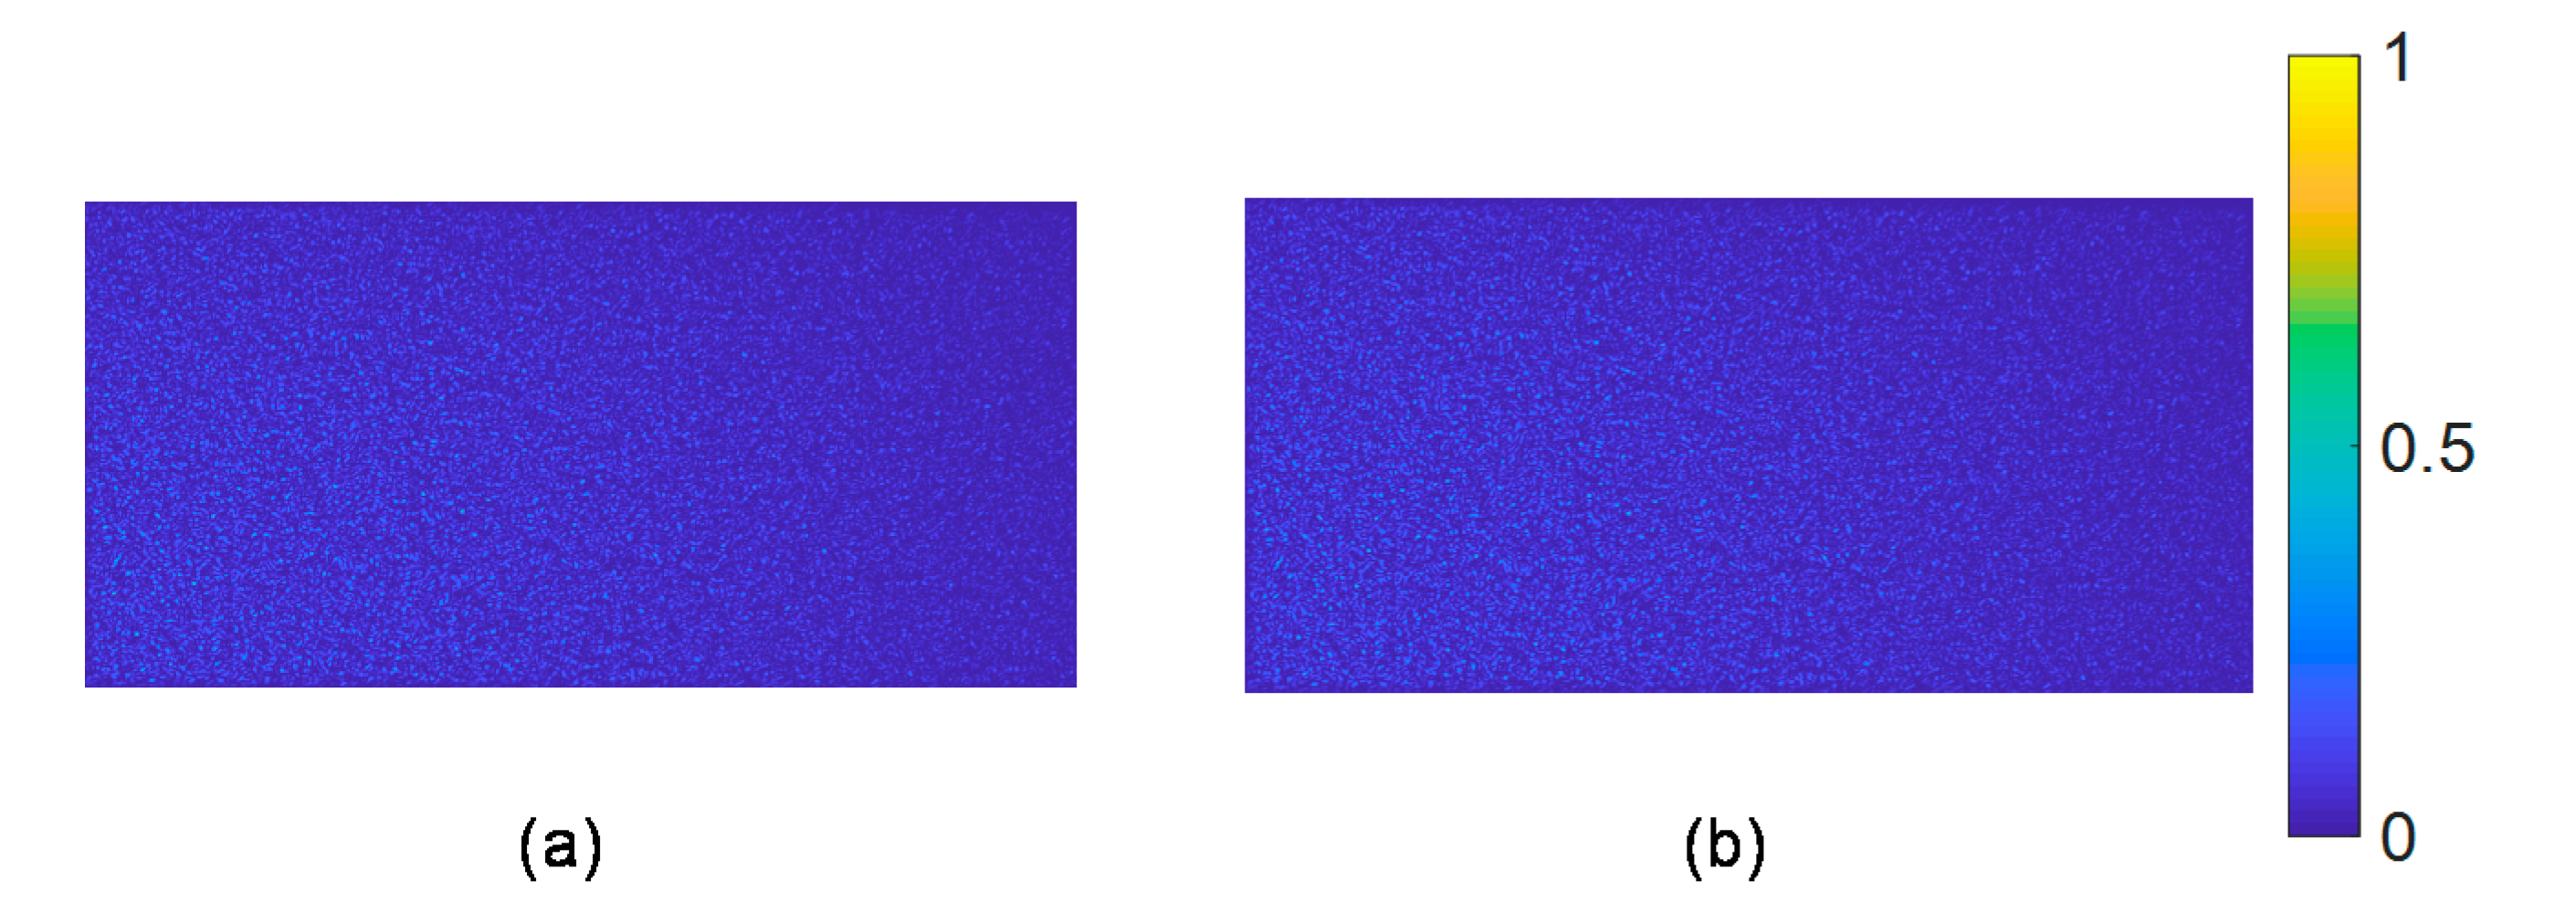
The schematic of the experimental setup is shown in Figure 6. A Holoeye Pluto 2 NIR-11 LCoS is employed to load the DOEs designed by the GS algorithm and the SA–PSO algorithm. The charge coupled device (CCD) is placed on the focal plane of the focusing lens, i.e., the Fraunhofer plane of the DOEs. The light intensity is adjusted by a continuously neutral density filter, to ensure that none of the pixels on the CCD are overexposed. The diffracted patterns are captured by the CCD and are normalized to 0~1. The pseudo color images of the normalized patterns are shown in Figure 7. Because we use the calculation result of the GS algorithm as the initial value of the SA–PSO algorithm, the speckle distributions of the GS algorithm and the SA–PSO algorithm are quite similar. Each intensity distribution in Figure 7 is normalized. Because there is no truth value in the experiment, the standard deviation of each result is calculated to evaluate the quality. The standard deviation is expressed as:
S = m , n = 1 m = M , n = N ( I m , n I ¯ ) 2 M × N
where I m , n is the intensity diffracted by the calculated DOE, I ¯ is the mean value of the target light intensity, and M and N represent the number of rows and columns of the matrix, respectively.
The standard deviation of Figure 7a,b is 0.0440 and 0.0383, respectively. The relative reduction by the SA–PSO hybrid algorithm is 13.0%, which is consistent with the simulation result.
To show the feasibility of the SA–PSO algorithm on display, we use this algorithm to design a DOE for a 2D Rubik’s cube, and compare the experimental reconstruction result with those by the GS algorithm and the single inverse diffraction method, as shown in Figure 8.
Because the GS algorithm is an iteration method with many forward and backward diffractions, the reconstruction quality is better than that of the single inverse diffraction method, as shown in Figure 8c,d. The SA–PSO algorithm uses the result of the GS algorithm as the initial search value, so the imaging quality is slightly better than that of the GS algorithm, as shown in Figure 8b,c.

5. Conclusions

In this paper, we propose a hybrid algorithm for the design of diffractive optical elements, named the SA–PSO hybrid algorithm. PSO is used to reduce the invalid disturbance in SA, and SA can jump out from local extreme points to find the global extreme points. The simulation result of a 256 × 256 shaping demonstrates that the SA–PSO hybrid algorithm improves the accuracy of diffraction patterns. Because of the normalization operation to the captured intensity distributions, the standard deviation of each result is calculated to evaluate the quality in the experiment. The experiment results also show that the SA–PSO hybrid algorithm can improve the uniformity by more than 10%.
The performance of the SA–PSO algorithm depends on the number of searches and the size of the particle swarm. Therefore, increasing these two parameters can effectively improve the performance of the algorithm, but this will lead to an increase in computing time. The proposed algorithm with a better performance will be practical in the rapid designing of the computer hardware.

Author Contributions

Conceptualization, C.C. and Y.S.; Data curation, C.C.; Funding acquisition, J.M.; Investigation, Y.S. and Q.T.; Project administration, P.S., J.M. and Q.T.; Software, C.C.; Supervision, P.S., J.M. and Q.T.; Validation, C.C.; Writing–original draft, P.S. and C.C.; Writing–review & editing, P.S. and Q.T. All authors have read and agreed to the published version of the manuscript.

Funding

This research was funded by Shenzhen general research fund (JCYJ20190813172405231) and International Collaboration Project of Shenzhen (GJHZ20180929162202223).

Conflicts of Interest

The authors declare no conflict of interest.

References

  1. Grossinger, I.; Golub, M.A.; Shurman, V. Extended focus diffractive optical element for Gaussian laser beams. Appl. Opt. 2006, 45, 144–150. [Google Scholar]
  2. Bokor, N.; Davidson, N. Ideal collimation, concentration, and imaging with curved diffractive optical elements. Rev. Sci. Instrum. 2005, 76, 1968–2226. [Google Scholar] [CrossRef]
  3. Lim, J.; Jeong, G.B.; Kim, S.M.; Han, J.; Yoo, J.M.; Park, N.C.; Kang, S. Design and fabrication of a diffractive optical element for the objective lens of a small form factor optical data storage device. J. Micromech. Microeng. 2006, 16, 77. [Google Scholar] [CrossRef]
  4. Yoshida, S.; Unno, N.; Akamatsu, H.; Yamada, K.; Taniguchi, J.; Yamamoto, M. Diffractive optical element for optical data storage. Modeling aspects in optical metrology IV. Int. Soc. Opt. Photonics 2013, 8789, 87891E. [Google Scholar]
  5. Martinez, C.; Krotov, V.; Meynard, B.; Fowler, D. See-through holographic retinal projection display concept. Optica 2018, 5, 1200. [Google Scholar] [CrossRef] [Green Version]
  6. Chang, C.; Qi, Y.; Wu, J.; Xia, J.; Nie, S. Speckle reduced lensless holographic projection from phase-only computer-generated hologram. Opt. Express 2017, 25, 6568. [Google Scholar] [CrossRef]
  7. Tan, Q.; Qu, W.; Zhang, H.; Gu, H. Image magnification in lensless holographic projection using double-sampling Fresnel diffraction. Appl. Opt. 2015, 54, 10018–10021. [Google Scholar]
  8. Nordin, G.P.; Meier, J.T.; Jones, M.W. Diffractive optical element for Stokes vector measurement with a focal plane array[C]//Polarization: Measurement, Analysis, and Remote Sensing II. Int. Soc. Opt. Eng. 1999, 3754, 169–177. [Google Scholar]
  9. Jiang, Y.; Wang, J.; Xie, Q. Athermal design of refractive/diffractive hybrid infrared optical system. Electron. Opt. Control 2008, 131, 592–597. [Google Scholar]
  10. Antipa, N.; Kuo, G.; Heckel, R.; Mildenhall, B.; Bostan, E.; Ng, R.; Waller, L. DiffuserCam: Lensless single-exposure 3D imaging. Optica 2017, 5, 1–9. [Google Scholar] [CrossRef]
  11. Shechtman, Y.; Weiss, L.E.; Backer, A.S.; Lee, M.Y.; Moerner, W.E. Multicolour localization microscopy by point-spread-function engineering. Nat. Photonics 2016, 10, 590–594. [Google Scholar] [CrossRef] [PubMed]
  12. Jokubauskis, D.; Minkevičius, L.; Karaliūnas, M.; Indrisiunas, S.; Kasalynas, I.; Račiukaitis, G.; Valušis, G. Fibonacci terahertz imaging by silicon diffractive optics. Opt. Lett. 2018, 43, 2795–2798. [Google Scholar] [CrossRef]
  13. Gerchberg, R.W. Phase determination from image and diffraction plane pictures in the electron microscope. Optik 1971, 35, 275–284. [Google Scholar]
  14. Gerchberg, R.W.; Saxton, W.O. A practical algorithm for the determination of phase from image and diffraction plane pictures. Optik 1972, 35, 237–250. [Google Scholar]
  15. Fienup, J.R. Iterative method applied to image reconstruction and to computer-generated holograms. Opt. Eng. 1980, 19, 193297. [Google Scholar] [CrossRef]
  16. Liu, J.S.; Taghizadeh, M.R. Iterative algorithm for the design of diffractive phase elements for laser beam shaping. Opt. Lett. 2002, 27, 1463–1465. [Google Scholar] [CrossRef]
  17. Ma, H.; Zhou, P.; Wang, X.; Ma, Y.; Xi, F.; Xu, X.; Liu, Z. Near-diffraction-limited annular flattop beam shaping with dual phase only liquid crystal spatial light modulators. Opt. Express 2010, 18, 8251–8260. [Google Scholar] [CrossRef]
  18. Wang, D.; Zhang, J. Adaptive-weight iterative algorithm for flat-top laser beam shaping. Opt. Eng. 2012, 51, 4301. [Google Scholar] [CrossRef]
  19. Yang, G.; Gu, B. On the amplitude-phase retrieval problem in optical systems. Acta Phys. Sin. 1981, 30, 410–413. [Google Scholar]
  20. Tan, X.; Gu, B.Y.; Yang, G.Z.; Dong, B.Z. Diffractive phase elements for beam shaping: A new design method. Appl. Opt. 1995, 34, 1314–1320. [Google Scholar] [CrossRef]
  21. Gesualdi, M.R.R.; Marinheiro, R.F. Holographic techniques using spatial light modulators applied to Maskless Photolithography. In SBMO/IEEE MTT-S International Microwave and Optoelectronics Conference, IMOC2017; IEEE: Piscataway, NJ, USA, 2017. [Google Scholar]
  22. Melchels, F.P.; Feijen, J.; Grijpma, D.W. A review on stereolithography and its applications in biomedical engineering. Biomaterials 2010, 31, 6121–6130. [Google Scholar] [CrossRef] [PubMed] [Green Version]
  23. Gross, B.C.; Erkal, J.L.; Lockwood, S.Y.; Chen, C.; Spence, D.M. Evaluation of 3D printing and its potential impact on biotechnology and the chemical sciences. Anal. Chem. 2014, 86, 3240–3253. [Google Scholar] [CrossRef] [PubMed]
  24. Lee, J.D.; Simchowitz, M.; Jordan, M.I.; Recht, B. Gradient Descent Converges to Minimizers. arXiv 2016, arXiv:1602.04915. [Google Scholar]
  25. Sun, X.D.; Liu, J.; Wang, Y.Q.; Zhang, B.; Hu, B.; Di, S.; Wang, S.Q. Diffractive optical elements for implementing spatial demultiplexing and spectral synthesizing simultaneously. Opt. Commun. 2006, 266, 399–403. [Google Scholar] [CrossRef]
  26. Kim, G.; Domínguez-Caballero, J.A.; Menon, R. Design and analysis of multi-wavelength diffractive optics. Opt. Express 2012, 20, 2814. [Google Scholar] [CrossRef] [PubMed]
  27. Meister, M.; Winfield, R.J. Novel approaches to direct search algorithms for the design of diffractive optical elements. Opt. Commun. 2002, 203, 39–49. [Google Scholar] [CrossRef]
  28. Zhou, G.; Chen, Y.; Wang, Z.; Song, H. Genetic local search algorithm for optimization design of diffractive optical elements. Appl. Opt. 1999, 38, 4281. [Google Scholar] [CrossRef]
  29. Jiang, J.; Nordin, G. A rigorous unidirectional method for designing finite aperture diffractive optical elements. Opt. Express 2000, 7, 237–242. [Google Scholar] [CrossRef]
  30. Zhou, G.; Yuan, X.; Dowd, P.; Lam, Y.-L.; Chan, Y.-C. Design of diffractive phase elements for beam shaping: Hybrid approach. J. Opt. Soc. Am. A 2001, 18, 791–800. [Google Scholar] [CrossRef]
  31. Chen, M.; Wang, Q.; Gu, H.; Tan, Q. Diffractive optical element with same diffraction pattern for multicolor light-emitting diodes. Appl. Opt. 2016, 55, 159–164. [Google Scholar] [CrossRef]
  32. Shokooh-Saremi, M.; Magnusson, R. Particle swarm optimization and its application to the design of diffraction grating filters. Opt. Lett. 2007, 32, 894–896. [Google Scholar] [CrossRef] [PubMed]
  33. Yu, C.; Peng, Y.; Guo, T.; Fu, Q.; Li, H.; Liu, X. Beam shaping for multicolour light-emitting diodes with diffractive optical elements. J. Mod. Opt. 2016, 64, 1–8. [Google Scholar] [CrossRef]
  34. Kirkpatrick, S.; Gelatt, C.D.; Vecchi, M.P. Optimization by simulated annealing. Science 1983, 220, 671–680. [Google Scholar] [CrossRef] [PubMed]
  35. Goodman, J.W. Introduction to Fourier Optics; Roberts and Company Publishers: Greenwood Village, CO, USA, 2005. [Google Scholar]
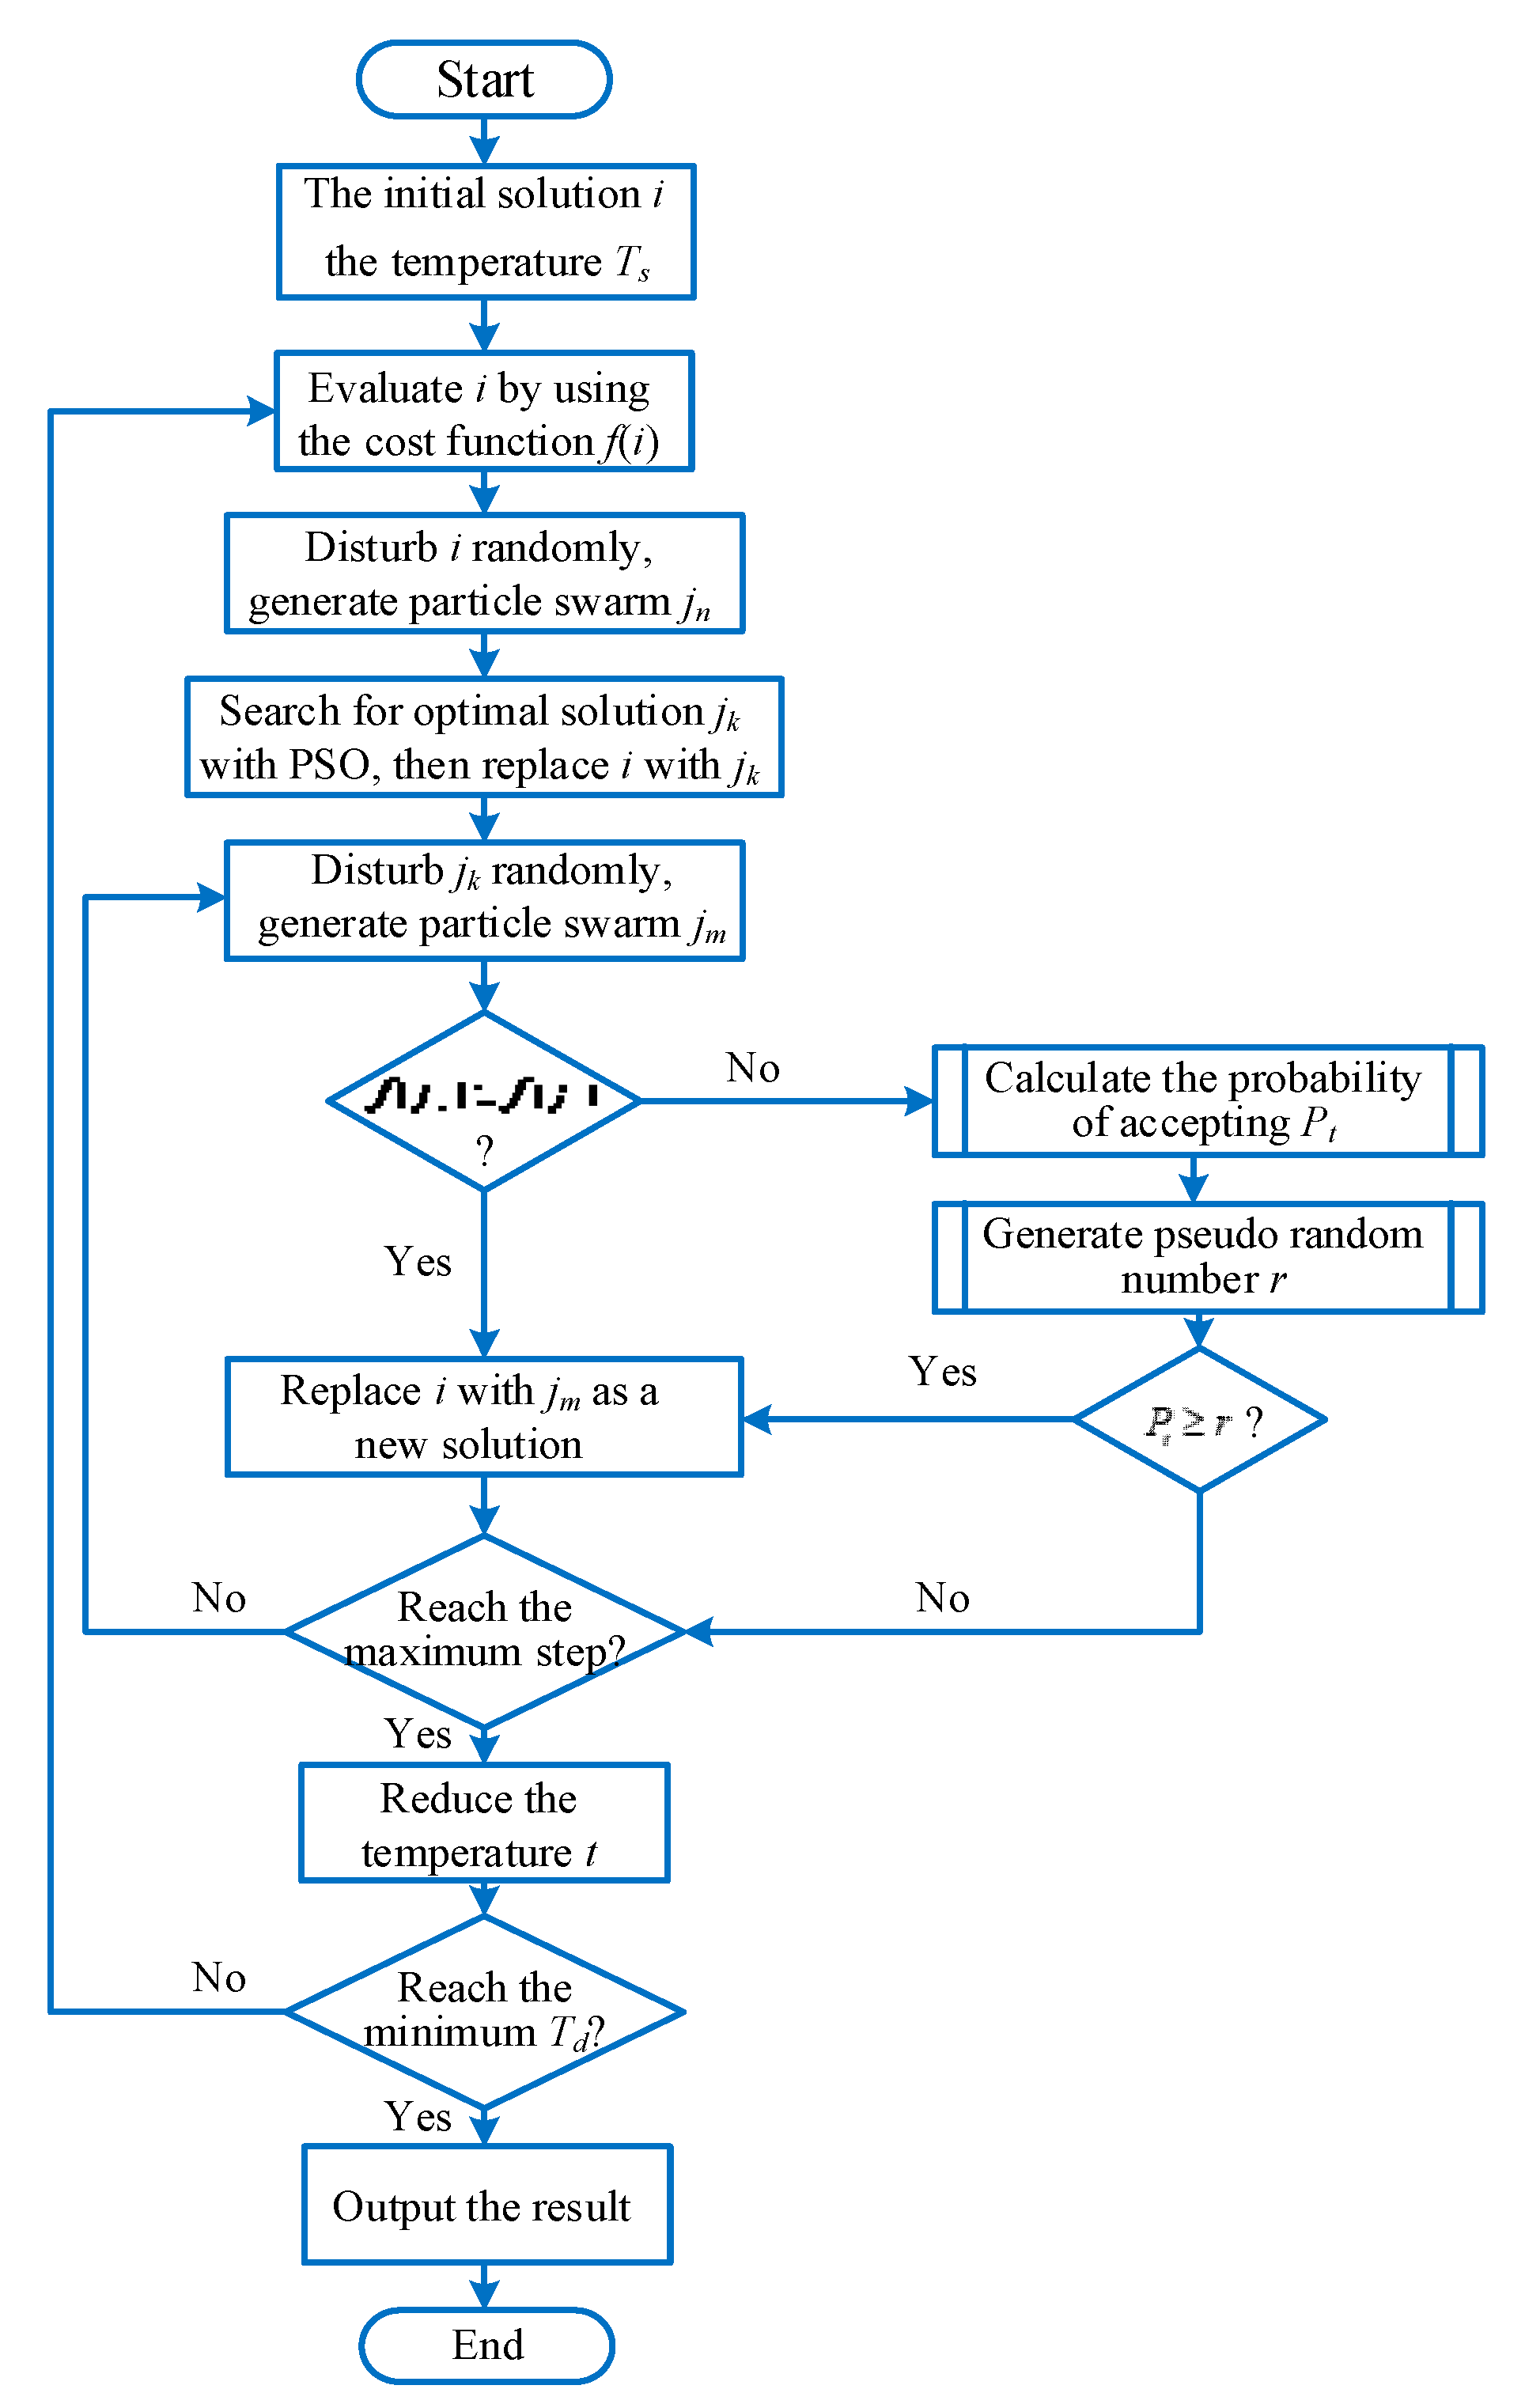
Figure 1. The flow chart of the simulated annealing–particle swarm optimization (SA–PSO) hybrid algorithm.
Applsci 10 05485 g001
Figure 2. The beam shaping target (a), the simulated beam shaping results by (b) the Gerchberg–Saxton (GS) algorithm and (c) the SA–PSO hybrid algorithm. (d) The normalized intensity along the red-dotted lines in (a), (b) and (c). The deviation to the target by the GS algorithm (e) and the SA–PSO hybrid algorithm (f).
Applsci 10 05485 g002
Figure 3. The target pattern.
Applsci 10 05485 g003
Figure 4. The simulated diffraction results of the diffractive optical elements (DOEs) designed by (a) the GS algorithm and (b) the SA–PSO algorithm.
Applsci 10 05485 g004
Figure 5. The convergence process of the SA–PSO hybrid algorithm (a) and the simulated annealing (SA) algorithm (b).
Applsci 10 05485 g005
Figure 6. Schematic of the experimental setup.
Applsci 10 05485 g006
Figure 7. The diffracted intensity patterns obtained by the CCD. (a) The GS algorithm and (b) the SA–PSO algorithm.
Applsci 10 05485 g007
Figure 8. Two-dimensional Rubik’s Cube patterns obtained by the CCD, using different algorithms. (a) Target pattern, (b) the SA–PSO algorithm, (c) the GS algorithm and (d) the single inverse diffraction method.
Applsci 10 05485 g008
Table 1. Parameters in the simulation
ParametersValue
The size of the DOE8.64 mm
Diffraction distance300 mm
Sampling points 256 × 256
Wavelength532 nm
C 1 , C 2 1.6, 1.9
α , β 5 × 10 5 , 1
ω 0.9
T s 10 4
T f 10 7
Table 2. Parameters in simulation.
ParametersValue
The size of the LCoS8.64 mm
Diffraction distance300 mm
Sampling points 1080 × 1080
Wavelength632 nm
C 1 , C 2 1.6, 1.9
α , β 5 × 10 5 , 1
ω 0.9
T s 10 4
T f 10 7