1. Introduction
The increasing volume of traffic that cities currently face is associated with many unpleasant phenomena, such as accidents, time delays, emergencies, as well as high pollution and degradation of life quality. Nevertheless, with the digital age constantly moving forward, a revolution in the transportation network is being spurred by advancements in communication technologies. Therefore, governments, academia, and industrials making tremendous efforts have made advancement to reinforce the evolution of the commonly named intelligent transportation system (ITS). Meanwhile, cars are getting increasingly intelligent. A contemporary car comprises over 20,000 components, about 40 microprocessors and dozens of sensors. In addition, an eclectic selection of technologies strive to offer different vehicular communications models known as vehicle-to-everything (V2X). These progresses in sensing technologies are inaugurating new possibilities, such as connected vehicles (CV). As one of the most heavily researched automotive technologies, CV technology aims at introducing improvements concerning safety and efficiency of the transportation system and roads. It then has the possibility to ameliorate ongoing activities, modify transportation system management, complete or substitute traditional data collection approaches, and essentially amend the paradigm of the transportation data. Hence, it is not surprising that "data" is the most common word that appeared in all responses in a request for information that concerned connected vehicle generalization project in the U.S. (
https://www.federalregister.gov/documents/2014/03/12/2014-05414/connected-vehicle-pilot-deployment-program-request-for-information).
Consequently, intelligent transportation systems are required in order to shift to mobile computing technology for the flexibility that they need to meet the daily challenges of demanding connected and autonomous vehicles applications.
Dedicated Short Range Communication (DSRC) protocol has been adopted as a leading communication standard in the U.S., for establishing an advanced connected vehicle network and supporting traffic efficiency and safety, along with SAE J2735 as a primary standard to provide V2X data guidelines for deploying applications for DSRC-enabled connected vehicle. Actually, the DSRC and SAE-J2735 together grant the potential to exchange safety data wirelessly and very effectively using what is presented as basic safety messages (BSM) [
1,
2,
3]. This commonly referred to as the “heartbeat” message, is nominated as the main data set used to continuously exchange safety data between connected vehicles. Over real-time exchange of this safety message, CV applications are able to discover and determine perilous situations. They can then inform drivers of the expected danger before it occurs or automatically acts toward impending incidents using vehicle control systems. Historically speaking, the primary purpose of the U.S. CV program was to enhance road safety by aiding vehicle-to-vehicle safety applications making the right decisions. Nevertheless, generating data for transport agencies while using connected vehicles is, by design, a very important secondary principle. A great deal of the ongoing research under the mentioned program is oriented towards such data-providing applications. In this respect, BSMs frequently generated from multiple connected vehicles can play a primordial role in providing transport data see credible and reliable information that they contain. Otherwise, when considering the way BSMs are treated, multiple deficiencies prevent the latter to be capable of constituting a precious connected vehicle data source.
First: presently, the basic safety messages are particularly even exclusively used for the safety purpose. In contrast, a big bundle of its data elements are necessary for a considerable collection of applications not related to safety. At least, the BSM Part 1 data elements can conveniently provide basic vehicle information required by several applications. Arguably helpful, safety, mobility, and efficiency are not a separated aspects. Obviously, traffic accidents can breed Traffic congestion and increase CO2 emission.
Next: BSMs as safety data are overall regarded as snapshot data that give an idea of the state of the system at a definite time. From the first use, the BSM becomes outdated, useless, and is deleted. Undoubtedly, BSMs collected from multiple connected vehicles can be cached, grouped and stored to construct continuous data streams that can supply almost real-time metrics while they evolve over space and time. Indeed, data are then exploited in a better-connected form to improve safety, decrease fuel consumption, reduce traffic jams, as well as facilitate people’s travel overall.
Finally: as is well known, safety applications between vehicles require local broadcast of BSM within the limits of the DSRC. Even though, connected vehicles using applications are required to enable an extra-vehicular data exchange to permit collaborative sensing and action at scale. Thus, if transmitted according to different technologies other than DSRC such as Cellular V2X, continuous data obtained through BSMs processing can widely feed applications with requested vehicle information [
4].
In our previous works, first, in [
5] we proposed a Request-To-Receive (RTR) approach to address the blinding broadcast of BSM, to reduce bandwidth over-utilization, and decrease data loss and delay. Next, in [
6] we proposed an Application-Level Flextime Aggregation (ALFA) scheme that caches BSMs on-board the vehicle and then aggregates them into new messages containing stored snapshots according to contexts for every stretch of roadway. In this paper, for broad, intelligent, and rational using of safety messages, we propose a BSM reuse model taking into account the general context of ITS, where connected vehicles are expected to boost safety, decrease traffic congestions, and reduce CO
2 emissions and fuel consumption [
7].
Dealing BSM as wealthy data outside its baseline design, out of safety context and beyond DSRC limits has never been considered before. Our proposed model retains collected BSMs, stores, and processes them inside the vehicle to provide a continuous data source holding saved snapshots for each roadway segment.
The main innovation of our model is its participation to change the way that BSM is treated, opening up new possibilities to broadly reuse stored BSMs, making them more valued, and resulting in the creation of a reliable and useful transport data source. Moreover, given that our model relies on In-Vehicle Computing (IVC) paradigm, its strongest potential is, therefore, its capability of facilitates data processing at, or close to, their source of generation while optimizing bandwidth and reducing latency to rapidly provide data of value to drivers, pedestrians, and transportation agencies.
The rest of this article is structured, as follows:
Section 2 shows brief overview of the methods and techniques for connected vehicle data collection and sharing in the existing literature.
Section 3 describes the availability of data in consideration of connected vehicle technology.
Section 4 introduces and describes our proposed data reuse model.
Section 5 presents study case, data description, and results and discussions. Finally, our conclusions, key study limitations, and future work are presented in
Section 6.
2. Related Works
If connected vehicles are to form the center of future intelligent transportation systems, one of the most glamorous areas that presents many challenges as we progress is transport data sources. There is no doubt that data have great potential and power, and data are the blood that will run through the veins of connected vehicles [
8]. Connected vehicles’ data can provide the ability to meet the modern interests of drivers like for instance “What is the best fuel-efficient route” and go beyond the classical inquiries about shortest-distance or earliest arrival route [
9]. In this respect, the increasing focus of the ITS research community towards the topic of data in connected vehicle environment has led to a bustle of works introducing different approaches to the problem of data collection.
Indeed, data collection that is based on the recruitment of connected vehicles is recently studied of [
10], where an optimal set of vehicles are required to be identified and recruited to carry out an urban data collection in favor of service provider to facilitate users on city-streets. This incentive-based method named REVERS has exploited game-theory to fairly and optimally select the best vehicles under desired coverage, redundancy, and quality requirements. Similarly, to perform urban sensing for a desired coverage, given a limited budget, the authors of [
11] proposed the recruitment of high reputation users. Additionally, the authors of [
12] have focused on how to maximize message coverage in urban vehicular networks by the optimal deployment of roadside units. In their proposed message coverage maximization algorithm, namely MCMA, the authors have considered traffic stream and delay constraint of applications to attentively identify the appropriate site for RSUs. Some other studies have been conducted on connected vehicles data transmission issues. Accordingly, the authors of [
13] have attempted to improve the cooperative data dissemination performance, where the authors considered the cooperative data scheduling decision in hybrid (V2I) and (V2V) vehicle networks as a maximum weighted independent set (MWIS) problem. Subsequently, by solving the MWIS, the goal is to maximize the number of vehicles that retrieve their requested data. In the same way, the work by [
14] has dealt with connected vehicles related data distribution tasks, where the authors designed an infrastructure to enable large-scale message delivery by labeling and customizing unstructured data into topics in order to serve a wide range of consumers. Authors of [
15] have attempted to cope with the problem of delay-tolerant connected vehicles data traffic delivery. They introduced an architecture where delay-tolerant traffic is offloaded from the data networks to the connected vehicle networks, without extra infrastructure or hardware deployment. The authors have also proposed a distributed data hopping mechanism to allow delay-tolerant data routing over CV networks. In another paper [
16], for large-scale vehicular content distribution in urban areas, the authors came up with the idea of deploying a multitude of wireless buffer devices on the roadside, namely roadside buffers (RSBs), to extend the distribution of locally content to vehicles in the urban area. The work by [
17] discussed the possibility of substituting RSU by city buses widely distributed in the city area to improve intra-cluster BSM dissemination. The authors have also proposed an allocation mechanism for intra-cluster message distribution. When considering the problem of vehicular datasets, authors of [
18] mimicked the ordinary daily road activity of a 400 km
2 region and generated a realistic artificial vehicular mobility dataset.
Regarding aforementioned studies, it is important to note that data collection approaches remain ineffective in a dynamic environment, since they are not based on stable criteria for the selection of candidate vehicles that should be important and available to meet the relevant user interests in the network. In addition, they are not scalable data collection for a given coverage and budget constraints [
11,
12]. Despite that the authors of [
10] have adopted the Information-Centric Networking (ICN) concept, in their work, the information importance remains location-based, depends on the content popularity and computed through the observation of the amount and frequency of user interests it received, where they neglected whether the receiver is satisfied or not with this content. Moreover, there is no proper metric to classify and identify the participants’ eligibility that has been used by the authors of [
11]. In [
12], the proposed deployment strategy can notably be influenced by large-scale mobility model and road layout.
In regards to data transmission works, the centralized model presented in [
13] is limited to single-hop V2V communication and do not match by the SDN concept of “logically centralized” control in a distributed network. In [
14], although the authors have respected the recommended latency requirements for CV applications, they considered in their experimentation latency that only includes the delivery time of a message and not the processing times, such as the time required for aggregation and complex data transformation. The proposed infrastructure presented in [
16] is not extendable to any network size, so it is not capable to support Internet-enabled content distribution. Though the mobility model and road vehicle density can deadly influence the intra-cluster message dissemination, they have not been considered in the clustering process in [
17]. The authors of [
18] have described the generation process and outlined the impact of the generated dataset on the simulative evaluation of vehicular networks. Nevertheless, a real-world dataset remains necessary to allow for a more rigorous validation of the mobility models.
On the data side, not all previous work used realistic, reliable, and large-scale data sources, such as BSMs; each system instead has defined its proprietary data formats and collected its required data to provide its services. Consequently, different applications in these systems are not able to complement each other by reuse and sharing data, as they are unable to understand each other’s data. This hinders cross-application data reuse and optimizations (e.g., to reduce data traffic by reducing redundancy).
On the simulation side, some works were concerned by a local simulation area [
11,
13,
15,
16,
17], a limited sample [
14], and an unknown number [
10] of simulated vehicles with limited buffer size [
10,
15]. The communication characteristics were not specified in [
10,
11,
16,
18] and simulated based only on DSRC technology in [
12,
13,
14].
Besides, advances in vehicular communications technology are making content sharing within vehicular networks more effective and increasingly more popular [
19]. Some other works have explored the potential of interworking between DSRC and cellular network technologies for efficient V2X communications in favor of data sharing. The work presented by [
20] has investigated the possibility of leveraging DSRC and cellular interworking for successful V2X transmissions and examined possible DSRC and cellular combined architectures. Another study in [
21] has taken advantage of the potential of V2X communications based on LTE technology to introduce a device-to-device content-sharing approach. V2V and V2I link planning take into account both data diversity and link quality.
As can be seen, notwithstanding that connected vehicle data have recently got in the limelight of the research community, many of the previous and on-going researches have focused on the concept of data collection and sharing, yet the reuse of data has not been in focus. Notably, BSM reuse, which is of salient importance, has been disregarded in previous researches. In addition, the realities of data reuse are not yet straightforward. Some of the fundamental issues are technical, from identifying what datasets are available and the size of that data, to the wireless connections suitable for transmission.
In fact, not only BSM is particularly used for the safety purpose, but it becomes outdated, useless, and deleted From the first use. However, on the one hand, arguably helpful, safety, mobility, and efficiency are not a separated aspects. Obviously, traffic accidents can breed traffic congestion and increase CO
2 emission. On the other hand, although BSM was initially limited to the safety purpose, it has the possibility to be used outside safety. If BSMs data collected from multiple connected vehicles are be cached, grouped, stored and widely diffused, they surely help boosting safety, decreasing fuel consumption, reducing traffic jams, as well as facilitating people’s travel overall [
6]. By way of illustration, a BSM reporting a risk is locally used by safety application. However, at the broadest level, the same BSM can be seen by efficiency applications as an input to estimate alternative paths.
Conversely, as far as we know, our work is the first to consider the reuse of BSM, which is a structured dataset to provide reliable, useful, and wide-scale data sources for connected vehicles. This BSMs reuse approach can provide data source to a variety of data-related services that support multi-modal transportation applications, not only for the safety purpose, but also efficiency and mobility.
3. Connected Vehicles and Data Availability
Connected-vehicles solution is of the many technological innovations currently jostling for attention. This new technology has revolutionized the automotive industries, and built the cornerstone of the internet of vehicles. According to [
22], in 2020, the internet will be integrated in around 90% of modern cars, whereas it was integrated at less than 10% in 2013 and that certainly can help supporting next generation intelligent transportation systems. Vast research work and various industrial efforts have accelerated the achievement of connected vehicle technology. Different countries, such as the U.S. (in California, New York, Arizona, Florida, and Michigan), China, Germany, the U.K., and others, have established connected vehicles testbeds and pilot programs [
23,
24]. That is why the latter is commonly regarded as an area of development where applications find prosperous ground in the IoV epoch. By way of example,
Figure 2, summarized the main categories of connected vehicle applications in the U.S.
Indeed, great endeavors are being made by researchers towards innovative and cost-effective vehicular applications. Moreover, several applications that are proposed or under investigation are mainly related to safety, mobility, efficiency and infotainment, similar to emergency warning, traffic management, and weather information. The two most important aspects for connected vehicles to succeed technologically are then, first, numerous data need to be collected from diverse systems and sources. Second, these data should be treated and widely diffused through various communication technologies, such as DSRC, WiFi, 5G, and cellular.
Against this background, the general understanding is that better availability of data source is of the utmost importance to feed the plethora of connected vehicle applications and provide an intelligent transportation system management.
As the main thrust behind the connected vehicles is traffic safety, the BSM was initially designed to be the main message used by safety applications to shaire data among connected vehicles. Being considered as “heartbeat” messages, the BSM data tend to constitute the overwhelming majority of the CV data. Unfortunately, this valuable CV data source remains restricted in context, time and space.
3.1. Vehicular Data Representation
Vehicles are getting more and more intelligent. An average car today contains more than 20,000 components, including about 40 microprocessors and an important set of embedded sensors that can number up to 200 sensors per vehicle in 2020 [
25]. Modern vehicles hinge on these considerable sets of sensors in order to generate and exchange vehicle motion and status data. Thereby, in a connected vehicle scenario, a rich data source is the vehicle itself. Nevertheless, most data that are generated by a vehicle are primarily of a technical nature; differ from carmaker to carmaker, and even within carmakers, from model to model.
When considering the connected vehicles’ technology, which aims at sharing some of these data with third parties, a variety of data representation known as messages sets have been proposed to support interoperability and enable data exchanges among connected vehicles network. The Society of Automotive Engineers (SAE) has developed the J2735 standard, which specifies a Message Set Dictionary, explicitly to support interoperability among applications based on the DSRC [
26]. The SAE standard J2735 defines approximately 150 standard data elements and 70 standard data frames and describes 15 types of application data messages sets listed in
Table 1.
A message is a combination between two structures named data frame and data element. The data frame is a complex data structure that contains one or more data elements and even other data frames. As stated in [
27], among the fifteen messages described in the J2735, the BSM is considered to be the more important.
3.2. Basic Safety Message Data
Connected vehicle safety application are greatly dependent BSM to exchange the core data that describe vehicle status, position, and motion among vehicles, as well as between vehicle and Infrastructure. The BSM has been designed with two parts (see
Figure 3, for the format of the BSM). The Part I contains the core data information and is transmited regularly. The second part consists of other data elements that differ according to the vehicle model.
Table 2 groups Part I data elements. This content presents the official data element and data frame terminology from the standard. The Acceleration Set4Way and VehicleSize items are based on data frames, and the remaining items are based on data elements [
27].
In this paper, we focus on study and consideration of BSM as an original and affluent data source. BSMs that contain position and motion data, state information of the vehicles (e.g., latitude, longitude, elevation, heading, speed, acceleration, lights, brakes, wipers, time-stamped, path history) exist only temporarily, used locally, and are never stored.
4. BSM Reuse Model: Our Proposal
4.1. Problem Specification
BSMs frequently generated from multiple connected vehicles can play a primordial role in providing transport data and see the credible and reliable information they contain. Otherwise, given the way that BSMs are considered and treated, multiple deficiencies prevent the latter to be capable of constituting a precious connected vehicle data source. Therefore, the following features can be listed.
Context: presently, the basic safety messages are particularly even exclusively used for the safety purpose. In contrast, a big bundle of its data elements are necessary for a considerable collection of applications not related to safety. At least, the BSM Part 1 data elements can conveniently provide basic vehicle information required by several applications. Arguably helpful, safety, mobility, and efficiency are not a separated aspects. Obviously, traffic accidents can breed Traffic congestion and increase CO2 emission.
Validity: BSMs as safety data are overall regarded as snapshot data that give an idea of the state of the system at a definite time. From the first use, the BSM becomes outdated, useless, and is deleted. Undoubtedly, BSMs collected from multiple connected vehicles can be cached, grouped and stored to construct continuous data streams that can supply almost real-time metrics, while they evolve over space and time. Indeed, data are then exploited in a better-connected form to improve safety, decrease fuel consumption, reduce traffic jams, as well as facilitate people’s travel overall.
Range: as is well known, safety applications between vehicles require local broadcast of BSM within the limits of the DSRC. Even though, connected vehicles using applications are required in order to enable an extra-vehicular data exchange to permit collaborative sensing and action at scale. Thus, if transmitted according to different technologies other than DSRC, such as Cellular V2X, continuous data obtained through BSMs processing can widely feed applications with requested vehicle information.
4.2. Basic Concepts
To overcome the aforementioned difficulties, we propose a new BSM reuse model that makes use of a three-stages life cycle process. The new model is described below and graphically illustrated in
Figure 4.
The model that is shown in
Figure 4 aims to represent a view of the different stages of the BSM life cycle. Given our primary goal of not constraining BSM use contextually and geographically, the main idea is that no BSM would be destroyed; all captured BSMs should be maintained, processed and reused in different ways to create value from BSMs and deal with them as wealthy data source outside their baseline design, out of safety context and beyond DSRC.
4.2.1. Data Capture
The data capture stage refers to two different parts, the generation and the acquisition of data. The data acquisition serves as the collection of extra-vehicular data in the form of BSM as well as data generation represents the creation of intra-vehicular data through local sensor observations. An additional real-time pre-processing task is also to be conducted in order to classify and filter captured data.
4.2.2. Data Maintain and Processing
When it comes to the maintaining and processing stage, a series of actions would be performed on raw BSMs to model, clean, compress, aggregate, organize, store, and extract data in an appropriate output form for subsequent use.
4.2.3. Data Reuse
The last stage aims at opening up new possibilities for endless reuse of stored BSMs. In actual fact, several data consumers use cases may require different data delivery types. For example, a safety application or an emergency vehicle service may require a real-time dataset when an accident takes place. Contrariwise, a data analytics company might opt for historical car data in order to understand traffic trends. This stage relies on different data delivery and visualization methods to cater to these different use case requirements as well as for the purpose of knowledge production.
4.3. In-Vehicle Computing: Advantages
Vehicles are getting more intelligent and well equipped. Emerging intelligent vehicles will possess sufficient storage and computing resources to perform tasks locally, thus reducing the network load and delays. Contemporary vehicles are capable of owning a computer inside, which is an industrial edge-computer that is designed to sustain the rigors of vehicular environments while capturing, storing, and analyzing data from various sensors and devices required for Intelligent Transportation System applications. In-Vehicle Computing will then become paramount to substitute the classical Vehicle Cloud Computing (VCC).
Table 3 highlights the differences between IVC and VCC according to different features. In addition, the key advantages of IVC can be summarized, as follows.
- A
Storage: ncontrary to the centralized topology, the IVC permits the data storage inside the vehicle in the vicinity of their source of generation. This provides timely access to stored data and decreses the remot storage load.
- B
Bandwidth: in the era of the connected vehicle, the amount of generated data is growing explosively and the content demands will further become varied. When considering the distance from users in centralized topology, cloud computing cannot assure the bandwidth requirements for delivering and remote processing of such a large amount of data. By mounting the computation and storage resources on vehicles, IVC is able to properly mitigate the high-bandwidth pressure.
- C
Response Time: processing time with delivery time togeather represent the response time. In the case of centralized topology, the response time is considerable due to the delivery delay. In our decentralized topology IVC, the mounted computer as processing units is inside vehicle. Thus, the took responding time is significantly less, which enables connected vehicles to respond with more efficiency, better service, and further innovation through new applications.
- D
Contextual data: in decentralized topology, users are able to obtain real-time information related to the behavior and location of vehicles, traffic conditions, network environment, etc. Accordingly, different applications would be improved. For instance, real-time information can be delivered to various vehicular users in accordance with their interests.
In accordance with the foregoing and taking advantage of the emerging Vehicle-mounted computing technology, we propose our IVC-based model, which relies on data storage, and processing inside the vehicle and that can definitely help to address the costs of bandwidth and enable more efficient real-time applications that require fast processing and response.
4.4. Architecture Design
In our architecture, an in-vehicle computer serves as an edge computer and permits data to be processed and stored close to its source. The captured BSMs do not need to travel across the roads to a central data center, as it would in a traditional cloud-based architecture; nevertheless, the speed remains considerably faster, maintaining the latency much low.
As illustrated in
Figure 5, a vehicle performs the aforementioned three-stages, as follows.
4.4.1. Data Capture
At this first stage, to manage the data transfer process, we adopt our previous Request-To-Receive approach [
5] showed in
Figure 6, to address the blinding exchange of BSMs and reduces the average number of collected Data Element. Performing this type of validation early on has a positive impact on the bandwidth capacity.
- A
Categorization: further, we introduce a new concept of ’data temperature’ to categorize the raw data captured accordingly. Hot data represent real-time BSMs and necessitate real-time processing to be more beneficial (i.e., less than a second from receipt to action). Hot data are also cached in a database shown in
Figure 5, with red color. Cold data denote offline BSMs and are stored in blue database. Flextime processes can operate with cold data that have been stored. Hot data are simultaneously delivered alone to safety applications and to the storage function along with offline data.
- B
Filtration: without any type of filtration, vehicles could easily get flooded with data. Data filtration addresses the issue of uninformative content of received raw BSM. The non-informative content can be real-time detected just by checking whether received BSM holds new data or not. If it is the case, the BSM is stored, otherwise, it comes to non-informative BSM that will be discarded. For instance, if a vehicle travels at more-or-less the same speed and heading during the entire trajectory, the data will essentially unchanged, then there would most probably be no loss of information. Therefore, a proper two-steps algorithm is performedin order to fulfill the categorization and filtration tasks. The algorithm will save valuable information and discard the rest.
Step 1: the designed algorithm examines the data element DSecond to know whether the message is possessing a real-time or offline data. The period of the message transmission is supervised by the DSecond data element. The later provides a time value when a BSM is populated with data there may be a lag between the time the data is collected and populated in the BSM. BSMs are then grouped into two categories: hot and cool. Each of these two groups of data will require different kinds of processing and storage functions.
Step 2: the algorithm inspects the value of two data elements TemporaryID and the MsgCount of every hot BSM. It discards the BSM having old content but simultaneously notify local safety applications and storage each BSM having new content.
4.4.2. Data Maintain and Processing
Maintaining the captured BSM is the main task in our approach focused on preparing data for analysis and further reuse. It refers to data storage, modeling, reduction, and aggregation.
- A
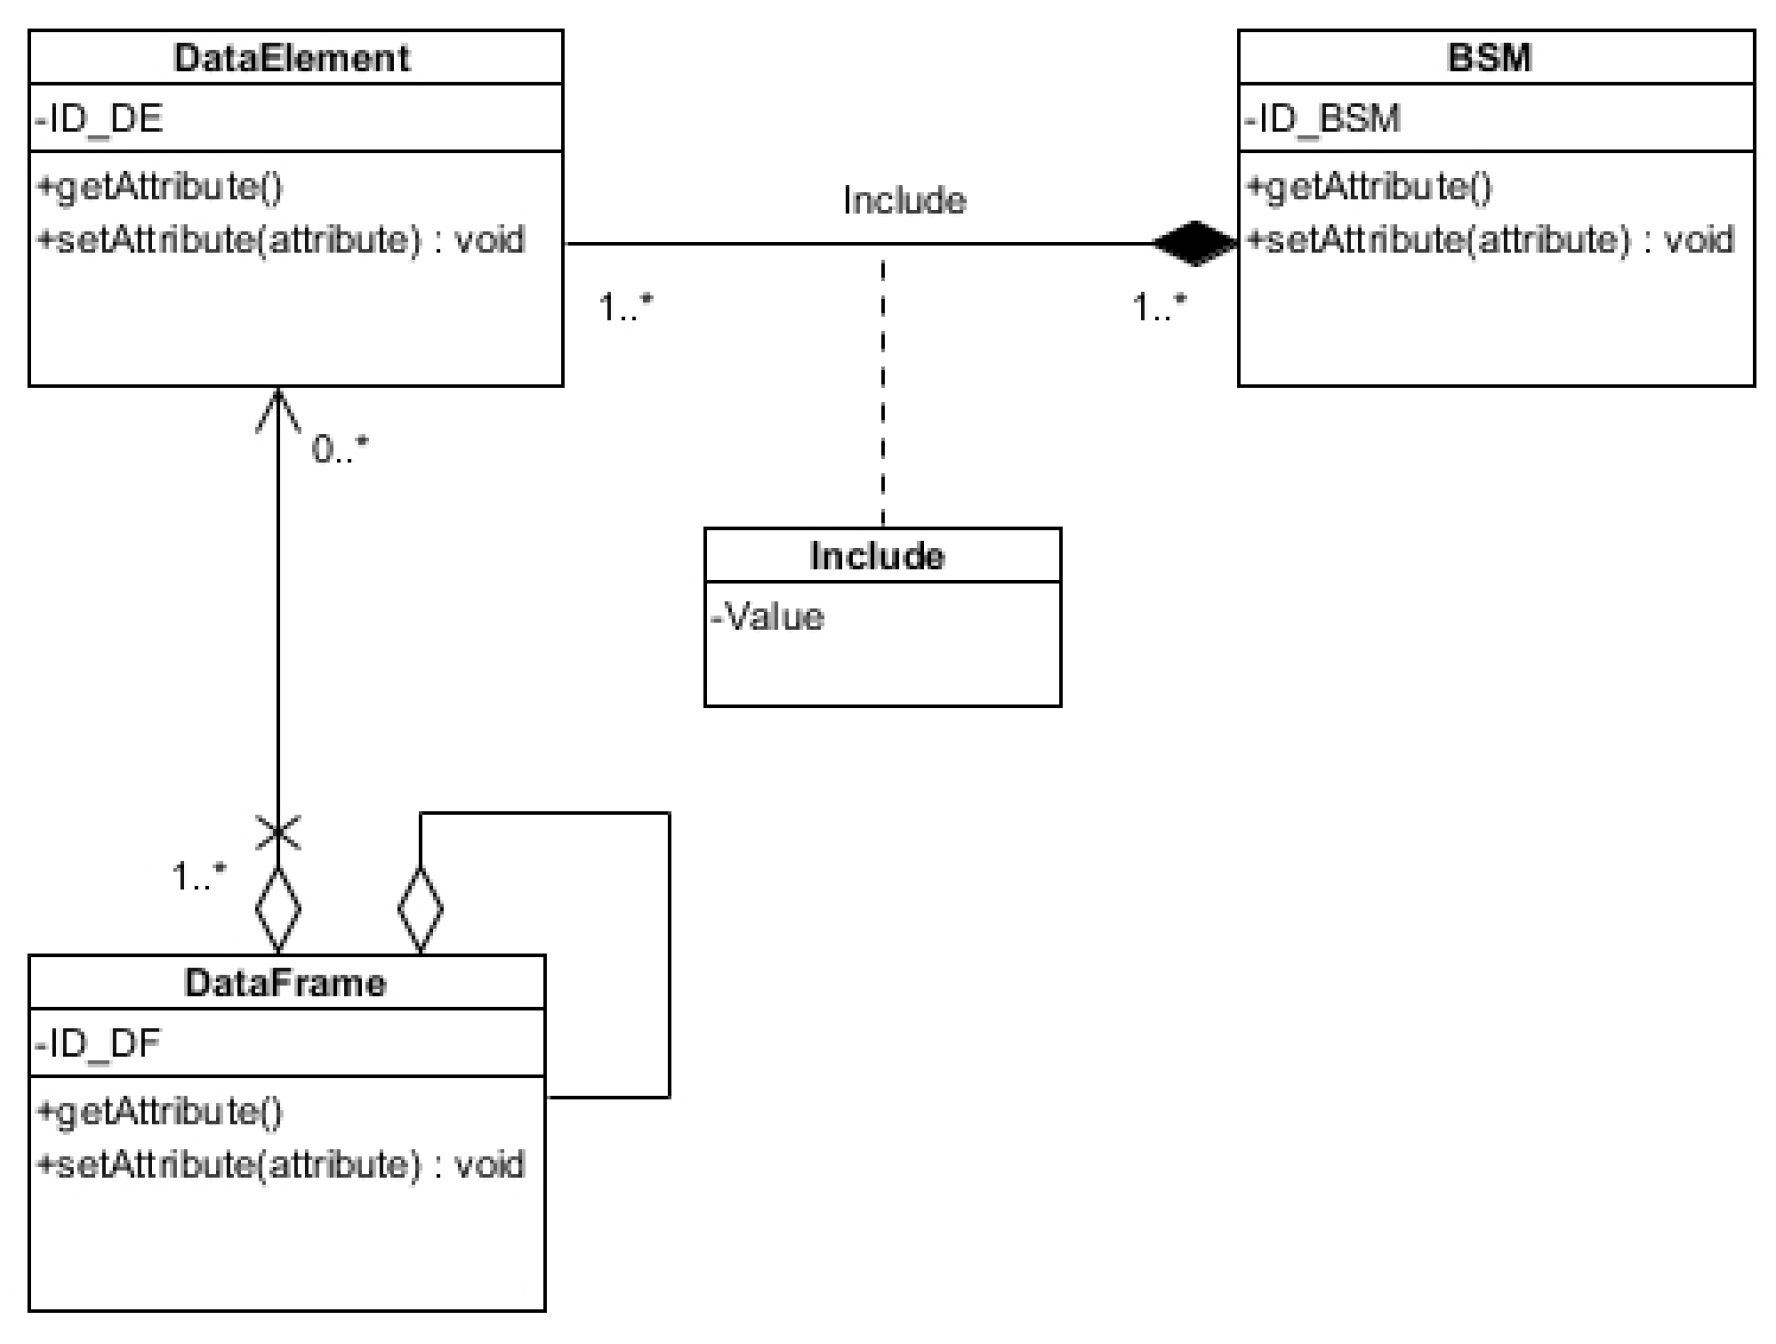
Data storage and modeling: Messages, Frames, or Elements? After capturing the raw data, there is a requirement to transmit the data to suitable in-vehicle data storage systems for further processing and reuse. Accordingly, consideration should be given to how data are stored. Referring to the data is received as messages. The messages contain frames and the frames contain data elements. Connected vehicles and other related system functions usually require the use of data elements, but each element needs a location in time to make it useful.
Messages: storing the data as messages would demand any future use of this information to inquire and access data elements across multiple messages. Furthermore, these messages will contain multiple elements that are not used by the function and may accordingly be inefficient to be accessed, used, and/or transmitted.
Frames: to store the data as frames alone would not suffice, since many of the data elements are not necessarily in a frame.
Element: if data are stored as elements alone, then any information concerning the association between data elements is lost. For example, if a BSM is divided into its elements, relationships between windshield wipers activation and temperature in a particular vehicle would not be known. However, such associations between data contained in messages generated by an individual vehicle can be generally accommodated by using the temporary ID assigned to messages sets to associate data for access or use. Because the association between data with one vehicle can be accommodated, it may be beneficial to store the data as elements. Overall, storing BSMs as elements that are associated with each other would allow each function or request to obtain information to only access the data elements it requires. Accordingly, we propose the relationship modelization that is shown in
Figure 7.
This approach allows for elements of the same type from different messages to be grouped together. For example, if the vehicle is responding to an inquiry from other connected vehicle requesting weather data, it would be able to read elements such as temperature and windshield wiper activations from a single query, even though the data had been retrieved from multiple messages.
- B
Data reduction: data reduction is responsible for decreasing data storage requirements and communications bandwidth. A range of data reduction techniques may be appropriate to allow our model to minimize data storage requirements and communications bandwidth.
- 1
Compression: BSMZip (lossless compression for basic safety messages) Multiple compression techniques, including both lossy and lossless, could be applied to connected vehicle data. Lossless compression ensures data integrity and is more suitable for BSMs data.
In our model, we consider the application of run-length encoding (RLE) on a stream of BSM data. To the best of our knowledge, it has not been applied yet for data handling in the automotive domain.
- 2
Aggregation: different data aggregation strategies are appropriate to allow our model to perform a wide range of data processing, summarization, and display. Our model contains complicated aggregations on particular data elements, geo-fences, and some parameters for particular routes and areas of interest for end-users. Some of the connected vehicle applications may need to adopt a geo-fencing technique to help with limiting the data to be exchanged. This aforementioned technique defines an area of interest by drawing a boundary on BSMs, inside this defined area, specific data processing function can be accomplished. For instance, a speed detector on a highway may be a rectangle covering all lanes, in which any BSMs may have this speed qualified for further processing. Moreover, contextual aggregation of stored BSMs is performed using our previous ALFA scheme [
5] to open up new possibilities of using BSMs outside the safety context.
4.4.3. Data Reuse
Next to the data maintaining function discussed above, access to data is a critical enabler for the efficient and wide reuse of BSMs into a multimodal transportation system. Hence, many data consumer use cases that may require different types of data delivery should be considered. Our model provides several data formats and it relies on different data delivery mechanisms to cater to these different use case requirements.
- A
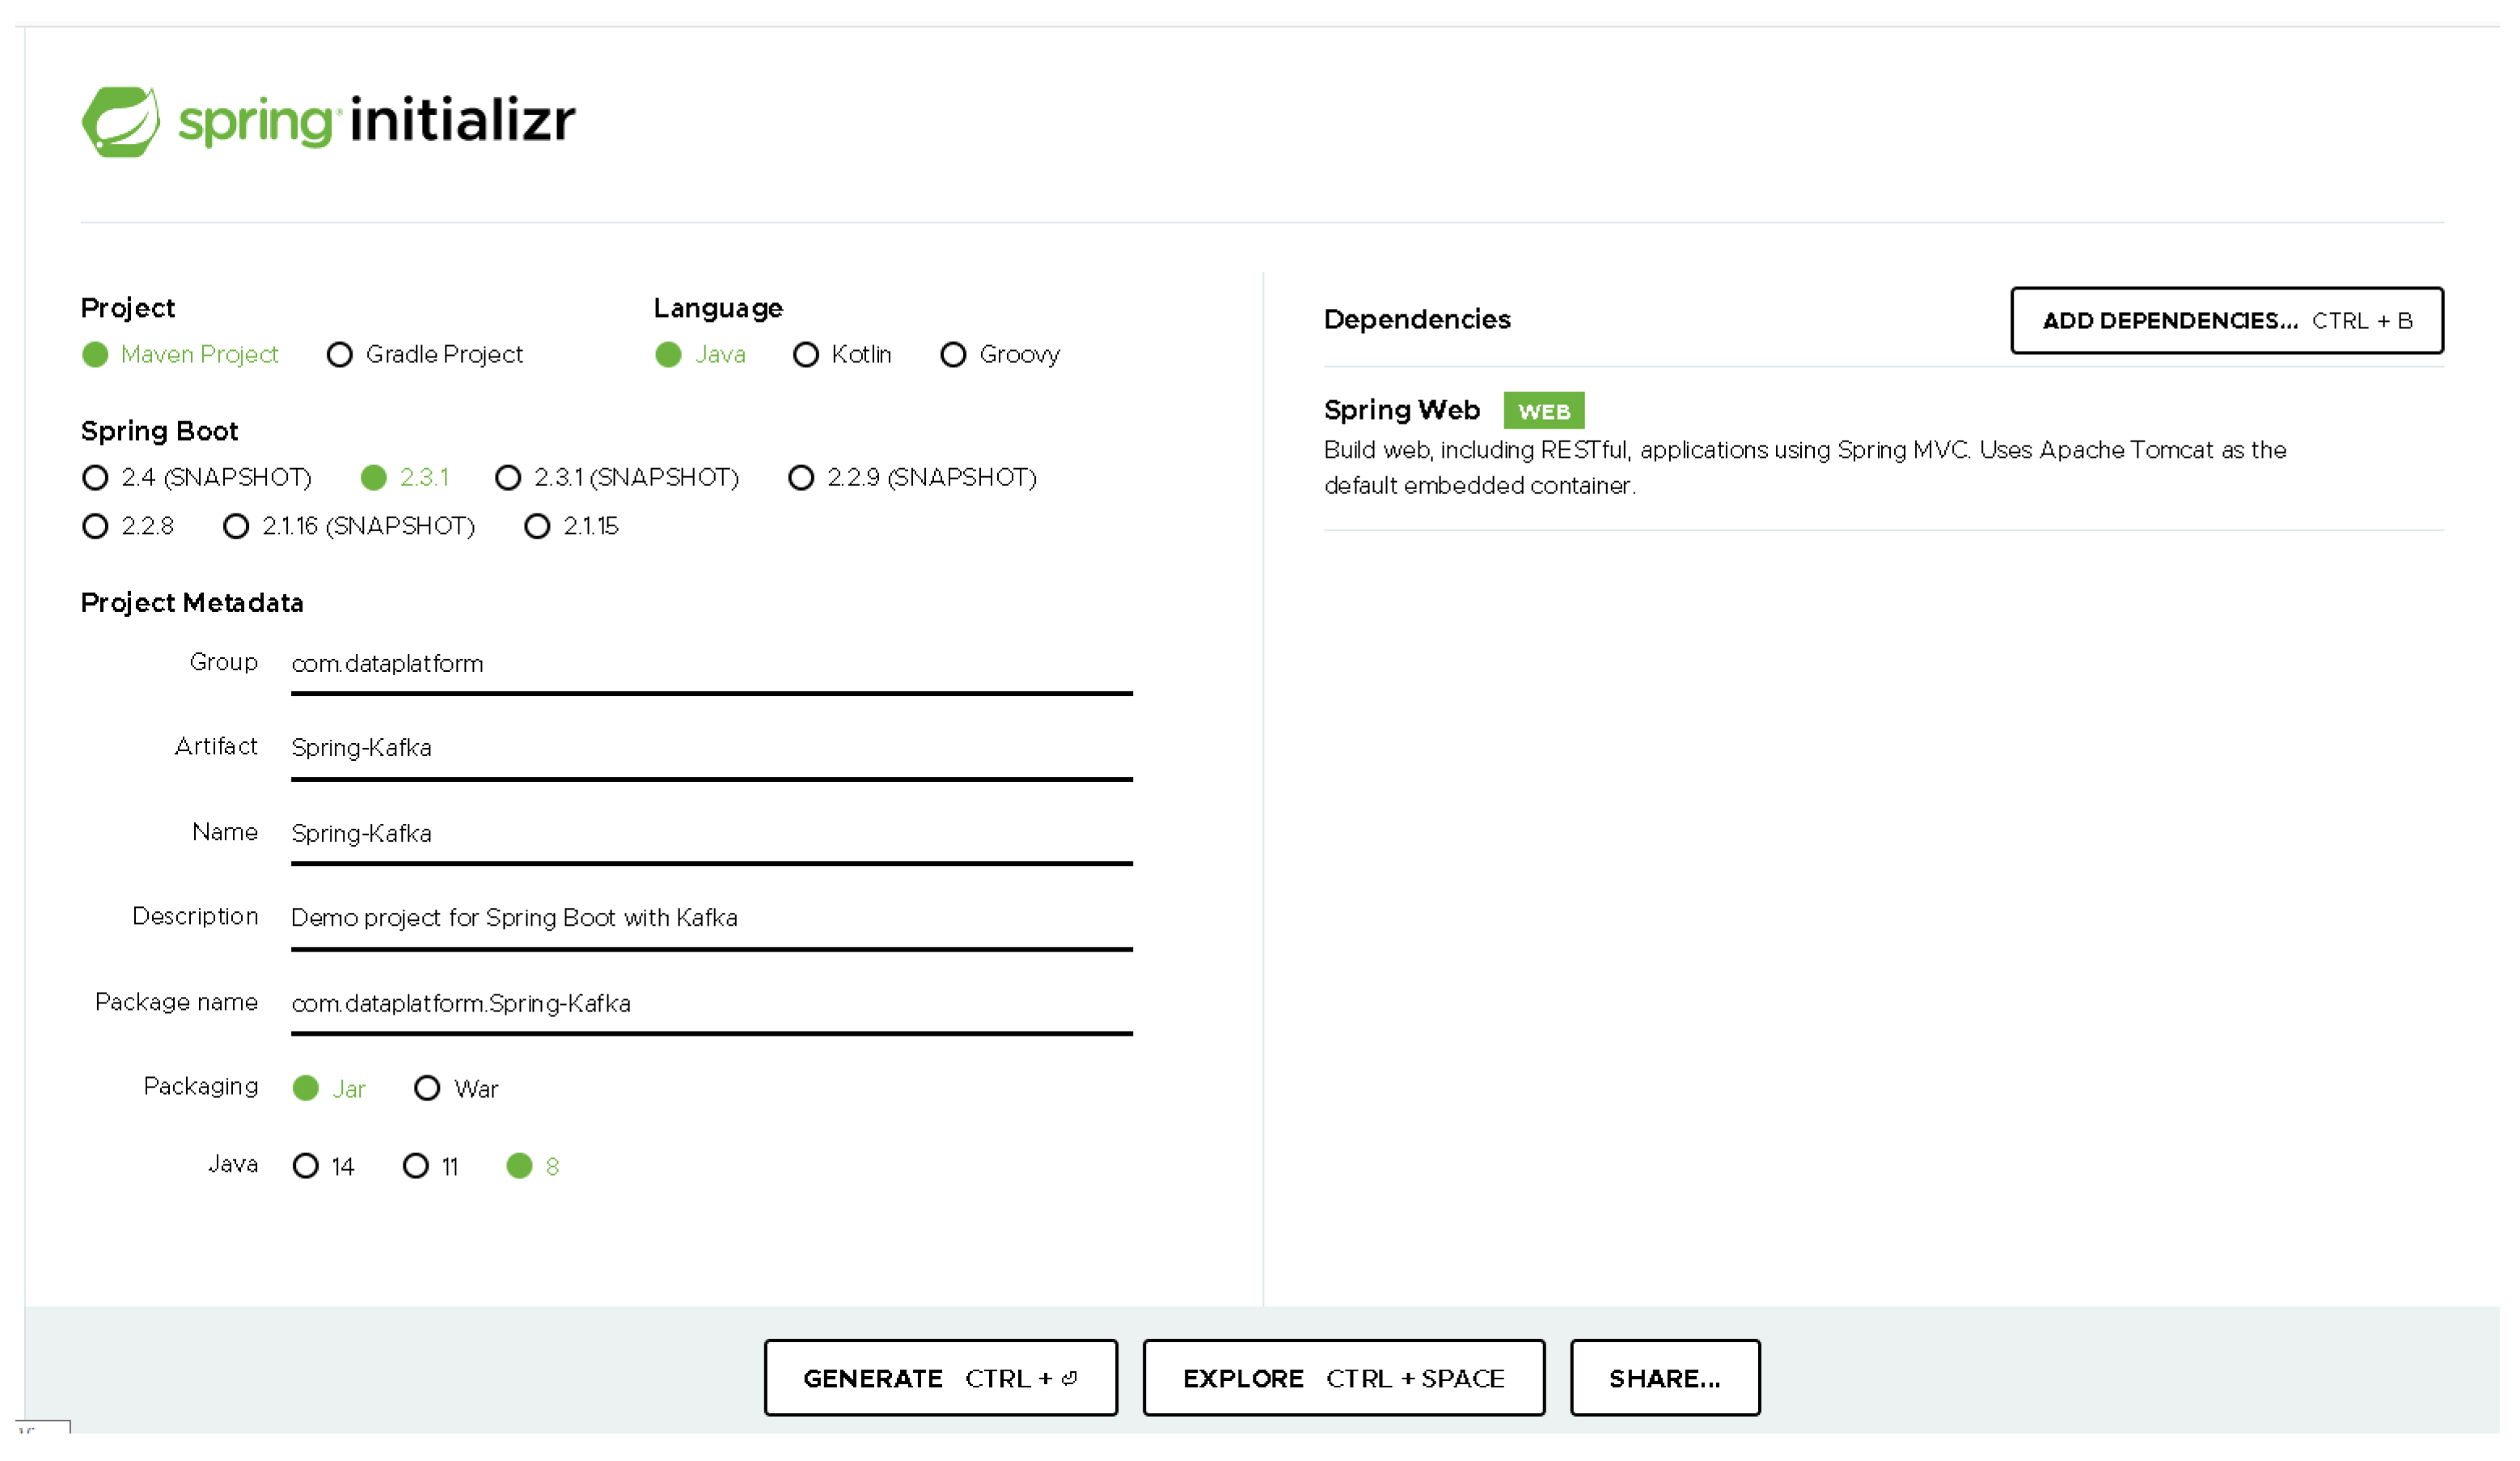
Data reshaping formats: we can imagine and design a bunch of solutions such as a suite of APIs, portals, and apps to turn the passive stored BSMs into an active and actionable dataset and make every data element count. Hence, to support that and make this valuable dataset available for sharing and consumption, we count on a handful of data formats, as shown in
Figure 8, including JSON, XML, and CSV in order to provide standard data that developers, systems, and applications can easily reuse. Neither type is better than the other, we simply provide the ability for developers, systems, and applications to select the one that meets their requirements the best.
- B
Data delivery:as we mentioned earlier, our model serves two types of vehicle data, hot data that refers to real-time data and cold data represented in offline data. Data delivery is a sort of service that allows for different transport agents to re-use the stored BSMs across the following methods.
- 1
Streaming: usually, hot data are better served using a push mechanism, which ensures minimal delay and packet loss. Besides, streaming is the ideal delivery mechanism for applications that require hot, rich, vehicle data. As a means to guarantee optimal and rational streaming, we count on our previous RTR approach that permits requesters to determine filters, like Data Element list, geo-fencing, and maximum latency, so they timely only get their desired data.
- 2
Data Query: we rely on this retrieval technique to open up to different data consumers’ the possibility of making requests on our database to obtain desired data. Data query is, therefore, a pull mechanism to provide hot or cold data by having data requests.
- C
Data analysis: another way to reuse stored BSMs is by the application of emerging data analytic methods like machine learning. Machine-learning techniques can inspect our BSM dataset and make possible the patterns recognition (like real-time vehicle traffic, and driver behavior different road traffic conditions), decision-making, and/or future trends forecasting.
- D
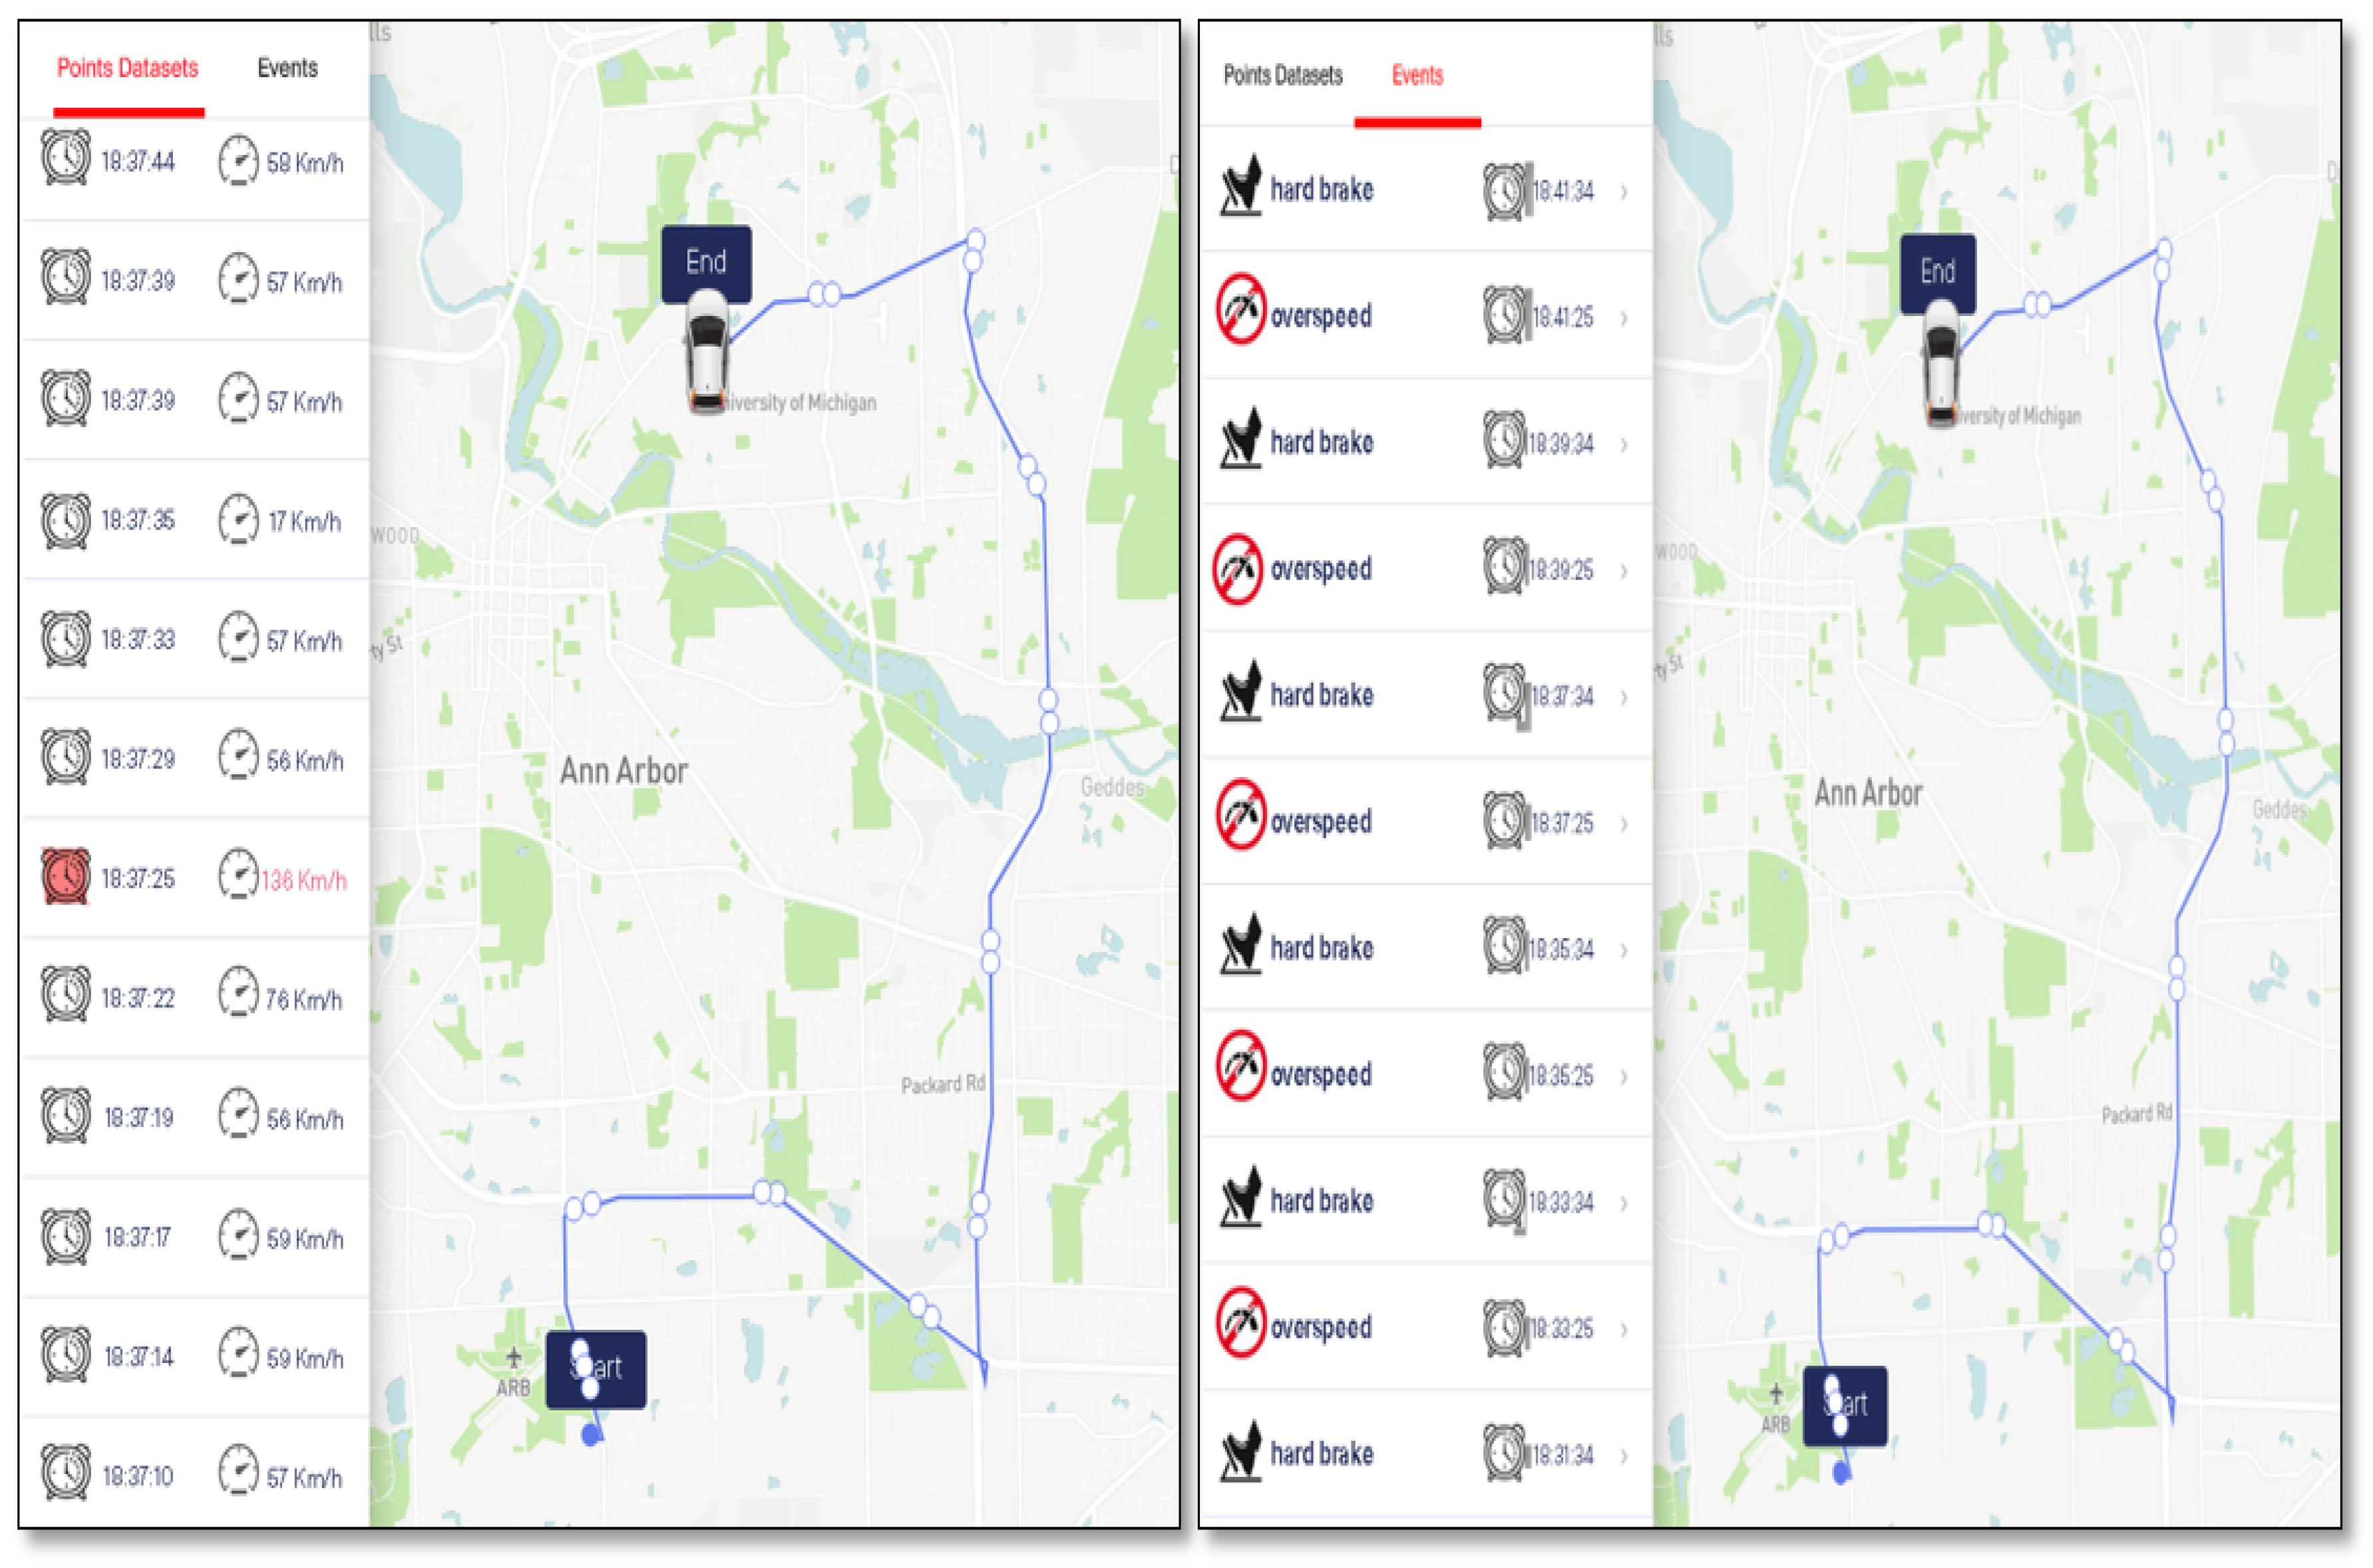
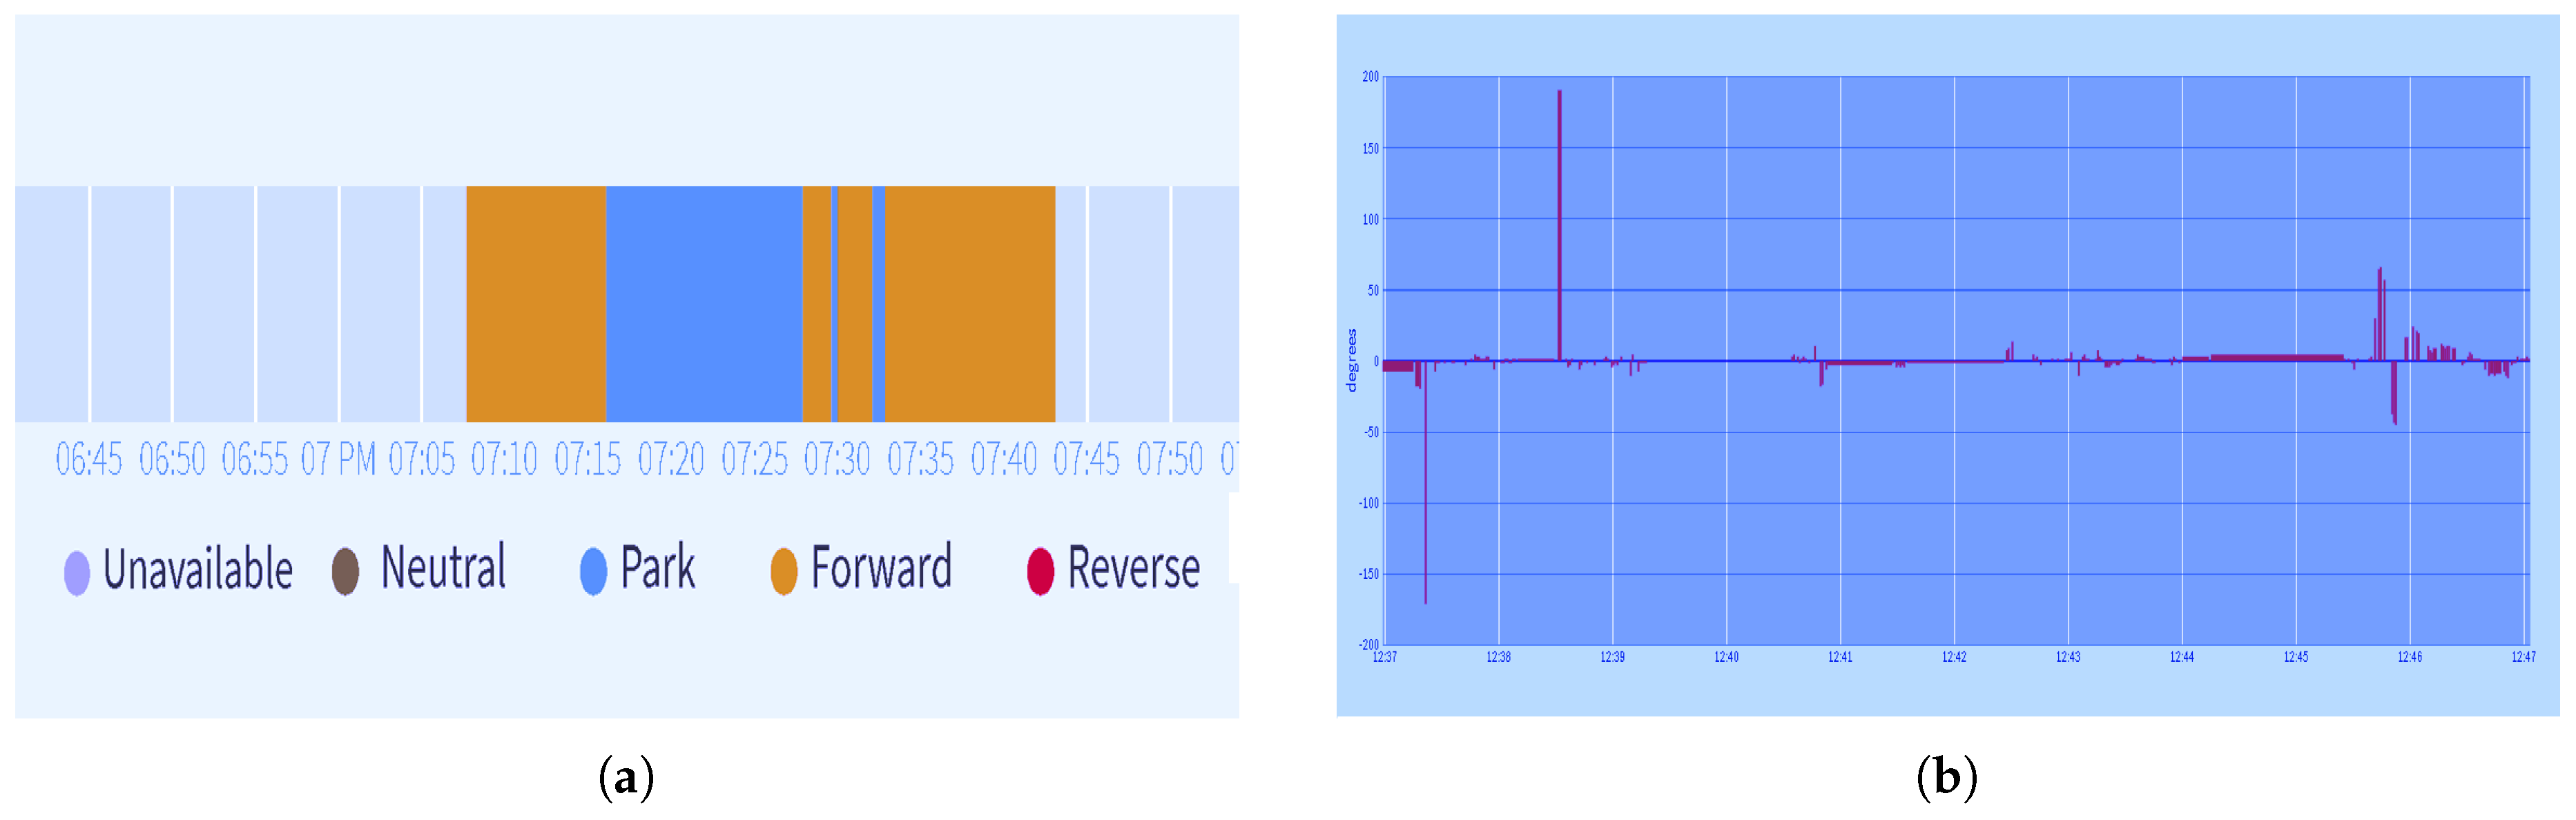
Data visualization: from another perspective, the BSM dataset can feed various data visualization tools and techniques to provide monitoring data about vehicles on the road and support decision-making to significantly improve the efficiency of transport system operations. For instance, it is practicable to visualize different data elements according to time and geofencing limits.
6. Conclusions
Given our primary goal of not constraining BSM use contextually and geographically, in this paper, we introduced a new philosophy that aims at conserving collected BSMs and adopting the In-Vehicle Computing paradigm in order to create a reliable and useful transport data source. We then proposed our new BSM reuse model based on three-stage process. In its first stage, our proposed model captures generated and acquired BSMs. Then, in the second stage, it would perform a series of procedures on the raw BSMs to be storable according to the proposed model. In the third stage, our model aims at opening up new possibilities for the endless reuse of stored BSMs.
Later in our study case, we built an embedded data platform accrediting the Model-View-Controller design commonly used for developing user interfaces. This new platform has accomplished several purposes of data reduction, delivery, and visualization. We were able to perform lossless data compression and considerably reduce the data size; the thing that has a positive impact on bandwidth and storage requirements that have been reduced by about 80%. We have also achieved different data delivery according to the Pull and Push mechanisms to cater to the different data consumer use case requirements. Adopting the ANN paradigm, we obtained an accuracy of 0.9988 in carrying out traffic volume prediction. We attained the visualization of some data elements to enhance analytics and support decisions-making for transportation.
Our work bears certain limitations that should be recognized. First, the proposed model was partially developed using a pre-collected BSMs, forthcoming works should focus on the data capture stage. Second, our in-vehicle platform has been restricted to an isolated vehicle far from real-world traffic, so the number of vehicles, as well as real-world traffic conditions, should be considered in future work. Third, our in-vehicle platform was tested in a private wide area network by limited users, further works are required to correct this deficiency by making our platform publicly available.


