Abstract
In this paper, we highlight the benefits of using computer-generated VR in teaching instructional content that have spatial frameworks such as in science, technology, engineering, and mathematics (STEM) courses. Spatial ability scores were collected from a sample (N = 62) of undergraduate and graduate students. Students were required to complete an instructional tutorial in VR and computer desktop screening on DNA molecules, which included necessary information about DNA and nucleotide molecules. Students also completed a comprehensive test about the spatial structure of DNA and a feedback questionnaire. Results from the questionnaire showed media use and satisfaction to be significantly related. The results also showed a significant interaction between spatial ability levels (low, medium, and high) and media used on students’ spatial understanding of the DNA molecules. It may be concluded that VR visualization had a positive compensating impact on students with low spatial ability.
1. Introduction
Research shows that people differ in their visual mental imagery, for example, image generation and rotation [1,2,3]. Visual mental imagery is affected by the external world and the viewer’s belief. In some cases, for instance, people need to mentally rotate a figure to see and describe the object [4].
Many researchers have recognized the importance of spatial abilities for success in many STEM areas [5,6,7,8]. Wai et al. [6] and Stieff and Uttal [7] indicated that spatial ability plays an essential role in building up knowledgeable people in the STEM disciplines and helps to recognize students with the potential for STEM careers as well. Spatial ability is “characterized as an individual difference attribute with particular relevance for learning the advanced scientific-technical material needed for developing outstanding STEM contributors, those individuals capable of moving engineering and physical science disciplines forward” [6] (p. 817). Other studies in spatial ability show that there are many careers such as chemistry, biochemistry, architecture, and medicine, to name a few, for which the spatial visualization and mental rotation abilities are essential [9,10,11]. Inability in mental visualization may have negative effects on students’ self-efficacy to learn and perform in disciplines that rely on spatial skills [12].
In this current research, our goal was to assess the impact of VR on learners’ performances in an environment with spatial frameworks such as in biology. We designed an instructional module on DNA structure using three-dimensional (3D) computer graphics presented on the computer screen and 3D computer graphics displayed in the VR environment. We used VR to improve students’ attention to macromolecular constructs and stimulate their spatial ability through the use of VR. Immersive environments, such as VR, increase the user’s sense of perception and interactivity [13] and are unique tools for learning molecular biology.
1.1. VIEs (Virtual Immersive Environments)
Two different kinds of VIEs can be identified: (1) augmented reality (AR); and (2) VR. AR uses an existing scene and imposes descriptive detailed information over it [14]. VR, however, gives the perception of being physically present in a non-physical world [15].
Research shows the roles of simulation in creativity education and how highly interactive VIEs may develop positive learning behavior to enhance the learning experience [16]. Several characteristics of VIEs, such as visualization of 3D data and the opportunity to simulate a realistic and safe environment, encourage student engagement. VIEs provide a hands-on and immersive experience, which is a novel way of learning for students who may not have experienced this before. Engagement is the primary objective in gamified VIEs, and research indicates the importance of this factor [17]. For example, a virtual field trip to Mars or the bottom of the sea may spark new interest in subject matter, provide a shared experience for class discussion, and enhance overall engagement [18].
Moreover, VIE characteristics are built upon situated and constructive learning theory [19]. One of the salient features of this theory and its implementation is the issue of transfer [20]. In near transfer, the goal is to help learners to apply steps learned in training to a similar real-world situation. The far transfer, however, is the ability that enables learners to adapt strategies learned in training to different work problems [21]. The advantage of using an immersive interface is that by simulation of the real world, students can attain near transfer, skills, and knowledge which are used the same way every time, to prepare for future learning [22]. Other researchers also have described student involvement in immersive learning environments that offer authentic learning experiences [23,24].
1.2. Spatial Ability and STEM Learning
Research shows that visual representations play an essential role in improving STEM learning [25]. According to the National Research Council (NRC) [26], STEM content areas involve the integration of multiple visual representations for teaching and learning. Based on the multimedia learning theory and cognitive learning theory, the visual representation may help students to learn better because they make abstract concepts accessible [27]. That is, students can understand the concept by integrating them into a mental model of the content.
Fogarty, McCormick, and El-Tawil [28] used a mixed-methods study combining qualitative and quantitative methods to investigate the use of VIEs to aid students’ understanding of complex spatial models in structural engineering. Results showed that students were able to identify and visualize complex models more accurately, and there was a significant increase in average mean scores of the posttest of students who experienced CAVE-like VIE.
Another example is when researchers investigated the effects of direct manipulation of a virtual anatomical structure versus passively viewed an interaction in a stereoscopic 3D environment. The results showed that participants in the manipulation group were more successful in generating the observed structure than the viewing group. It also showed that manipulation benefited students with low spatial ability more than students with the high spatial ability [29].
Other research also shows the use of VIEs in higher education science classrooms and its positive impact on class learning experiences, including an increase in motivation and interactivity [30,31].
Therefore, STEM-related lessons should be noted as highly engaging. The current research project was concerned about how people engage with the VIEs and if users’ experiences with the learning of STEM lessons can be modified for the better through the use of the current research design.
For example, to create a framework of best practices for designing VIEs, Ritz and Buss [3] incorporated different instructional design strategies for constructive learning, including lesson design, space, and technology. In their design, Ritz and Buss [32] considered a major factor, namely spatial ability. Other research has also shown the importance of designing instructional design strategies that are aligned with the spatial ability of students [16,33]. This factor is essential for designing a lesson for students with low or high spatial ability, and research shows that VIEs are well suited to deliver 3D spatial concepts [34].
Other researchers have created experimental virtual environments for training different skills. Students were divided into two groups: a traditional computer with a screen for the control group and VR for the experimental group. The results of the study confirmed that the design of VR learning activities can help students to improve their spatial ability skills [35].
One of the affordances of VIEs is the spatial presence. Research shows that the individual’s spatial presence in VIEs is different from physical reality, and spatial presence and spatial ability are linked [36]. Research shows that individuals feel more present in VIEs, and there is a positive attitude change associated with it as well [13].
Bandura [37] pointed to perceived self-efficacy as a factor that may have a direct effect on the choice of activities and eventual success. According to Venkatesh [38], three factors may influence individual attitudes toward computers and computer use: computer playfulness, computer self-efficacy, and computer anxiety. Additionally, it is reported that higher self-efficacy affects individuals’ spatial ability [12,39]. The importance of these three factors and self-efficacy in students’ academic success, specifically in STEM areas that have spatial frameworks, have been investigated through many research studies [40,41] to determine how they connect with student learning and success.
1.3. Objectives and Research Questions
The overall objective of the current study was to see how individuals learn in VIEs and whether the spatial ability of individuals may influence their learning and satisfaction.
The current research study is important because it is concerned with the effectiveness of using immersive technologies in learning environments with spatial frameworks and whether it is useful to redesign traditional learning materials into VR to help students with less visuospatial skills.
The current research study pointed explicitly to the following research questions.
- Does media (VR and desktop screening) have an effect on the spatial understanding of DNA molecules between students with low, medium, and high spatial ability?
- Does media (VR and desktop screening) affect student satisfaction, usability, and perception with different spatial ability?
2. Material and Method
2.1. Experimental Design
The interaction between self-efficacy and spatial ability in environments that have spatial frameworks such as STEM has been investigated by many researchers [12,42]. We used the method of Towle et al.’s [12] because it was similar to what we had intended to achieve. Towle et al. [12] used a test of spatial ability and a self-efficacy to see if individuals’ self-efficacy has any effects on their actual spatial ability. In the current study, we too wanted to see if individuals’ spatial ability influences their satisfaction toward different media use, mainly VR and desktop screening. In doing so, we used Yoon’s [43] Revised Purdue Spatial Visualization Test: Visualization of Rotations to group students into different levels of spatial ability (low, moderate, and high). In addition, a satisfaction questionnaire was designed to measure students’ satisfaction, usability, and perception toward using VR and desktop screening.
2.2. Design of VR and 3D Environments
We used different 3D visualization software such as Blender combined with the Unity game engine to create an effective VIE. To create our 3D macromolecules, we used the Protein Data Bank (PDB), which is a 3D depository of biological macromolecules such as protein and nucleic acids. PDB files can be imported into Blender using ePMV add-ons for Blender. A detailed description of this process has been published by the authors [44].
For our desktop screening condition, the tutorial about DNA structure was created in Adobe Captivate. Then it was modified and imported into the Unity game engine to be used in VR. In Unity, we programmed our 3D objects and environment using C# scripting to be interactable.
2.3. Content for Tutorial
To prepare the tutorial, Alessi and Trollip’s [45] process of instruction for learning was used, namely presenting information, guiding the learner, practicing, and assessing.
The material for the tutorial was created and validated by experts from the biochemistry department. Students were introduced to the structure of nucleic acids to recognize that: “(1) Deoxyribonucleic acid (DNA) is composed of phosphate, deoxyribose, and four major bases: adenine, guanine, cytosine, and thymine. (2) DNA is polymers of nucleotide subunits. (3) A nucleotide is composed of a phosphate group, a pentose sugar, and one of the four corresponding bases. (4) The backbone of a DNA molecule is a chain of repeating deoxyribose-phosphate units. (5) DNA is composed of two chains in the form of a double helix. (6) In DNA, adenine will only bind with thymine on opposite chains, and guanine will only bind with cytosine on opposite chains” [44] (p. 50). Figure 1, Figure 2, Figure 3 and Figure 4 show examples of content used in desktop screening and in the VR environment.
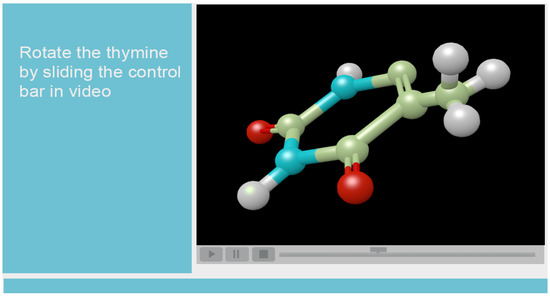
Figure 1.
Examples of content for desktop screening: 3D representation of thymine.
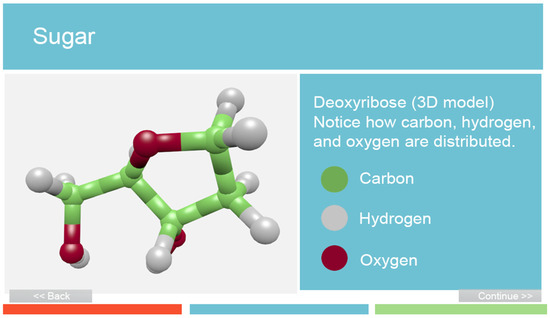
Figure 2.
Examples of content for desktop screening: 3D representation of sugar.
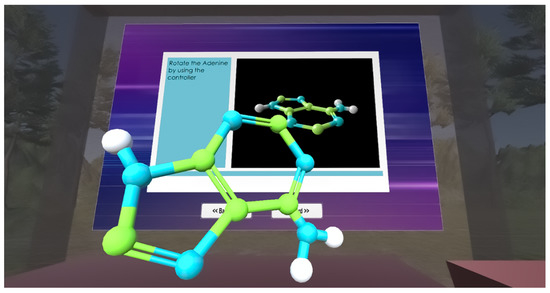
Figure 3.
Examples of content for VR: 3D representation of adenine.
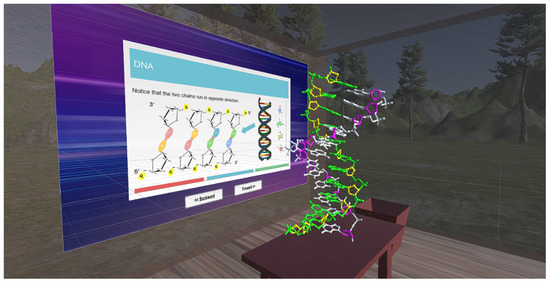
Figure 4.
Examples of content for VR: 5’-end and 3’-end.
The content for desktop screening was designed using adobe captivate. Adobe Captivate is an authoring tool that provides interactive lesson design. The 3D models created in Blender, a 3D modeling software, were rendered and implemented into Adobe Captivate, and then interactive elements were added to it. As mentioned above, we used Alessi and Trollip’s [45] instructional guideline to create the tutorial. The tutorial introduced the objectives, guided students through the instructional materials, provided examples to practice, and assessed the learning performance of students. Students needed to answer correctly to proceed to the next level. Otherwise, they needed to go back and review the content again.
The same content was used to design the VR environment. However, students had the ability to interact with 3D virtual objects using VR controllers. The instruction for tutorial was projected on a screen inside the VR which resembled a slide projection in classrooms. Students read the instruction to complete each module. For example, students learned how each DNA molecule has two strands of nucleotides, and the orientation of the sugar molecule is opposite in two strands, or they recognized the major and minor grooves which arise from the antiparallel arrangement of the two backbone strands.
After completing the tutorial, students in each group took a final quiz. The final quiz consisted of 15 questions that challenged students’ spatial recognition of DNA molecules. Figure 5 and Figure 6 show examples of spatial recognition quizzes. The quizzes were designed to assess students’ spatial understanding of DNA structure. As shown in Figure 5, students were asked to recognize the major and minor grooves or identify which two representation of adenine and thymine are the same (Figure 6).
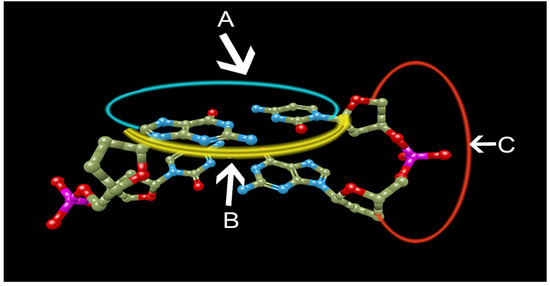
Figure 5.
Examples of spatial recognition quizzes: Which letters represent the major and minor grooves?

Figure 6.
Examples of spatial recognition quizzes: Which two letters represent adenine and thymine?
2.4. Conditions
2.4.1. Desktop Screening
Students used a desktop computer screen and a mouse to interact with 3D molecules. Through this method, students could rotate the 3D models using the mouse. Content included interactive components of molecular DNA structures, drag and drop activities, and a self-assessment. For example, after learning how carbon, hydrogen, and oxygen are distributed on a deoxyribose molecule, students used the mouse to rotate the sugar molecule on the desktop screen to have a mental image of it. Then, in a game-like activity that provided immediate feedback, students could drag and drop each element to compose the sugar.
2.4.2. VR
Students used the Unity game engine, an HTC VIVE headset, and two controllers to navigate through 3D models in VR environments. The instruction and 3D materials for each learning task were provided in VR. After completing the task, students could click on a forward button to enter the next level. After completing the tutorial, students had the opportunity to assess their learning performance. For example, a 3D model of nucleotide base related to the purine was provided to the students. Students were asked to use their controllers to grab the right components that were provided for them and attach them to the correct locations to build a guanine molecule. This activity provided students with immediate feedback too.
2.5. Participants
Undergraduate and graduate participants were recruited from a four-year research university located in the southwestern region of the United States using announcements placed in the electronic announcement system or postings within approved departments. A sampling of (N = 66) undergraduate students were randomly assigned to one of the two conditions. Thirty-three participants were assigned to the desktop screening environment (four students did not complete the research activities, which reduced our participants to N = 62). In contrast, thirty-three were assigned to the VR instructional environment. None of the students had majored in biology or biochemistry. However, all of them had some elementary knowledge about DNA molecules. Although participants differed in the level of education and prior experience about the subject, the focus of the current research was on participants’ spatial understanding rather than rote learning.
Table 1 summarizes the demographic characteristics of the participants in this study. There were 30 male participants (48.4%) and 32 female participants (51.6%). The participants also identified themselves as a freshman, sophomore, junior, or senior (n = 40, 64.5%) and college graduate, some graduate work, or postgraduate degree (n = 22, 35.5%). The majority of students were 18–29 years old (87.1%). The rest were 30−49 (12.9%).

Table 1.
Participants Demographic Frequencies on Gender and Level of Education.
In addition, participants also rated their computer skills. Collectively, participants self-reported computers skills to be average (n = 24, 38.7%), somewhat high (n = 26, 41.9%), very high (n = 11, 17.7%), and somewhat low (n = 1, 1.6%).
2.6. Procedures
Selected participants were assigned to the research activities created in the VR or desktop screening. Students were given time to familiarize themselves with the environments. After completing the tutorial and respective activities about DNA structure, students completed a demographics questionnaire and then answered a 30-item spatial ability test. After the spatial ability test, all participants completed a quiz that measured their ability to recognize different components of DNA molecules. Finally, they completed a satisfaction questionnaire.
2.7. Instruments
2.7.1. Satisfaction Questionnaire
The questionnaire was adapted from Lincecum [46] which assessed learner satisfaction of the desktop screening and VR environments presented in the research activities. The questionnaire items were grouped to measure: (1) students’ satisfaction toward media in general; (2) usability of the features; and (3) interactivity/perception. A five-point Likert scale was used to score each item of the questionnaire (Figure 7). The reliability analysis was run for sixteen satisfaction questions. The Cronbach’s alpha was 0.90.

Figure 7.
Grouped satisfaction questionnaire.
2.7.2. Revised Purdue Spatial Visualization Test: Visualization of Rotations
This instrument consisted of a 20−30 min test to measure the individual’s spatial visualization ability in 3D mental rotation. It consisted of 30 items (13 symmetrical and 17 asymmetrical). These items were designed to be gradually more difficult [44]. The spatial ability of students was grouped into low, medium, and high by calculating the percentiles (Figure 8).
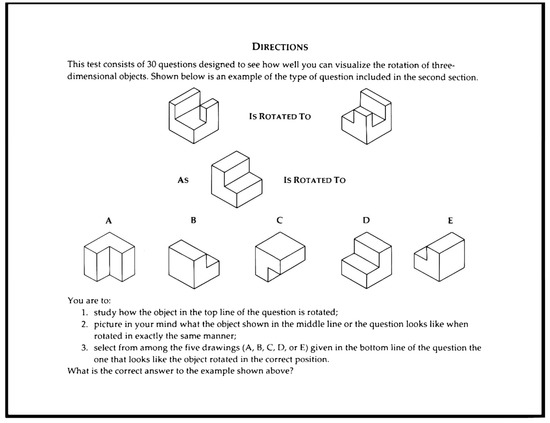
Figure 8.
Revised Purdue spatial visualization test.
3. Results
The purpose of this study was to examine the effects of VR in environments that have spatial frameworks. In doing so, the learning performance of individuals (N = 62) in two different conditions were examined. These two different conditions introduced a lesson about DNA structure in desktop screening (n = 29) and VR (n = 33). Finally, satisfaction in two different conditions was measured to answer the research questions.
- Does media (VR and desktop screening) have an effect on the spatial understanding of DNA molecules between students with low, medium, and high spatial ability?
- Does media (VR and desktop Screening) affect student satisfaction, usability, and perception with different spatial ability?
To measure the data gathered from students, we used the IBM SPSS version 26. We deleted incomplete data gathered from four students who had not completed the research activities.
The accuracy of variables was measured through a reliability analysis. Measured variables, including spatial recognition and satisfaction, had Cronbach α value higher than 0.70, therefore indicating the reliability of the results.
3.1. Research Question 1
Does media (VR and desktop screening) have an effect on the spatial understanding of DNA molecules between students with low, medium, and high spatial ability?
To examine this research question, individuals’ spatial recognition in two different groups were measured. Although, desktop screening group had (n = 29) participants, both the test of normality and Levene’s test were not significant. This indicates that the assumptions of normality and homogeneity for an ANOVA test were not violated.
An ANOVA was conducted to evaluate the effects of independent variables, spatial ability (low, medium, and high) and media (VR and desktop screening), on student spatial recognition of DNA structure (dependent variable). As shown in Table 2, the results for the ANOVA indicated a significant for both spatial ability main effect and the spatial ability-by-media effect. The partial eta squared (η 2) showed a medium effect size. Figure 9 shows the frequency of each level of media within three spatial ability categories affected by the spatial recognition score.
Table 2.
ANOVA result for spatial ability and media on spatial recognition.

Figure 9.
Frequency of each level of media within three spatial ability categories affected by the spatial recognition score.
As shown in Table 3, the analysis showed a significant difference, p < 0.05, in spatial recognition among spatial ability groups using VR and desktop screening. Pairwise comparison showed that there was a significant difference, p < 0.05, only between low and high spatial ability groups.
Table 3.
Descriptive Statistics for Research Question 1.
The result also showed that media had no significant effect on spatial recognition, but it is important to note that the mean value (M = 5.90) of VR group with low spatial ability was higher than the mean value (M = 4.75) of desktop screening group with low spatial ability (Table 3).
3.2. Research Question 2
Does media (VR and desktop screening) affect student satisfaction, usability, and perception with different spatial ability?
Participants were assessed under two conditions (VR and desktop screening) to see if the mean difference between the scores is significantly different. In doing so, a paired-sample t test on three categories, satisfaction, usability, and media perception, was conducted to evaluate whether a significant difference between satisfaction, usability, and media perception exists. As shown in Table 4 and Figure 10, the results of the paired sample t tests were, p < 0.001, significant.
Table 4.
Paired-sample t test between three levels of satisfaction, usability, and media perception.

Figure 10.
Effect of media use (VR and desktop screening) on student satisfaction, usability, and perception.
Moreover, an ANOVA was conducted to see whether a significant difference between each category of spatial ability (low, medium, or high) to satisfaction, usability, and perception exists. As shown in Table 5, the results for the ANOVA indicated a significant difference in satisfaction and perception. The strength of the relationship between the variables was medium. There was no significant difference regarding usability, but significant difference for perception was observed. The effect of spatial ability on the perception of individuals using different media was medium.
Table 5.
ANOVA result for spatial ability on student satisfaction, usability, and perception.
Figure 11 also shows the preference use of VR (total M = 4.26, total SD = 0.49) versus desktop screening (total M = 2.75, total SD = 0.37) for all three levels of spatial ability. Students with low spatial ability showed high level of satisfaction and perception toward using VR. Pairwise comparison showed that there were significant differences between low and medium spatial ability, p < 0.01, and high and medium, p < 0.05. There was no significant difference between high and low spatial ability regarding satisfaction or perception.
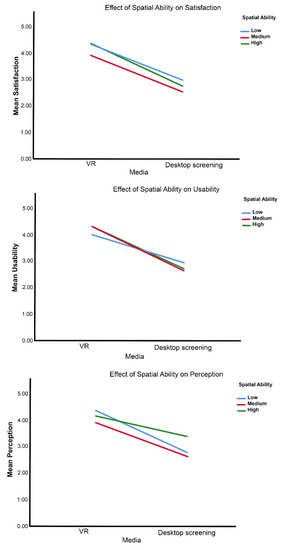
Figure 11.
Effect of spatial ability on student satisfaction, usability, and perception.
4. Discussion
Many studies have shown that selecting the most suitable technology for specific learning outcomes is essential [47,48]. The design of learning materials that use computer immersive technologies (e.g., dynamic presentations, molecule structures, and learning object) invites new opportunities specifically within the STEM curriculum. Additionally, knowing more about spatial frameworks will help in the delivery of instructional content that uses these technologies.
In the current study, dynamic presentations were used to display the complexity of the DNA structure. Learning materials using spatial frameworks allowed subjects opportunities to rotate nucleotide/DNA molecules and interact with learning materials either on desktop screening or observing it through VR. Presenting DNA structure in the VR enabled students to receive information in a novel way and simultaneously pique their interest in the subject matter.
The results from the data analysis show that spatial ability factor plays a central role in learning environments that have spatial frameworks. Moreover, spatial ability factor affects students’ satisfaction and perception toward using suitable media to learn visuospatial content such as STEM. Students in both groups show a high interest in using VR instead of desktop screening to engage with visuospatial learning materials.
Our analysis shows that the selection of specific media (VR and desktop screening) has no significant effect on students’ spatial recognition/retention. However, there is a considerable mean difference between students with low spatial ability in the VR group. It means selecting the most suitable technology for a specific learning group as essential.
Due to two salient affordances of VR, which provide a hands-on and immersive experience [17], students with low spatial ability may have experienced a new way of learning which they have never experienced. The implementation of these emerging technologies into the learning environments that have spatial frameworks such as in STEM can help low spatial ability students to understand the learning concepts more efficiently. Furthermore, presenting learning material about complex structures with dynamic visualization improves learners’ abilities to manage spatial manipulation [49]. Learners with low spatial ability can be supported by dynamic display [50].
One important observation is that there is little difference between individuals with high spatial ability in both groups (VR and desktop screening). It means that instructional supports that help low-knowledge learners may not help students who are studying in higher levels of education, see “expertise reversal effect” [51].
The data analysis of this study indicates that when learners are in the VR environment, experiential satisfaction is measured at a high level; this indicates that the haptic virtual environment (experiential immersion), supports individual learner differences through the presence levels of learners [35]. The high satisfaction level of students using VR indicates that this type of technology can help students with low spatial ability to cope better with the visualization of 3D objects.
4.1. Limitations
The major limitations of this study are the deficiencies in randomization of research subjects, manipulation of instructional and virtual elements within the VR environment, and control of time-on-task and user exploration that are characterized within the virtual environment. The samples for this study were selected through convenience sampling, and the results cannot be generalized beyond university undergraduate students. There might be other confounding variables that we did not account for, such as cognitive load, the novelty effect, and prior knowledge. Although some results showed significance, this study should be repeated with a larger sample size to verify the findings observed.
4.2. Future Research
For our future research, we intend to include an eye-tracking system to understand how subjects navigate inside the VR environments. Moreover, the use of eye-tracking gives us the ability to measure students’ effort to understand visual contents. Eye-tracking techniques give us the ability to record students’ gaze map and later study their visual behaviors. The visual behavior of subjects shows us a close relation between students’ spatial understanding of the concept and how fast they notice the relevant areas. In this regard, we will measure three metrics. We will look at the time and visual map of eyes before the actual fixation. We will measure the time on the first fixation and the percentage of participants who fixated on an area of interest. Accordingly, by using eye-tracking, we can guess if cognitive load appears or not. A higher number of fixations can be a sign of confusion.
5. Conclusions
The inclusion of new technologies such as VR facilitate students’ learning, interaction, and satisfaction in environments that use spatial frameworks. Implementation of new technologies with instructional methods can create a richer, more satisfying learning environment, that can improve learning performance of individuals with different cognitive styles (e.g., learning styles and spatial ability).
The possible applications of spatial modeling or working with three-dimensional objects will continue to grow as technology provides greater learning and work opportunities for the future. This study has only considered one area of molecular modeling, but, clearly, the potential for tutorials presenting content included in a whole course on biological models would benefit from this type of technological innovation for teaching and learning.
Author Contributions
Formal analysis, D.W.; Software, P.S.; Validation, D.W.; Visualization, P.S.; and Writing—review and editing, P.S. All authors have read and agreed to the published version of the manuscript.
Funding
This work was not funded.
Conflicts of Interest
The authors declare no conflict of interest.
References
- Galton, F. Statistics of mental imagery. Mind 1880, 5, 301–318. [Google Scholar] [CrossRef]
- Kosslyn, S.M.; Ganis, G.; Thompson, W.L. Mental imagery and the human brain. Prog. Psychol. Sci. Around World 2006, 1, 195–209. [Google Scholar]
- Hawes, Z.; LeFevre, J.A.; Xu, C.; Bruce, C.D. Mental rotation with tangible three- dimensional objects: A new measure sensitive to developmental differences in 4-to 8--year-old children. Mind Brain Educ. 2015, 9, 10–18. [Google Scholar] [CrossRef]
- Mast, F.W.; Kosslyn, S.M. Visual mental images can be ambiguous: Insights from individual differences in spatial transformation abilities. Cognition 2002, 86, 57–70. [Google Scholar] [CrossRef]
- Mohler, J.L. Computer graphics education: Where and how do we develop spatial ability? Proc. Eurograph. Educ. Pap. 2006, 79–86. [Google Scholar] [CrossRef]
- Wai, J.; Lubinski, D.; Benbow, C.P. Spatial ability for STEM domains: Aligning over 50 years of cumulative psychological knowledge solidifies its importance. J. Educ. Psychol. 2009, 101, 817. [Google Scholar] [CrossRef]
- Stieff, M.; Uttal, D. How much can spatial training improve STEM achievement? Educ. Psychol. Rev. 2015, 27, 607–615. [Google Scholar] [CrossRef]
- Khine, M.S. Spatial cognition: Key to STEM success. In Visual-spatial Ability in STEM Education; Springer: Cham, Switzerland, 2017; pp. 3–8. [Google Scholar]
- Broman, K.; Mårell-Olsson, E.; Johnels, D.; Andersson, C.D.; Chorell, E.; Westerlind, U.; Boström, J.; Norrby, M. Spatial Ability in Organic Chemistry–Can Virtual and Augmented Reality be Valuable? In 7: E Utvecklingskonferensen för Sveriges ingenjörsutbildningar; Luleå tekniska universitet: Lulea, Sweden, 2019. [Google Scholar]
- Castro-Alonso, J.C.; Uttal, D.H. Spatial ability for university biology education. In International Conference on Applied Human Factors and Ergonomics; Springer: Cham, Switzerland, 2018; pp. 283–291. [Google Scholar]
- Rabab’h, B.; Veloo, A. Spatial Visualization as Mediating between Mathematics Learning Strategy and Mathematics Achievement among 8th Grade Students. Int. Educ. Stud. 2015, 8, 1–11. [Google Scholar] [CrossRef]
- Erick, T.; Mann, J.; Kinsey, B.; O’Brien, E.J.; Bauer, C.F.; Champoux, R. Assessing the self efficacy and spatial ability of engineering students from multiple disciplines. In Proceedings of the Frontiers in Education 35th Annual Conference, Indianopolis, IN, USA, 19–22 October 2005; IEEE: New York, NY, USA, 2005; p. S2C-15. [Google Scholar]
- Tussyadiah, I.P.; Wang, D.; Jung, T.H.; Tom Dieck, M.C. Virtual reality, presence, and attitude change: Empirical evidence from tourism. Tour. Manag. 2018, 66, 140–154. [Google Scholar] [CrossRef]
- Azuma, R.T. A survey of augmented reality. Presence 1997, 6, 355–385. [Google Scholar] [CrossRef]
- Freina, L.; Ott, M. A literature review on immersive virtual reality in education: State of the art and perspectives. In The International Scientific Conference eLearning and Software for Education; Carol I National Defence University: Bucuresti, Romania, 2015; Volume 1, p. 133. [Google Scholar]
- Lau, K.W.; Lee, P.Y. The use of virtual reality for creating unusual environmental stimulation to motivate students to explore creative ideas. Interact. Learn. Environ. 2015, 23, 3–18. [Google Scholar] [CrossRef]
- Villagrasa, S.; Fonseca, D.; Durán, J. Teaching case: Applying gamification techniques and virtual reality for learning building engineering 3D arts. In Proceedings of the Second International Conference on Technological Ecosystems for Enhancing Multiculturality, Salamanca, Spain, 1–3 October 2014; ACM: New York, NY, USA, 2014; pp. 171–177. [Google Scholar]
- Hu-Au, E.; Lee, J.J. Virtual reality in education: A tool for learning in the experience age. Int. J. Innov. Educ. 2017, 4, 215–226. [Google Scholar] [CrossRef]
- Dawley, L.; Dede, C. Situated learning in virtual worlds and immersive simulations. In Handbook of Research on Educational Communications and Technology; Springer: New York, NY, USA, 2014; pp. 723–734. [Google Scholar]
- Dede, C. Theoretical perspectives influencing the use of information technology in teaching and learning. In International Handbook of Information Technology in Primary and Secondary Education; Springer: New York, NY, USA, 2008; pp. 43–62. Available online: https://link-springer-com.lib-e2.lib.ttu.edu/book/10.1007%2F978-0-387-73315-9 (accessed on 5 August 2020).
- Clark, R.C.; Mayer, R.E. E-Learning and the Science of Instruction: Proven Guidelines for Consumers and Designers of Multimedia Learning; John Wiley & Sons: New York, NY, USA, 2016. [Google Scholar]
- Gallagher, A.G.; O’Sullivan, G.C. Fundamentals of Surgical Simulation–Principles and Practices; Springer Science & Business Media: New York, NY, USA, 2011; Available online: http://archpsyc.jamanetwork.com/data/Journals/JAMA/22492/jbk0307_974_975.pdf (accessed on 5 August 2020).
- Loup, G.; Serna, A.; Iksal, S.; George, S. Immersion and persistence: Improving learners’ engagement in authentic learning situations. In Proceedings of the European Conference on Technology Enhanced Learning, Lyon, France, 13–16 September 2016; Springer: Cham, Switzerland, 2016; pp. 410–415. [Google Scholar]
- Cheney, A.W.; Terry, K.P. Immersive Learning Environments as Complex Dynamic Systems. Int. J. Teach. Learn. High. Educ. 2018, 30, 277–289. [Google Scholar]
- Rau, M.A. Conditions for the effectiveness of multiple visual representations in enhancing STEM learning. Educ. Psychol. Rev. 2017, 29, 717–761. [Google Scholar] [CrossRef]
- NRC. Learning to Think Spatially; National Academies Press: Washington, DC, USA, 2006. [Google Scholar]
- Schnotz, W. An integrated model of text and picture comprehension. In The Cambridge Handbook of Multimedia Learning, 2nd ed.; Mayer, R.E., Ed.; Cambridge University Press: New York, NY, USA, 2014; pp. 72–103. [Google Scholar]
- Fogarty, J.; McCormick, J.; El-Tawil, S. Improving student understanding of complex spatial arrangements with virtual reality. J. Prof. Issues Eng. Educ. Pract. 2018, 144, 04017013. [Google Scholar] [CrossRef]
- Jang, S.; Vitale, J.M.; Jyung, R.W.; Black, J.B. Direct manipulation is better than passive viewing for learning anatomy in a three-dimensional virtual reality environment. Comput. Educ. 2017, 106, 150–165. [Google Scholar] [CrossRef]
- Lee, E.; Wong, K.W. Learning with desktop virtual reality: Low spatial ability learners are more positively affected. Comput. Educ. 2014, 79, 49–58. [Google Scholar] [CrossRef]
- Lv, Z.; Li, X. Virtual reality assistant technology for learning primary geography. In Proceedings of the International Conference on Web-Based Learning, Guangzhou, China, 5–8 November 2015; Springer: Cham, Switzerland, 2015; pp. 31–40. [Google Scholar]
- Ritz, L.T.; Buss, A.R. A framework for aligning instructional design strategies with affordances of CAVE immersive virtual reality systems. TechTrends 2016, 60, 549–556. [Google Scholar] [CrossRef]
- Hinze, S.R.; Williamson, V.M.; Shultz, M.J.; Williamson, K.C.; Deslongchamps, G.; Rapp, D.N. When do spatial abilities support student comprehension of STEM visualizations? Cogn. Process. 2013, 14, 129–142. [Google Scholar] [CrossRef]
- Mikropoulos, T.A.; Natsis, A. Educational virtual environments: A ten-year review of empirical research (1999–2009). Comput. Educ. 2011, 56, 769–780. [Google Scholar] [CrossRef]
- Molina-Carmona, R.; Pertegal-Felices, M.; Jimeno-Morenilla, A.; Mora-Mora, H. Virtual reality learning activities for multimedia students to enhance spatial ability. Sustainability 2018, 10, 1074. [Google Scholar] [CrossRef]
- Coxon, M.; Kelly, N.; Page, S. Individual differences in virtual reality: Are spatial presence and spatial ability linked? Virtual Real. 2016, 20, 203–212. [Google Scholar] [CrossRef]
- Bandura, A. Self-efficacy: Toward a unifying theory of behavioral change. Psychol. Rev. 1977, 84, 191. [Google Scholar] [CrossRef] [PubMed]
- Venkatesh, V. Determinants of perceived ease of use: Integrating control, intrinsic motivation, and emotion into the technology acceptance model. Inf. Syst. Res. 2000, 11, 342–365. [Google Scholar] [CrossRef]
- Sari, D.P.; Syahputra, E.; Surya, E. An Analysis of Spatial Ability and Self-efficacy of Students in Cooperative Learning by Using Jigsaw at Smas Muhammadiyah 8 Kisaran. Am. J. Educ. Res. 2018, 6, 1238–1283. [Google Scholar] [CrossRef][Green Version]
- Ludwikowski, W.M.; Armstrong, P.I.; Redmond, B.V.; Ridha, B.B. The Role of Ability in the Selection of Majors. J. Career Assess. 2019, 27, 422–439. [Google Scholar] [CrossRef]
- Minear, M.; Lutz, L.; Clements, N.; Cowen, M. Individual and Gender Differences in Spatial Ability and Three Forms of Engineering Self-efficacy. In Spatial Cognition X; Springer: Cham, Switzerland, 2016; pp. 3–18. [Google Scholar]
- Burak, S.; Kucuk, S.; Yaman, Y. The Effects of Robotics Training on Children’s Spatial Ability and Attitude Toward STEM. Int. J. Soc. Robot. 2020, 1–11. [Google Scholar] [CrossRef]
- Yoon, S.Y. Psychometric Properties of the Revised Purdue Spatial Visualization Tests: Visualization of Rotations (The Revised PSVT-R); Purdue University: West Lafayette, IN, USA, 2011. Available online: http://eric.ed.gov/?id=ED534824 (accessed on 5 August 2020).
- Parviz, S.; White, D. Facilitating molecular biology teaching by using augmented reality (AR) and protein data bank (PDB). TechTrends 2019, 63, 188–193. [Google Scholar]
- Alessi, S.M.; Trollip, S.R. Multimedia for Learning: Methods and Development; Allyn & Bacon, Inc.: Boston, MA, USA, 2000. [Google Scholar]
- Lincecum, L. The Effects of Software Disruption on Goal Commitment, Task Self-Efficacy, Computer Self-Efficacy, and Test Performance in a Computer-Based Instructional Task. Ph.D. Thesis, Texas Tech University, Lubbock, TX, USA, 2000. [Google Scholar]
- Jocelyn, P.; Mayer, R.E. Learning science in immersive virtual reality. J. Educ. Psychol. 2018, 110, 785. [Google Scholar]
- Doron, Z.; Tate, T.; Warschauer, M. Learning and Teaching withTechnology: TechnologicalPedagogy and Teacher Practice; SAGE: Thousand Oaks, CA, USA, 2017. [Google Scholar]
- Wu, H.-K.; Shah, P. Exploring visuospatial thinking in chemistry learning. Sci. Educ. 2004, 88, 465–492. [Google Scholar] [CrossRef]
- Höffler, T.N. Spatial ability: Its influence on learning with visualizations—A meta-analytic review. Educ. Psychol. Rev. 2010, 22, 245–269. [Google Scholar] [CrossRef]
- Sweller, J.; Ayres, P.L.; Kalyuga, S.; Chandler, P. The Expertise Reversal Effect; Springer Science & Business Media: New York, NY, USA, 2003. [Google Scholar]
© 2020 by the authors. Licensee MDPI, Basel, Switzerland. This article is an open access article distributed under the terms and conditions of the Creative Commons Attribution (CC BY) license (http://creativecommons.org/licenses/by/4.0/).