Article

Numerical 3D Modeling: Microwave Plasma Torch at Intermediate Pressure

1
School of Electronics and Information Engineering, Sichuan University, Chengdu 610065, China
2
Second Research Institute of CAAC, Chengdu 610041, China
*
Author to whom correspondence should be addressed.
Appl. Sci. 2020, 10(15), 5393; https://doi.org/10.3390/app10155393
Submission received: 29 June 2020 / Revised: 30 July 2020 / Accepted: 31 July 2020 / Published: 4 August 2020
(This article belongs to the Special Issue The Applications of Plasma Techniques)

Abstract

:
This study represents a self-consistent three-dimensional (3D) fluid plasma model coupled with Maxwell equations at an intermediate pressure between 1000 and 5000 Pa. The model was established using the finite element method to analyze the effects of time–space characteristics, which is the variation of plasma parameters with time and the 3D spatial distribution of plasma parameters in the plasma torch at various times. The numerical modeling was demonstrated in three different stages, where the growth of electron density is associated with time. From the distribution characteristics of molecular ions, it can be concluded that they are distributed mainly at the port of the quartz tube of the torch, which is larger than the center of the tube. The density ratio of molecular ion to electron is decreased because of the reduction of pressure and distance, which has been calculated from the port to the center of the quartz tube. The analysis of microwave plasma parameters indicated that intermediate pressure is useful for modeling and plasma source designing, especially for carbon dioxide conversion.

1. Introduction

Microwave plasmas are extensively applied in various fields because of the advantages such as high electron density, high efficiency, wide working pressure range, and no need for electrodes. In particular, it is used to deal with gas pollution [1,2], plasma-enhanced chemical vapor deposition [3], surface material treatment [4,5], plasma stealth [6,7], and hydrogen production [8].
Owing to the adverse effect of greenhouse gas on the modern world, the use of plasma to decompose carbon dioxide (CO2) under intermediate pressure has become an attractive research topic [9,10,11,12]. Methods involving the enrichment of plasma by a massive number of active particles can reduce the threshold energy of the CO2 decomposition reaction that converts it into carbon monoxide (CO), which has become a promising approach for decreasing CO2, as well as providing a new energy source [13,14,15]. Argon (Ar) has a low threshold to produce energetic particles (electron/metastable); thus, argon–plasma promotes the excitation and dissociation of CO2. In the process of CO2 dissociation by Ar plasma excitation, first plasma energy is mainly reduced by ionization and excitation of the 99% argon atoms in the plasma leading to exciting argon species (ion, excimer, metastable) and energetic electrons. Second, exciting argon or energetic electrons or species transfers the plasma’s energy to CO2 in a collision for making CO2 in an electronically excited state [16]. Thus, analysis of the electron behavior over time and the spatial distribution of electrons in the excitation process is helpful for the plasma sources design. Furthermore, the information obtained from the three-dimensional (3D) argon model can be useful to have a spatial description of the microwave plasma. Hence, Ar can be used for making efficient plasma technologies for CO2 conversion.
Regarding the limitations of experimental techniques and plasma diagnostics [17], plasma modeling has become a fruitful key method for plasma research. Plasma modeling must consider electromagnetic effects, plasma dynamics, thermodynamics, chemical reaction, and equilibrium. Thus, among other things, the inevitable simplified nature of the models leads to discrepancies between modeling results and experimental results; hence, optimization and improvement of plasma models are of utmost significance [18,19,20].
Models of low pressure [21,22,23] and atmospheric-pressure [24,25,26] microwave plasmas were extensively studied; however, there remains demand to analyze plasma parameters in the intermediate-pressure environment [27]. Bouherine et al. established a 3D model of a plasma-enhanced chemical vapor deposition reactor at low pressure, based on which they analyzed the electron, heavy-particle densities, electric field distribution, and electron heat discharge behavior [28]. A two-dimensional (2D) surface-wave plasma model at an intermediate pressure between 660 and 8800 Pa was simulated by Jimenez-Diaz et al., who demonstrated the reliability of the model and wave plasma interconnection with the axial distribution of the power and electron density, at both sides of the launcher [29]. By exploring the electric field distribution and the plasma parameters of an atmospheric-pressure microwave plasma torch under both 2D and 3D conditions, Baeva et al. demonstrated that the 2D model had certain limitations concerning its description of the spatial distribution of plasma parameters [30].
In a previous study, a 3D waveguide plasma model with excitation by microwave at atmospheric pressure was constructed [31,32]; it illustrated some properties of plasma factors such as electron density, temperature, and gas temperature during excitation processing. However, it did not consider the significant molecular ion recombination reaction at atmospheric pressure, which led to differences between the results of modeling and those of experiments [33,34].
To overcome these problems, this study constructs a plasma model with Maxwell equations by considering Ar atoms in the ground and metastable state, and as atomic and molecular ions, by considering coupling with the flow, heat transfer, and microwave multi-physical fields. Simulations based on this model are used to analyze the transient circulation of plasma parameters. In this study, excitation characteristics of the microwave plasma torch in the range 1000–5000 Pa at intermediate pressure are supplemented. The results obtained will be helpful in the construction of plasma sources and specifically for applications to CO2 decomposition [15,35].
The remainder part of the paper is structured as follows: Section 2 describes the plasma model; Section 3 explains the governing equations; Section 4 presents the results and analysis; finally, Section 5 provides the conclusions.

2. Model Description

2.1. Microwave Plasma System

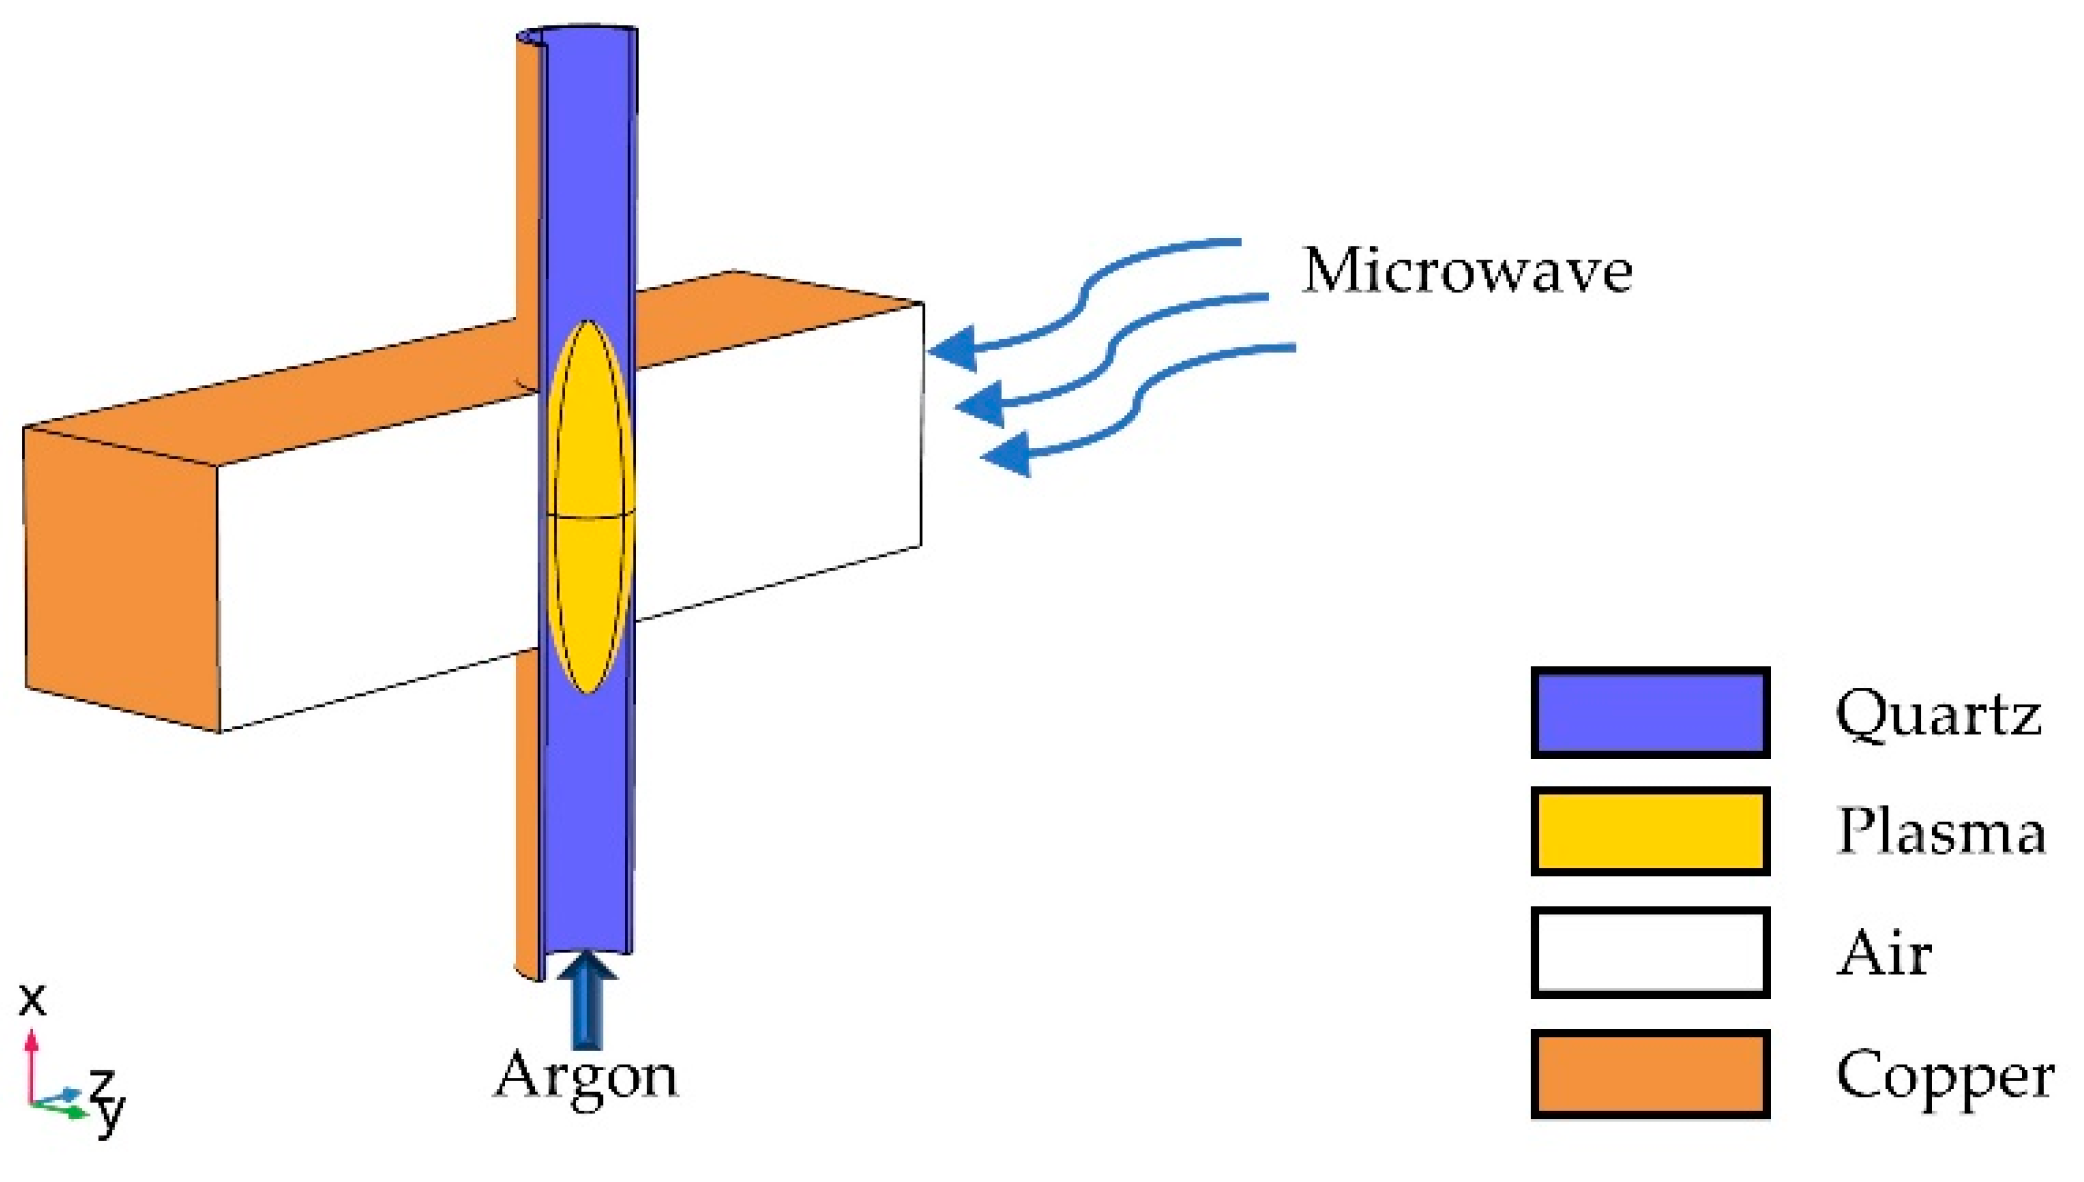
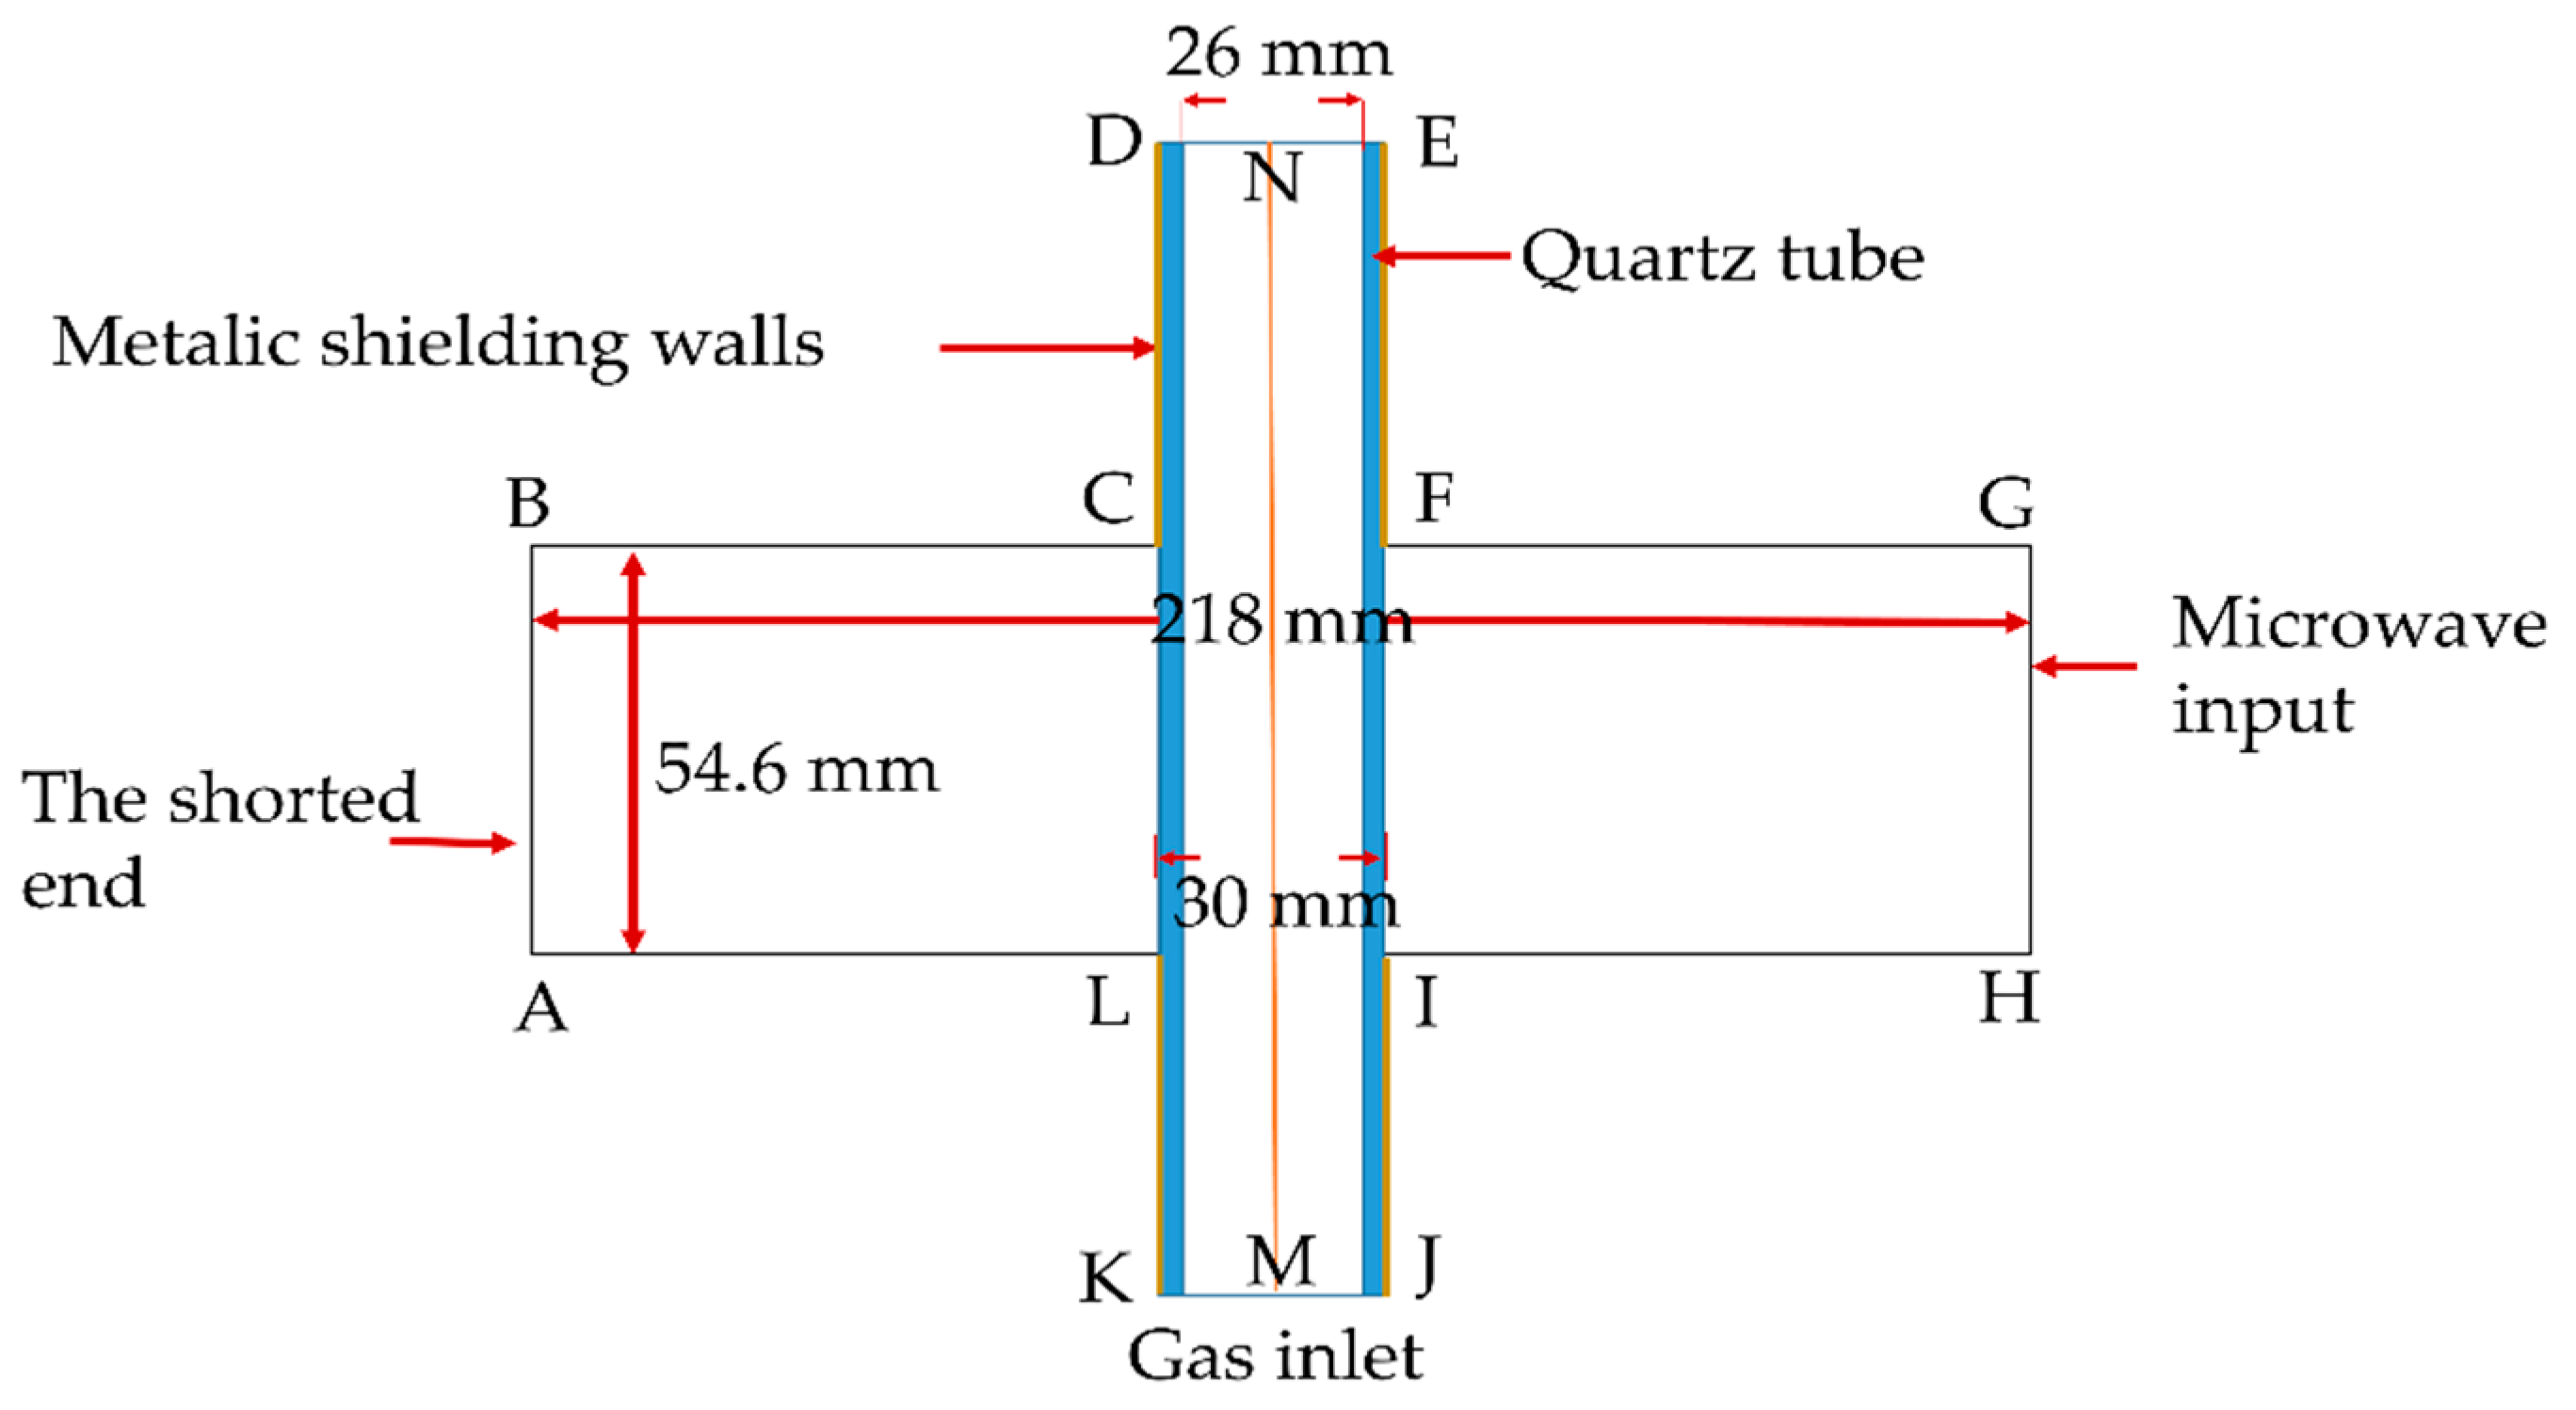
Figure 1 shows a schematic of the microwave excitation device; 2.45 GHz electromagnetic waves enter the WR-430 waveguide from the right-hand side through a circulator, after which there are three stub tuners, and there is a short-circuit board on the left side. Figure 2 represents the cutaway view of the microwave plasma torch, and Figure 3 shows a 2D section along the central axis in the xz plane, which is the cross-sectional dimension of the rectangular excitation waveguide with AB = 54.6 mm, length as AH = 218 mm, and width of the WR-430 rectangular waveguide in the xy plane as 109.2 mm. To prevent microwave leakage, the quartz tube is surrounded by a cylindrical metal cage, which is modeled as a perfect electrical conductor. Ar was fed axially through the quartz tube at the flow rate of 1 L/min. The pressure in the quartz tube was 2000 Pa, initial gas temperatures was 293.15 K, the initial electron density was 1016 m−3, the initial average electron energy ε was 4 eV, and the initial potential was 0 V.
In this study, the fluid approximation method was used to couple the Boltzmann equation to the Maxwell equation for calculating the density of charged particles, electron temperature, and the electromagnetic field. The Boltzmann equation embodies the change of ion velocity distribution equation f(r,v,t) with time, where v is the velocity, r is the position, and t is time. The calculation process was as follows: the energy distribution function of electrons was brought into the Boltzmann equation to solve the electron transport coefficient through the BOLSIG+ solver. The electron transport coefficient and the experimentally determined plasma chemical cross-section data were formed into the continuous equation, momentum conservation equation, and the energy conservation equation. Then, these three equations were coupled with the electromagnetic field to solve the electromagnetic field and plasma characteristic parameters. As the Boltzmann equation is highly nonlinear, it is difficult to use directly in the analytical solution. Thus, we used the finite element method and a numerical technique to solve the equations. Before solving the finite element method, the space and time of the solution target must be discretized. In this study, a tetrahedral mesh was used to divide the solution domain of the 3D graphics, and a boundary layer was used to encrypt and divide the boundary. The total number of the mesh elements was 183,448. The model was executed on a computer with an i9-9900U CPU and 64 GB RAM; the execution duration was approximately 101 min.

2.2. Plasma Chemistry

When an electromagnetic wave propagates in the plasma, there will be some reactions between the particles. The main reaction types include:
(1)
Elastic collision and inelastic collision: such reactions will lead to energy exchange in particles; the difference between them is that the elastic collision only leads to the transfer of kinetic energy between the colliding particles, but does not change internal energy.
(2)
Excitation and ionization: such reactions result in growth in the number of free electrons or a change in the energy level of an atom. The probability of their counter occurrence is related to the collision cross-section.
(3)
Charge transfer: this type of reaction results in the equivalent transfer of charge between particles. The kind of reaction mainly occurs in the collision process of ions and neutral particles.
(4)
Charge recombination: there are two forms—diffusion and recombination. Diffusion is the process by which the charged particle reaches the wall and electrode to disappear. Recombination is a process by which positive ions capture a free electron and combine with electrons or negative ions to form new neutral atoms.
Table 1 shows the main reaction and collision processes [30,35,36].

2.3. Boundary Condition

Table 2 shows the boundary conditions.

3. Governing Equations

Generally, three approaches are used to model plasmas—the kinetic method, fluid approximation, and hybrid approaches. Among the three, fluid approximation was used in this study for the simulation of our model because of its efficiency in solving partial differential equations, modeling significant arbitrarily complex plasma chemistry, and modeling electron dynamics to electromagnetic areas. The fluid approximation method requires complex modeling to take account of gas discharge processes, boundary conditions, thermodynamics, gas reactions, collision processes, electromagnetic phenomena, plasma dynamics, and power conservation of electrons, as well as heavy particles. The absorption of electromagnetic wave energy is the major cause of plasma excitation. Thus, it is necessary to incorporate the dynamical changes of the electromagnetic waves involved in the effects of microwave on the reaction process. The model is not time-independent and quasi-stationary accomplishment is the expectation using the wave equations. Therefore, the electromagnetic wave formula in the plasma needs to be established to perform cover analysis of the influence of various related plasma parameters on electromagnetic wave propagation. Then, under the assumption of ambipolar diffusion, a fluid equation for the plasma was established to analyze the changes in electron density with time, while the Boltzmann equation was used to analyze the heating effect of strong electromagnetic pulses on the electrons. The accelerated electrons transfer power to heavy particles via collisions. The heavy particles are expected to be in thermal balance at a specific temperature T, and the electrons are categorized by the Maxwellian power spreading with a specific temperature Te. The heat conduction formula was used to compute the rate of change of particle energy, which is affected by the electromagnetic field. Finally, an iterative approach was utilized to analyze the behavior of various parameters of the plasma [34,35].

3.1. Wave Equation

The incident electromagnetic wave on the plasma satisfies Maxwell equations:
× H = i ω ε 0 ε r E
× E = i ω μ 0 H
where E and H represent the electric and magnetic field strength vectors, respectively. In addition, i is ( 1 ) , ω signifies the angular wave frequency, and ε 0 and μ 0 denote the permittivity and permeability of the vacuum, respectively. The symbols ε r express the relative electric permittivity [30]. The substitution of Equation (1) into Equation (2) provides Equation (3) as follows:
× × E = ω 2 μ 0 ε 0 ε r E
The wavenumber in a vacuum is given by k 0 = ω / c , c = ε 0 / μ 0 thus, Equation (3) can be rewritten as Equation (4):
× × E = k 2 ε r E
The relative permittivity of the plasma in Equation (4) is given by Equation (5):
ε r = 1 ω p 2 ω ( ω i υ )
where υ is used to express the electron elastic collision frequency; ω p = n e e 2 ε 0 m e denotes the angular frequency of the plasma; and the terms n e , m e , and e stand for the electron density, electronic mass, and fundamental charge, respectively. The electronic conductivity is given by Equation (6).
σ = n e e 2 m e 1 υ + i ω
Now Equation (4) is rewritten as Equation (7):
× × E = k 2 ε r ( 1 i σ ε 0 ω ) E
When the microwave directly incidents into plasma, according to Equation (5), we find that the real part of ε r becomes negative for the plasma, which is collisionless when ω p 2 > ω 2 . Thus, the electron density n e has a critical number density of approximately 7.6 × 10¹⁶ m−3, which corresponds to ω p 2 = ω 2 and ε r = 0 .
When a medium is present between the plasma and the incident wave, the plasma frequency is expressed by Equation (8) [37].
ω p 2 = ( 1 + ε d ) ω 2
In the model, the effective permittivity of the quartz tube is 4.0, and the incident wave operating frequency is 2.45 GHz. Therefore, the cutoff electron density value of the collisionless plasma is calculated to be 4 × 10¹⁷ m−3.

3.2. Equations of the Plasma Model

In plasma convection–diffusion and in the plasma reaction process, the electric field vector, electron diffusion coefficient, and electron mobility affect the electron density and electron density energy. Equations (9) and (10) describe the changes in the electron density with time and spatial distribution, while Equations (11) and (12) describe the changes in the electron density energy with time and spatial distribution. The electron density change rate can be described by the drift–diffusion formula, as shown in Equations (9)–(12):
n e t + ( u · ) n e + Γ e = R e
Γ e = ( μ e E ) n e D e n e
and
t ( n ε ) + Γ ε + E Γ ε = R ε ( u ) n ε
Γ ε = ( μ ε E ) n ε D ε n ε
where symbols Γ e and Γ ε express electron flux and electron energy flux, respectively; terms n e , μ e , n ε , μ ε , and u denote the electron density, electron mobility, electron energy density, electron energy mobility, and velocity vector of the fluid, respectively. Symbol D e signifies the electron diffusion coefficient, D ε denotes the electron energy diffusivity, and R e and R ε express the electron rate expression and energy loss or gain, respectively, because of inelastic collisions [32].

3.3. Fluid Equation

The gas flow in the quartz tube can be defined by the mass continuity and Navier–Stokes with respect to Equations (13) and (14):
ρ t + ( ρ u ) = 0
ρ u t + ρ ( u ) u = p + [ μ ( u + ( u ) T ) 2 3 μ ( u ) I ] + F
where p , ρ , μ , and I denote the pressure, mass density, dynamic viscosity, and unit tensor, respectively [28]. The Lorentz force is F = μ 0 2 R e ( σ E × H ) , where H expresses the complex conjugates of H .

3.4. Heat Transfer Equation

A common mixture-sharing temperature T was taken by the heavy species, including the ions and neutral atoms which were taken as a mixture sharing with a common temperature T. The rate of change of heavy-particle energy is described by Equation (15):
ρ C p T t + ρ C p u T = ( σ k T ) + Q el Q w
where C p , σ k , Q el , and Q w represent the specific heat capacity, thermal conductivity, the gain of energy because of elastic collisions between heavy particles and electrons, and heat release because of non-electronic collisions, respectively [20,38].

3.5. Ambipolar Diffusion

The particles of plasma diffusion were divided into two categories: ambipolar diffusion of charged particles (electrons, ions) and the diffusion of neutral particles or atoms. Among them, ambipolar diffusion is a unique characteristic of plasma; this movement occurs near the solid surface bordering the plasma, which controls the disappearance process of charged particles. In the initial free diffusion process, the electron diffuses much faster than the atom; thus, it reaches the vessel wall first and makes it negatively charged. Therefore, there are an equal amount of positive space charges in the plasma, causing charge separation. The positive and negative charges appear in pairs and produce a radial electric field pointing to the wall of the container. The radial electric field can inhibit the flow of electrons to the vessel wall and promote the ions to move toward the vessel wall, inhibiting the free diffusion of electrons and ions.
The ambipolar diffusion coefficient is expressed by Equation (16):
D a = μ i D e + μ e D i μ i + μ e
where μ i , μ e , D i , and D e denote the ion mobilities, electron mobilities, ion diffusion coefficients, and electron diffusion coefficients, respectively. For a weakly ionized discharge, because μ i << μ e , use of the Einstein relation expressed by Equation (17):
D a D i ( 1 + T e T i )

4. Results and Analysis

4.1. Analysis of Plasma Parameters at Different Times under the Same Pressure

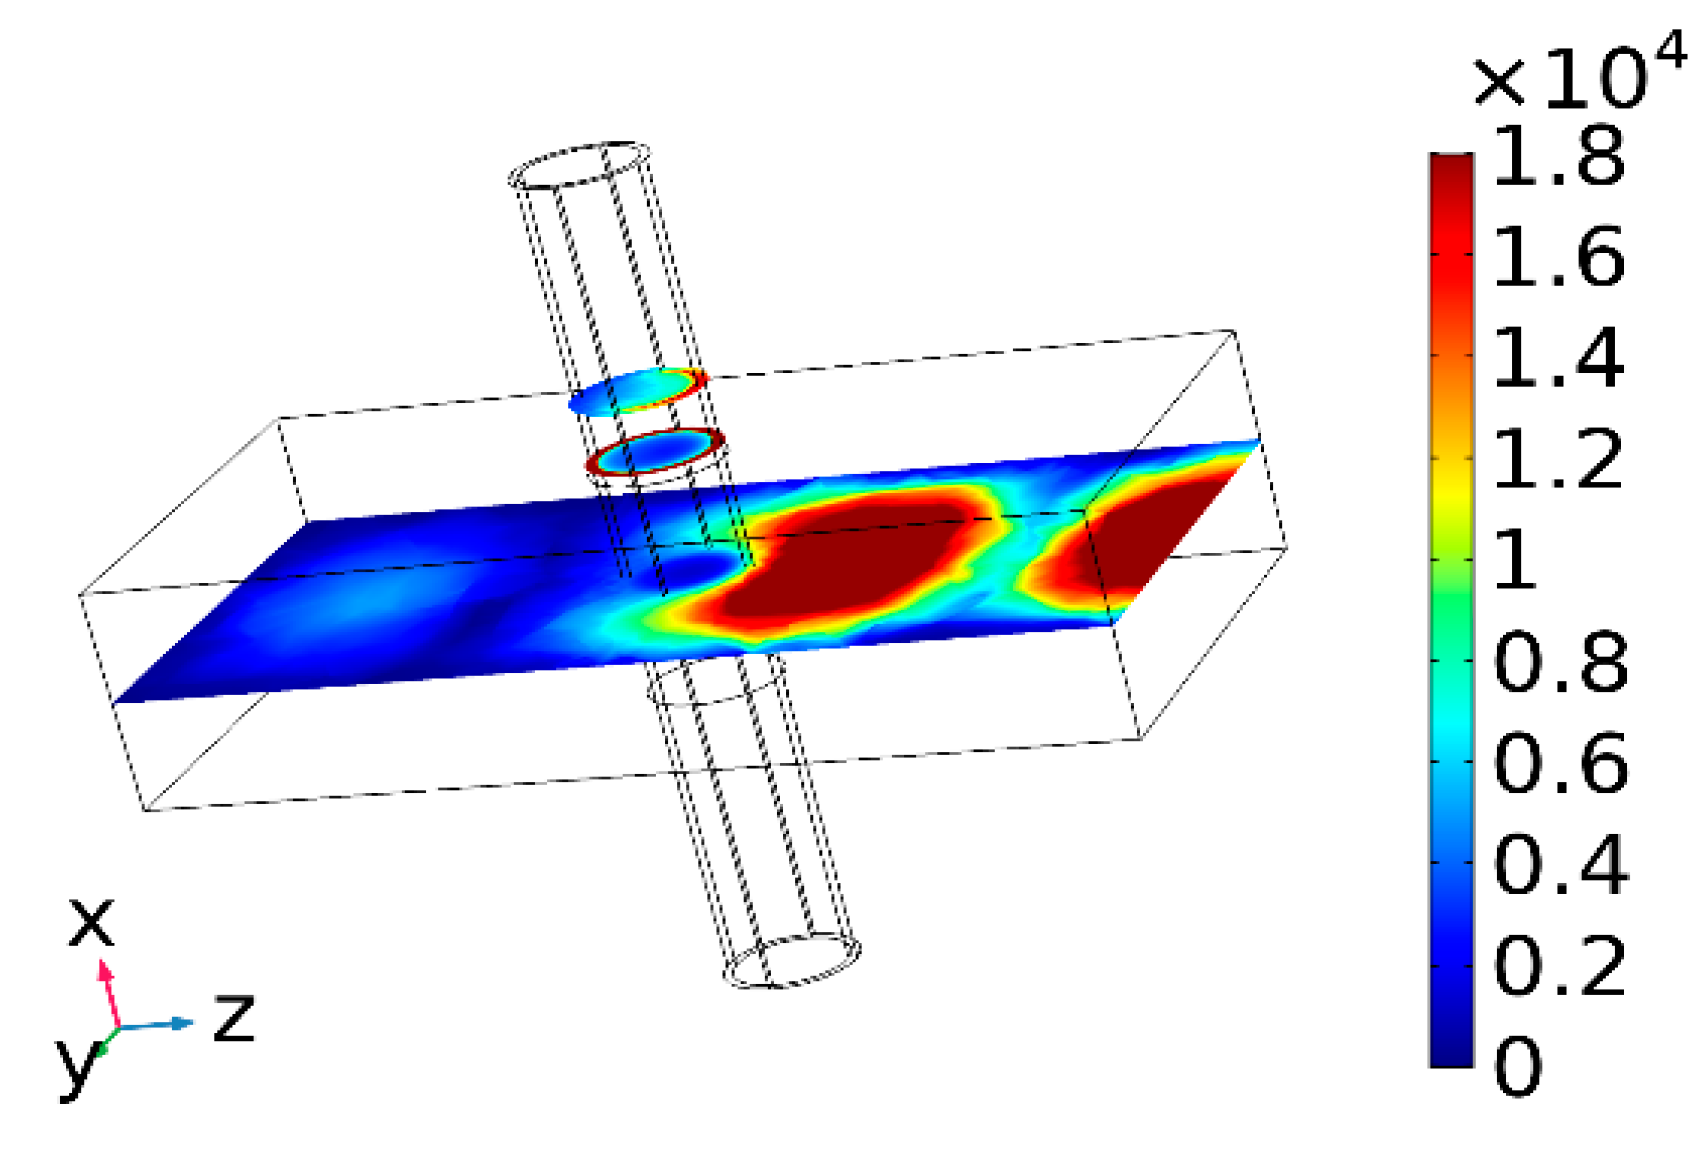
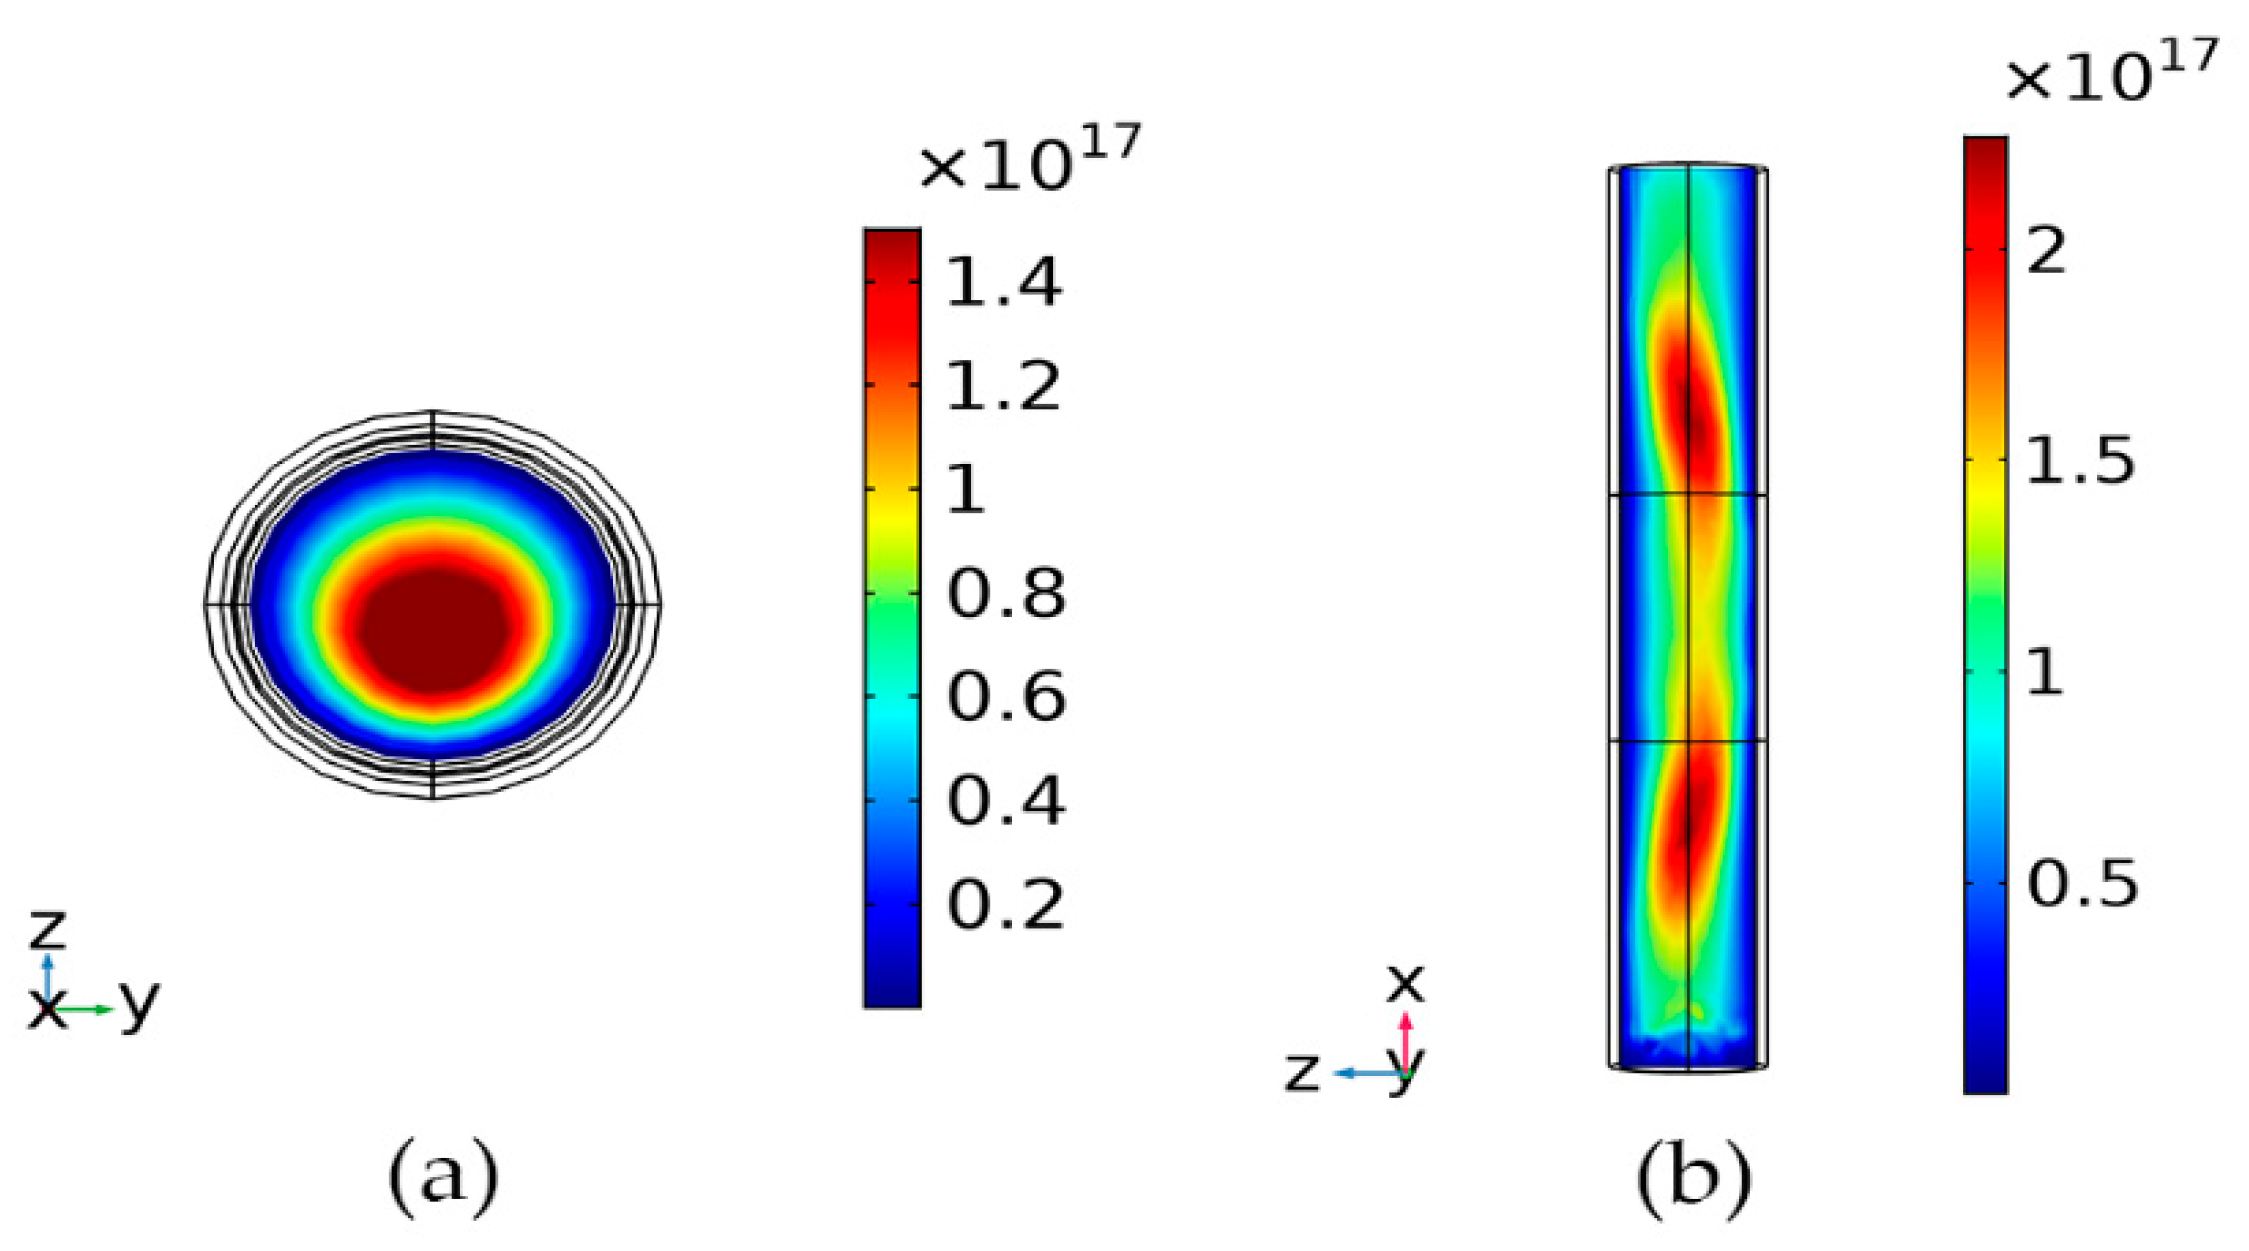
Figure 4 demonstrates the spatial distribution of the electron density. If the electron density increases from 1016 to 4 × 10¹⁷ m−3, it generates a surface wave [39], and the electrons start spreading from the region CFIL, which is the mainly excited region of plasma shown in Figure 3, to the upper and lower ends of the quartz tube. As the microwave is fed into the waveguide along the –z direction, there is a radial heterogeneity of electric field modulus in the plasma torch, which causes electrons to move toward the right side of the quartz tube, while the plasma torch discharges and contracts, as shown in Figure 4c. Meanwhile, there will be a few excitations on the left side of the tube; there are two reasons for this phenomenon. First, if the plasma forms a coaxial waveguide with the outer metal wall, then a TE10 wave propagates along the –z direction, which changed into a transverse electromagnetic (TEM) wave that propagated with the upper and lower sides of the quartz tube [40,41]. As shown in Figure 5, there is a nonzero electric field in the quartz tube outside the waveguide; thus, some surface wave energy can be fed into the left side of the tube. Second, according to the results for the electric field shown in Figure 5, even if the plasma fills the whole quartz tube, it is still only part of the microwave transmission path. Owing to diffraction, a small portion of the microwave can still reach the other end of the waveguide. In the meantime, on that side, there will also be a standing wave, from which energy is fed into the plasma. At the time of 10−5 s, on the one hand, the electron density in the top and bottom parts of the quartz tube can increase owing to the effect of the surface wave. On the other hand, it is different from the atmospheric-pressure plasma that is dominated by collisions, as shown in Figure 6. At intermediate pressures, owing to the low collision frequency, the high particle diffusion rate, the high mean free path, and electrons gathered at the edge of the quartz tube will diffuse gradually to the middle of the tube. Moreover, the spatial distribution of electron density will remain steady after the microwave plasma torch has been fully excited at 10−4 s.
Because electrons are 1000–10,000 times lighter than the heavy particles, they can obtain more energy from the incident electromagnetic field. Electrons accelerated by the electromagnetic field transfer their energy to the heavy particles through collisions. Thus, energy can be transferred to the plasma.
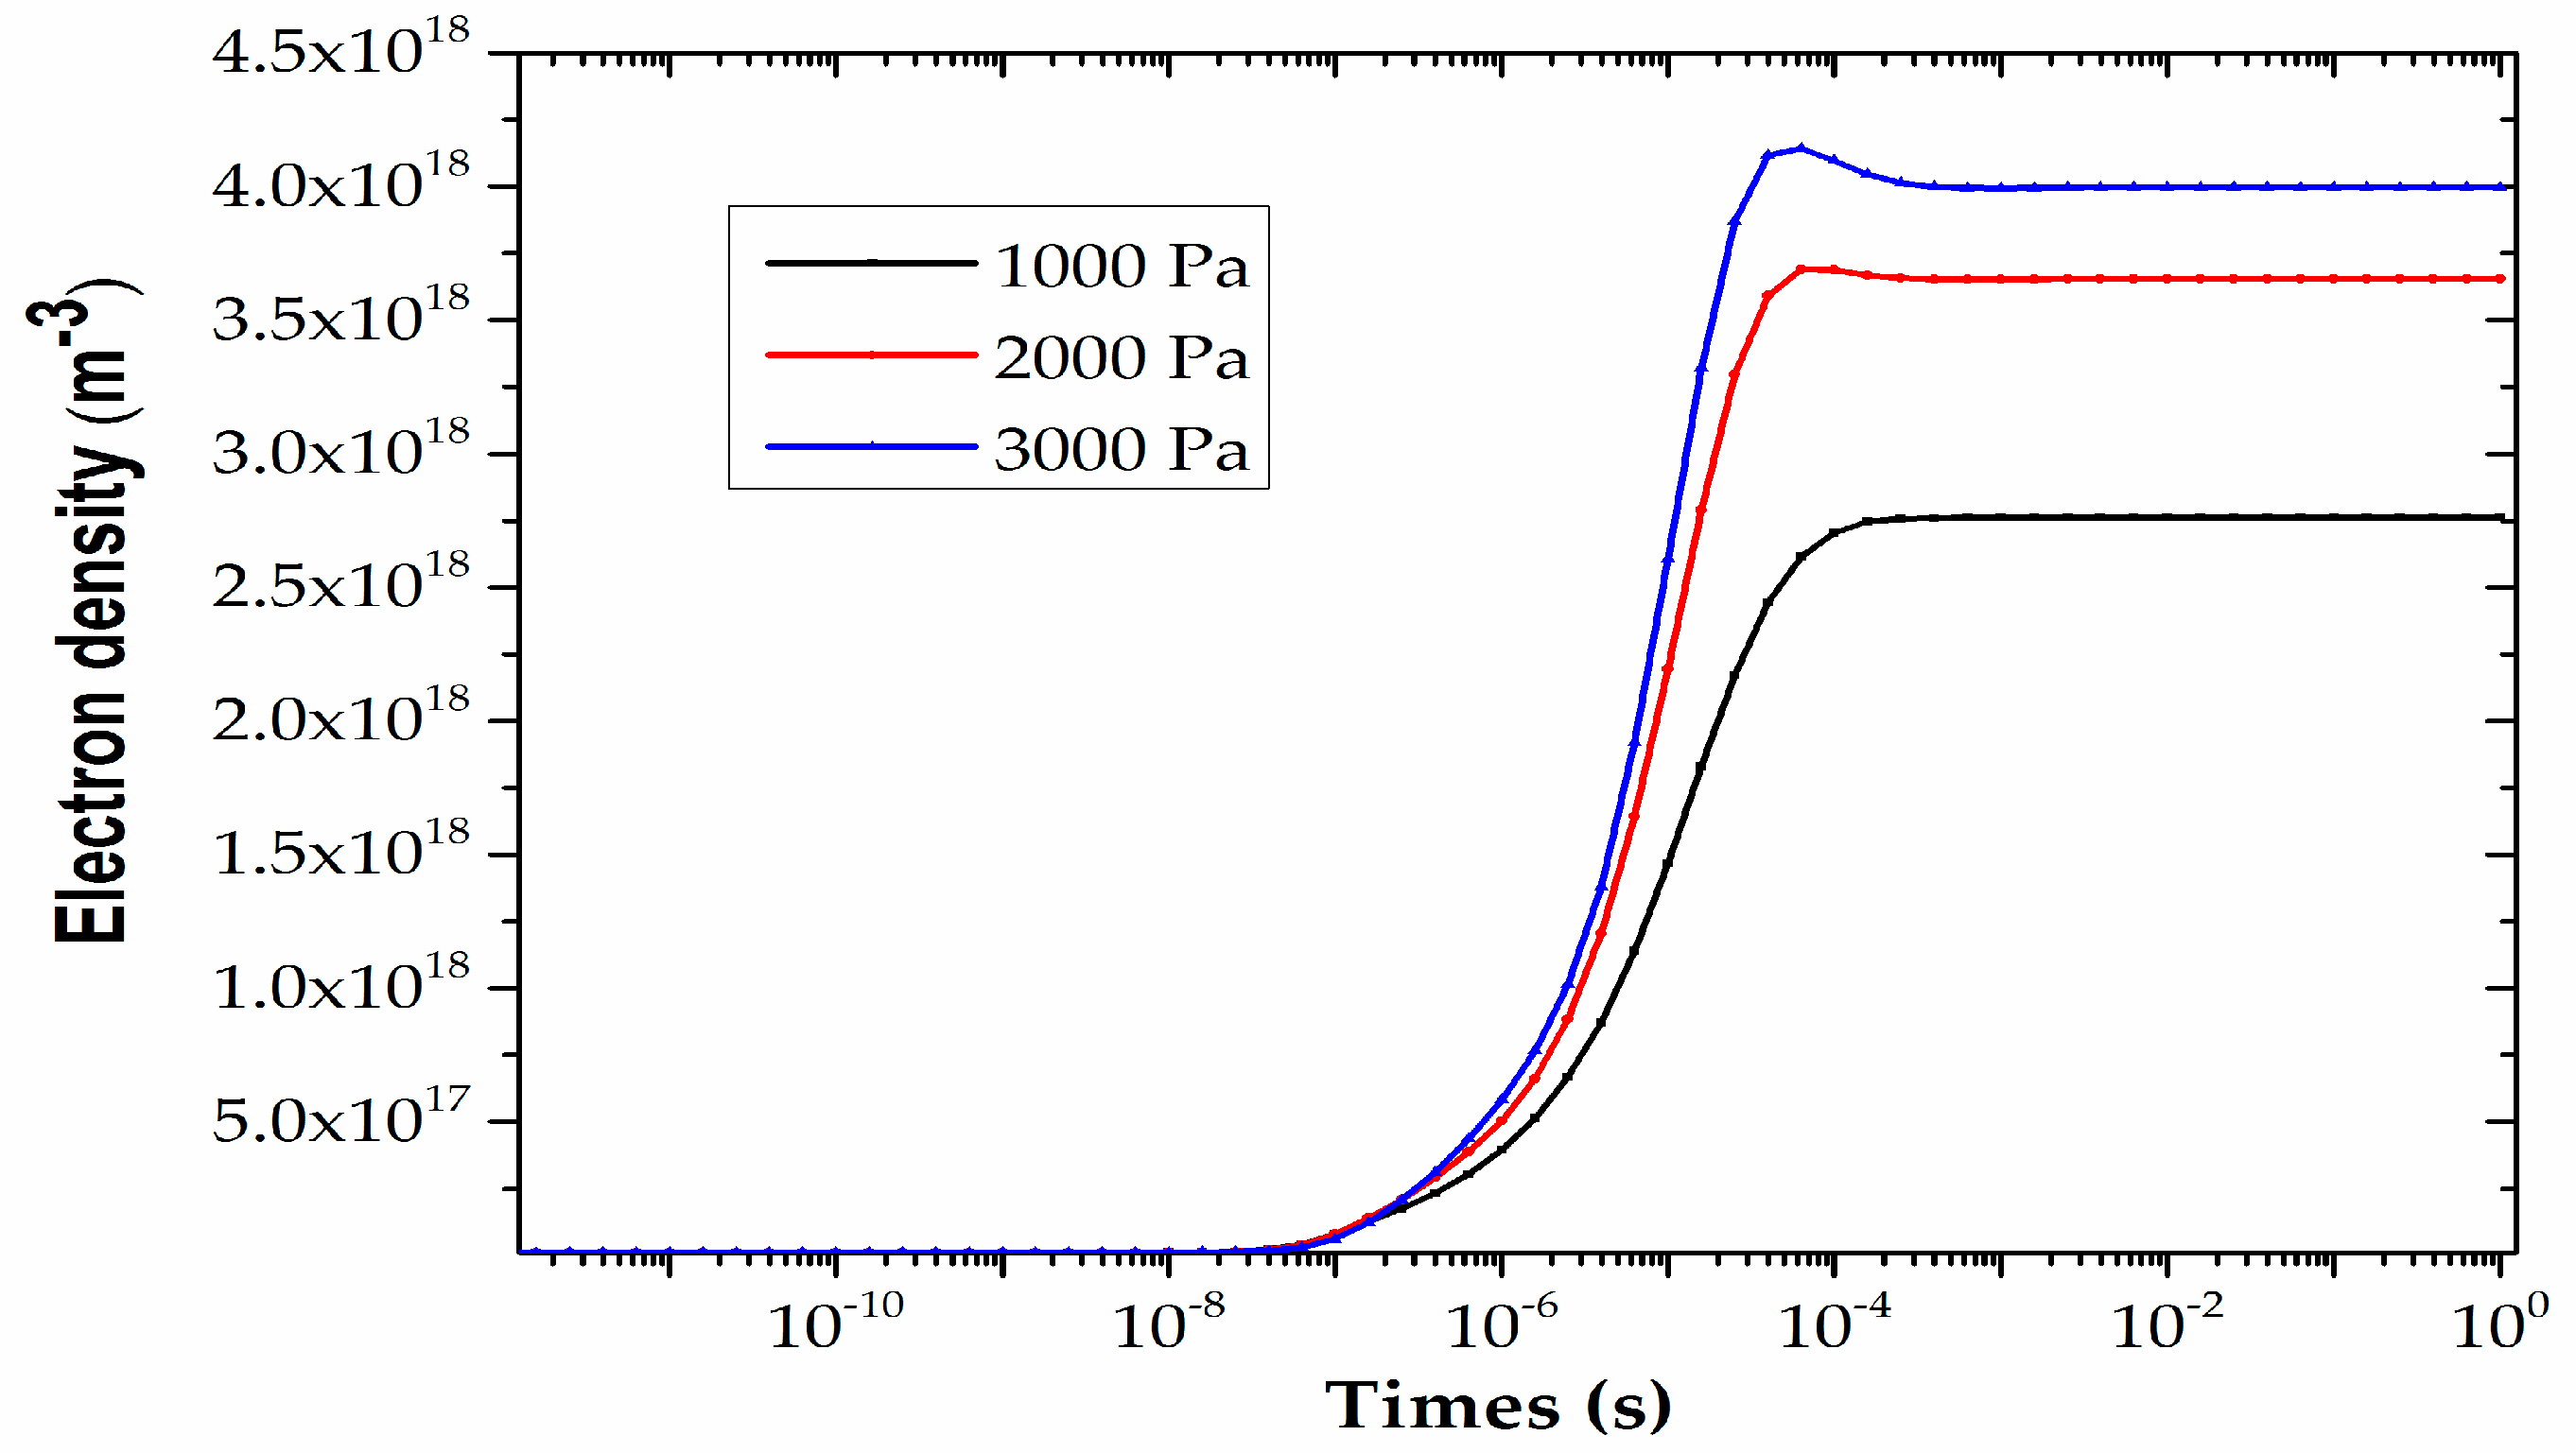
Figure 7 shows that the growth trend of the electron density in the quartz tube can be divided into three stages during the excitation process. In the first stage (10−12 s–5 × 10⁻⁷ s), owing to the existence of a potential barrier inside the plasma, interference from external factors can be hindered or suppressed, thereby allowing an internal balance. The applied electromagnetic field cannot change the particle balance in the plasma. As sufficient power cannot be supplied over a short time for collisional reactions to occur easily, such reactions within the plasma remain at a lower level, and electron density remains at about 1016 m−3. As less energy is absorbed, even when a large amount of microwave passes through the plasma, the electron density remains unchanged. In the second stage (5 × 10⁻⁷ s–10−4 s), adequate energy is accumulated to disrupt the internal balance of the plasma, because of which there are relatively strong collisions in the plasma. Thus, the electron density increases rapidly in a short time; it exceeds the cutoff electron density 4 × 10¹⁷ m−3 for the collisionless regime, and causes an effect of electron avalanche [42]. Owing to the effect of collisions, a microwave is not reflected and can penetrate the region where the electron density is much higher compared with the critical value; that area, thus, becomes the best microwave absorber, which can reduce undesirable radiation [43], and the electron density continues to increase. In the third stage (10−4 s–1 s), with increasing electron density, the plasma sheath becomes thicker and thicker, its ability to resist microwave is enhanced, and the absorption energy is reduced. Finally, the loss of charged particles by diffusion to the wall becomes basically the same as the gain of charged particles from the plasma sheath; thus the generation and disappearance of electrons reach a dynamic balance, and the electron density becomes stable at 2.76 × 10¹⁸ m−3.
Figure 8 shows that the conductivity is low at 10−12 s because the internal electrons are very sparsely distributed. During the process of excitation, after the electron density increases to the cutoff value, the relative permittivity of the plasma becomes negative because of strong internal collisions, and with the increasing electron density, the tendency of the plasma to exhibit metal-like properties becomes stronger. When the plasma starts behaving like a good conductor, and the maximum value of conductivity increases suddenly to 12 S/m, a coaxial waveguide is formed with the outside metal wall, thereby preventing leakage of the microwave. Consequently, surface waves are generated and propagate the microwave energy to both ends of the quartz tube; this propagated energy excites the plasma that has not been previously excited at each end. In turn, the upper and lower ends start exhibiting metal-like properties that allow the surface waves to continue to propagate [24].
Figure 9 reveals that the modulus of the electric field in the waveguide is greatest at 10–12 s. Owing to the influence of the sheath at 10–7 s, the modulus of the electric field at the center of the plasma torch starts to decrease. Over time, at 10–6 s, because the sheath resists most of the incoming microwave, surface waves start propagating along the plasma torch surface in both positive and negative x directions. At 10–4 s, the surface waves stop propagating and the conductivity becomes steady.
Figure 10 shows the spatial distribution of Ar2+ under intermediate pressure; Ar2+ is concentrated outside the waveguide, contrary to the electron density, which is concentrated in the region CFIL (see Figure 3) inside the plasma torch. Owing to the intense reactions, the gas temperature inside the waveguide is higher than the outside temperature. On the one hand, the high gas temperature will reduce the rate of the atom–ion recombination (Table 1), thereby inhibiting the formation of molecular ions. On the other hand, the rate of dissociation of molecular ions (Table 1) will increase with increasing temperature. Thus, an increase in temperature will lead to a decrease in the number of molecular ions and an increase in the number of atomic ions, so the uneven heating of the gas would affect molecular ion dynamics [25]. In addition, as shown in Figure 11, the electrons transfer their power to the Ar species through elastic and inelastic collisions, which ultimately increases the gas temperature in the high electron densities region. However, the gas temperature and electron density show similar trends, but the electron density drops by two levels of magnitude from the inside to the outside part of the waveguide.
The content mentioned above shows the changes in electron density, conductivity, and electric field modulus with time. In this section, overall results represent the changes in electron density with time and space in the case of intermediate pressure.

4.2. Analysis of the Effect of Different Pressures on Plasma Parameters

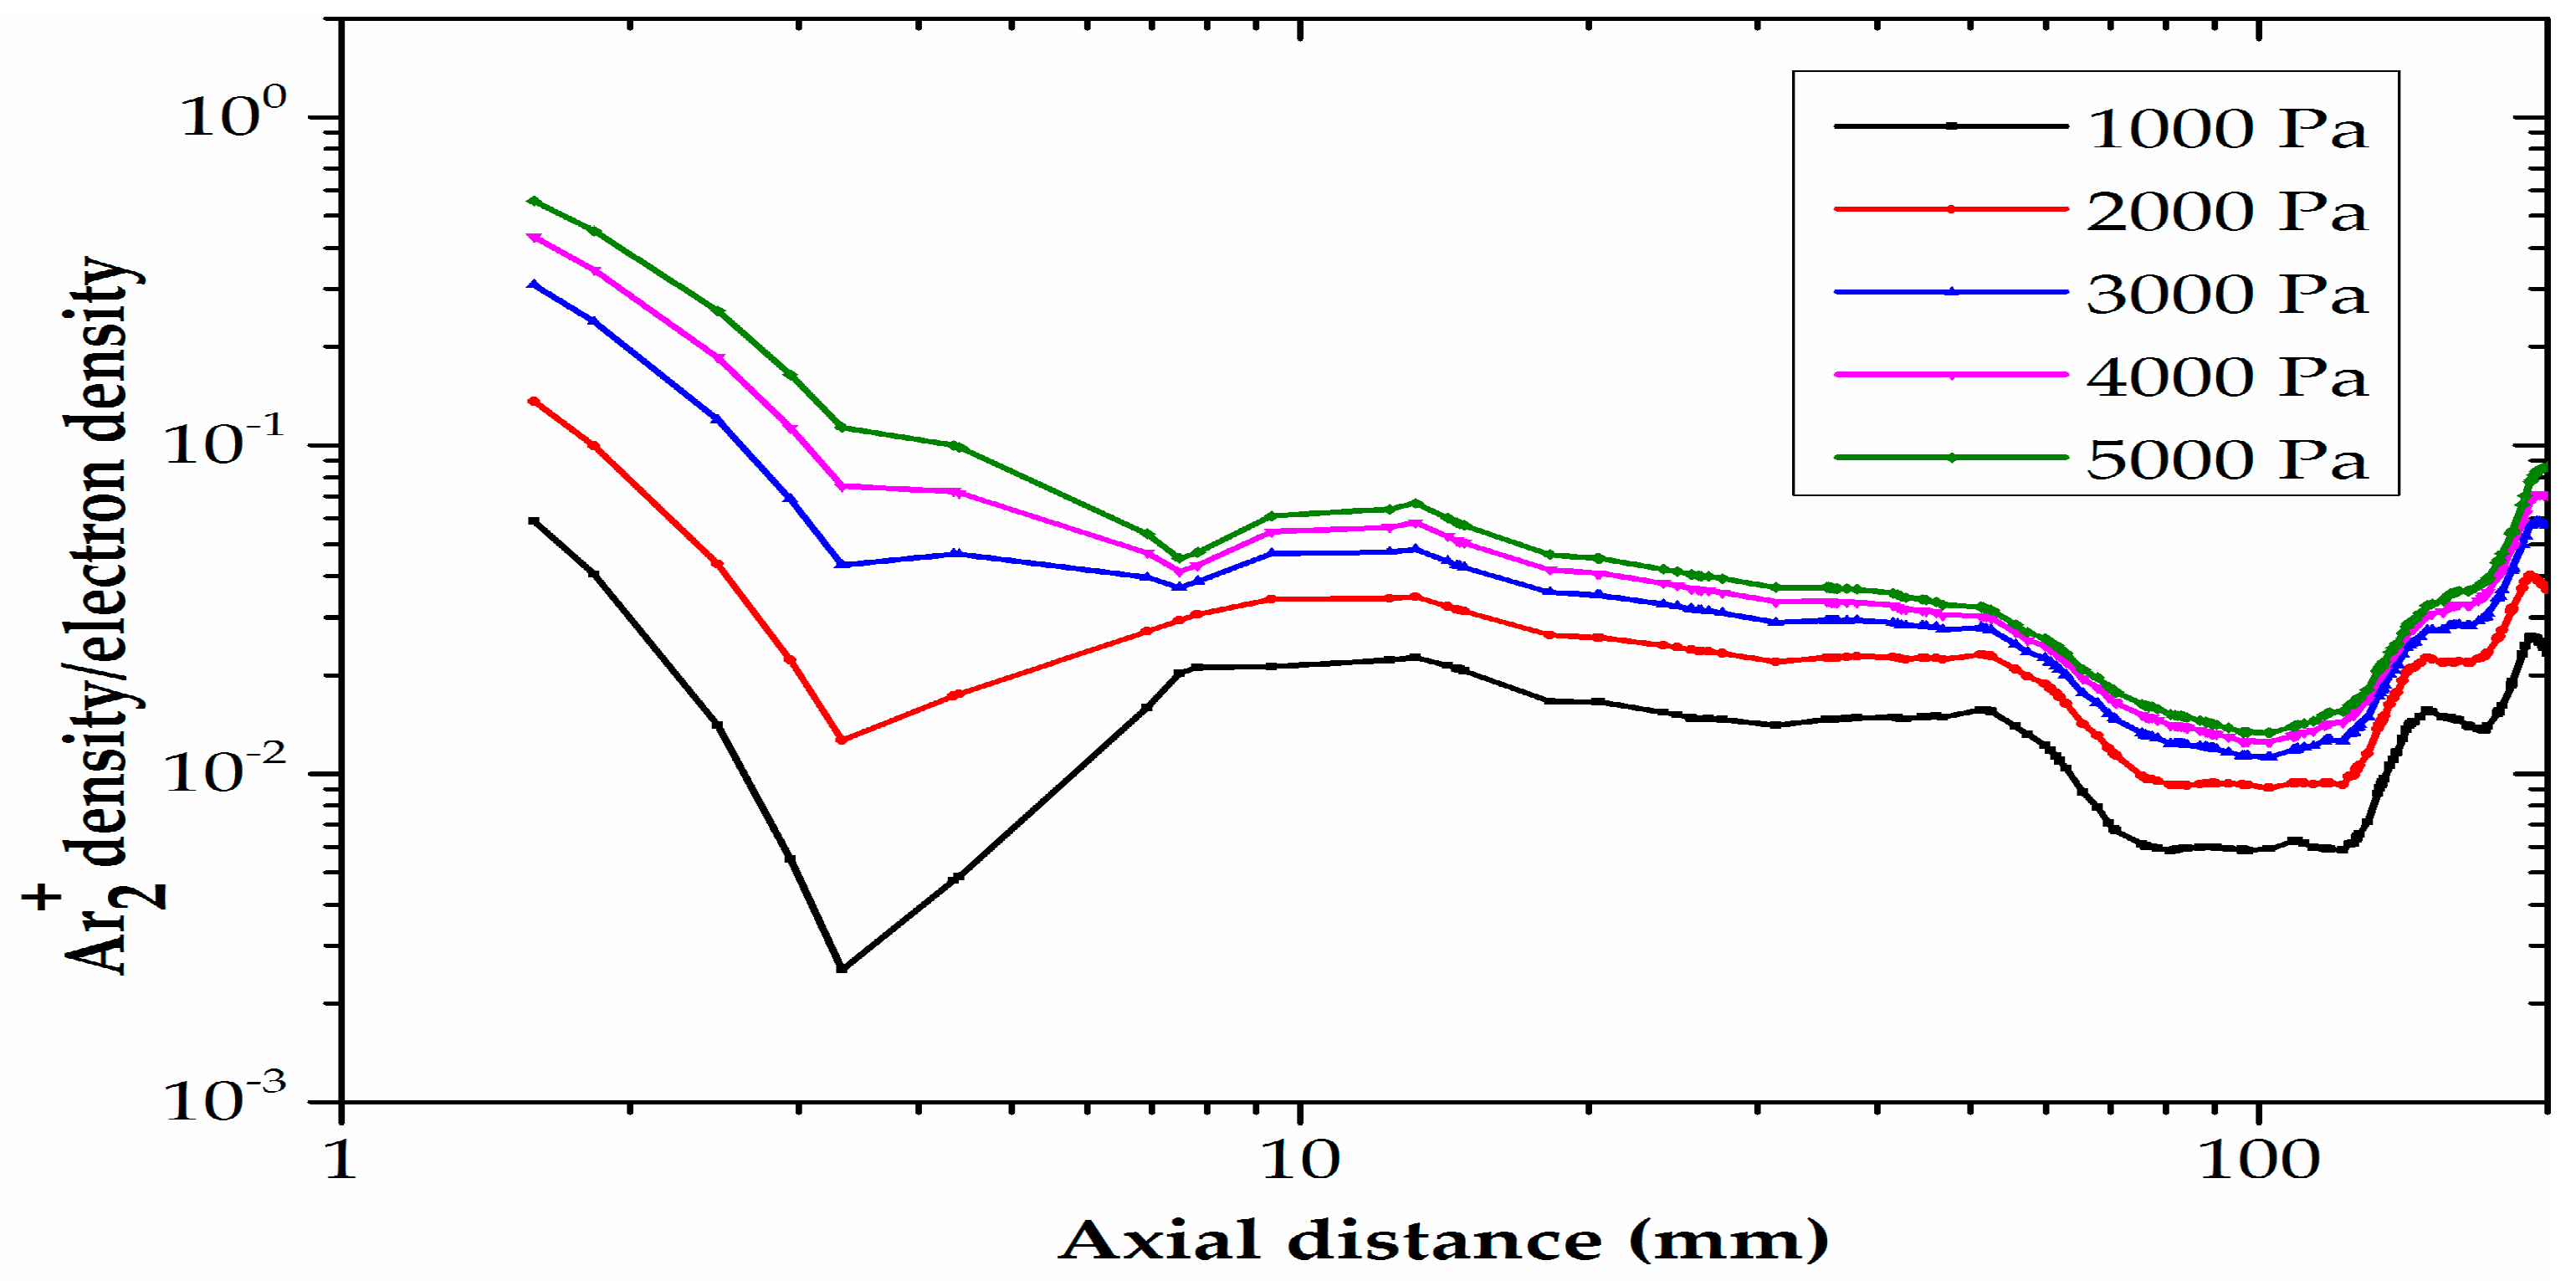
As shown in Figure 12, the ratio of molecular ion density to electron density on MN (Figure 3) in the axial direction of the plasma torch exhibits different trends at different pressures. Owing to a large number of molecular ions and the small electron density at the quartz tube port, the ratio near the port is far greater than that near the center of the tube. The ratio of the molecular ion density to electron density increases gradually with respect to the pressure increases, with the ratio near the port being close to 1 when the pressure reaches 5000 Pa.
Figure 13 and Figure 14 show the temporal and spatial changes in electron density at different pressures. In Figure 13, with increasing pressure, the overall electron density in the plasma torch increases from 2.75 × 10¹⁸ to 4 × 10¹⁸ m–3. The radial profile of the electron density is shown in Figure 14 at CH (see Figure 3), and it can be seen that when the pressure is 1000 Pa, the electron density at the plasma location has a Gaussian-like distribution, decreasing toward both sides from a maximum value at the center. With increasing pressure, the electron distribution changes—the maximum moves along the central axis away from the center, the peak becomes sharper, and the plasma becomes inhomogeneous; the reason for this phenomenon is that the increase in pressure results in a decrease in the mean free path and an increase in the operating frequency of collisions among particles, as shown in Figure 15. Thus, many particles have already collided before moving to the low-concentration region, which directly leads to an uneven distribution of electrons in the quartz tube, which can also be explained from the perspective of the electron temperature. According to Equation (17), the ambipolar diffusion coefficient is co-related to the ion diffusion coefficient and the electron and ion temperatures. The microwave plasma torch is in a non-thermal equilibrium state under intermediate pressure, with Te >> Ti>> Tg, which implies that the ambipolar diffusion coefficient is determined mainly by the electron temperature. With increasing pressure, the electron temperature in the quartz tube will decrease and, thus, so will the ambipolar diffusion coefficient; that is, with increasing pressure, the speed of plasma diffusion from the boundary to the middle will slow down, which will increase the inhomogeneity.
This section explains the effect of different pressures on plasma parameters. With the increase of pressure, the collision frequency and the electron density increase, but the uniformity of the electron density will also become worse.

5. Conclusions

The temporal and spatial variations in the electron density during the excitation of a microwave-induced argon plasma were studied by simulations based on a self-consistent 3D fluid plasma model with Maxwell equations at intermediate pressures. The growth over time of the plasma electron density can be divided into three stages. In the first stage, there is an equilibrium potential barrier in the plasma. Consequently, the electron density remains unchanged and the interference by external factors over short time scales is suppressed. In the second stage, an avalanche effect occurs, and the electron density increases rapidly to exceed its cutoff value. In the third stage, the increasing electron density boosts up the ability that make plasma microwaves resistant, and finally achieves a dynamic balance that assists in the growth of the electron density. The simulation results demonstrate that the permittivity becomes negative when the electron density of the plasma exceeds the cutoff value in the second stage, and the plasma then exhibits metal-like characteristics. The resulting higher conductivity allows the formation of a coaxial waveguide with the external metal wall, and surface waves then propagate and excite previously unexcited regions at the two ends of the plasma. In this circumstance, the electron density increases consistently. The spatial distribution of electron density in the case of intermediate pressure is different from that in the case of atmospheric pressure. The highest electron density is concentrated on the side of the quartz tube near the wave feed port. Owing to diffusion, electrons will move toward the middle of the quartz tube, and the diffusion will become stronger with decreasing pressure. Thus, a decrease in pressure can improve the uniformity of the plasma, but a decrease of pressure will also cause the electron density to decrease. A reduction in electron density is not helpful to the decomposition of CO2. In addition, owing to the strong interaction between the microwaves and the plasma, the temperature of the gas will increase, and a high gas temperature will reduce the production rate of Ar2+ and increase the consumption rate, thereby reducing the number of Ar2+ ions. Electrons will then become concentrated mainly inside the waveguide, and Ar2+ will become concentrated mainly outside the waveguide in the quartz tube.

Author Contributions

Conceptualization, Q.S.; methodology, Q.S.; software, Q.S.; validation, Q.S., and R.H.; formal analysis, R.H.; investigation, R.H.; data curation, Q.S.; writing—original draft preparation, Q.S.; writing—review and editing, Z.X. and W.H.; visualization, Q.S.; supervision, W.H.; project administration, W.H.; funding acquisition, W.H. All authors have read and agreed to the published version of the manuscript.

Funding

This work was supported by National Key Research and Development Program of China (Grant No. 2017YFB0308601) and Civil Aviation Joint Fund of the National Natural Science Foundation of China (Grant No. U1733109).

Acknowledgments

The authors are pleased to acknowledge M. C. M. van de Sanden for helpful discussions.

Conflicts of Interest

The authors declare no conflict of interest.

References

  1. Hui, G.; Dongxue, H.; Li, X.; Ying, T.; Zhaobo, C.; Yimin, Z. Removal of low-concentration benzene in indoor air with plasma-MnO2 catalysis system. J. Electrost. 2015, 76, 216–221. [Google Scholar]
  2. Zhang, L.; Sha, X.; Zhang, L.; He, H.; Ma, Z.; Wang, L.; Wang, Y.; She, L. Synergistic catalytic removal NOX and the mechanism of plasma and hydrocarbon gas. AIP Adv. 2016, 6, 075015. [Google Scholar] [CrossRef] [Green Version]
  3. Ficek, M.; Sankaran, K.J.; Ryl, J.; Bogdanowicz, R.; Lin, I.; Haenen, K.; Darowicki, K. Ellipsometric investigation of nitrogen doped diamond thin films grown in microwave CH4/H2/N2 plasma enhanced chemical vapor deposition. Appl. Phys. Lett. 2016, 108, 241906. [Google Scholar] [CrossRef] [Green Version]
  4. Baranov, O.; Bazaka, K.; Kersten, H.; Keidar, M.; Cvelbar, U.; Xu, S.; Levchenko, I. Plasma under control: Advanced solutions and perspectives for plasma flux management in material treatment and nanosynthesis. Appl. Phys. Rev. 2017, 4, 041302. [Google Scholar] [CrossRef] [Green Version]
  5. Norberg, S.A.; Johnsen, E.; Kushner, M.J. Helium atmospheric pressure plasma jets touching dielectric and metal surfaces. J. Appl. Phys. 2015, 118, 013301. [Google Scholar] [CrossRef]
  6. Bai, B.; Li, X.; Xu, J.; Liu, Y. Reflections of electromagnetic waves obliquely incident on a multilayer stealth structure with plasma and radar absorbing material. IEEE Trans. Plasma Sci. 2015, 43, 2588–2597. [Google Scholar]
  7. Xu, J.; Bai, B.; Dong, C.; Dong, Y.; Zhu, Y.; Zhao, G. Evaluations of plasma stealth effectiveness based on the probability of radar detection. IEEE Trans. Plasma Sci. 2018, 45, 938–944. [Google Scholar] [CrossRef]
  8. Rincon, R.; Marinas, A.; Munoz, J.; Melero, C.; Calzada, M. Experimental research on ethanol-chemistry decomposition routes in a microwave plasma torch for hydrogen production. Chem. Eng. J. 2016, 284, 1117–1126. [Google Scholar] [CrossRef]
  9. Barankova, H.; Bardos, L. Atmospheric pressure plasma conversion of CO2 to solid deposits. Results Phys. 2015, 5, 257–258. [Google Scholar] [CrossRef]
  10. Qin, Y.; Niu, G.; Wang, X.; Luo, D.; Duan, Y. Status of CO2 conversion using microwave plasma. J. CO2 Util. 2018, 28, 283–291. [Google Scholar] [CrossRef]
  11. Javier, F.; Moreno, S.H.; Stankiewicz, A.I.; Stefanidis, G.D. On the improvement of chemical conversion in a surface-wave microwave plasma reactor for CO2 reduction with hydrogen (The Reverse Water-Gas Shift reaction). Int. J. Hydrogen Energy 2017, 42, 12943–12955. [Google Scholar]
  12. Bogaerts, A.; Berthelot, A.; Heijkers, S.; Kolev, S.; Snoeckx, R.; Sun, S.; Trenchev, G.; Van, L.K.; Wang, W. CO2 conversion by plasma technology: Insights from modeling the plasma chemistry and plasma reactor design. Plasma Sources Sci. Technol. 2017, 26, 063001. [Google Scholar] [CrossRef]
  13. Mohsenian, S.; Nagassou, D.; Elahi, R.; Yu, P.; Nallar, M.; Wong, H.; Trelles, J.P. Carbon dioxide conversion by solar-enhanced microwave plasma: Effect of specific power and argon/nitrogen carrier gases. J. CO2 Util. 2019, 35, 725–732. [Google Scholar] [CrossRef]
  14. Rutberg, P.G.; Kuznetsov, V.A.; Popov, V.E.; Popov, S.D.; Surov, A.V.; Subbotin, D.I.; Bratsev, A.N. Conversion of methane by CO2+ H2O+ CH4 plasma. Appl. Energy 2015, 148, 159–168. [Google Scholar] [CrossRef]
  15. Moreno, S.H.; Stankiewicz, A.I.; Stefanidis, G.D. A two-step modelling approach for plasma reactors–Experimental validation for CO2 dissociation in surface wave microwave plasma. React. Chem. Eng. 2019, 4, 1253–1269. [Google Scholar] [CrossRef] [Green Version]
  16. Stewig, C.; Schüttler, S.; Urbanietz, T.; Böke, M.; von Keudell, A. Excitation and dissociation of CO2 heavily diluted in noble gas atmospheric pressure plasma. J. Phys. D Appl. Phys. 2020, 13, 125205. [Google Scholar] [CrossRef]
  17. Fu, Y.; Krek, J.; Parsey, G.M.; Verboncoeur, J.P. Characterizing the dominant ions in low-temperature argon plasmas in the range of 1–800 Torr. Phys. Plasmas 2018, 25, 033505. [Google Scholar] [CrossRef]
  18. Arcese, E.; Rogier, F.; Boeuf, J. Plasma fluid modeling of microwave streamers: Approximations and accuracy. Phys. Plasmas 2017, 24, 113517. [Google Scholar] [CrossRef]
  19. Miotk, R.; Jasinski, M.; Mizeraczyk, J. Electromagnetic optimisation of a 2.45 GHz microwave plasma source operated at atmospheric pressure and designed for hydrogen production. Plasma Sources Sci. Technol. 2018, 27, 035011. [Google Scholar] [CrossRef]
  20. Gudmundsson, J.T.; Kawamura, E.; Lieberman, M.A. A benchmark study of a capacitively coupled oxygen discharge of the oopd1 particle-in-cell Monte Carlo code. Plasma Sources Sci. Technol. 2013, 22, 035011. [Google Scholar] [CrossRef]
  21. Lebedev, Y.A. Microwave discharges at low pressures and peculiarities of the processes in strongly non-uniform plasma. Plasma Sources Sci. Technol. 2015, 24, 053001. [Google Scholar] [CrossRef]
  22. Bernatskiy, A.; Kochetov, I.; Lagunov, V.; Ochkin, V. Electric fields and concentrations of charged and neutral hydrogen isotopic particles in the plasma of low pressure DC discharge. Phys. Plasmas 2019, 26, 083511. [Google Scholar] [CrossRef]
  23. Zhonghang, W.; Rongqing, L.; Masaaki, N.; Xijiang, C. The Characteristics of Columniform Surface Wave Plasma Excited Around a Quartz Rod by 2.45 GHz Microwaves. Plasma Sci. Technol. 2016, 18, 987. [Google Scholar]
  24. Xiao, W.; Huang, K.; Zhang, W.; Lin, Y. Modeling of argon plasma excited by microwave at atmospheric pressure in ridged waveguide. IEEE Trans. Plasma Sci. 2016, 44, 1075–1082. [Google Scholar] [CrossRef]
  25. Kabouzi, Y.; Graves, D.; Castanos-Martinez, E.; Moisan, M. Modeling of atmospheric-pressure plasma columns sustained by surface waves. Phys. Rev. E 2007, 75, 016402. [Google Scholar] [CrossRef] [PubMed]
  26. Kabouzi, Y.; Calzada, M.; Moisan, M.; Tran, K.; Trassy, C. Radial contraction of microwave-sustained plasma columns at atmospheric pressure. J. Appl. Phys. 2002, 91, 1008–1019. [Google Scholar] [CrossRef]
  27. Georgieva, V.; Berthelot, A.; Silva, T.; Kolev, S.; Graef, W.; Britun, N.; Chen, G.; Mullen, J.; Godfroid, T.; Mihailova, D. Understanding Microwave Surface-Wave Sustained Plasmas at Intermediate Pressure by 2D Modeling and Experiments. Plasma Process. Polym. 2017, 14, 1600185. [Google Scholar] [CrossRef] [Green Version]
  28. Bouherine, K.; Tibouche, A.; Ikhlef, N.; Leroy, O. 3-D numerical characterization of a microwave argon PECVD plasma reactor at low pressure. IEEE Trans. Plasma Sci. 2016, 44, 3409–3416. [Google Scholar] [CrossRef]
  29. Jimenez-Diaz, M.; Carbonem, E.A.D.; Dijk, J.; Mullen, J.J. A two-dimensional Plasimo multiphysics model for the plasma-electromagnetic interaction in surface wave discharge: The surfatron source. J. Phys. D Appl. Phys. 2012, 17, 335204. [Google Scholar] [CrossRef]
  30. Baeva, M.; Hempel, F.; Baierl, H.; Trautvetter, T.; Foest, R.; Loffhagen, D. Two-and three-dimensional simulation analysis of microwave excited plasma for deposition applications: Operation with argon at atmospheric pressure. J. Phys. D Appl. Phys. 2018, 51, 385202. [Google Scholar] [CrossRef]
  31. Bogdanov, T.; Tsonev, I.; Marinova, P.; Benova, E.; Rusanov, K.; Rusanova, M.; Atanassov, I.; Kozáková, Z.; Krčma, F. Microwave Plasma Torch Generated in Argon for Small Berries Surface Treatment. Appl. Sci. 2018, 8, 1870. [Google Scholar] [CrossRef] [Green Version]
  32. Lee, B.-J.; Jo, S.-I.; Jeong, G.-H. Synthesis of ZnO Nanomaterials Using Low-Cost Compressed Air as Microwave Plasma Gas at Atmospheric Pressure. Nanomaterials 2019, 9, 942. [Google Scholar] [CrossRef] [PubMed] [Green Version]
  33. Zhao, G.; Hua, W.; Guo, S.; Liu, Z. Three-dimensional simulation of microwave-induced helium plasma under atmospheric pressure. Phys. Plasmas 2016, 23, 073503. [Google Scholar] [CrossRef]
  34. Yang, Y.; Hua, W.; Guo, S. Numerical study on microwave-sustained argon discharge under atmospheric pressure. Phys. Plasmas 2014, 21, 040702. [Google Scholar] [CrossRef]
  35. Chen, G.; Georgieva, V.; Godfroid, T.; Snyders, R.; Delplancke-Ogletree, M. Plasma assisted catalytic decomposition of CO2. Appl. Catal. B Environ. 2016, 190, 115–124. [Google Scholar] [CrossRef]
  36. Jonkers, J.; Sande, M.; Sola, A.; Gamero, A.; Rodero, A.; Mullen, J. The role of molecular rare gas ions in plasmas operated at atmospheric pressure. Plasma Sources Sci. Technol. 2003, 12, 464. [Google Scholar] [CrossRef]
  37. Kaw, P.; Valeo, E.; Dawson, J.M. Interpretation of an experiment on the anomalous absorption of an electromagnetic wave in a plasma. Phys. Rev. Lett. 1970, 25, 430. [Google Scholar] [CrossRef]
  38. Baeva, M.; Bosel, A.; Ehlbeck, J.; Loffhagen, D. Modeling of microwave-induced plasma in argon at atmospheric pressure. Phys. Rev. E 2012, 85, 056404. [Google Scholar] [CrossRef]
  39. Naito, T.; Yamaura, S.; Fukuma, Y.; Sakai, O. Radiation characteristics of input power from surface wave sustained plasma antenna. Phys. Plasmas 2016, 23, 93504. [Google Scholar] [CrossRef]
  40. Zhang, W.; Wu, L.; Huang, K.; Tao, J. Propagating modes of the travelling wave in a microwave plasma torch with metallic enclosure. Phys. Plasmas 2019, 26, 042101. [Google Scholar] [CrossRef]
  41. Moisan, M.; Nowakowska, H. Contribution of surface-wave (SW) sustained plasma columns to the modeling of RF and microwave discharges with new insight into some of their features. A survey of other types of SW discharges. Plasma Sources Sci. Technol. 2018, 27, 073001. [Google Scholar] [CrossRef]
  42. Zhigang, L.; Zhongcai, Y.; Jiachun, W.; Jiaming, S. Simulation of propagation of the HPM in the low-pressure argon plasma. Plasma Sci. Technol. 2017, 20, 025401. [Google Scholar]
  43. Meindl, A.; Loehle, S.; Kistner, I.; Schulz, A.; Fasoulas, S. Two-Photon Induced Polarization Spectroscopy for Atomic Oxygen in Atmospheric Plasma and Xenon. In Proceedings of the AIAA Scitech 2019 Forum, San Diego, CA, USA, 7–11 January 2019. [Google Scholar]
Figure 1. Graphical representation of the microwave excitation device.
Applsci 10 05393 g001
Figure 2. Cutaway view of the microwave plasma torch.
Applsci 10 05393 g002
Figure 3. Two-dimensional (2D) section of the model (y = 0), with dimensions.
Applsci 10 05393 g003
Figure 4. Slice plots of the distribution of the electron density (m−3) inside the quartz tube in the xz (y = 0) plane under a pressure of 2000 Pa: (a) 10−12 s; (b) 10−7 s; (c) 10−6 s; (d) 10−5 s; (e) 10−4 s; (f) 1 s.
Applsci 10 05393 g004
Figure 5. Slice plots of the distribution of the microwave electric field module (V/m) in the xz (y = 0) plane at 10−6 s under a pressure of 2000 Pa.
Applsci 10 05393 g005
Figure 6. Slice plots of the distribution of the electron density (m−3) inside the quartz tube at atmospheric pressure at 1 s in (a) the zy plane (at x = 27.3 mm, i.e., CF in Figure 3) and (b) the xz plane (at y = 0), the flow rate is 1 L/min.
Applsci 10 05393 g006
Figure 7. Variation in electron density (m−3) from 10−12 s to 1 s under a pressure of 2000 Pa.
Applsci 10 05393 g007
Figure 8. Slice plots of the distribution of conductivity (S/m) inside the quartz tube in the xz (y = 0) plane under a pressure of 2000 Pa: (a) 10−12 s; (b) 10−7 s; (c) 10−6 s; (d) 10−5 s; (e) 10−4 s; (f) 1 s.
Applsci 10 05393 g008
Figure 9. Slice plots of the distribution of electric field (V/m) inside the quartz tube in the xz (y = 0) plane under a pressure of 2000 Pa: (a) 10−12 s; (b) 10−7 s; (c) 10−6 s; (d) 10−5 s; (e) 10−4 s; (f) 1 s.
Applsci 10 05393 g009
Figure 10. Slice plots of the distribution of the Ar2+ density (m–3) inside the quartz tube under a pressure of 2000 Pa at 1 s in (a) the zy plane (x = 27.3 mm, i.e., CF in Figure 3) and (b) the xz (y = 0) plane.
Applsci 10 05393 g010
Figure 11. Distributions of electron density, gas temperature (K), and Ar2+ at MN (see Figure 3) at 1 s under a pressure of 2000 Pa.
Applsci 10 05393 g011
Figure 12. Axial profiles of the ratio of molecular ion density to electron density at 1 s under different pressures.
Applsci 10 05393 g012
Figure 13. Effect of Ar pressure on the electron density from 10–12 s to 1 s.
Applsci 10 05393 g013
Figure 14. Radial profile at CH (see Figure 3) of the electron density from 1000 to 3000 Pa at 1 s.
Applsci 10 05393 g014
Figure 15. Variation of the plasma degrees of freedom and collision frequency from 1000 to 3000 Pa.
Applsci 10 05393 g015
Table 1. Main chemical reactions and collision processes during argon discharge.
NOProcessReactionRate Coefficient (m3/s)△E
1Elastic scattering A r + e A r + e k e s
2Ground state excitation A r + e A r * + e k e x 11.56
3Ground state ionization A r + e A r + + 2 e k i 15.8
4Step-wise ionization A r * + e A r + + 2 e k s i 4.24
5Superelastic collision A r * + e A r + e k s c −11.56
6Metastable pooling A r * + A r * A r + + A r + e 1.625 × 10 16 T 0.5
7Two-body quenching A r * + A r 2 A r 3 × 10 21
8Three-body recombination A r + + 2 e e + A r 8.75 × 10 39 T 4.5 m 6 / s −15.76
9Dissociative recombination A r 2 + + e A r * + A r 1.03 × 10 12 ( 0.026 T e ) 0.67 1 exp ( 418 / T ) 1 0.31 exp ( 418 / T )
10Electron impact A r 2 + + e e + A r + + A r 1.11 × 10 12 exp [ 2.94 + 3 ( T 11600 0.026 T e ) ]
11Atomic ions conversion A r + + 2 A r A r + A r 2 + 7.5 × 10 41 T 1 m 6 / s
12Molecular ions dissociation atom impact A r 2 + + A r 2 A r + A r + 6.06 × 10 12 exp [ 12580 T ]
13Diffusion m w a l l ( A r , A r + , e , A r * , A r 2 + )
Table 2. Boundary conditions to the model equations.
Physical FieldPlasma
Boundary
KJ n Γ e = 0 n Γ Δ = 0 n J k = 0 n ε 0 ε r p E = 0
DE n Γ e = 0 n Γ Δ = 0 n J k = 0 n ε 0 ε r p E = 0
DK, EJ n Γ e = v e , t h n e 2 n Γ Δ = 5 v e , t h n Δ 6 Surface Reactions V = 0
Physical Field BoundaryElectromagnetic Wave
GH P i n
BA, BC, FG, AL, IH, GH n × E = 0
Physical Field BoundaryLaminar Flow
KJ u i n
DE P 0
DK, EJ u = 0
Physical Field BoundaryHeat Transfer in Fluids
KJ T = T 0
DE n q = q 0 , q 0 = h ( T e x t T )
DK, EJ n q = 0