Article

Research on Lifespan Prediction of Cross-Linked Polyethylene Material for XLPE Cables

1
School of Electrical Engineering, Southeast University, Nanjing 210096, China
2
State Grid Jiangsu Electric Power Company Research Institute, Nanjing 210008, China
*
Author to whom correspondence should be addressed.
Appl. Sci. 2020, 10(15), 5381; https://doi.org/10.3390/app10155381
Submission received: 29 June 2020 / Revised: 27 July 2020 / Accepted: 3 August 2020 / Published: 4 August 2020
(This article belongs to the Section Electrical, Electronics and Communications Engineering)

Abstract

:

Featured Application

The prediction method proposed in this paper can be used to determine the operating time of cross-linked polyethylene (XLPE) cables from Factory A, which can be widely adopted in future research.

Abstract

In this paper, cross-linked polyethylene (XLPE) cables of the same batch from Factory A, which ran from 1 to 8 years in Jiangsu Province, are sampled. Some widely accepted aging characterization methods of XLPE cables such as the gel content test, differential scanning calorimetry (DSC) test, tensile test and hardness test are employed to obtain the physicochemical, mechanical and electrical properties of the samples. Then, some lifespan prediction parameters significantly correlated with operating time are obtained through correlation calculations. Finally, a prediction method is proposed to predict the operating time of XLPE cables from Factory A. The test results indicate that parameters including the gel content Cge, the crystallinity XC, tensile strength σ, ultimate elongation δ, the dielectric permittivity ε, and the dielectric loss Jtan are significantly correlated with operating time, which can be used in evaluating the aging degree of XLPE cables. Moreover, due to the high accuracy of the experimental verification, it turns out that the lifespan prediction method proposed in this paper can be used to determine the operating time of XLPE cables from Factory A in future research.

1. Introduction

Cross-linked polyethylene (XLPE) cables, with excellent electrical and mechanical properties, have been widely used in alternating current (AC) and direct current (DC) transmission systems [1,2]. As the operating time of XLPE cables goes by, the performance of the XLPE cables deteriorates, owing to their subjection to electrical and thermal operating constraints permanently, which, in turn, result in an increase in the probability of electrical breakdown accidents [3,4].
Over the past few years, plenty of studies have been carried out to evaluate the aging performance of XLPE cables in the aging process. In [5,6], the loss angle tangent test and tensile strength test were performed to evaluate the electrical properties and mechanical properties of XLPE cables. In [7,8], researchers evaluated the electrical properties of XLPE cables in the aging process by employing the dielectric property test and the AC breakdown strength test.
On this basis, some scholars proposed the use of one or several parameters summarized from the test results to characterize the aging degree of XLPE cables qualitatively or quantitatively in the aging process. In [9], the researchers evaluated the aging performance of XLPE cables by means of a dielectric breakdown test, where the dielectric breakdown strength was proposed as a parameter to characterize the aging degree of cables. In [10,11], gas chromatography–mass spectrometry, differential scanning calorimetry, oxidation induction time and measurements of dielectric loss tangent were utilized to monitor the aging performance of XLPE cables, and the dielectric loss tangent proved to be a reliable parameter for evaluating the aging performance of XLPE cables. Moreover, the researchers in [12] proposed the use of the carbonyl content to characterize the aging degree of XLPE cables. Unfortunately, due to the great influence of operating environments on the aging performance of XLPE cables, some deviations among the results calculated by the prediction methods and actual results remain unsolved.
In this paper, XLPE cables of the same batch from Factory A, which ran from 1 to 8 years in Jiangsu Province, are sampled. The changing law of the aging characterization parameters is investigated by means of widely accepted methods, including the gel content test, differential scanning calorimetry (DSC) test, tensile test, hardness test, dielectric frequency spectrum test and dielectric AC breakdown voltage test and the test results are presented in Section 2. In Section 3, some aging characterization parameters are explored and these parameters significantly correlate with ageing times obtained by adopting correlation calculations. On this basis, a prediction method based on a Backpropagation (denoted as BP) neural network is proposed for determining the aging time of XLPE cables.

2. Corresponding Parameters of Composite Insulator under Different Aging Years for Lifespan Prediction

In this research, XLPE cables (recorded as A1–A9), which ran from 1 to 8 years in adjacent lines in Jiangsu Province (the average temperature is about 15 °C and the average humidity is about 80%) were sampled. In order to investigate the changing law of lifespan prediction parameters in different years, several widely accepted methods, including the gel content test, differential scanning calorimetry (DSC) test, tensile test, hardness test, dielectric property and breakdown voltage test are employed for XLPE cables aged for different numbers of years in this section.

2.1. Physicochemical Properties

2.1.1. Gel Content Test

The gel content is the insoluble fraction of a polymer sample and is an indicator of the degree of cross-linking in cross-linked polymers. We performed this test in accordance with the standard ASTM D2765-11 to investigate the changing law of cross-linking in cross-linked polymers throughout the aging process. The test methods for the gel content test are as follows.
In preparation, a stainless steel mesh bag for placing samples was cleaned with anhydrous ethanol carefully, and then left to dry (until the quality of it (denoted as W1/g) no longer decreased) in a dry air oven, where the temperature was constant in 40 °C. Then, samples with a quality of 0.4 ± 0.02 g cut from XLPE cables were placed into the bag and the quality was denoted as W2/g.
When testing, all samples were dipped in xylenes at 150 °C for 12 h and then cleaned with anhydrous ethanol. After drying in a dry air oven until the quality did not increase, the quality of samples, denoted as W3/g, was obtained. The gel content can be obtained as follows:
C g e = W 3 W 1 W 2 W 1 × 100 %
where Cge is the average value of gel content, g; W3 is the quality of the sample after being dipped in xylenes, g; W2 is the quality of the stainless steel mesh bag with samples placed in it, g; W1 is the quality of the stainless steel mesh bag, g.
The test results for Cge are shown in Figure 1.
According to the test results obtained in Figure 1, with an increasing operating time, the gel content increases before decreasing. During the aging process, chemical bonds break under the joint action of high temperatures and strong electrical fields, which, in turn, lead to a decrease in gel content. Moreover, the free radicals in chemical bonds polymerize and reformate in chemical bonds under the action of high temperature, which increases the gel content. At an operating time between 0 and 2.5 years, a mass of free radicals exists in cross-linked polyethylene material and the increase in the bonding rate is the dominant factor, which, in turn, leads to an increase in the gel content of samples. At an operating time between 2.5 and 8 years, thermal aging causes molecular chains in cross-linked network structures to break, which, in turn, leads to a decrease in the gel content of samples.

2.1.2. Differential Scanning Calorimetry (DSC) Test

Cross-linked polyethylene material is composed of a semi-crystalline polymer, whose property is closely related to the crystal aggregation structure. To investigate the changing state of the crystallinity of samples throughout the aging process, some researchers have proposed the use of the crystallinity parameter [13]. The test methods for the DSC test are as follows.
TAQ 50 from the USA was used to perform this test. The DSC tests reported in this paper were conducted in a nitrogen atmosphere. In each test, about 10 mg of XLPE cable samples was heated from ambient conditions to 140 °C at 10 °C/min.
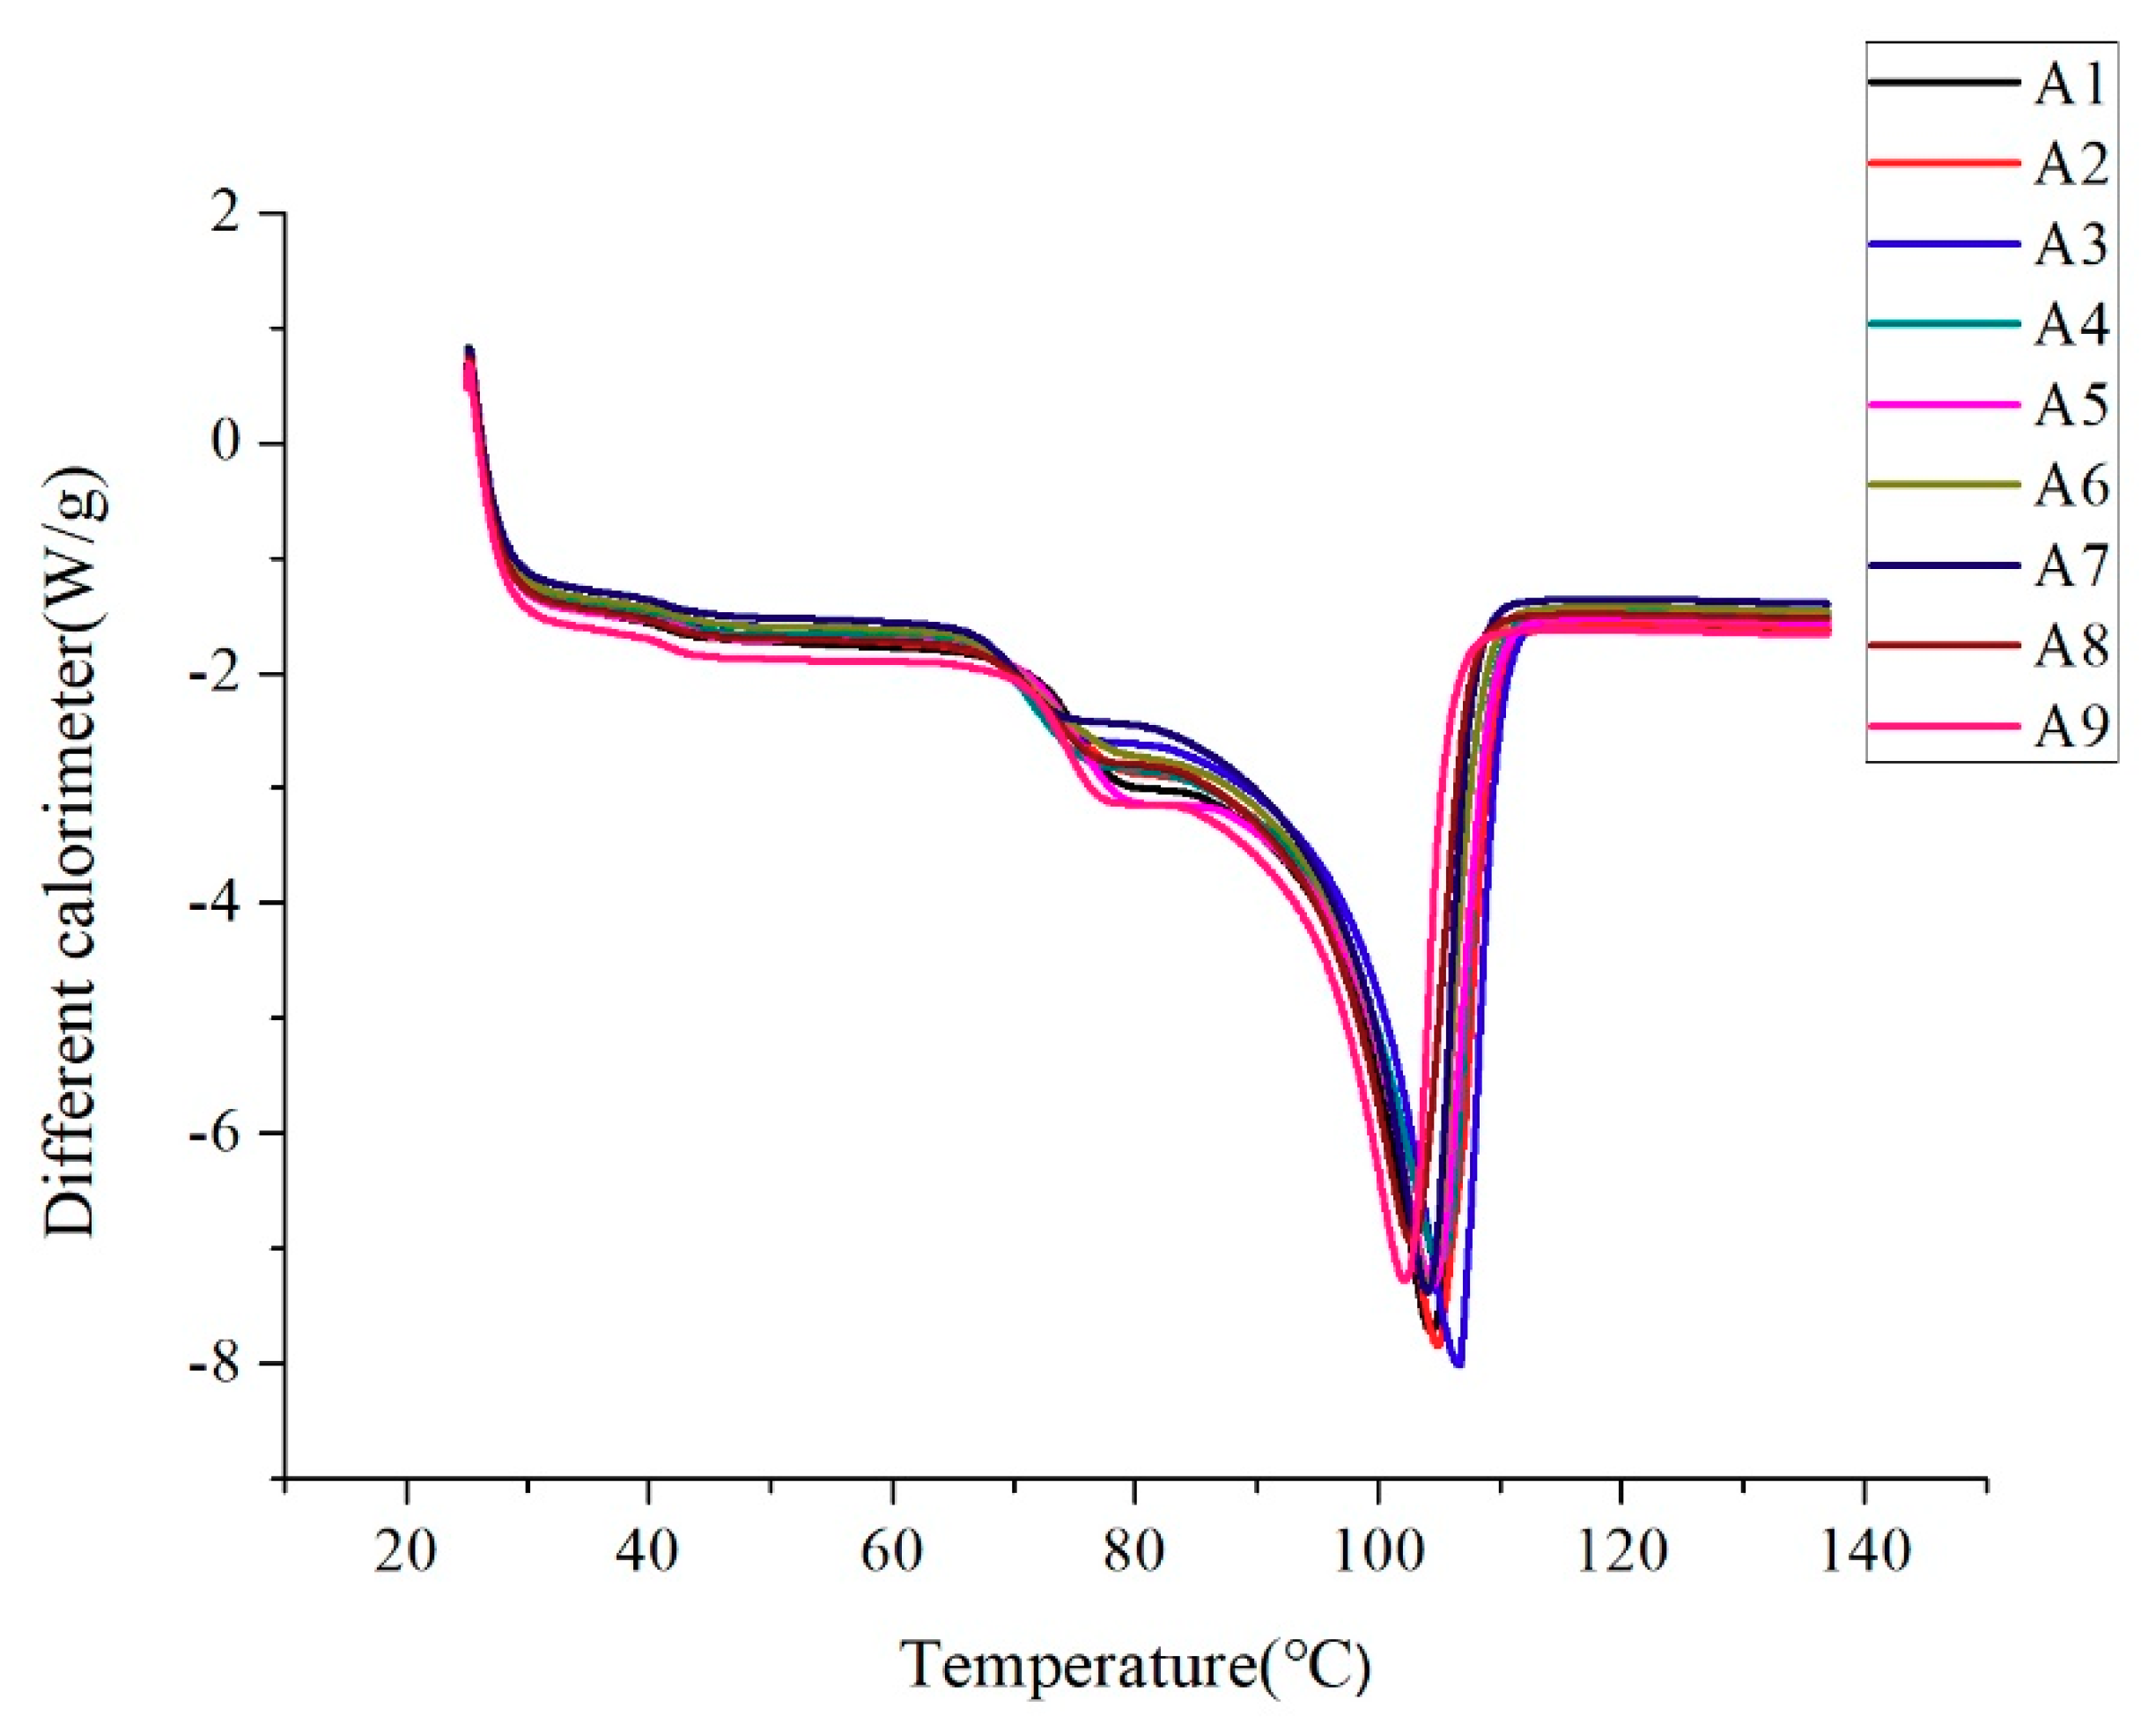
The DSC test results are shown in Figure 2.
Figure 2 presents the following:
(1)
There are two melting peaks in the samples with different aging times, which are distributed in two ranges: temperature 70~80 °C (denoted as peak 1) and 100~110 °C (denoted as peak 2).
(2)
With the increase in aging time, the melting temperature of samples moves towards a low temperature in melting peak 1, along with an increase in the area of melting peak 1. However, the change regularities of melting peak 2 are different to melting peak l, and can be divided into two ranges. When the operating time is within 2.5 years, the melting temperature moves towards a higher temperature and the area of melting peak 2 gradually increases. When the operating time exceeds 2.5 years, the melting temperature moves towards a low temperature and the area of melting peak 2 gradually decreases.
Since the crystallinity is directly related to the enthalpy fusion, which is proportional to the area under the main endothermic peak of crystalline fusion, the degree of crystallinity was deduced using relationship [13]:
X c = Δ H m Δ H 0 × 100 %
where Xc is the crystallinity of samples; ΔHm is the enthalpy of fusion, J/g; ΔH0 is the specific melting enthalpy for 100% of samples, ΔH0 = 287.3 J/g.
Combining the enthalpy fusion of samples obtained in test results with Equation (2), the crystallinity of samples of XLPE cables with different aging years from Factory A is listed in Table 1, and the standard deviation of the crystallinity of samples with the same operating time is denoted as σX.
Table 1 shows the relationship between crystallinity and operating time. In can be seen that the crystallinity of XLPE insulation presents an increase when the operating time is less than 2.5 years. However, a rapid decrease in crystallinity can be found when the operating time exceeds the critical time. The reason for this phenomenon is the thermal oxidation and pyrolysis reaction on XLPE cables, which, in turn, enhances molecular polarity and shortens macromolecular chains. Due to some antioxidants remaining in XLPE insulation, the thermo-oxygen aging reaction is offset, which, in turn, leads to an increase in the enthalpy of fusion. Meanwhile, when antioxidants are expended out, the crystallinity decreases with the increase in operating time. In addition, as the content of small molecules in the material increases, more cross-linked reactions occur in samples under oxidation reactions, leading to a rapid decrease in crystallinity.

2.2. Mechanical Properties

2.2.1. Tensile Testing

Tensile testing is one of the widely accepted methods for evaluating the aging performance of XLPE cables. On the basis of test results, some scholars propose to use two parameters, tensile strength and elongation, to characterize the aging degree of XLPE cables [14]. In this paper, the changing law of tensile strength and breaking elongation of samples after each aging process was assessed by tensile testing. The test methods of tensile testing are as follows.
The tensile strength and breaking elongation of samples were inspected using 5KNCMT-4503 from MASTER (a company manufactures measuring apparatus in China). In accordance with IEEE Standard 60811-1-1: 2001 [15], six samples of the same aging time should be cut into a dumbbell, with a width of 4 cm. In addition, the tensile strength and breaking elongation of samples can be calculated according to Equations (3) and (4).
σ = P A = P b d
where σ is the tensile strength, N/mm2; P is the tensile force at fracture, N; A is the initial cross-sectional area, mm2; b is the width of samples, mm; d is the thickness of samples, mm.
δ = Δ l l 0 = l l 0 l 0
where δ is the breaking elongation of samples; Δl is the increment of samples elongating at break, mm; l is the length between two marking lines at break, mm; l0 is the length of initial two marking lines, l0 = 20 mm.
The test results for tensile strength and breaking elongation of XLPE cables aged for different years are listed in Table 2, and the standard deviation of tensile strength is denoted as aσ along with that of breaking elongation, aδ.
Table 2 presents the following:
(1)
With the increase in aging time, the tensile strength of XLPE cable samples gradually decreases. For samples aged for 2, 3, 5, 6 and 8 years, the tensile strength of samples decreases by 2.68%, 9.53%, 12.25%, 14.54% and 20.02%, respectively, compared with samples aged for 1 year.
(2)
With the increase in aging time, the breaking elongation of XLPE cable samples has an accelerated decreasing trend. For samples aged for 2, 3, 5, 6 and 8 years, the breaking elongation of samples decreases by 1.70%, 7.75%, 14.14%, 18.1% and 27.49%, respectively, compared with samples aged for 1 year.
(3)
Moreover, as results in the previous research have shown, there is a correlation between tensile strength and the physicochemical properties of XLPE cables [14]. The reasons for the changing law of tensile strength and breaking elongation are that the crystallinity of samples decreases with the increase in aging time, as mentioned in Section 2.1.2, which, in turn, results in a more chaotic arrangement of molecules and more frequent molecular movements.

2.2.2. Hardness Testing

The hardness test is one of the most commonly adopted methods for evaluating the aging degree of polymers with different aging times. In this paper, a Shore A durometer was used to analyze the hardness of three samples with the same aging time. The test methods for hardness are as follows.
Six points, denoted as a-f, were measured to ensure the accuracy of the test results. The average hardness of six points, denoted as A, was obtained for comparing the hardness among samples aged for different years, and the standard deviation of results was denoted as aA.
The hardness test results are listed in Table 3.
According to the obtained results (Table 3), with the increase in aging time, the hardness of samples gradually increases. For samples aged for 3.5 and 8 years, the hardness increases by 1.12% and 8.57%, respectively, compared with samples aged for 1 year. The reasons for this phenomenon are that thermal oxygen aging and thermal decomposition reactions occur when XLPE cables are operating in a thermal aging environment for a long time, which results in the breaking of polymer chains and the failure of the global cross-linking network. In this case, small molecules in the material are re-cross-linked, along with the hardness of the samples increasing.

2.3. Electrical Properties

2.3.1. Dielectric Frequency Spectrum Test

Dielectric frequency spectrum testing can comprehensively reflect the electrical properties of the dielectric parameters, including polarization performance and loss performance. In this paper, the dielectric parameters, including complex dielectric permittivity (denoted as ε) and dielectric loss (denoted as tan δ), of cross-linked polyethylene samples at different frequencies were measured by a broadband dielectric spectra scanner.
An Alpha-A concept 80 broadband dielectric spectra scanner from Novecontrol Technologies was employed to measure the dielectric parameters. The measurement temperature was 20 °C, and the measurement frequency was set from 10−2 Hz to 106 Hz.
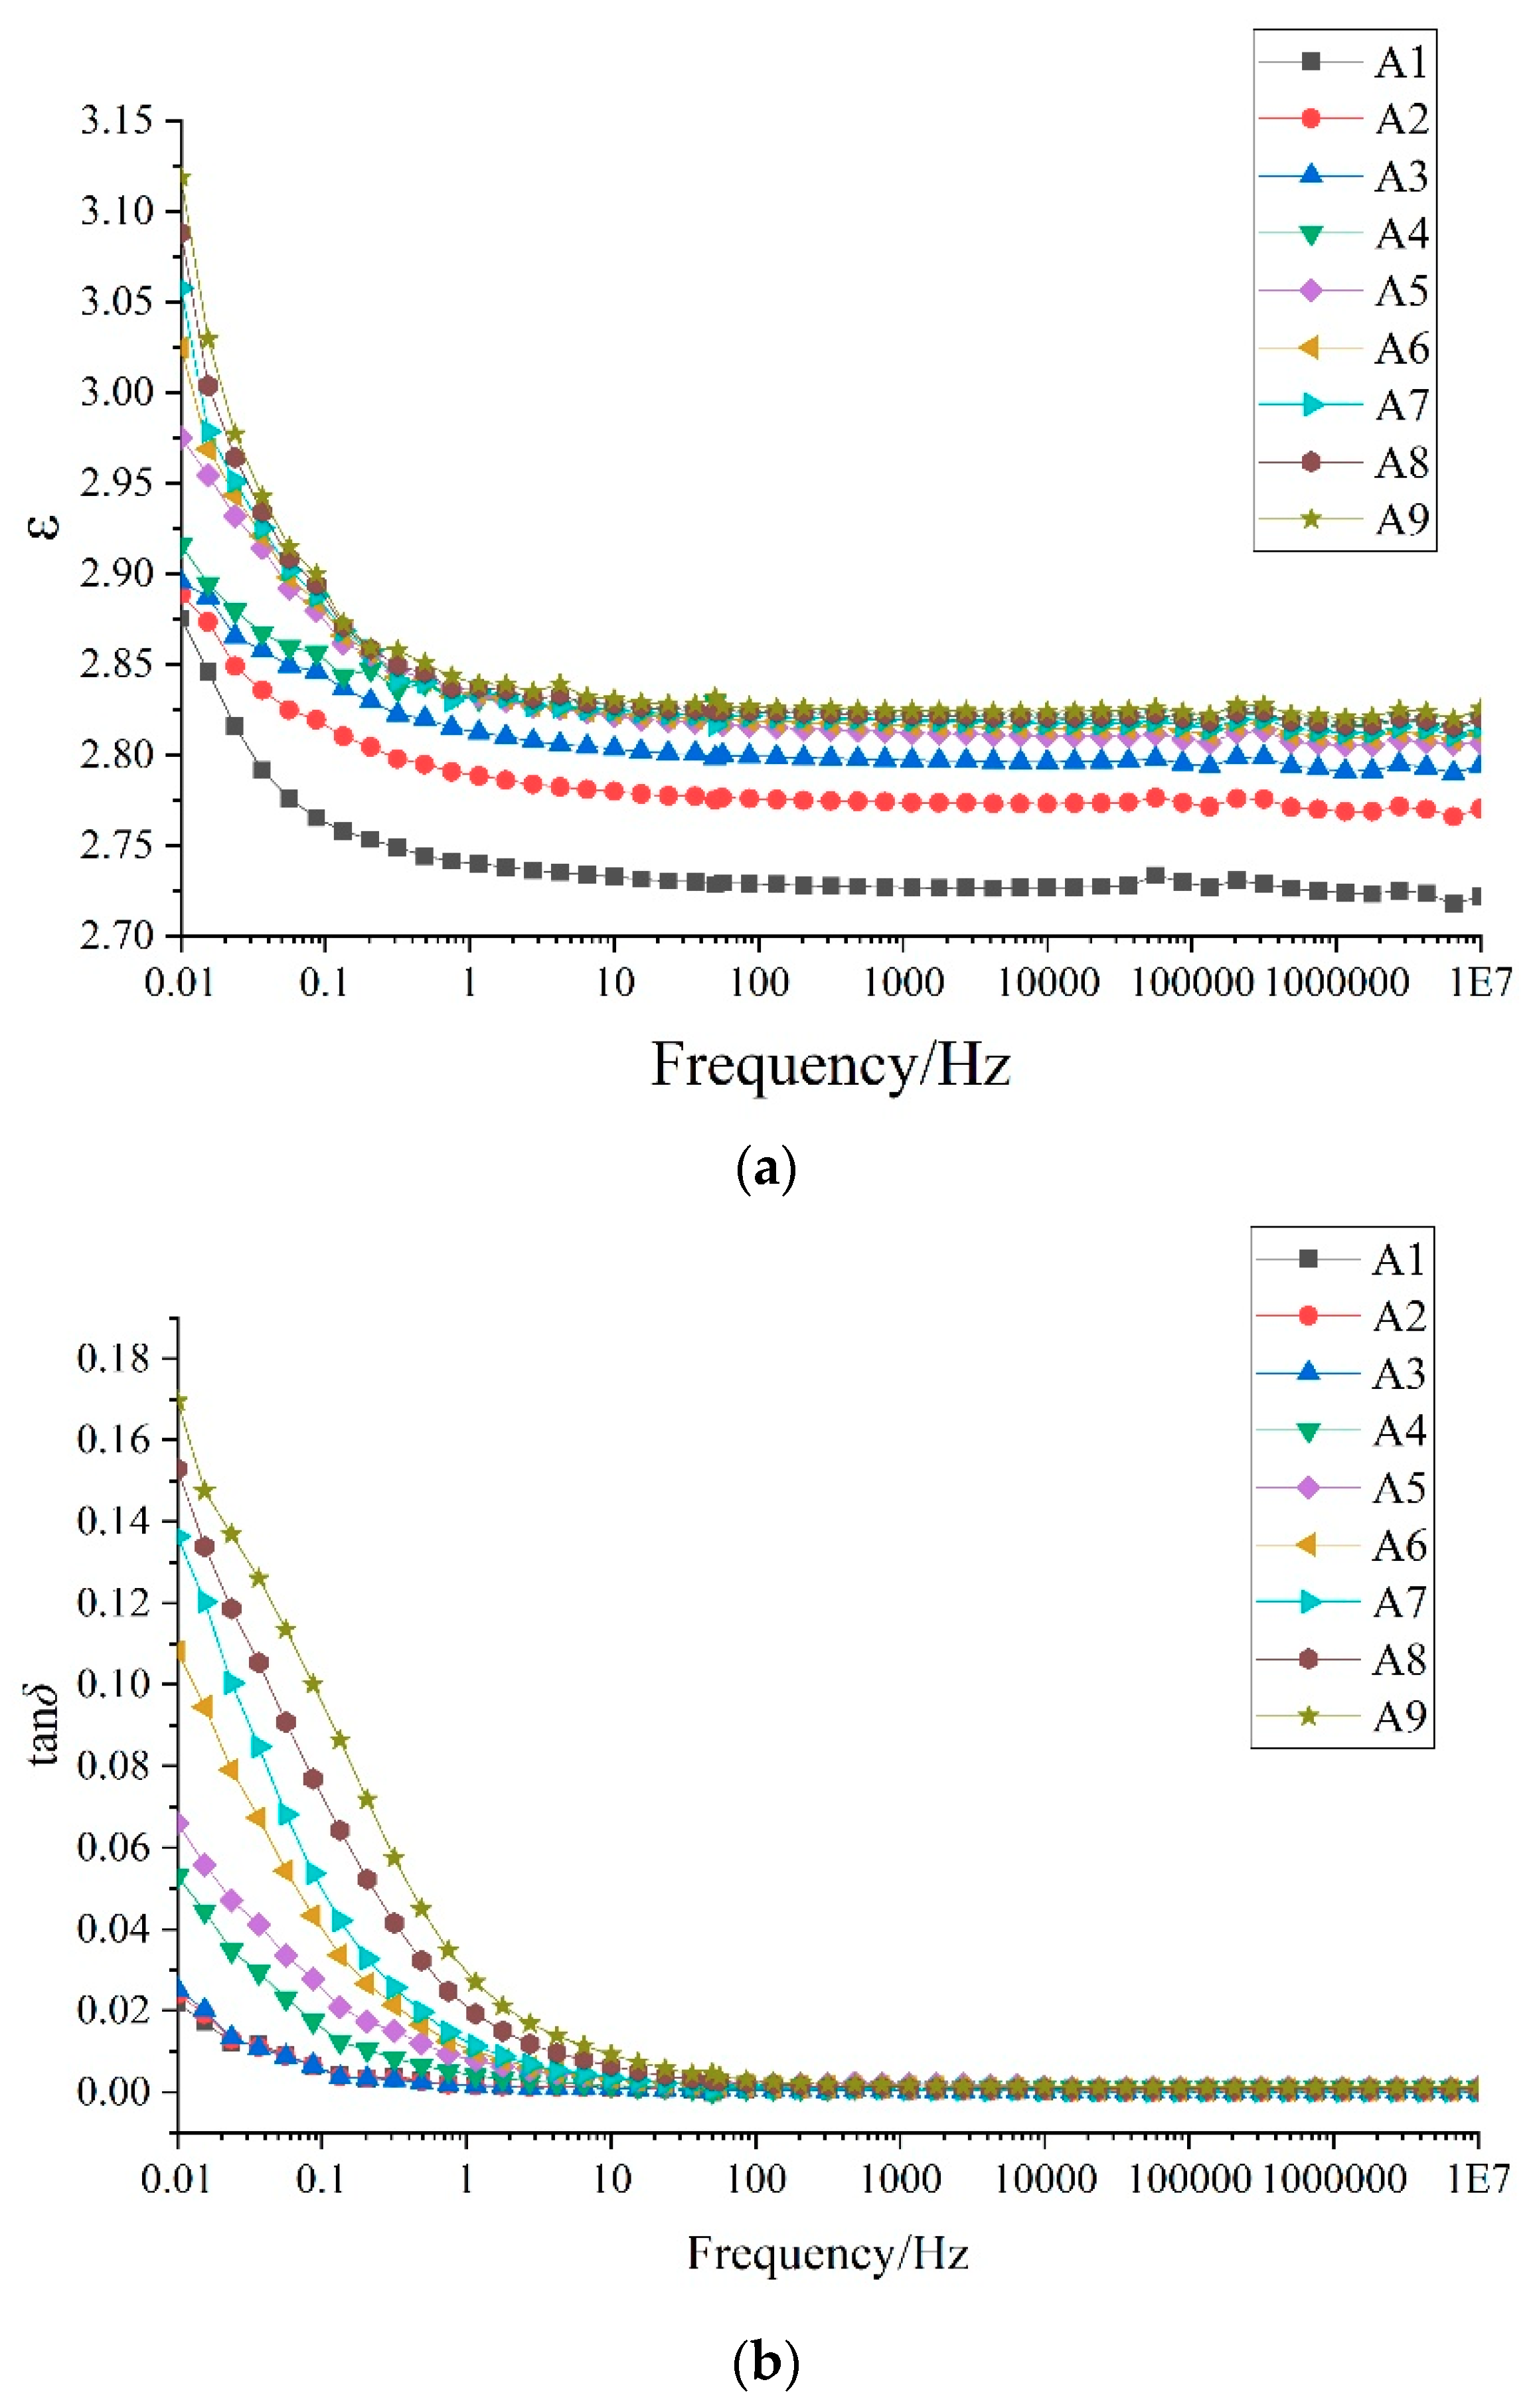
The results of dielectric parameters, including the complex dielectric permittivity ε and dielectric loss tan δ of samples with different aging times, are shown in Figure 3. Moreover, as IEEE Standard 400.2-2013 [16] presented that the dielectric parameter at 0.1 Hz can characterize electrical properties best, the specific dielectric values of the samples at a typical frequency point of 0.1 Hz are listed in Table 4.
According to the results obtained in Figure 3 and Table 4, both the dielectric permittivity ε and dielectric loss tan δ increase with the increase in operating time. To be specific, for samples aged for 2, 3, 6 and 8 years, the complex dielectric permittivity ε at 0.1 Hz increases by 1.92%, 3.19%, 4.20% and 4.49%, respectively, compared with samples aged for 1 year, and the dielectric loss tan δ increases by 0.01, 1.92, 8.4 and 17.31 times, respectively, compared with samples aged for 1 year. The reason for this may be that as the operating time increases, more macromolecular chains fracture and more polar impurities and defects appear in the material under oxidation reactions and thermal decomposition reactions, which, in turn, result in more free charge carriers gathering at the interface and defects. This will lead to an increase in interface polarization loss, along with an increase in dielectric permittivity ε and dielectric loss tan δ.

2.3.2. Dielectric AC Breakdown Test

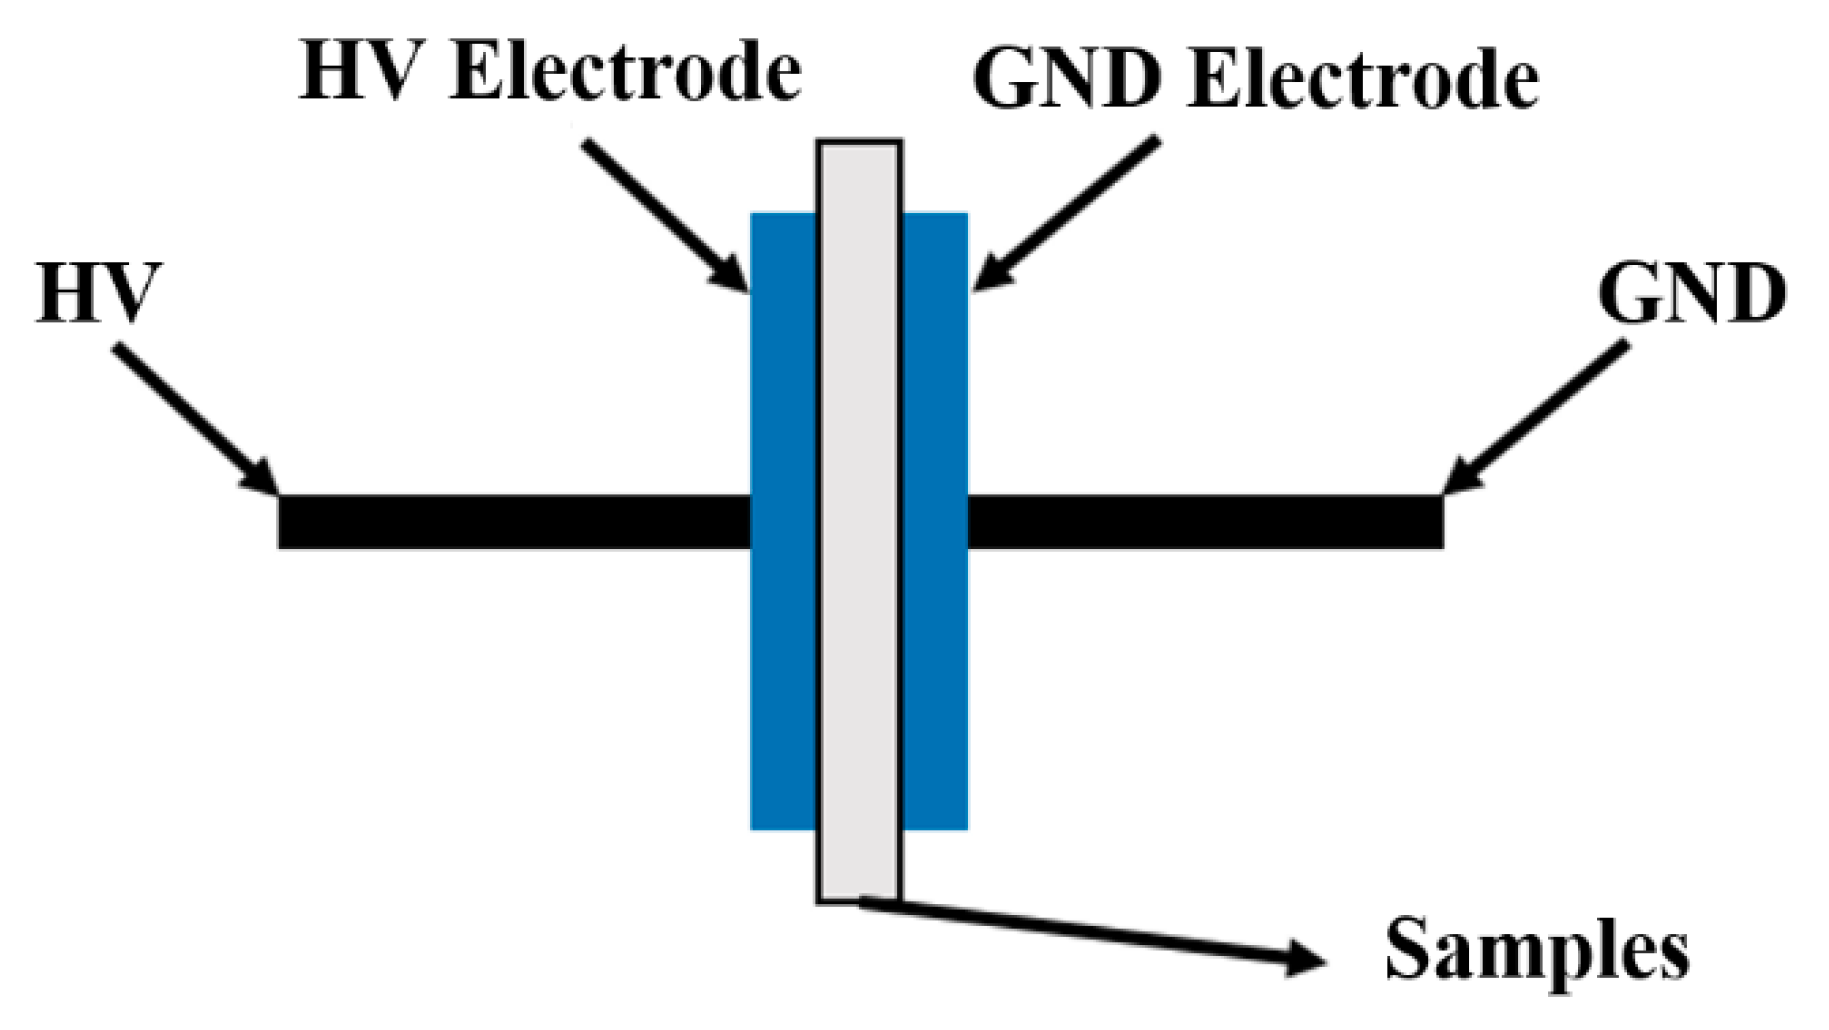
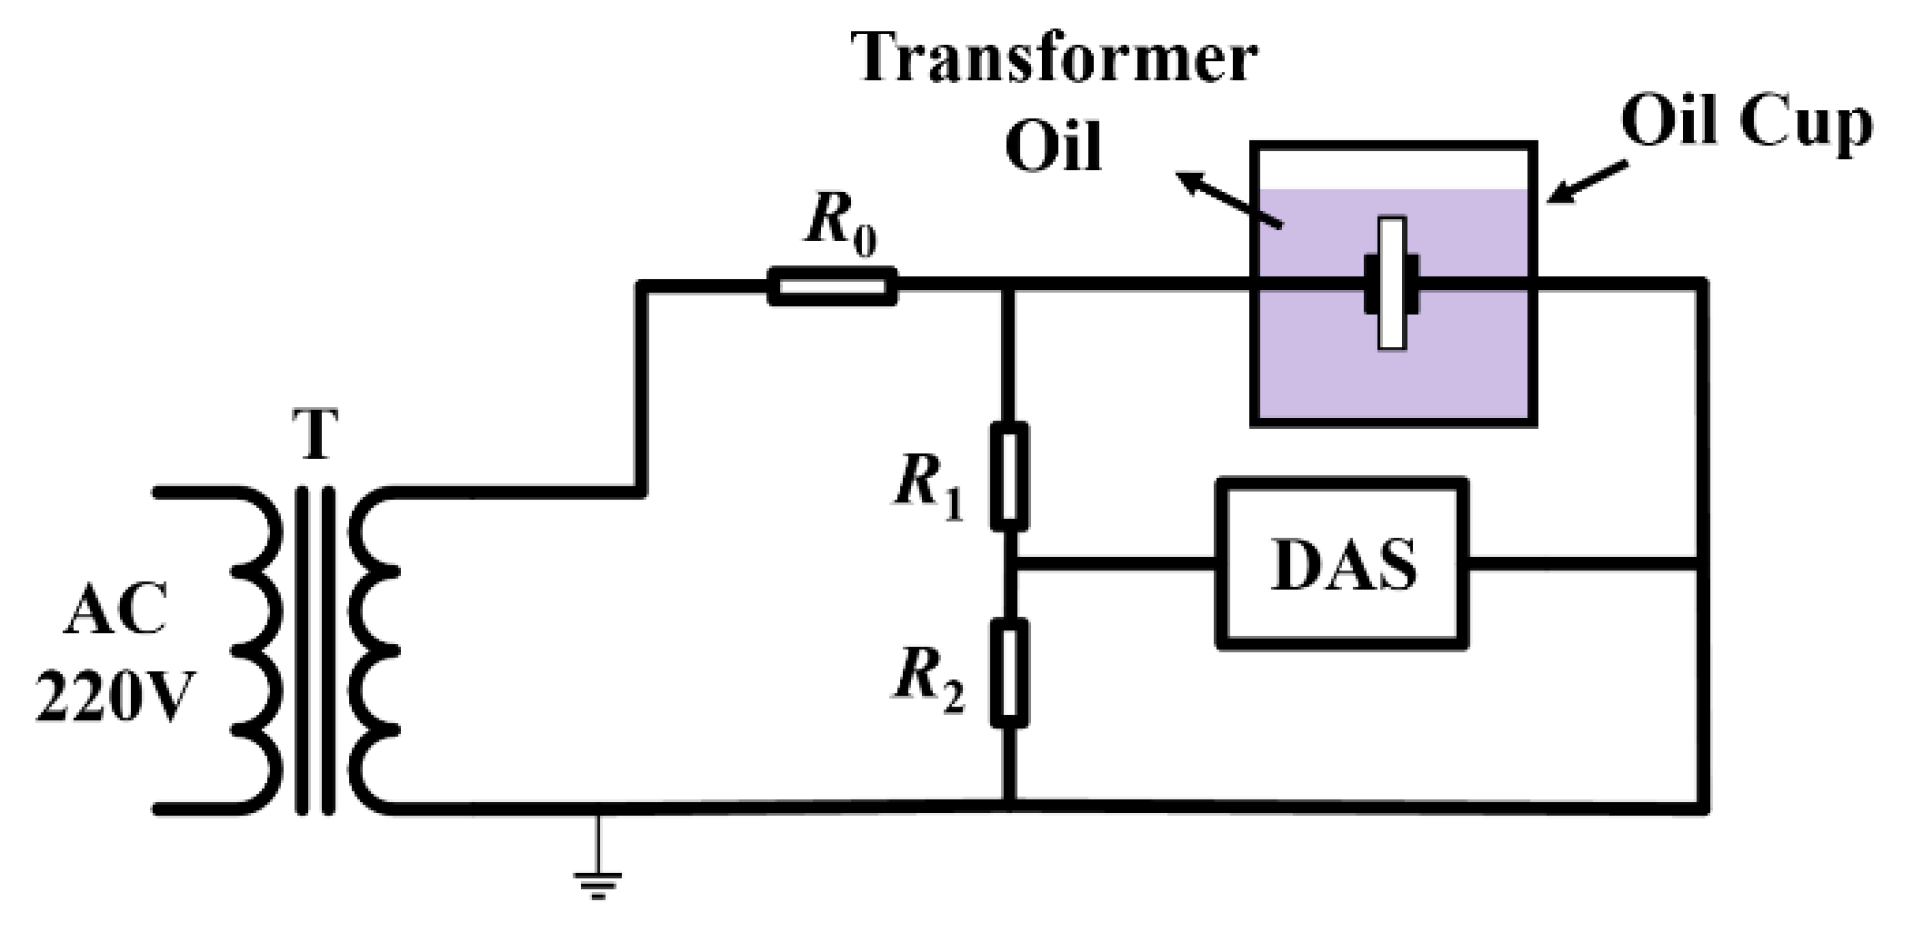
According to previous research, dielectric AC breakdown voltage is one of the most important parameters for investigating the electrical strength of XLPE cables. In this paper, the test power was provided by a TQSB 3 kVA/50 kV AC transformer, which can meet the power requirements for the AC breakdown test. Six samples with the same operating time were cut into square shapes with a size of 2 cm × 2 cm. Moreover, the sample placed between the high-voltage electrode and ground electrode is shown in Figure 4 and flashover is produced between two electrodes. The wiring diagram of the test principle is shown in Figure 5.
In Figure 5, T is the AC transformer, R0 is a current-limiting resistor, R1, R2 are resistors of the resistor divider D (500:1), DAS (an intelligent device system which can measure voltage) is the voltage measuring system.
Before the test, all samples were cleaned with anhydrous ethanol and water carefully, and then left to dry indoors for 24 h to avoid dust.
According to GB/T 1048.1-2006, all samples and electrodes were soaked in transformer oil (#25). When testing, the uniform boosting method was adopted, where the applied voltage increases by 1 kV/s uniformly until breakdown occurs. To enhance the accuracy of the test results, six pieces of samples with the same operating time were selected, and the average value of the breakdown voltage was obtained to analyze the changes in the electrical properties through the aging process. The average breakdown strength can be obtained as follows:
E b = ( i = 1 m U b i d i ) / m
where Ubi is the breakdown voltage for ith sample, kV; di is the thickness for ith sample, mm; m is total number of tests, m = 6; Eb is the average breakdown strength of samples, kV/mm.
The test results for the dielectric AC breakdown test for samples with different operating times, along with the standard deviation of results, denoted as aE, are listed in Table 5.
According to the test results obtained in Table 5, with the increase in aging time, the breakdown strength gradually decreases. For samples aged for 3, 6 and 8 years, the breakdown strength decreases by 0.14%, 2.10% and 6.02%, respectively, compared with a sample aged for 1 year. The reason may be that, as the operating time increases, interface polarization loss of samples increases, as mentioned in Section 2.3.2, which would lead to an increase in the insulation resistivity of the sample. In this case, the breakdown strength of samples decreases as the operating time increases.

3. Lifespan Prediction Method

The details for proposing a lifespan prediction method to determine the operating time of XLPE cables are described in this section, including an analysis of the relative parameters for lifespan prediction and the prediction method for the operating time of XLPE cables.

3.1. Analysis of Relative Parameters for Lifespan Prediction

According to the test results obtained in Section 2, some corresponding parameters which can be used for predicting the lifespan of XLPE cables were studied, as listed in Table 6.
To obtain parameters significantly correlated with the operating time among the lifespan prediction parameters in Table 6, the Pearson correlation analysis method, a statistical method, was employed and the correlation coefficient r was utilized to preliminarily analyze the correlation between each lifespan prediction parameter and the operating year [17].
r = i = 1 n ( x i x ¯ ) ( t i t ¯ ) i = 1 n ( x i x ¯ ) 2 i = 1 n ( t i t ¯ ) 2
where xi is the lifespan prediction parameters of ith sample; ti is the operating time of the ith sample; x ¯ is the mean value of lifespan prediction parameters; t ¯ is the mean value of operating time.
A T-test was employed to verify the significance of the correlation coefficient r of samples and the results of the T-test were denoted as α. The calculation is expressed in Equation (7).
T = r n 2 1 r 2 t ( n 2 )
In Equation (7), if the significance value α is less than 0.05, it indicates that there is a certain correlation between two variables; if α is larger than 0.01, it indicates that there is a significant correlation between two variables. The test results are listed in Table 7.
Table 7 shows that parameters including the gel content Cge, the crystallinity XC, tensile strength σ, ultimate elongation δ, the dielectric permittivity ε and the dielectric loss Jtan are significantly correlated with the operating time, which can be used to evaluate the aging degree of XLPE cables and propose a lifespan prediction method to determine the operating time of XLPE cables. Moreover, parameters, including the hardness A and the average breakdown strength Eb, are correlated with operating time. On this basis, these parameters can be used as auxiliary indices in evaluating the aging effects on XLPE cables.

3.2. Prediction Method for Aging Time of XLPE Cables

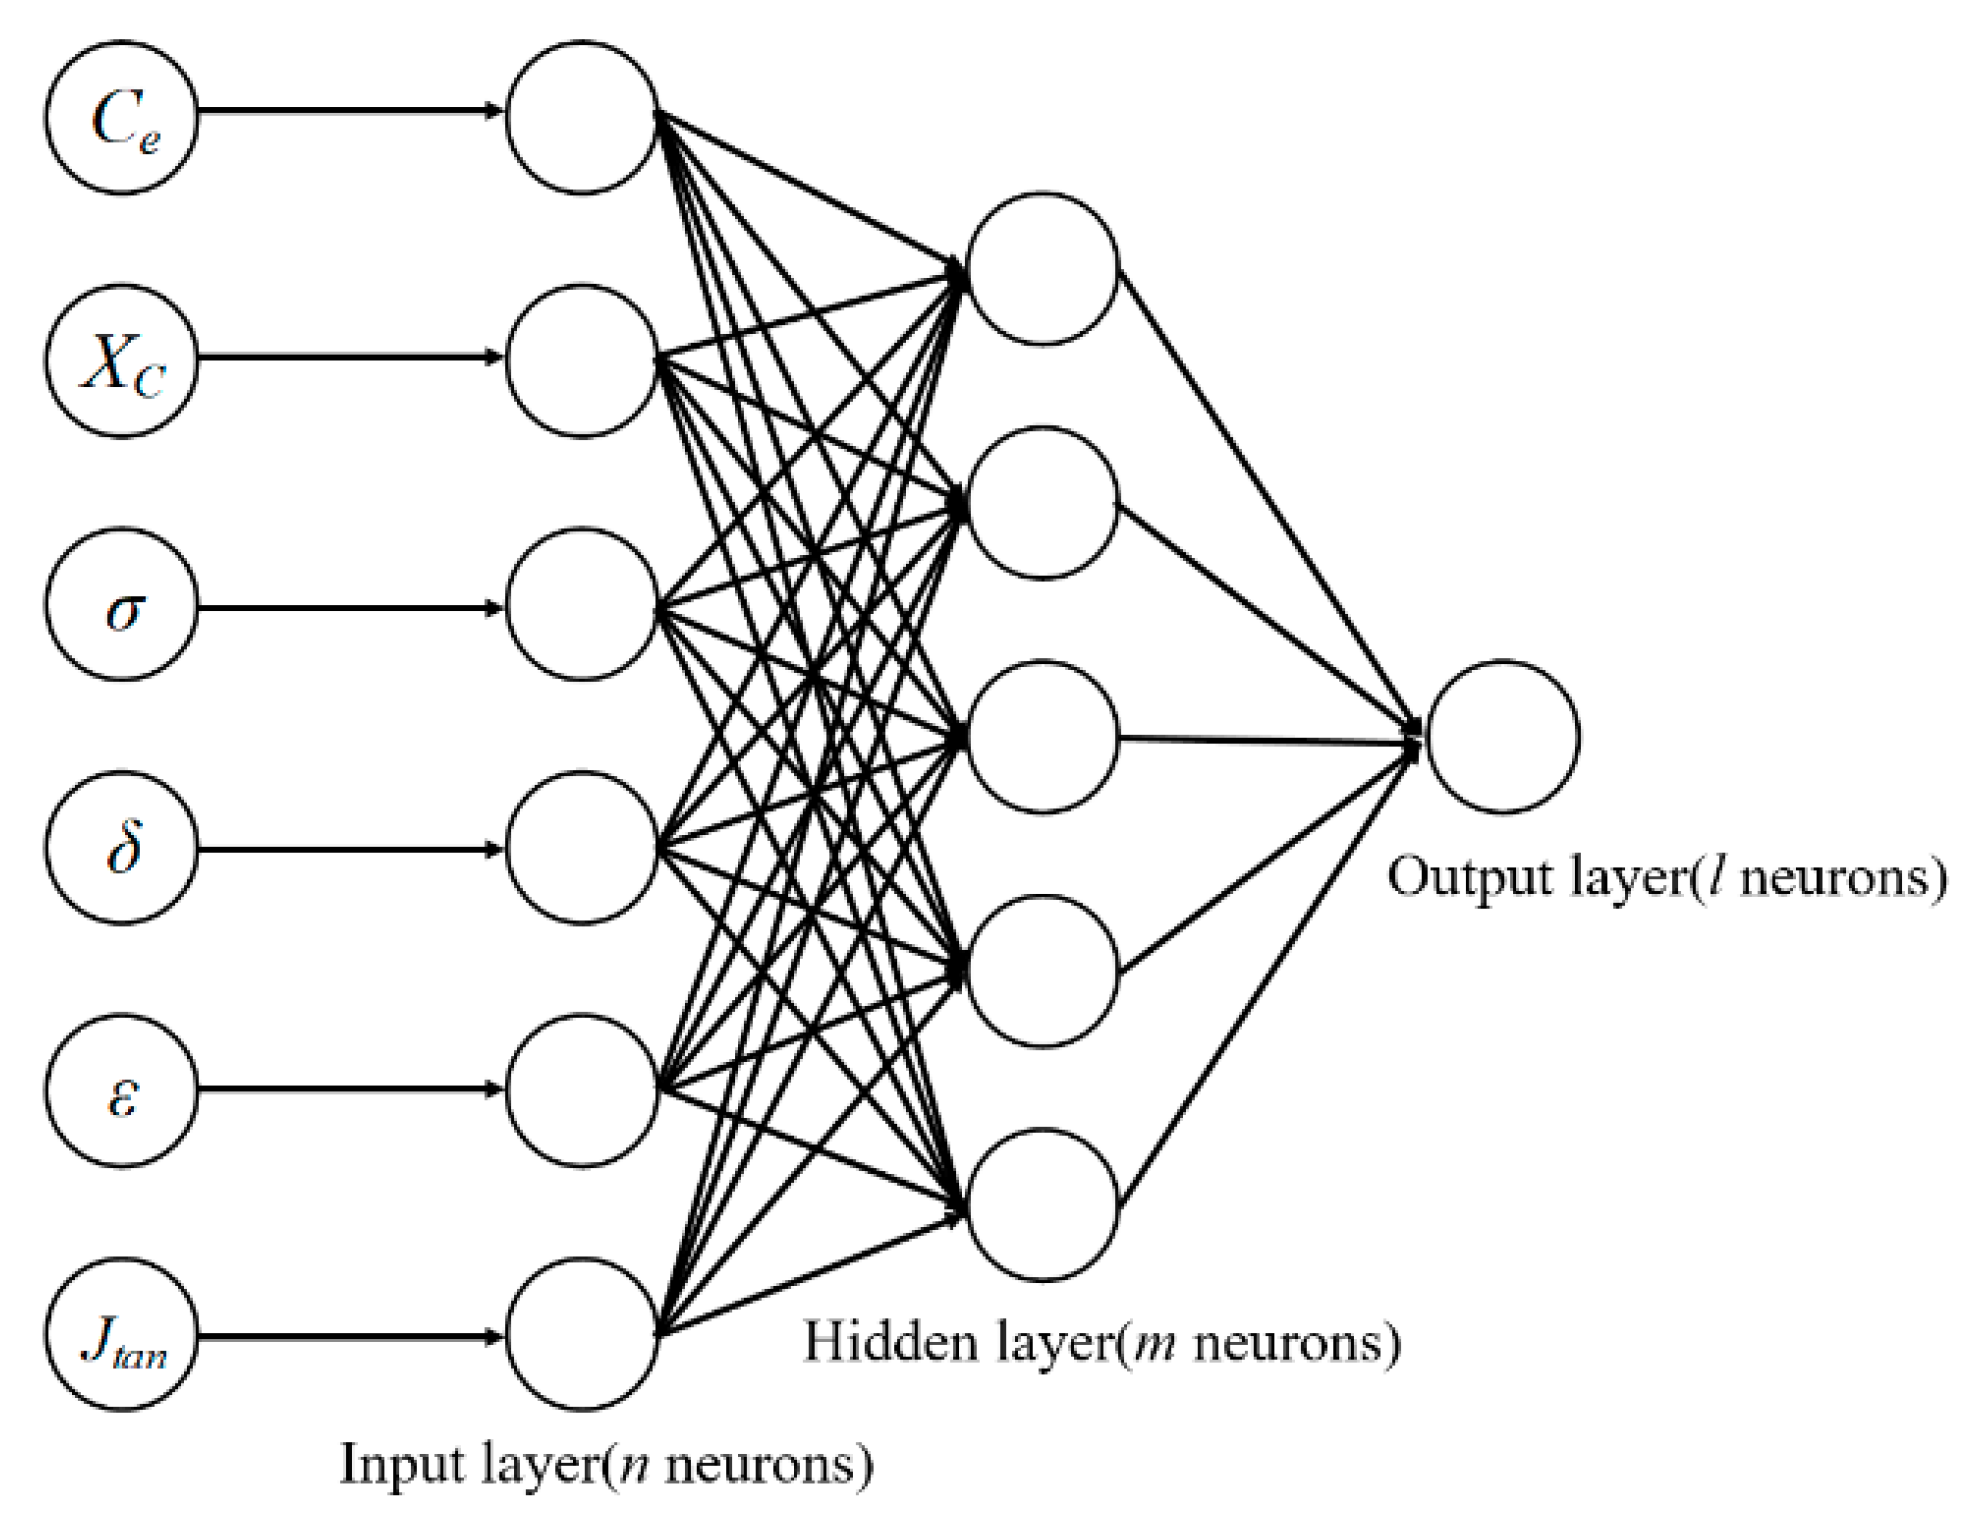
Due to the multi-dimensional and non-linear relation between the lifespan prediction parameters and the operating time of XLPE cables, there are some deviations in using a traditional simplified statistical method to characterize the aging degree and predict the lifespan of XLPE cables compared with the actual results. A BP neural network, a system with self-learning, self-organization and self-adaptive ability, can be used to obtain the implied relationship between input and output data through learning and training the input and output data in its network model [18]. In this case, a BP neural network was employed in this paper to establish the multi-dimensional nonlinear relationship between four lifespan prediction parameters obtained in Section 3.1 and the operating time. The structure of the BP neural network in this paper is shown in Figure 6.
In Figure 6, there are n neurons in the input layer of the BP neural network, m neurons in the hidden layer and l neurons in the output layer. Based on [19], the best number for the neurons in the hidden layer should maintain the following Equation (8):
m < n + l + a
where n is the number of neurons in the input layer; l is the number of neurons in the output layer; m is the number of neurons in the hidden layer; a is a constant between 0 and 10.
This paper employed four parameters including the gel content Cge, the crystallinity XC, tensile strength σ, ultimate elongation δ, the dielectric permittivity ε and the dielectric loss Jtan, which are significantly correlated with the operating time, as the input neurons, while the operating time is the output neuron. Thus, the number of neurons in the hidden layer is five. Moreover, the goal of error is set as 10−8.
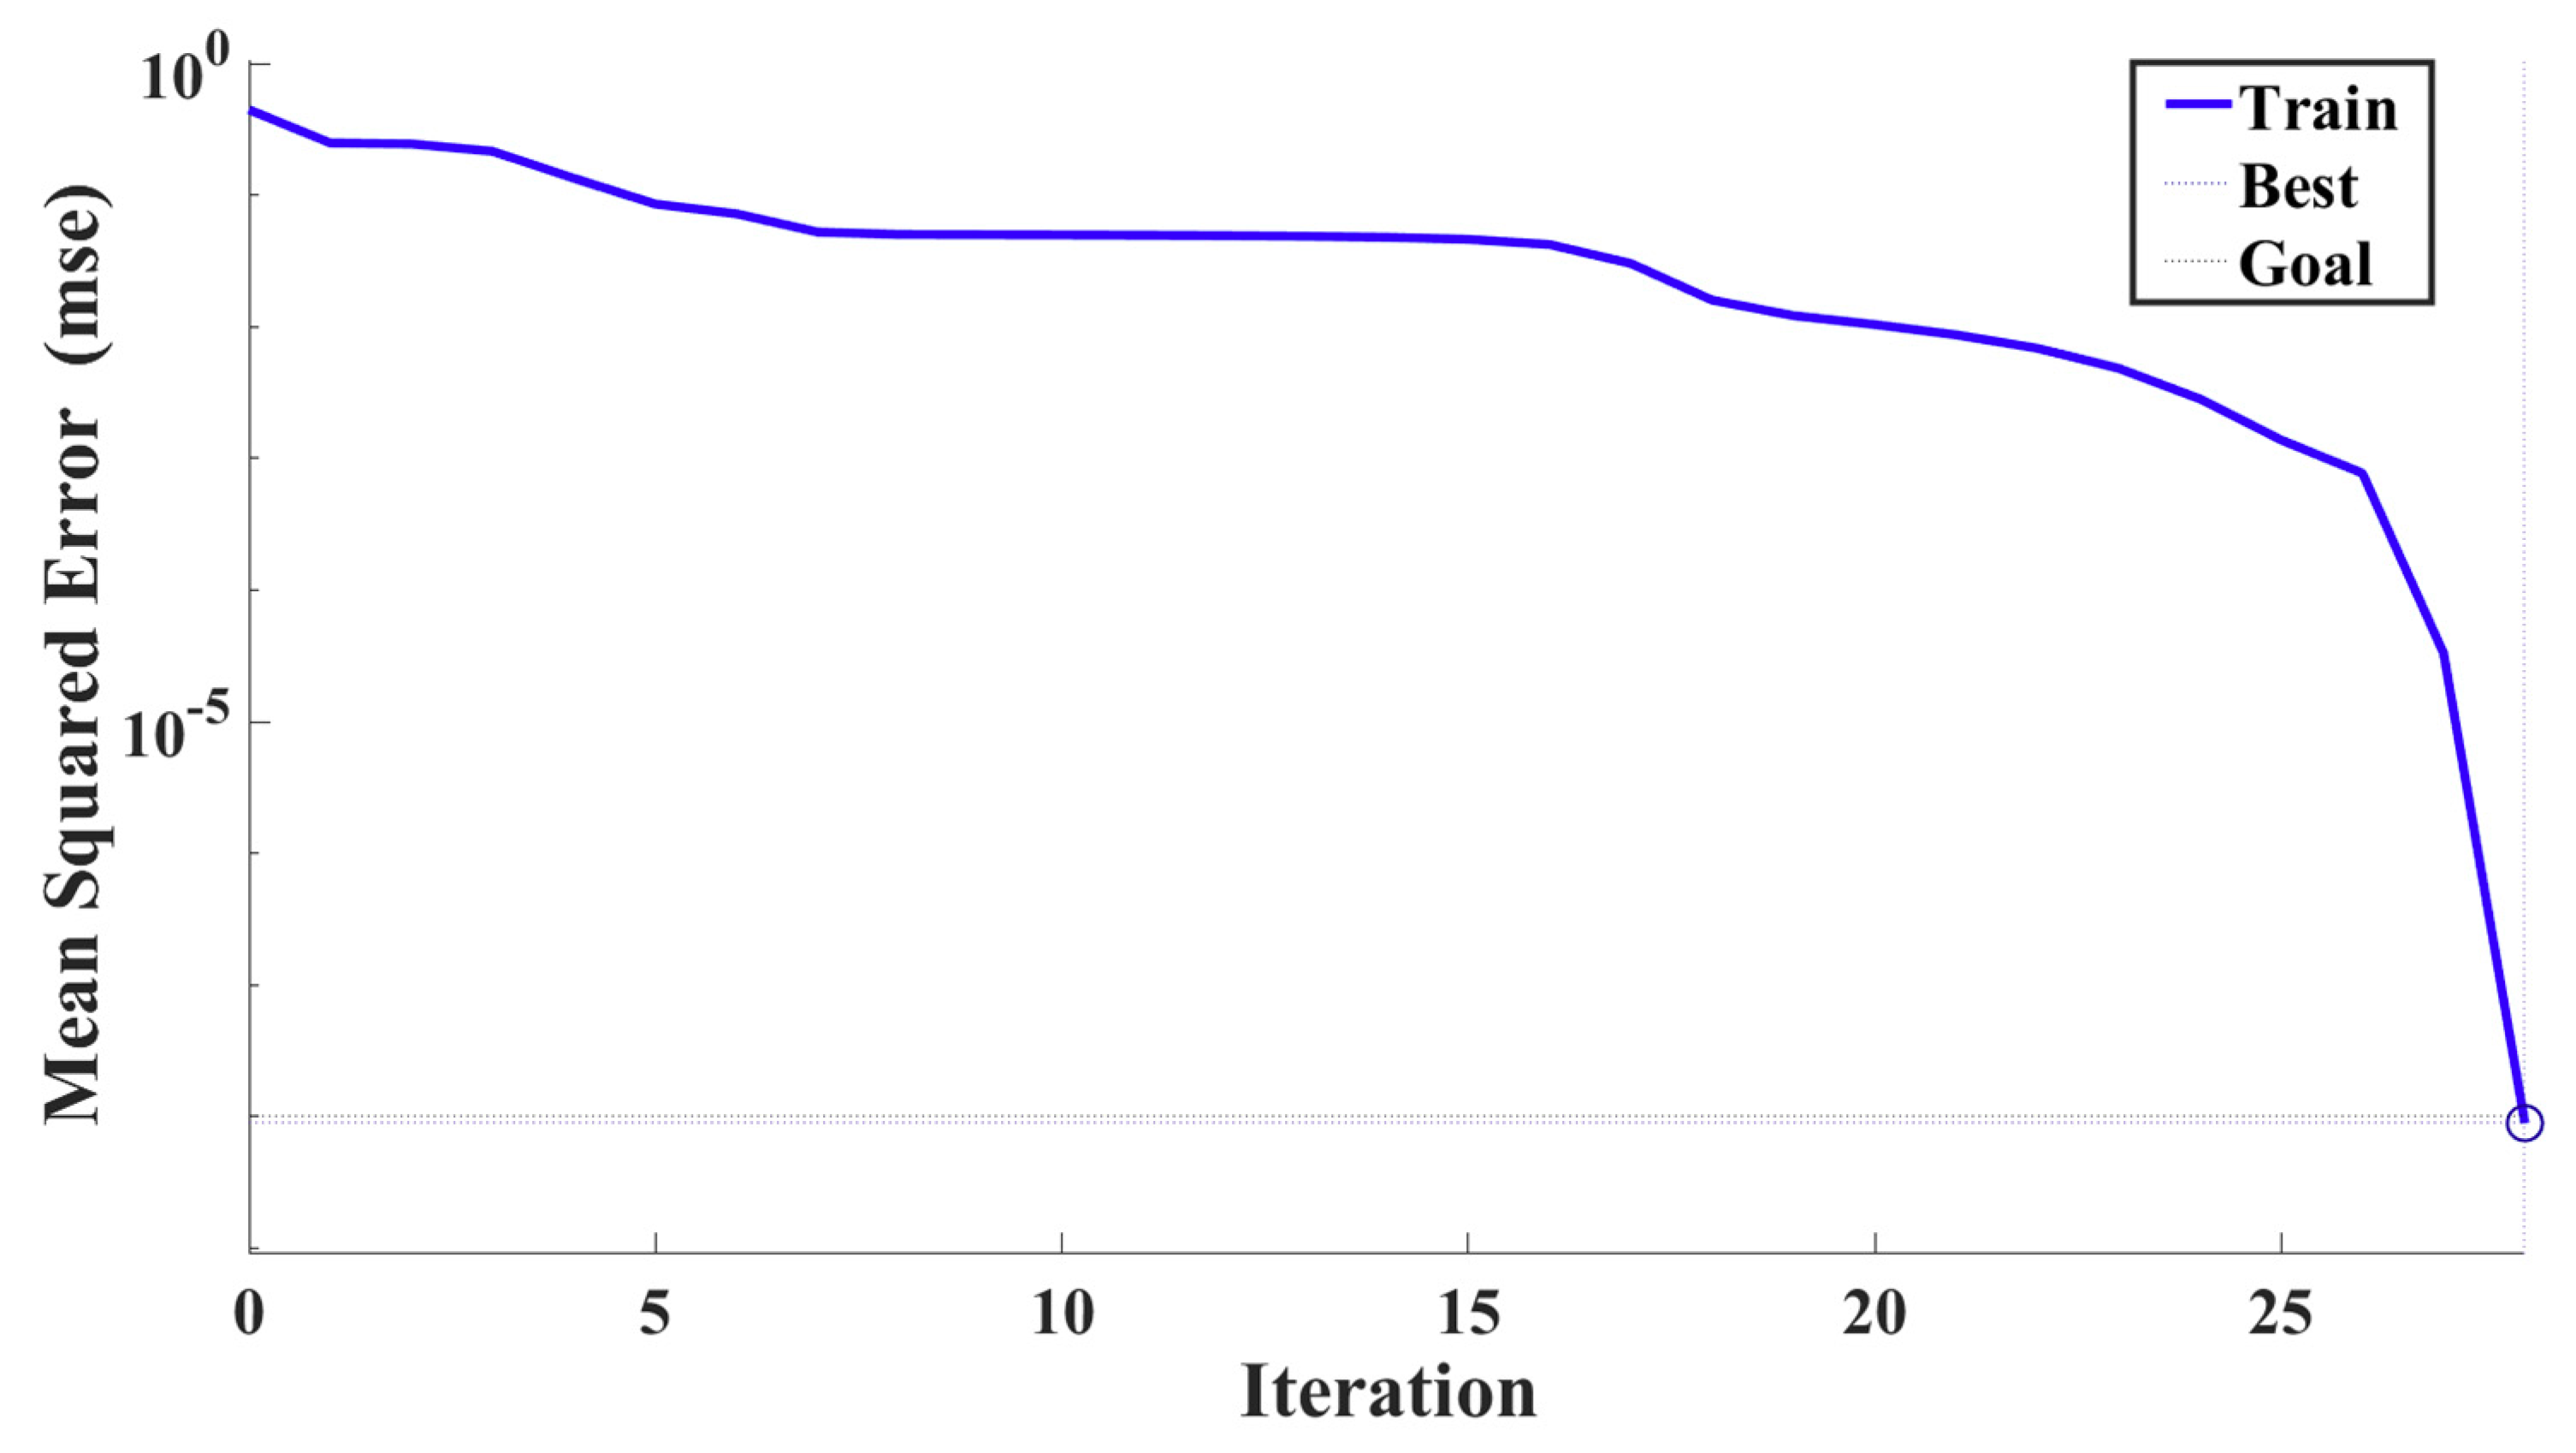
In this paper, XLPE cables aged for 1–7 years were employed as training samples in a BP neural network, along with samples aged for 8 years as testing samples. The error changes during training are shown in Figure 7.
In Figure 7, the iterative process can be divided into two ranges (0–26 iterations and 26–28 iterations). In the 0–26 iterations range, there are tiny changes occurring in the mean squared error of the predicted operating time of XLPE cables in the iterative calculation. When the iteration step reaches 26 iterations, the decreasing rate of the mean squared error gradually accelerates. At 28 iterations, the mean squared error reaches the stop trigger condition and the computation of the BP neural network is completed, which indicates that an equivalent relationship between the significantly correlated parameters and the operating time has been established.
In this paper, σ1 is defined as the relative error between the predicted aging time (denoted as a1) and actual aging time (denoted as a). The results of a1, a and σ1 in samples aged for 8 years are shown in Table 8.
According to the results obtained in Table 8, the error between the actual operating time and the predicted operating time is less than 5%, which is within the allowable error range of engineering practice. In future research, the method proposed in this paper can be used for predicting the operating time of XLPE cables from Factory A.

4. Conclusions

In this paper, the changing law of lifespan prediction parameters, corresponding with the operating time of XLPE cables, was investigated by widely accepted methods. On this basis, some parameters that significantly correlated with the operating time were obtained. Finally, a method based on a BP neural network for determining the operating time of XLPE cables was proposed. The main conclusions are as follows:
(1)
With the increase in operating time, some macro and micro changes in the cross-linked polyethylene material are noticed. Under a high temperature and strong electrical fields, chemical bonds break gradually, which leads to an increase in the content of micromolecules along with polar impurities and defects. In this case, the gel content and crystallinity of samples decrease with the increase in operating time, which, in turn, leads to a decrease in the lifespan prediction parameters, including the tensile strength, the breaking elongation, the dielectric permittivity, the dielectric loss and the breakdown strength, along with the hardness of samples.
(2)
Through the correlation calculation between lifespan parameters and operating time, it turns out that the parameters, including the gel content Cge, the crystallinity XC, tensile strength σ, ultimate elongation δ, the dielectric permittivity ε and the dielectric loss Jtan, are significantly correlated with the operating time, which can be used to evaluate the aging degree of XLPE cables and propose a lifespan prediction method to determine the operating time of XLPE cables. Moreover, the lifespan prediction parameters, including the hardness A and the average breakdown strength Eb, are correlated with the operating time. On this basis, these parameters can be used as auxiliary indices in evaluating the aging effects of XLPE cables.
(3)
Due to the high accuracy of the experimental verification, it turns out that the lifespan prediction method proposed in this paper can be used to determine the operating time of XLPE cables from Factory A in future research.

Author Contributions

The authors gratefully acknowledge the contributions as following: Y.Z., Z.W., C.Q., X.T., J.Y. and L.Z. conceived and designed the experiments; Y.Z. performed the experiments, analyzed the data and wrote the paper. All authors have read and agreed to the published version of the manuscript.

Funding

This work was supported by the National Natural Science Foundation of China (No. 51907029). The authors thank all members of the high voltage research team in Southeast University for their hard work in helping us to obtain the experimental data in this paper.

Conflicts of Interest

The authors declare no conflict of interest.

References

  1. Garros, B. Ageing and reliability testing and monitoring of power cables: Diagnosis for insulation systems: The ARTEMIS program. IEEE Electr. Insul. Mag. 1999, 15, 10–12. [Google Scholar] [CrossRef]
  2. Tzimas, A.; Fu, M.; Dissado, L.; Hampton, R. Comparison of XLPE Cable Peelings with Different Electro-Thermal Histories using Endurance Test and Residual Charge Methods. In Proceedings of the 2006 IEEE 8th International Conference on Properties & Applications of Dielectric Materials, Denpasar, Bali, Indonesia, 26–30 June 2006; pp. 293–296. [Google Scholar]
  3. Ohki, Y. Development of XLPE-insulated cable for high-voltage dc submarine transmission line (1). IEEE Electr. Insul. Mag. 2013, 29, 65–67. [Google Scholar] [CrossRef]
  4. Ohki, Y. Development of XLPE-insulated cable for high-voltage dc submarine transmission line (2). IEEE Electr. Insul. Mag. 2013, 29, 85–87. [Google Scholar] [CrossRef]
  5. Hernandez-mejia, J.; Harley, R.; Hampton, N.; Hartlein, R. Characterization of Ageing for MV Power Cables Using Low Frequency Tanδ Diagnostic Measurements. IEEE Trans. Dielectr. Electr. Insul. 2009, 16, 862–870. [Google Scholar] [CrossRef]
  6. Liu, S.; Fifield, L.S.; Bowler, N. Towards aging mechanisms of cross-linked polyethylene (XLPE) cable insulation materials in nuclear power plants. In Proceedings of the 2016 IEEE Conference on Electrical Insulation and Dielectric Phenomena (CEIDP), Toronto, ON, Canada, 17–20 October 2016; Volume 14, pp. 935–938. [Google Scholar]
  7. Kumara, S.; Xu, X.; Hammarström, T.; Ouyang, Y.; Pourrahimi, A.M.; Müller, C.; Serdyuk, Y. Electrical Characterization of a New Crosslinked Copolymer Blend for DC Cable Insulation. Energies 2020, 13, 1434. [Google Scholar] [CrossRef] [Green Version]
  8. Dong, W.; Wang, X.; Jiang, Z.; Tian, B.; Liu, Y.; Yang, J.; Zhou, W. Acetylated SEBS Enhanced DC Insulation Performances of Polyethylene. Polym. Basel 2019, 11, 1033. [Google Scholar] [CrossRef] [PubMed] [Green Version]
  9. Kim, C.; Jiang, P.; Liu, F.; Hyon, S.; Ri, M.-G.; Yu, Y.; Ho, M. Investigation on dielectric breakdown behavior of thermally aged cross-linked polyethylene cable insulation. Polym. Test. 2019, 80, 106045. [Google Scholar] [CrossRef]
  10. Liu, S.; Fifield, L.S. Aging Mechanisms and Nondestructive Aging Indicator of Filled Cross-Linked Polyethylene (XLPE) Exposed to Simultaneous Thermal and Gamma Radiation. In Proceedings of the 18th International Conference on Environmental Degradation of Materials in Nuclear Power Systems—Water Reactors, Boston, MA, USA, 18–22 August 2019; pp. 65–75. [Google Scholar]
  11. Du, B.X.; Han, C.; Li, J.; Li, Z. Effect of voltage stabilizers on the space charge behavior of XLPE for HVDC cable application. IEEE Trans. Dielectr. Electr. Insul. 2019, 26, 34–42. [Google Scholar] [CrossRef]
  12. Gulmine, J.; Akcelrud, L. FTIR characterization of aged XLPE. Polym. Test. 2006, 25, 932–942. [Google Scholar] [CrossRef]
  13. Hedir, A.; Moudoud, M.; Lamrous, O.; Rondot, S.; Jbara, O.; Dony, P. Ultraviolet radiation aging impact on physicochemical properties of crosslinked polyethylene cable insulation. J. Appl. Polym. Sci. 2019, 137, 48575. [Google Scholar] [CrossRef]
  14. Zhang, Y.; Hou, Z.; Wu, K.-N.; Wang, S.; Li, J.; Li, S. Influence of Oxygen Diffusion on Thermal Ageing of Cross-Linked Polyethylene Cable Insulation. Materials 2020, 13, 2056. [Google Scholar] [CrossRef] [PubMed]
  15. Common Test Methods for Insulating and Sheathing Materials of Electric and Optical Cables—Part 1-1: Methods for General Application; IEC Std. 60811-1-1; IEC: Geneva, Switzerland, 2001.
  16. IEEE Guide for Field Testing of Shielded Power Cable Systems Using Very Low Frequency (VLF); IEC Std. 400.2; IEC: Geneva, Switzerland, 2013.
  17. Zhang, Y.; Zhang, Z.; Jiang, X.; Liang, T.; Yang, S. Aging Process Evaluation Method of Silicone Rubber in Composite Insulators in Natural Environmental Experiment Station. IEEE Access 2019, 7, 169734–169744. [Google Scholar] [CrossRef]
  18. Zhang, Y.; Zhang, Z.; Jiang, X. Research on lifespan prediction of composite insulators in high altitude area experiment station. Appl. Sci. 2019, 9, 3364. [Google Scholar] [CrossRef] [Green Version]
  19. Liu, M.; Zhang, M.; Zhao, W.; Song, C.; Wang, D.; Li, Q.; Wang, Z. Prediction of congestion degree for optical networks based on bp artificial neural network. In Proceedings of the 2017 16th International Conference on Optical Communications and Networks (ICOCN), Wuzhen, China, 7–10 August 2017; pp. 1–3. [Google Scholar]
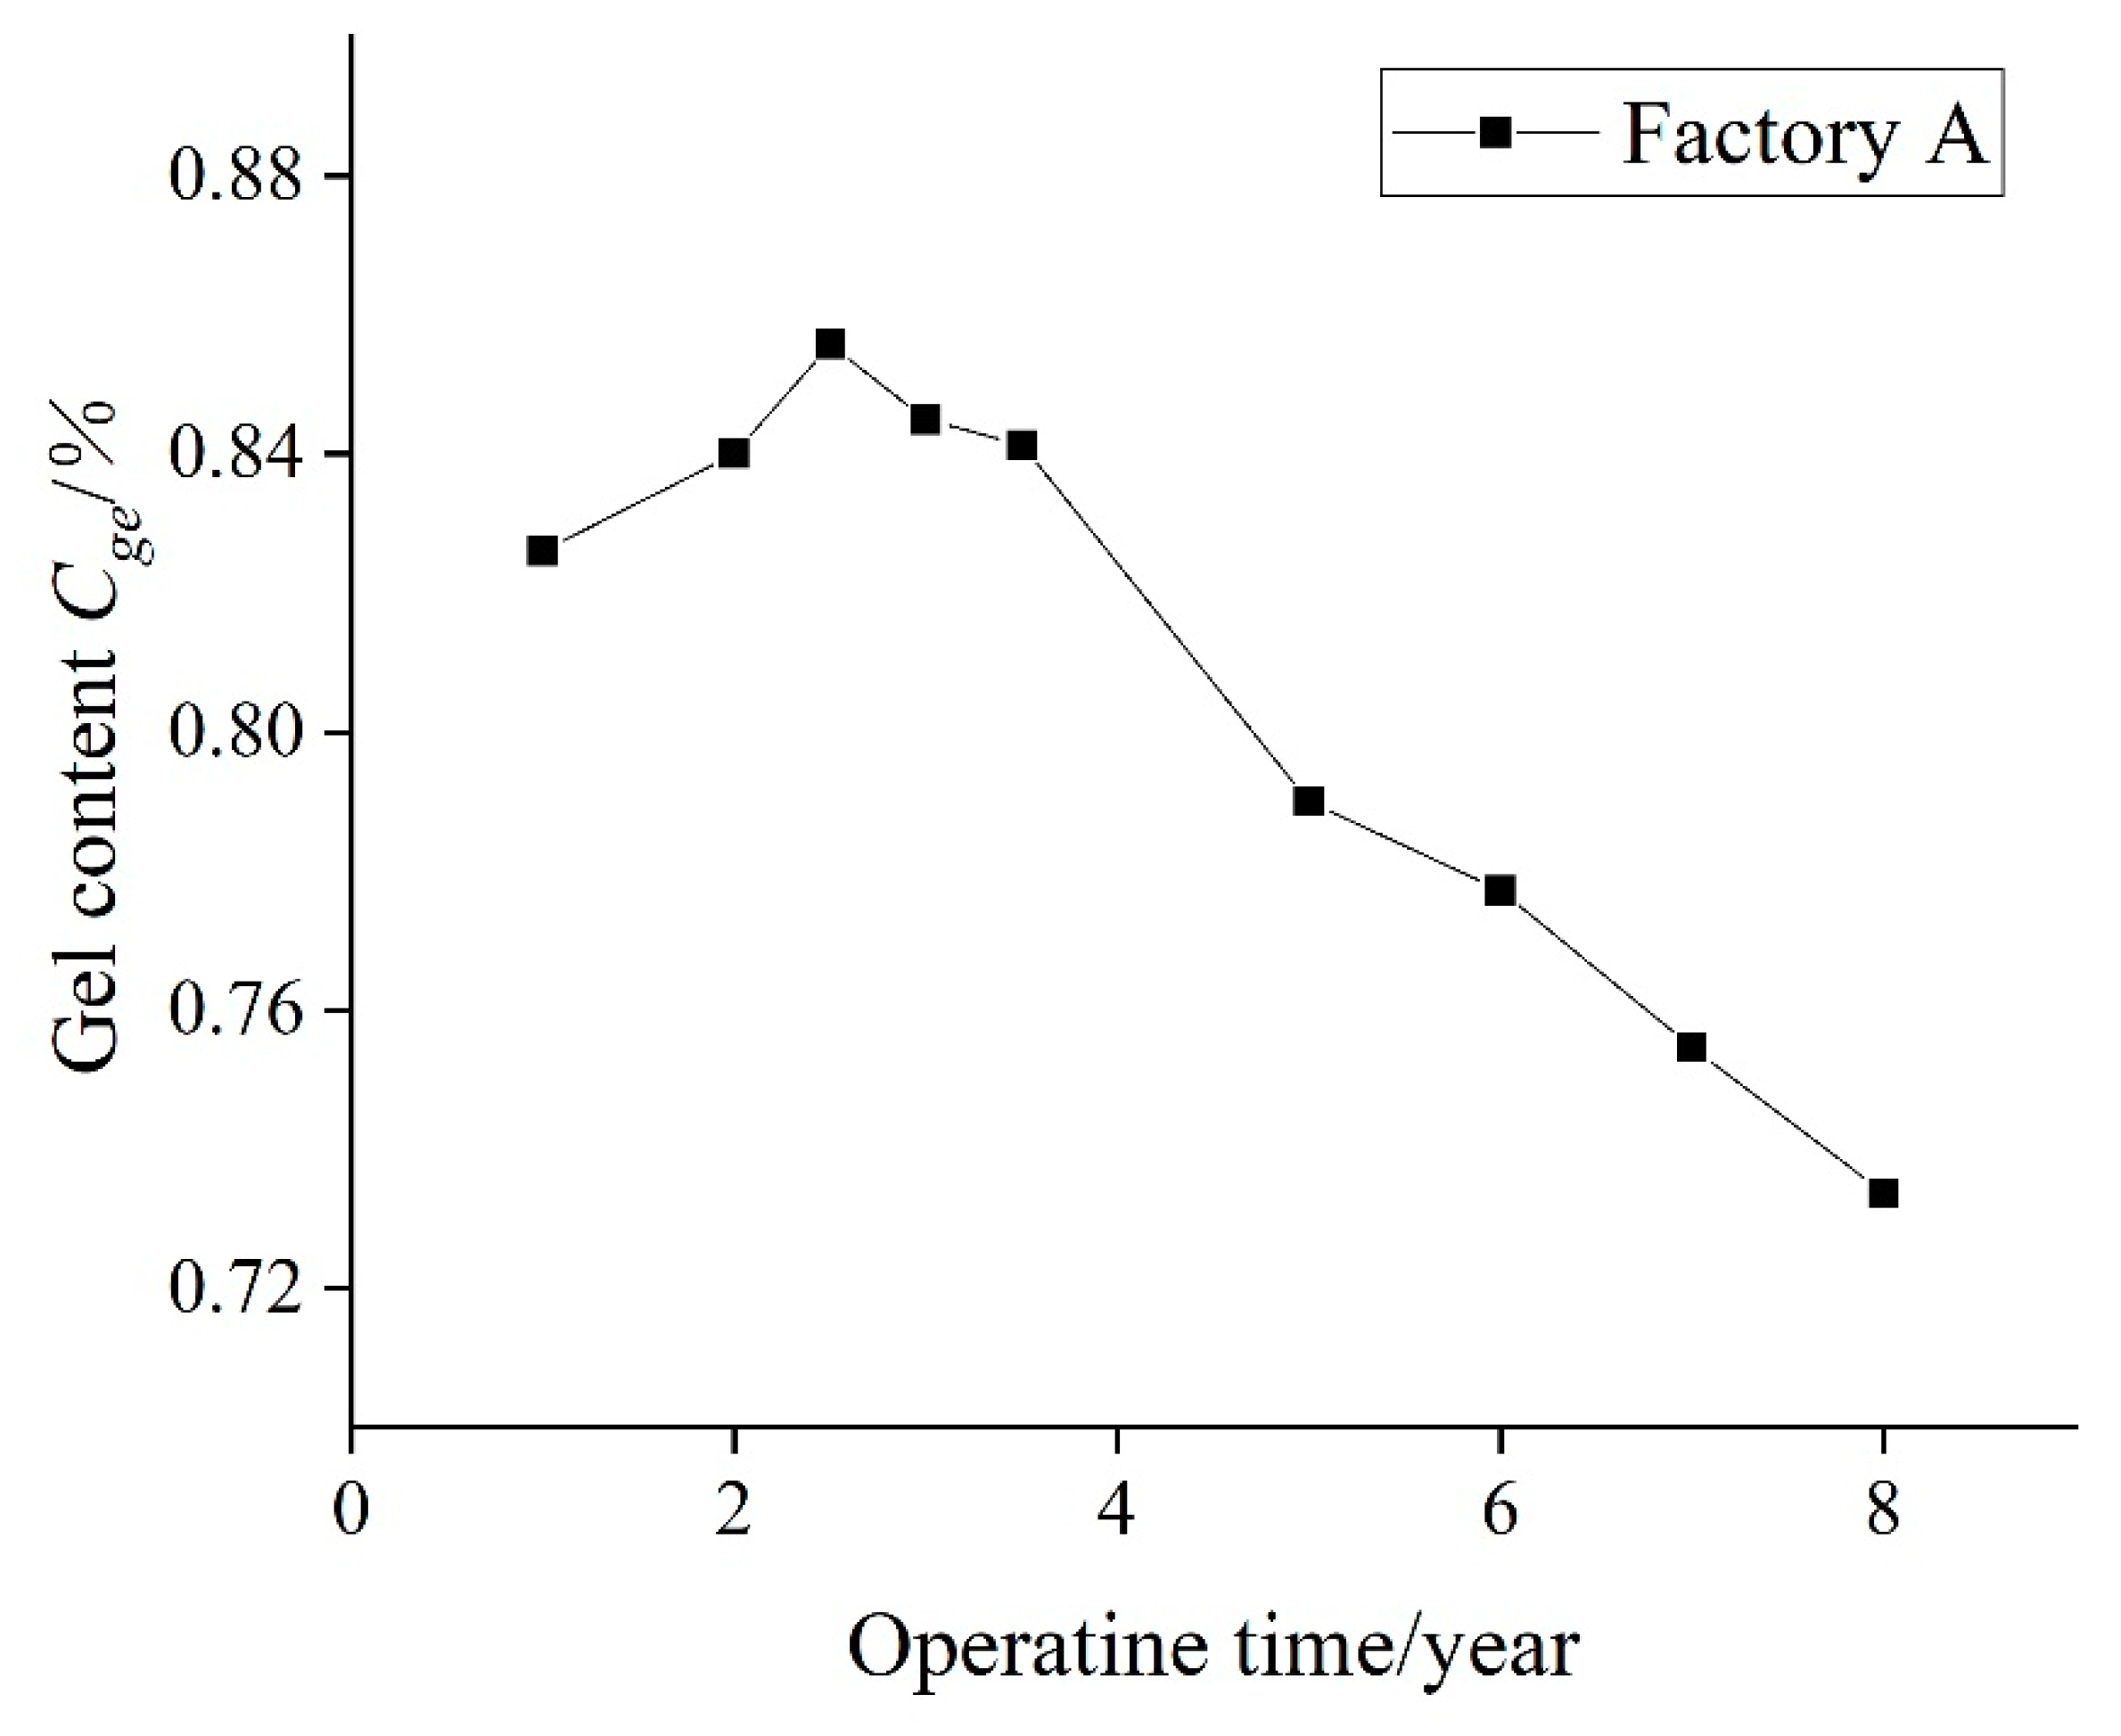
Figure 1. Test results of gel content test.
Applsci 10 05381 g001
Figure 2. Test results of differential scanning calorimetry (DSC) test.
Applsci 10 05381 g002
Figure 3. Dielectric parameters of samples of different ages: (a) complex dielectric permittivity ε; (b) dielectric loss tan δ.
Applsci 10 05381 g003
Figure 4. The electrodes on Dielectric AC breakdown test.
Applsci 10 05381 g004
Figure 5. Schematic diagram of dielectric AC breakdown test circuit.
Applsci 10 05381 g005
Figure 6. Structure of Backpropagation (BP) neural network.
Applsci 10 05381 g006
Figure 7. Drop in deviation by training.
Applsci 10 05381 g007
Table 1. The crystallinity of cross-linked polyethylene (XLPE) for each cable sample.
SamplesOperating Time/YearEnthalpy of Fusion ΔHm/(J/g)Crystallinity Xc/%Standard Deviation σX
A1197.8634.10.002
A2298.6834.30.003
A32.599.5234.60.002
A4396.3633.50.003
A53.59533.10.003
A6592.5632.20.005
A7690.0931.40.003
A8788.2130.70.002
A9886.3330.10.004
Table 2. Results of tensile test of samples from Factory A.
Samplesb/mmd/mmP/Nσ/MPaaσδ/%aδ
A140.9183.9823.180.296497.570.074
A240.8677.6122.560.318489.100.086
A340.8777.1822.250.456474.370.056
A440.8168.1220.970.800459.020.063
A540.8772.3020.830.309446.490.109
A640.9274.8520.340.276427.240.076
A740.9676.0019.810.182407.510.082
A840.9471.5219.020.805388.150.095
A940.8462.2918.540.613360.790.113
Table 3. Hardness test results of samples from Factory A.
SamplesHardness(Shore A)
abcdefAaA
A174.174.274.374.273.674.374.10.264
A273.97474.274.174.374.174.10.141
A374.274.274.474.374.87474.30.271
A474.174.37474.474.674.574.30.232
A574.274.575.375.175.375.274.90.468
A67574.474.675.47475.474.80.566
A776.575.475.676.375.576.275.90.471
A87575.77775.275.27575.50.770
A980.380.781.579.979.480.980.50.748
Table 4. Dielectric parameter of samples in different years at frequency of 0.1 Hz.
SamplesOperating Time/Yearεtan δ (×102)
A112.7620.509
A222.8150.514
A32.52.8410.509
A432.851.488
A53.52.8712.433
A652.8753.844
A762.8784.786
A872.8827.056
A982.8869.323
Table 5. Test results of dielectric AC breakdown test of samples from Factory A.
SamplesThickness d/mmBreakdown Voltage Ub/kVBreakdown Strength Eb/(kV/mm)Standard Deviation aE
A10.8015.727.140.286
A20.8065.727.100.291
A30.8075.757.130.250
A40.8085.697.040.148
A50.8095.687.020.246
A60.8345.887.050.317
A70.8135.686.990.154
A80.8425.927.030.225
A90.8565.746.710.255
Table 6. Lifespan prediction parameters of samples.
No.ParametersTest Methods
1CgeGel content of samples
2XCCrystallinity of samples
3σTensile strength of samples
4δBreaking elongation of samples
5AThe hardness of samples
6εThe dielectric permittivity of samples
7JtanThe dielectric loss of samples
8EbThe average breakdown strength of samples
Table 7. Correlation between lifespan prediction parameters and aging time.
ParametersCorrelation CoefficientSignificanceCorrelation
Cge−0.914α = 0.0019Significant negative correlation
XC−0.972α = 0.0009Significant negative correlation
σ−0.977α = 0.0009Significant negative correlation
δ−0.995α = 0.0009Significant negative correlation
A0.790α = 0.0119Positive correlation
ε0.841α = 0.0059Significant positive correlation
Jtan0.972α = 0.0009Significant positive correlation
Eb−0.794α = 0.0119Negative correlation
Table 8. Predicted and actual aging time of composite insulators.
Samplesa1/Yeara/Yearσ1 (%)
A68.08181.01