Article

The Efficiency of Social Network Services Management in Organizations. An In-Depth Analysis Applying Machine Learning Algorithms and Multiple Linear Regressions

by
Luis Matosas-López
1,* and
Alberto Romero-Ania
2
1
Department of Financial Economics, Accounting and Modern Language, Rey Juan Carlos University, Paseo Artilleros s/n, 28032 Madrid, Spain
2
Department of Applied Economics, Rey Juan Carlos University, Paseo Artilleros s/n, 28032 Madrid, Spain
*
Author to whom correspondence should be addressed.
Appl. Sci. 2020, 10(15), 5167; https://doi.org/10.3390/app10155167
Submission received: 25 June 2020 / Revised: 23 July 2020 / Accepted: 24 July 2020 / Published: 27 July 2020
(This article belongs to the Special Issue Applied Machine Learning)

Abstract

:
The objective of this work is to detect the variables that allow organizations to manage their social network services efficiently. The study, applying machine learning algorithms and multiple linear regressions, reveals which aspects of published content increase the recognition of publications through retweets and favorites. The authors examine (I) the characteristics of the content (publication volumes, publication components, and publication moments) and (II) the message of the content (publication topics). The research considers 21,771 publications and thirty-nine variables. The results show that the recognition obtained through retweets and favorites is conditioned both by the characteristics of the content and by the message of the content. The recognition through retweets improves when the organization uses links, hashtags, and topics related to gender equality, whereas the recognition through favorites increases when the organization uses original tweets, publications between 8:00 and 10:00 a.m. and, again, gender equality related topics. The findings of this research provide new knowledge about trends and patterns of use in social media, providing academics and professionals with the necessary guidelines to efficiently manage these technologies in the organizational field.

Graphical Abstract

1. Introduction

The widespread use of the Internet has prompted numerous changes in recent decades. The Internet has transformed all sectors of the economy and society as a whole. In this sense, social network services are one of the best examples of how technology has changed our behavior patterns.
In 2020, the number of Internet users in the world is 4.54 billion, with an average penetration of social network use of 49% [1]. This global aggregate penetration datum obviously varies between countries. Thus, for example, the percentage in India is 29%, in Germany 45%, in the United States (US) 70%, and in South Korea 87% [1]. In the particular case of Spain, two-thirds of the population are regular users of platforms such as Facebook and Twitter [2].
The level of penetration of these technologies has transformed the way people interact with their environment, to the point of making it necessary to create a descriptive term for the typical user of these platforms: “media prosumer”. Some authors describe the media prosumer as the subject capable of taking center stage, producing and consuming information in the net [3]. Others define the media prosumer as that user who actively assumes the role of the communication channel, taking advantage of it to become a recommender on different topics [4].
One of the approaches used by researchers to examine the behavior of the media prosumer on social network services is that of the uses and gratifications theory. Although this theory was initially developed to describe how audiences interact with mass media, such as radio, the press, or television [5,6], the power of these technologies to propagate information to large audiences, as traditional media do, makes the uses and gratifications theory especially suitable for contextualizing research in this field.
The conceptual framework defined by the uses and gratifications theory allows researchers to explore how the use of these media (mass media then and social media today) serves to gratify the underlying needs of the audience that uses them. The popularity of this theory is such that in recent years, it has been used to address numerous studies on the use of social network services in all types of contexts and organizations [7,8,9,10,11].

1.1. Social Network Services in Organizations

The potential of these platforms as a means of gratification for their users has captured the attention of organizations of various kinds. Since social networks began to become popular in the early 2000s, many organizations have used these technologies to gratify the needs of their audiences.
However, social network services not only help organizations gratify the needs of their stakeholders, these platforms have also become alternative interaction tools for official websites, an economic means to create user communities around the organization, and, in many cases, an instrument to enhance the brand image of the institution [12].
In this sense, business organizations, on the one hand, and university organizations, on the other, are two of the entities in which social network services have gained the most traction. In both cases, the main objective of the organization is to convey information to their audiences in an agile way through a channel that facilitates dialogue between parties [13]. Therefore, we can say that both companies and universities use these platforms for communication purposes. However, the differential nuance is that, whereas university organizations adhere exclusively to this communicational purpose, business organizations also seek a transactional goal. That is, in the business field, these technologies also pursue the formalization of transactions, whether they are understood as customer acquisition or as selling products or services [14].
Thus, in recent years, platforms, such as Twitter, Facebook, and Instagram, have been integrated into the strategies of many organizations, until becoming, in many cases, the cornerstone of the actions carried out in their communication and marketing departments.
The literature specialized on the topic of the use of social network services within organizations, both in the company and in the university, includes numerous references. Table 1 lists a sample of some of the studies conducted in the last five years.
Regarding the use of social media in the business context, several works can be highlighted [15,16,17,18,19]. Balan’s research [15] explored the way in which the topics of the Instagram posts of a major sports equipment brand influenced the recognition received by its publications. Their study revealed significant differences in views, comments, and likes received depending on the topic of publication.
Matosas López [16] analyzed the aspects that condition the propagation of the content of companies in the food sector on Twitter. The author examined the way in which the interactivity of the content (links or mentions), the vividness of the publications (photos or hashtags), the sentiment of the emoticons, and the posting time influenced the dissemination of messages.
Carlson et al. [17] studied the design characteristics of a sample of company pages on the social network Facebook. In this work, the authors observed that the design of the fan page determined the way the client perceived the organization, as well as the client’s predisposition to build links with it.
The research of Mukherjee and Banerjee [18], based on surveys, analyzed the impact that advertising insertions on Facebook had on the users of the platform. The authors showed that advertising can lead the audience to have a positive attitude towards the brand, also increasing the purchase intention of the products or services of the company.
Giakoumaki and Krepapa [19] analyzed how the contents of luxury brands on the Instagram platform can obtain greater or lesser recognition, depending on whether the publication came from one source or another. The authors found that the recognition when the source of the publication was a personal account was greater than when the content was published by an influencer or by the corporate account of the company.
Finally, Majumdar and Bose [20], applying a multi-period analysis, studied, in a sample of manufacturing firms, the relationship between Twitter related activities and the company market value. The researches revealed the existence of positive associations between the distribution of product-related information in this social network and the firm’s value.
Among studies that take university organizations as an object of analysis, several works stand out [21,22,23,24,25]. Laudano et al. [21] examined the Twitter presence of a sample of university libraries. Their findings revealed that, although libraries use this platform to disseminate information about collections, services, or the promotion of activities, its use is in general diffuse and poorly planned.
López-Pérez and Olvera-Lobo [24] explored the use of social media technologies for the distribution of research results in public university organizations. The authors confirmed that approximately 40% of the institutions examined used their corporate accounts on Facebook and Twitter to disseminate this type of content.
Cabrera Espín and Camarero [22] analyzed the different communication channels used by a sample of university institutions. Among other results, the researchers addressed that approximately 80% of the students turned to the university Facebook account to learn about the current affairs of their school, even more than on the school’s own website.
Kimmons et al. [26], using a wide sample of publications, investigated the institutional uses of Twitter in colleges and universities. Their study suggested that even though these technologies are commonly considered as dialogic platforms, their use, in many cases, remains remarkably monologic, focusing all attention on the unidirectional distribution of information of an institutional nature.
Quitana Pujalte et al. [23] examined the ways universities use their corporate accounts to respond to situations of reputational crisis. The study showed that the university’s Twitter profile can be used, in such circumstances, to redirect traffic to the institutional website or to official press releases.
Finally, Wu et al. [25] analyzed the comments that the publications of a sample of universities are capable of generating on Facebook. The authors noted that publications that use a friendly and familiar tone receive a greater volume of comments than those that use a more direct and authoritative tone.

1.2. The Efficiency of Social Network Services Management in Organizations

As we can see, both business and university organizations use these technologies regularly and for different purposes. However, the keys to be considered by these organizations for developing efficient management of their platforms continue to be debated. Some authors hold that one of the problems in the management of these technologies lies in the lack of professionalization of the work teams [27]. Others point out that the management of social network services in organizations suffers from a lack of strategic planning [21].
The deficiencies in social media management are evident, but academics and professionals do maintain a firm consensus on which indicator to use to evaluate whether this management is adequate. This indicator is the recognition that the audience of the account gives to the publications of the account when they see their needs gratified.
As soon as the user perceives that the need that had originated his or her connection with the organization has been satisfied, he or she reacts positively by resorting to the relevant functionalities enabled in the platform. According to some authors [9,16,28], the user manifests this recognition of the organization by sharing its content or marking it as a favorite.
Even though the efficiency of management of social network services seems to have as an unquestionable indicator of success the recognition of content, either in the form of sharing or favoriting publications, the way to maximize this indicator is still under research. Fortunately, the enormous volume of information hosted in social network services enables a detailed study of the activity and behavior of its users.

1.3. Objectives

The millions of interactions that occur daily between organizations and users in these platforms generate millions of terabytes of information. The application of machine learning algorithms and multiple linear regressions allows us to extract the underlying knowledge in these immense information banks. Nevertheless, the ultimate goal of these techniques is the identification of trends, patterns, or models that facilitate decision-making and allow the organization to manage these technologies [29,30] efficiently.
Although some works have previously applied machine learning algorithms and multiple linear regressions to examine the activity occurred on social media, the dynamic and changing nature of these spaces requires constant updates of this knowledge [2]. An in-depth analysis of the trends and patterns of use is, without a doubt, the basis on which professionals in this field develop efficient management of these technologies in their organizations.
This research, based on the application of machine learning algorithms and multiple linear regressions, aims to provide information that serves to update this knowledge about the media. Consequently, the main objective of this work is to identify the variables that allow organizations to manage their social network services efficiently.
The object of study is the official Twitter accounts of university organizations in Spain. The social network service Twitter is taken as the object of research for the ease of access to the data. Likewise, the decision to opt for university organizations is due to the purely communicative purpose of these organizations, leaving aside the transactional objective of business organizations. Finally, the selection of Spanish institutions is justified both by the huge social media activity shown by universities in this country and by the variety of publication topics traditionally addressed by their accounts [31].
In this setting, the research analyzes how certain characteristics of the content, on the one hand, and the message of the content, on the other hand, increase the recognition of publications through retweets and favorites.
The characteristics of the content considered are publication volumes, publication components, and publication moments, whereas the effect of the message of the content focuses on the publication topics. This research will, therefore, answer the following two research questions:
Research Question I (RQI): What are the publication volumes, publication components, and publication moments that increase content recognition in the form of retweets and favorites?
Research Question II (RQII): What are the publication topics that increase content recognition in the form of retweets and favorites?

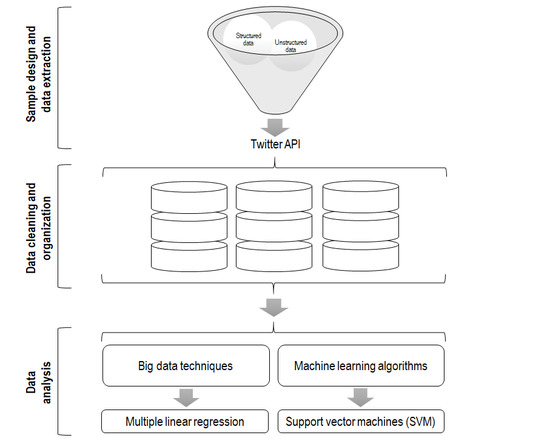
2. Materials and Methods

Applying the postulates of studies on the analysis of social network services, and following the recommendations of Saura et al. [32], this study was organized into three stages: (1) sample design and data extraction, (2) data cleaning and organization, and (3) data analysis. These three stages (see Figure 1) are described below.

2.1. Sample Design and Data Extraction

The researchers used a sample of Spanish university organizations. The selection of sampling elements was based on two of the most recognized rankings for assessing the activity of university institutions: the Webometrics list [33] and the Academic Ranking of World Universities (ARWU), also known as Shanghai ranking [34].
The authors took as their starting point the institutions located in the first fifteen positions of the Webometrics ranking in Spain in 2019 to then check whether these organizations appeared among the global top 500 of the ARWU of that same year. The authors selected only those institutions that rank in the top fifteen in Spain on the Webometrics list and, at the same time, among the top 500 in the world, according to the ARWU. This screening reduced the sample to ten organizations. The institutions were the University of Barcelona, Complutense University of Madrid, Autonomous University of Barcelona, University of Valencia, University of Granada, Autonomous University of Madrid, Polytechnic University of Catalonia, Polytechnic University of Valencia, Polytechnic University of Madrid and Pompeu Fabra University.
Once the sample was selected, the researchers extracted from the Twitter platform, all the content published by the official accounts of the ten organizations over a one-year period. Following the procedure of previous studies [23,35], the data were extracted through Twitter’s API using the service provider Twitonomy. This process led to the gathering of 21,771 publications, in addition to the recognition obtained by each of them in terms of retweets and favorites.

2.2. Data Cleaning and Organization

The compiled data set was stored for cleaning and organization, extracting a total of thirty-nine variables arranged into six categories: (a) Publication volumes, (b) Publication components, (c) Publication day of the week, (d) Publication time slot, (e) Publication topic, and (f) Recognition obtained by the publication (see Table 2). These six categories, and the variables contained in them, were determined in accordance with previous research.
Publications volumes were defined considering the proposal of Bruns and Stieglitz [36]. Publication components were operationalized through the adaptation of post characteristics from De Vries et al. [37]. Publication moment, covering the categories of publication day and publication time slot was based on the analysis of Valerio Ureña et al. [38] in their study on associations between the moment of publication in social media and the engagement concept. Publication topics were addressed in accordance with the proposal of García [39] in her study on communication management in social networks services. And finally, the category that represented the recognition obtained by the publication was determined following the recommendations of authors such as Chen [9] or Pletikosa Cvijikj and Michahelles [28], among others.
The independent variables were clearly separated and differentiated from each other. For instance, a publication could be “Original Tweet”, “Retweet”, or “Reply”, but never “Original Tweet” and “Reply” at the same time. Similarly, a message with a unique publication ID can only be posted on a specific day of the week. In the same way, a publication can not be categorized in two time slots at the same time.
Nevertheless, there could be potential correlations between variables placed in different categories. Thus, for example, publication days or publication time slots could be correlated with the topics of publication. This could lead us to think that the variables in the publication topics´ category could also be considered as independent variables. However, this work, in line with previous studies on the efficiency of social media management in organizations, used as independent variables those commonly taken by the research community when evaluating the recognition of publications [9,16,28]. That is, the variables contained in the category (f), Retweeted Pubs. and Favorite Pubs.

2.3. Data Analysis

To carry out the data analysis, the authors used a two steps approach. First, machine learning algorithms were applied for the classification of publication topics (Category e). Second, multiple linear regressions were used to reveal the volumes (Category a), components (Category b), publication moments (Categories c and d), and publication topics (Category e) that increased the recognition of content.

2.3.1. First Step: Machine Learning Algorithms

The authors applied machine learning algorithms to classify the publication topics (Category e). These publication topics would be used as independent variables in the multiple linear regression carried out in the second step of the data analysis.
In the field of social network services, machine learning algorithms are used to conduct categorizations or classifications of text publications [40]. These systems allow organizations to classify thousands or millions of pieces of text efficiently, and comfortably, for later exploration.
The textual information analyzed using machine learning algorithms is classified as unstructured information. These data do not adhere to a previously defined scheme; therefore, their processing requires the application of certain rules (idiomatic, grammatical, and semantic) to extract the information they contain.
Specifically for the platform under study, the methodologies based on Twitter Analytics approaches addressed by Goonetilleke et al. [41], Kumar et al. [42] or Lin and Ryaboy [43] generally use machine learning algorithms, either to analyze the sentiment of publications or to study specific hashtags. Examples of works focused on the analysis of the sentiment of publications (positive, negative, and neutral) are the studies by Hoeber et al. [44] or Saura et al. [32]. Whereas, examples of investigations focused on the observation of specific hashtags are the works of Lakhiwal and Kar [45] or De Maio et al. [46].
With respect to the techniques used in these methods, the following stood out: decision trees (DT), random forest (RF), Naïve Bayes classifier (NBC), logistic regression (LR), k-nearest neighbors (kNN) and support vector machines (SVM) [47,48,49]. However, whereas many of these techniques can be effective in determining the sentiment of publications or for hashtag examinations, the most appropriate technique for the classification of complex publication topics, and the one that offers the highest accuracy, is the SVM technique [14].
The SVM technique applied in the present study used, specifically, the linear Kernel function as a classification method. This general Kernel function is defined as follows:
K (xi, xj) = Φ (xi)·Φ (xj)
where K (xi, xj) is the core function, and Φ (xi) represents the mapping space associated with the vectors.
The machine learning algorithm used for the classification of publication topics (Category e) was a supervised machine learning algorithm. With supervised machine learning algorithms, there exists an initial set of already labeled data with input-output pairs that allows for training of the predictive model. From this initial data set, the algorithm learns to assign the appropriate output label to each incoming element in the model [50]. In the case of the specific application of these algorithms in the classification of texts in social media, the labeled data set is typically created, on a small scale, via the intervention of a subject or group of subjects who assign each publication the most appropriate label in each case.
In line with previous research, the classification was performed through the text classification API of the MonkeyLearn library [51,52]. This text classification API uses the JASON notation protocol in JavaScript, also allowing the researcher to carry out, before classification, a training process with the algorithm.
After carrying out this training process, manually categorizing 300 publications, the algorithm had the necessary knowledge to develop a personalized machine learning model. This model allowed the classification of the texts of each of the 21,771 publications into one publication topic.

2.3.2. Second Step: Multiple Linear Regressions

The researchers used multiple linear regressions to discover the publication volumes (Category a), publication components (Category b), publication moments (Categories c and d), and publication topics (Category e) that increased the recognition of content.
In the context of social network services, multiple linear regressions focus on quantitative analyses of activity metrics from organizations and users [16].
The information, in the form of metrics that is analyzed by applying multiple linear regressions is generally regarded as structured information. These data are collected in predefined fields and presented using tables of values in which fields and cases are represented in columns and rows, respectively.
The analyses of activity metrics on these platforms can be carried out using techniques such as simple linear regressions (SLR), structural equation modeling (SEM), or even descriptive explorations. Examples of studies that use these techniques are the works of Valerio Ureña and Serna Valdivia [53], Pletikosa Cvijikj and Michahelles [28], or Alonso [54], among others. However, although these techniques are widely accepted, multiple linear regression is probably the most effective technique when the purpose is knowing not only the influence of the independent variables on the dependent ones individually, but also the joint potential of these within the predictive model [16].
The general equation, which is used to represent the multiple linear regression, is expressed as:
Yi = α + β1 Xi1 + β2 Xi2 + … + βk Xik + εi
where α is the constant term of the model, Yi is the dependent variable, Xi represents the independent variables, β represents the regression coefficients, and εi is the error or average of residuals.
The multiple linear regression allowed us to reveal the volumes, components, publication moments, and publication topics that increased the recognition of content. In this analysis, the authors took all the thirty-nine variables considered in the study. Thirty-seven acted as independent variables and two as dependent variables. These thirty-seven independent variables corresponded to the categories (a) Publication volumes, (b) Publication components, (c) Publication day of the week, (d) Publication time slot, and (e) Publication topic. The two dependent variables were those corresponding to category (f) Recognition obtained by the publication (Retweeted Pubs. and Favorite Pubs.).

3. Results

3.1. First Step: Machine Learning Algorithms

The SVM technique applied, using the linear Kernel function as a classification method, reflected the existence of sixteen publication topics: General news, Scholarships, Science and technology, Contests, Culture and exhibitions, Sports, Entrepreneurship, Complementary training, Gender equality, Institutional information, Employability, Research, Seminars and conferences, Awards and recognitions, Health and green environment, and Volunteering.
These publication topics were determined by the researchers and validated by a panel of five judges who were experts on the management of social networks services in different organizational contexts.
In line with previous research, the authors used the Krippendorff’s alpha to measure the accuracy of the text classification carried out by the supervised machine learning algorithm [32]. The Krippendorff’s alpha value obtained (0.886), which is above the recommended threshold of 0.800, indicated that the supervised machine learning algorithm had been properly trained, and its predictive power was accurate enough.
The descriptive exploration of the publication topics addresses the presence of differences in the recognition obtained by the different topics. Table 3 reveals that there were differences in the way in which the content of each publication topic was recognized and what topics obtained greater recognition.
This descriptive examination revealed that institutional information and general news were the most recurring topics, accounting for 20.13% and 11.29% of the publications, respectively.
The average number of retweets and favorites received per publication showed that the contents that achieved the greatest recognition were those related to the gender equality topic. Paradoxically, this topic, with the highest retweet and favorite average, represented only 3.22% of all publications. Therefore, it seems to be clear that certain topics get far more recognition than others.

3.2. Second Step: Multiple Linear Regressions

Two multiple linear regression were performed, one for the dependent variable Retweeted Pubs. and another for the dependent variable Favorite Pubs. The results obtained from these analyses allowed the identification of the variables that increased content recognition in the form of retweets and favorites within the respective models. To examine the explanatory power of each independent variable, the items of the categories (a), (b), (c), (d), and (e) were introduced in their respective model as individual indicators. The researchers applied here the stepwise method for incorporating the variables.
In the first regression, the one performed for the Retweeted Pubs., the item “Links” (β = 0.560, p-value < 0.0001), was added in the first step of the procedure. The variable “Hashtags” (β = 0.455, p-value < 0.005) was introduced in the second step. Finally, the item “Gender equality” (β = 0.447, p-value < 0.0001) was added in the third step.
The model for this first dependent variable (Retweeted Pubs.) was significant as a whole (F = 78.341, p-value < 0.0001), optimally explaining the variance of the dependent variable with values of R = 0.976 and R2 = 0.951. Therefore, this first regression showed the impact of the variables “Links”, “Hashtags”, and “Gender equality” when predicting the recognition of content published through retweets (see Table 4).
For the second regression, the one developed for the variable Favorite Pubs., the item “Original Tweets” (β = 0.198, p-value < 0.005) appeared in the first step of the process. The variable added in the second step was called “Pub. 8:00 to 10:00” (β = 0.237, p-value < 0.005). To finish, the item “Gender equality” (β = 0.531, p-value < 0.005) appeared in the third step.
The model for the second dependent variable (Favorite Pubs.) was also significant (F = 311.278, p-value < 0.0001), adequately explaining the variance of this variable with values of R = 0.931 and R2 = 0.917, respectively. Therefore, this second regression revealed the influence of the variables “Original Tweets”, “Pub. 8:00 to 10:00”, and “Gender equality” on the recognition obtained, through favorites, of the content published by the organization (see Table 4).
To corroborate the validity of the above regressions, the authors analyzed the residuals of both using the Shapiro–Wilk test and the Durbin–Watson test.
The Shapiro–Wilk test was performed to see whether the values of the standardized residuals followed a normal distribution. The p-values above 0.050 in the two regressions (0.851 for the first and 0.721 for the second) confirmed that the residuals were normally distributed [55]. The Durbin–Watson test served to verify whether the assumption of independence of residuals was met. The values of this indicator between 1 and 3 in both regressions (1.847 for the first and 1.425 for the second) verified that the requirement of independence of residual was satisfied [56]. The values in the Shapiro–Wilk and Durbin–Watson tests confirmed that the predictive models obtained from the multiple linear regressions carried out were adequate and robust.

4. Discussion

Different authors have highlighted the need for organizations to invest in efficient management in social network services. Some studies suggest that these platforms require professionalized management systems and that their management cannot be left to nonspecialized profiles [12,27]. Other authors claim that the way many organizations handle these technologies lacks strategic vision [21]. Along the same lines, there are studies that indicate that organizations should not settle for using their accounts to build their institutional image but rather must also protect the reputation of the organization [57]. Some authors claim that properly managed, social network services can even serve as a customer acquisition tool [58].
The findings of this study provide academics and professionals with the necessary knowledge to efficiently manage their use of these technologies, enabling organizations to satisfy many of the aforementioned purposes. The results obtained, thanks to the application of machine learning algorithms and multiple linear regressions, allow us to answer the two research questions posed: the one that concerns the characteristics of the content (publication volumes, publication components, and publication moments) and the one related to the message of the content (publication topics).

4.1. Volumes, Components, and Publication Moments That Increase Content Recognition (RQI)

The multiple linear regressions showed that content recognition through retweets was conditioned on the use of links and hashtags in publications, whereas recognition by favorites was fundamentally determined by the frequency of original tweets and a publication time between 8:00 and 10:00 a.m. The influence of these four variables had a positive valence. Thus, greater exploitation of links, hashtags, original tweets, and early-morning publication boosts the recognition achieved by the organization in the form of retweets and favorites.
Such results corroborate, for example, the findings of Túñez López et al. [34] in their work on the use of Facebook and Twitter as communication channels. Those authors highlighted the value of links as an essential element in any message.
Regarding the use of hashtags, the results are in line with those of Guzmán Duque et al. [58] in their study on the impact of the use of Twitter in the organizational field. In this work, the authors highlighted the potential of these markers in facilitating the promotion and projection of the organization to the audience.
As for the frequency of original tweets, the findings of this work corroborate what was indicated by Chen [9] in a study on uses and gratifications on Twitter: a high publication frequency of original content acts as a motivating factor that encourages the subject to interact with other users.
Finally, with respect to the publication moment, the results are aligned with the findings of Hanifawati et al. [59] in their work on the management of corporate Facebook accounts. In that study, the researchers emphasized that the messages in the most active time slots, those in which the user is more likely to visit the platform, increase both the amount of shared content and the comments received on it.

4.2. Publication Topics That Increase Content Recognition (RQII)

The multiple linear regressions demonstrated that content recognition through retweets and favorites can be influenced using topics related to gender equality. Therefore, the use of publications with this thematic approach increases the recognition achieved by the organization in the form of retweets and favorites.
Although it is true that other authors have highlighted the importance of the theme of the publication in the context of social network services in organizations [27,38], there are few studies that examine this issue in depth. When this has been done, the analyses tend to focus more on the sentiment or tone of the publications [25,60], or on superficial explorations of hashtags or predetermined search terms [34,61]. Consequently, these studies generally ignore most of the text of the publication and the semantics of the expressions contained in it. The present work, thanks to the use of a supervised machine learning algorithm, previously trained by the researchers, allowed for a highly adjusted text classification of the publications. This text classification, carried out in the first step of the analysis, allowed us to identify the publication topics that were used later in the multiple linear regression performed in the second step of the data analysis.
The analysis carried out by the authors revealed differences in the recognition obtained by the different publication topics. These findings are in line with the findings of Pletikosa Cvijikj and Michahelles [28] in their study on engagement factors in online communities within Facebook. Those authors pointed out that the type of content published by the organization can indeed determine the recognition obtained in its audience.
The findings achieved in the present research revealed that, paradoxically, topics with a smaller weight over the total number of publications, such as those that address topics related to gender equality, were the most successful in terms of recognition by the audience.

5. Conclusions

Although in recent years some works have used machine learning algorithms and multiple linear regressions to examine the activity that has occurred on social media, these studies tend to focus exclusively on content characteristics (publication volumes, publication components, and publication moments) [16,62] or in its message (tone, sentiment, or publication topic) [60,63]. However, few studies have examined both topics simultaneously.
Perhaps the most emblematic of these studies is that of Pletikosa Cvijikj and Michahelles [28]. Their work, like the present one, considered the characteristics of the content (publication volumes, publication components, and publication moments) and the message of the content (publication topics). Nevertheless, their study analyzed a data set smaller than that of the present study and applied a text classification with only three publication topics (information, entertainment, and rewards), as opposed to the sixteen considered here.
The present research not only combines a study of the characteristics (volumes, components, and moments) and the message (topics) of the publications, it also addresses this challenge more comprehensively than previous works. In the authors’ opinion, the examination of the characteristics and the message of the publications, in addition to the two steps analysis approach applied in the investigation, are among the key values of the current study. The supervised machine learning algorithm applied in the first term allowed the classification of the texts into the publication topics. Knowing publication topics besides publication volumes, publication components, and publication moments, the authors applied multiple linear regressions to discover the influence of all these variables on the recognition of content.
The results gathered to answer the first research question (RQI) are in line with the findings of previous studies, whereas the results obtained for the second question (RQII) provide novel and relevant information on the current field of investigation.
To this second point, regarding the publication topic, the findings confirmed that publications on topics of gender equality achieve much higher recognition than those obtained by content focused on other topics. In the opinion of the authors, this situation is conditioned by the recent social sensitivity around this issue. Likewise, given that no organization goes uninfluenced by social issues of this nature, the knowledge derived from these results in the context of university organizations is likely to be extended to the field of business organizations.
On the other hand, this finding can prompt reflections on the importance of media professionals’ managing these technologies adequately and being able to identify, at all times, the topics of interest to their audience, adapting the content of their organizations to these preferences.
In view of all the above, the authors confirm the value of applying machine learning algorithms and multiple linear regressions to carry out an in-depth analysis of the enormous amount of information generated by social network services gaining new knowledge about trends and usage patterns in the media. This renewal will ultimately be the basis for the efficient management of social network services in the organizational field.

6. Limitations and Further Research

This paper also suffers from several limitations. The sample, although significant, could be amplified to examine more deeply the observed phenomena.
In addition, future research could also consider complementing the analyzes carried out in the present study with other analytical approaches. A work like the present one could be complemented, for example, by using network centrality analysis [42] or OLAP (On-Line Analytical Processing) techniques [64,65].
Centrality analysis, generally supported in JUNG (Java Universal Network-Graph) open source frameworks, are used to identify who is the most important user in the network; revealing in a graphical way who gets more retweets (Degree Centrality), which is the most influential user (Eigenvector Centrality), or the number of shortest paths in which the user distributes the information (Betweenness Centrality).
Likewise, OLAP techniques allow the extraction of information related to user behaviors, emerging topics, or trends, providing generic multidimensional models for the analysis of data on social network services.
The aforementioned issues address new avenues for research in this field, confirming that further investigation is still needed to expand our understanding of the activity on social media.

Author Contributions

Conceptualization, methodology, formal analysis, investigation, data curation, writing—original draft, project administration, L.M.-L.; validation, writing—review and editing, visualization, supervision, A.R.-A. All authors have read and agreed to the published version of the manuscript.

Funding

This research received no external funding.

Conflicts of Interest

The authors declare no conflict of interest.

References

  1. Hootsuite & We Are Social; Kemp, S. Digital 2020: Global Digital Overview; Singapore. Available online: https://datareportal.com/reports/digital-2020-singapore?rq=singapore (accessed on 1 May 2020).
  2. Gómez-García, M.; Matosas-López, L.; Palmero-Ruiz, J. Social Networks Use Patterns among University Youth: The Validity and Reliability of an Updated Measurement Instrument. Sustainability 2020, 12, 3503. [Google Scholar] [CrossRef]
  3. Sandoval Romero, Y.; Aguaded Gómez, J.I. Nuevas audiencias, nuevas responsabilidades. La competencia mediática en la era de la convergencia digital. ICONO14 2012, 10, 8–22. [Google Scholar] [CrossRef] [Green Version]
  4. Sánchez Carrero, J.; Contreras Pulido, P. De cara al prosumidor: Producción y consumo empoderando a la ciudadanía 3.0. ICONO14 2012, 10, 62–84. [Google Scholar] [CrossRef] [Green Version]
  5. Katz, E.; Blumler, J.G.; Gurevitch, M. Uses and Gratifications Research. Public Opin. Q. 1974, 37, 509–523. [Google Scholar] [CrossRef]
  6. Ruggiero, T.E. Uses and Gratifications Theory in the 21st Century. Mass Commun. Soc. 2000, 3, 3–37. [Google Scholar] [CrossRef] [Green Version]
  7. Raacke, J.; Bonds-Raacke, J. MySpace and Facebook: Applying the Uses and Gratifications Theory to Exploring Friend-Networking Sites. Cyberpsychol. Behav. 2008, 11, 169–174. [Google Scholar] [CrossRef]
  8. Smock, A.D.; Ellison, N.B.; Lampe, C.; Wohn, D.Y. Facebook as a toolkit: A uses and gratification approach to unbundling feature use. Comput. Hum. Behav. 2011, 27, 2322–2329. [Google Scholar] [CrossRef]
  9. Chen, G.M. Tweet this: A uses and gratifications perspective on how active Twitter use gratifies a need to connect with others. Comput. Hum. Behav. 2011, 27, 755–762. [Google Scholar] [CrossRef]
  10. Tarullo, R. ¿Por qué los y las jóvenes están en las redes sociales? Un análisis de sus motivaciones a partir de la teoría de usos y gratificaciones. Prism. Soc. 2020, 29, 222–239. [Google Scholar]
  11. Cuevas-Molano, E.; Sánchez Cid, M.; Matosas-López, L. Análisis bibliométrico de estudios sobre la estrategia de contenidos de marca en los medios sociales. Comun. Soc. 2019, 2019, 1–25. [Google Scholar] [CrossRef]
  12. Casanoves Boix, J.; Küster Boluda, I.; Vila López, N. ¿Por qué las instituciones de educación superior deben apostar por la marca? Rev. Investig. Educ. 2018, 37, 111–127. [Google Scholar] [CrossRef]
  13. Oviedo-García, M.A.; Muñoz-Expósito, M.; Castellanos-Verdugo, M.; Sancho-Mejías, M. Metric proposal for customer engagement in Facebook. J. Res. Interact. Mark. 2014, 8, 327–344. [Google Scholar] [CrossRef]
  14. Matosas-López, L. Cómo distintos tipos de organización gestionan su presencia en plataformas sociales. In Proceedings of the XX International Conference on Knowledge, Culture, and Change in Organizations, Chicago, IL, USA, 20–21 October 2020. [Google Scholar]
  15. Balan, C. Nike on Instagram: Themes of branded content and their engagement power. In Proceedings of the CBU International Conference, Prague, Czech Republic, 22–24 March 2017; Volume 5, pp. 13–18. [Google Scholar]
  16. Matosas López, L.M. Variables of twitter´s brand activity that influence audience spreading behavior of branded content. ESIC Mark. Econ. Bus. J. 2018, 44, 525–546. [Google Scholar] [CrossRef]
  17. Carlson, J.; Rahman, M.; Voola, R.; De Vries, N. Customer engagement behaviours in social media: Capturing innovation opportunities. J. Serv. Mark. 2018, 32, 83–94. [Google Scholar] [CrossRef] [Green Version]
  18. Mukherjee, K.; Banerjee, N. Social networking sites and customers’ attitude towards advertisements. J. Res. Interact. Mark. 2019, 13, 477–491. [Google Scholar] [CrossRef]
  19. Giakoumaki, C.; Krepapa, A. Brand engagement in self-concept and consumer engagement in social media: The role of the source. Psychol. Mark. 2019, 37, 457–465. [Google Scholar] [CrossRef]
  20. Majumdar, A.; Bose, I. Do tweets create value? A multi-period analysis of Twitter use and content of tweets for manufacturing firms. Int. J. Prod. Econ. 2019, 216, 1–11. [Google Scholar] [CrossRef]
  21. Laudano, C.N.; Planas, J.; Kessler, M.I. Aproximacones a los usos de twitter en bibliotecas universitarias de Argentina. An. Doc. 2016, 19. [Google Scholar] [CrossRef] [Green Version]
  22. Cabrera Espín, S.I.; Camarero, E. Comunicación de la ciencia y la tecnología en las universidades ecuatorianas: Estudio preliminar del impacto y percepción entre la población universitaria. Rev. Comun. SEECI 2016, 40, 27. [Google Scholar] [CrossRef] [Green Version]
  23. Quitana Pujalte, L.; Sosa Valcarcel, A.; Castillo Esparcia, A. Acciones y estrategias de comunicación en plataformas digitales. El caso Cifuentes. Prism. Soc. 2018, 22, 247–270. [Google Scholar]
  24. López-Pérez, L.; Olvera-Lobo, M.-D. Comunicación pública de la ciencia a través de la web 2.0. El caso de los centros de investigación y universidades públicas de España. El profesional de la información 2016, 25, 441. [Google Scholar] [CrossRef] [Green Version]
  25. Wu, J.; Chen, J.; Chen, H.; Dou, W.; Shao, D. What to say on social media and how: Effects of communication style and function on online customer engagement in China. J. Serv. Theory Pract. 2019, 29, 691–707. [Google Scholar] [CrossRef]
  26. Kimmons, R.; Veletsianos, G.; Woodward, S. Institutional Uses of Twitter in U.S. Higher Education. Innov. High. Educ. 2017, 42, 97–111. [Google Scholar] [CrossRef]
  27. Laaser, W.; Brito, J.G.; Toloza, E.A. El uso de redes sociales por parte de las universidades a nivel institucional. Un estudio comparativo. Red Rev. Educ. A Distancia 2012, 32, 231–239. [Google Scholar]
  28. Pletikosa Cvijikj, I.; Michahelles, F. Online engagement factors on Facebook brand pages. Soc. Netw. Anal. Min. 2013, 3, 843–861. [Google Scholar] [CrossRef]
  29. Golchha, N. Big Data—The information revolution. Int. J. Appl. Res. 2015, 1, 791–794. [Google Scholar]
  30. García-González, J.D.; Skrita, A. Predicting academic performance based on students’ family environment: Evidence for Colombia using classification trees. Psychol. Soc. Educ. 2019, 11, 299–311. [Google Scholar] [CrossRef] [Green Version]
  31. Matosas-López, L. Divergencias en el uso de redes sociales en universitarios de los grados de Economía y Marketing. In Aproximación Periodística y Educomunicativa al Fenómeno de las Redes Sociales; Sanchez, A.M.d.V.D.J.S., Ed.; McGraw Hill: Madrid, Spain, 2019; pp. 697–708. [Google Scholar]
  32. Saura, J.R.; Herraez, B.R.; Reyes-Menendez, A. Comparing a traditional approach for financial brand communication analysis with a big data analytics technique. IEEE Access 2019, 7, 37100–37108. [Google Scholar] [CrossRef]
  33. Marciniak, R. Propuesta metodológica para la aplicación del benchmarking internacional en la evaluación de la calidad de la educación superior virtual. Rev. Univ. Soc. Del Conoc. 2013, 12, 46–61. [Google Scholar] [CrossRef] [Green Version]
  34. Túñez López, M.; Valdiviezo Abad, C.; Martínez Solana, Y. Las redes sociales en la gestión de la comunicación universitaria. Opción 2015, 6, 852–874. [Google Scholar]
  35. Alkadri, M.F.; Istiani, N.F.F.; Yatmo, Y.A. Mapping Social Media Texts as the Basis of Place-Making Process. Procedia Soc. Behav. Sci. 2015, 184, 46–55. [Google Scholar] [CrossRef] [Green Version]
  36. Bruns, A.; Stieglitz, S. Towards more systematic Twitter analysis: Metrics for tweeting activities. Int. J. Soc. Res. Methodol. 2013, 16, 91–108. [Google Scholar] [CrossRef] [Green Version]
  37. De Vries, L.; Gensler, S.; Leeflang, P.S.H. Popularity of Brand Posts on Brand Fan Pages: An Investigation of the Effects of Social Media Marketing. J. Interact. Mark. 2012, 26, 83–91. [Google Scholar] [CrossRef]
  38. Valerio Ureña, G.; Herrera-Murillo, D.J.; Rodríguez-Martínez, M.D.C. Asociación entre el momento de publicación en las redes sociales y el engagement: Estudio de las universidades Mexicanas. Palabra Clave 2014, 17, 749–772. [Google Scholar] [CrossRef] [Green Version]
  39. García García, M. Universidad y medios sociales. Gestión de la comunicación en la universidad española. Prism. Soc. 2018, 22, 21–36. [Google Scholar]
  40. Thai, M.T.; Wu, W.; Xiong, H. Big Data in Complex and Social Networks; Chapman & Hall/CRC Press: Boca Raton, FL, USA, 2016. [Google Scholar]
  41. Goonetilleke, O.; Sellis, T.; Zhang, X.; Sathe, S. Twitter analytics: A big data management perspective. ACM Sigkdd Explor. Newsl. 2014, 16, 11–20. [Google Scholar] [CrossRef]
  42. Kumar, S.; Morstatter, F.; Liu, H. Twitter Data Analytics; Springer: New York, NY, USA, 2013. [Google Scholar]
  43. Lin, J.; Ryaboy, D. Scaling Big Data Mining Infrastructure: The Twitter Experience. Sigkdd Explor. 2012, 14, 6–19. [Google Scholar] [CrossRef]
  44. Hoeber, O.; Hoeber, L.; El Meseery, M.; Odoh, K.; Gopi, R. Visual Twitter Analytics (Vista): Temporally changing sentiment and the discovery of emergent themes within sport event tweets. Online Inf. Rev. 2016, 40, 25–41. [Google Scholar] [CrossRef]
  45. Lakhiwal, A.; Kar, A.K. Insights from twitter analytics: Modeling social media personality dimensions and impact of breakthrough events. In Proceedings of the 15th Conference on e-Business, e-Services and e-Society (I3E), Swansea, UK, 13–15 September 2016; Volume 9844, pp. 533–544. [Google Scholar]
  46. De Maio, C.; Fenza, G.; Loia, V.; Parente, M.; Cuzzocrea, A. Towards OLAP Analysis of Multidimensional Tweet Streams. In Proceedings of the DOLAP ’15: ACM Eighteenth International Workshop on Data Warehousing and OLAP, Melbourne, Australia, 19–23 October 2015; pp. 69–73. [Google Scholar]
  47. Blachnik, M.; Kordos, M. Comparison of Instance Selection and Construction Methods with Various Classifiers. Appl. Sci. 2020, 10, 3933. [Google Scholar] [CrossRef]
  48. Kowsari, K.; Meimandi, K.J.; Heidarysafa, M.; Mendu, S.; Barnes, L.; Brown, D. Text Classification Algorithms: A Survey. Information 2019, 10, 150. [Google Scholar] [CrossRef] [Green Version]
  49. Salas-Rueda, R.-A. Percepciones de los estudiantes sobre el uso de Facebook y Twitter en el contexto educativo por medio de la ciencia de datos y el aprendizaje automático. Pixel-Bit. Rev. Medios Educ. 2020, 58, 91–115. [Google Scholar] [CrossRef]
  50. Simeone, O. A Very Brief Introduction to Machine Learning with Applications to Communication Systems. IEEE Trans. Cogn. Commun. Netw. 2018, 4, 648–664. [Google Scholar] [CrossRef] [Green Version]
  51. Wang, Z.; Bai, G.; Chowdhury, S.; Xu, Q.; Seow, Z.L. TwiInsight: Discovering Topics and Sentiments from Social Media Datasets. Comput. Res. Repos. 2017, 2017, 1–14. [Google Scholar]
  52. Saura, J.R.; Reyes-Menendez, A.; Alvarez-Alonso, C. Do online comments affect environmental management? Identifying factors related to environmental management and sustainability of hotels. Sustainability 2018, 10, 3016. [Google Scholar] [CrossRef] [Green Version]
  53. Valerio Ureña, G.; Serna Valdivia, R. Redes sociales y bienestar psicológico del estudiante universitario. Rev. Electrónica Investig. Educ. 2018, 20, 19. [Google Scholar] [CrossRef]
  54. Alonso, M. Las redes sociales como canal de comunicación de las marcas de moda españolas. El caso de Zara, Mango y el Corte Inglés. Index Comun. 2015, 5, 77–105. [Google Scholar]
  55. Razali, N.M.; Wah, Y.B. Power comparisons of Shapiro-Wilk, Kolmogorov-Smirnov, Lilliefors and Anderson-Darling tests. J. Stat. Model. Anal. 2011, 2, 21–33. [Google Scholar]
  56. Gujarati, D.N.; Porter, D.C. Essentials of Econometrics, 4th ed.; McGraw-Hill: New York, NY, USA, 2010. [Google Scholar]
  57. Gureeva, A.N. Social Networks as a Media Communication Resource for Managing the Image of a Russian Higher Education Institution. Mediascope 2018, 2. [Google Scholar] [CrossRef]
  58. Guzmán Duque, A.P.; del Moral Pérez, M.E.; González Ladrón de Guevara, F.; Gil Gómez, H. Impacto de twitter en la comunicación y promoción institucional de las universidades Impact of twitter on communication and institutional promotion of universities. Pixel Bit. Rev. Medios Educ. 2013, 43, 139–153. [Google Scholar] [CrossRef] [Green Version]
  59. Hanifawati, T.; Ritonga, U.S.; Puspitasari, E.E. Managing brands’ popularity on Facebook: Post time, content, and brand communication strategies. J. Indones. Econ. Bus. 2019, 34, 185. [Google Scholar] [CrossRef]
  60. Wang, Y.; Youn, H. Feature weighting based on inter-category and intra-category strength for Twitter sentiment analysis. Appl. Sci. 2019, 9, 92. [Google Scholar] [CrossRef] [Green Version]
  61. Andéhn, M.; Kazeminia, A.; Lucarelli, A.; Sevin, E. User-generated place brand equity on Twitter: The dynamics of brand associations in social media. Place Brand. Public Dipl. 2014, 10, 132–144. [Google Scholar] [CrossRef]
  62. Morales, A.J.; Borondo, J.; Losada, J.C.; Benito, R.M. Efficiency of human activity on information spreading on Twitter. Soc. Netw. 2014, 39, 1–11. [Google Scholar] [CrossRef] [Green Version]
  63. Saif, H.; He, Y.; Fernandez, M.; Alani, H. Contextual semantics for sentiment analysis of Twitter. Inf. Process. Manag. 2016, 52, 5–19. [Google Scholar] [CrossRef] [Green Version]
  64. Kraiem, M.B.; Feki, J.; Khrouf, K.; Ravat, F.; Teste, O. Modeling and OLAPing social media: The case of Twitter. Soc. Netw. Anal. Min. 2015, 5, 1–15. [Google Scholar] [CrossRef] [Green Version]
  65. Kraiem, M.B.; Feki, J.; Khrouf, K.; Ravat, F.; Teste, O. OLAP4Tweets: Multidimensional Modeling of tweets. In Proceedings of the 19th East-European Conference on Advances in Databases and Information Systems (ADBIS 2015), Poitiers, France, 8–11 September 2015. [Google Scholar]
Figure 1. Stages of the methodology.
Applsci 10 05167 g001
Table 1. Studies on the use of social network services in organizations.
Author/sYearPlatforms ConsideredType of OrganizationPurpose of the Study
Laudano et al.2016TwitterUniversityDissemination of information about libraries collections and services
López-Pérez and Olvera-Lobo2016Facebook and TwitterUniversityDistribution of research results
Cabrera Espín and Camarero2016FacebookUniversityAnalysis and comparison of digital communication channels
Kimmons et al.2017TwitterUniversityDialogic functionality of the platform
Balan2017InstagramBusinessRecognition received by the message depending on the publication topic
Matosas López2018TwitterBusinessContent sharing and propagation
Carlson et al.2018FacebookBusinessClient perception of the organization
Quitana Pujalte et al.2018TwitterUniversityUse of corporate accounts in situations of reputational crisis
Wu et al.2019FacebookUniversityRecognition obtained depending on the publication source
Mukherjee and Banerjee2019FacebookBusinessImpact that advertising insertions have on the user
Giakoumaki and Krepapa2019InstagramBusinessInfluence of publication’s tone on the volume of comments
Majumdar and Bose2019TwitterBusinessAssociations between platform’s activity and company market value
Table 2. Variables extracted from the data set.
Category No. of VariablesName of the Variables
(a) Publication volumes3Original Tweets, Retweets, and Replies
(b) Publication components3Links, Mentions, and Hashtags
(c) Publication day of the week7Pub. On Mon., Pub. On Tue., Pub. On Wed., Pub. On Thu, Pub. On Fri., Pub. On Sat., Pub. On Sun.
(d) Publication time slot8Pub. 8:00 to 10:00, Pub. 11:00 to 13:00, Pub. 14:00 to 16:00, Pub. 17:00 to 19:00, Pub. 20:00 to 22:00, Pub. 23:00 to 1:00, Pub. 2:00 to 4:00, Pub. 5:00 to 7:00
(e) Publication topic16Central topic discussed in the pub.
(f)Recognition obtained by the publication2Retweeted Pubs. and Favorite Pubs.
Total39
The variables gathered in categories (a), (b), (c), (d), and (e) were taken as independent variables, whereas the variables in category (f) were used as dependent variables.
Table 3. Retweets and favorites obtained by publication topic.
Publication TopicNumber of Tweets% of Total TweetsAverage Number of Retweets Obtained Per Pub.Average Number of Favorites Obtained Per Pub.
General news245811.29%18.879.21
Scholarships4291.97%11.2111.16
Science and technology19609.00%13.688.37
Contests2671.23%9.066.41
Culture and exhibitions14376.60%10.996.23
Sports8143.74%11.875.01
Entrepreneurship3081.41%7.975.25
Complementary training12285.64%8.014.18
Gender equality7003.22%50.9826.14
Institutional information438220.13%13.877.21
Employability6853.15%8.124.18
Research17968.25%13.087.38
Seminars and conferences19689.04%7.984.07
Awards and recognitions19078.76%11.943.98
Health and green environment11775.41%18.5411.99
Volunteering2551.17%13.875.29
Total21,771100.00%45.8424.98
Table 4. Coefficients of multiple linear regressions.
(f) Recognition Obtained by the Publication
Retweeted Pubs.Favorite Pubs.
Category/VariableΒp-ValueΒp-Value
(a) Publication volumes
Original Tweets−0.1640.2810.1980.003 *
Retweets−0.0980.3260.0140.624
Responses0.0110.9080.0770.346
(b) Publication components
Links0.5600.000 **−0.0170.899
Mentions−0.0480.6800.1120.016
Hashtags0.4550.001 *0.0900.097
(c) Publication day of the week
Pub. On Monday−0.1110.538−0.4210.074
Pub. On Tuesday−0.1210.435−0.0940.698
Pub. On Wednesday−0.1070.441−0.1270.518
Pub. On Thursday−0.0910.4370.2280.374
Pub. On Friday−0.1570.3810.1240.493
Pub. On Saturday−0.1530.2070.0490.409
Pub. On Sunday−0.0060.981−0.0540.364
(d) Publication time slot
Pub. 8:00 to 10:00−0.0710.7810.2370.004 *
Pub. 11:00 to 13:00−0.0880.6010.1840.081
Pub. 14:00 to 16:00−0.0090.9710.0910.172
Pub. 17:00 to 19:00−0.0160.902−0.0170.791
Pub. 20:00 to 22:000.1310.547−0.0390.514
Pub. 23:00 to 1:000.0590.6110.0090.843
Pub. 2:00 to 4:000.0690.654−0.0620.185
Pub. 5:00 to 7:00−0.1570.135−0.1240.018
(e) Publication topic
General news0.1850.4200.0210.734
Scholarships−0.0140.7500.1800.121
Science and technology−0.0390.5370.0740.117
Contests0.5170.4270.0920.092
Culture and exhibitions0.0660.9050.0710.151
Sports−0.0870.5470.2630.341
Entrepreneurship−0.1240.4110.1810.512
Complementary training−0.1590.1950.0250.663
Gender equality0.4470.000 **0.5310.001 *
Institutional information0.0390.7320.0180.903
Employability−0.0580.7010.2090.214
Research−0.1090.381−25.8520.468
Seminars and conferences0.0910.5140.0340.584
Awards and recognitions−0.1130.1450.0190.607
Health and green environment0.1270.584−0.0370.484
Volunteering0.0520.5520.0170.803
* p-value < 0.005; ** p-value < 0.0001.

