Utilizing an Adaptive Neuro-Fuzzy Inference System (ANFIS) for Overcrowding Level Risk Assessment in Railway Stations


1
Birmingham Centre for Railway Research and Education, The University of Birmingham, Birmingham B15 2TT, UK
2
The School of Science, Engineering and Environment, The University of Salford, Manchester M5 4WT, UK
*
Author to whom correspondence should be addressed.
Appl. Sci. 2020, 10(15), 5156; https://doi.org/10.3390/app10155156
Submission received: 21 June 2020
/
Revised: 19 July 2020
/
Accepted: 23 July 2020
/
Published: 27 July 2020
(This article belongs to the Special Issue Extreme Sciences and Engineering Ⅱ)
Abstract
:The railway network plays a significant role (both economically and socially) in assisting the reduction of urban traffic congestion. It also accelerates the decarbonization in cities, societies and built environments. To ensure the safe and secure operation of stations and capture the real-time risk status, it is imperative to consider a dynamic and smart method for managing risk factors in stations. In this research, a framework to develop an intelligent system for managing risk is suggested. The adaptive neuro-fuzzy inference system (ANFIS) is proposed as a powerful, intelligently selected model to improve risk management and manage uncertainties in risk variables. The objective of this study is twofold. First, we review current methods applied to predict the risk level in the flow. Second, we develop smart risk assessment and management measures (or indicators) to improve our understanding of the safety of railway stations in real-time. Two parameters are selected as input for the risk level relating to overcrowding: the transfer efficiency and retention rate of the platform. This study is the world’s first to establish the hybrid artificial intelligence (AI) model, which has the potency to manage risk uncertainties and learns through artificial neural networks (ANNs) by integrated training processes. The prediction result shows very high accuracy in predicting the risk level performance, and proves the AI model capabilities to learn, to make predictions, and to capture risk level values in real time. Such risk information is extremely critical for decision making processes in managing safety and risks, especially when uncertain disruptions incur (e.g., COVID-19, disasters, etc.). The novel insights stemmed from this study will lead to more effective and efficient risk management for single and clustered railway station facilities towards safer, smarter, and more resilient transportation systems.
1. Introduction
In recent years, there has been a global increase in the demand for rail transport, and rail usage is expected to continue to increase worldwide [1]. Passenger streams in railway systems are growing dramatically in many cities over the world with the rapid development of rail transit. This reflects on stations that face enormous pressure from passenger congestion and the high level of overcrowding in peak times. The metro systems in Beijing and Shanghai provide a daily transport service for more than nine million passengers, and statistics indicate that the annual usage has almost doubled from 2011 to 2015 [2,3]. In the UK, the number of rail passenger journeys has more than doubled over the last 20 years [4]. Moreover, by 2050, over 75% of the world’s population is expected to be living in cities. It is a priority for municipalities worldwide to support citizens’ mobility within the urban environment. The British rail network is likely to boost passenger-km by 50%, in accordance with the government targets set out in the Ten-Year Plan for Transport [5]. Moreover, in some parts of the world, railway infrastructure has been used extensively for carrying large volumes of goods and is now ageing; for example, in Europe, the network infrastructure was built 150 years ago [6]. Thus, the highly demanding and intensive use of old systems increases the risk factor and holds the industry under pressure from both society and government. Moreover, accommodating an increasing number of people on public transportation is a challenge, especially during peak commuting hours when overcrowding creates incredibly high levels of discomfort and unsafe train stations for passengers. It has been noted that crowding increases risks to the health and/or safety of those affected [7]. The industry offers some solutions, such as discouraging peak-time travel by means of fare differentiation. However, this has had no observable effect on passengers’ travel patterns [8]. Railway stations are an essential part of railway systems; they are the point where passengers start and end their journey. Moreover, some stations now offer commercial facilities to travellers. This highlights the complexity of the entire system, whereby stations are dynamic systems that have to accommodate thousands or millions of people arriving and departing every second, whilst relying on infrastructure design, operational processes, and other factors. Managing the passenger flow in stations is vital because stations are a major component of the public transportation system and attract a large number of passengers. Increasing congestion in stations generates many risks to be managed [9] and remains a major source of complaints by travellers. Overcrowding affects railway operations, traveller satisfaction, dwell time, service reliability, passenger wellbeing, safety, and security. It has been shown that the optimization of passenger flow is essential for operation, traffic management and planning, improving terminal space, and increasing public safety and security [10,11]. Hence, railway station operators can remove restrictions and allay fears, thus attracting passengers, improving passenger experience and satisfaction, and ensuring the long-term sustainability of stations [12]. Nevertheless, managing passenger flows and the risks of overcrowding are challenging owing to the complexity of station designs and unexpected passenger behaviour. Several operational processes need to be managed in real-time, creating a dynamic environment. Operators must monitor, scan, manage, investigate factors, and update plans based on the level of expected hazard. This enables them to select appropriate plans and strategies for reducing risks to an acceptable level [13]. In many situations, however, probable risk management methods may not provide satisfactory results because risk data are inadequate or introduce high levels of uncertainty [14]. It is important to predict passenger flow, which is constantly changing, to forecast abnormal events and avoid the consequences of risky scenarios at an early stage (phenomena of congestion). Because of the dynamic and free-flowing nature of the system, flow clogging, narrow paths, and congestion may lead to crowd accidents such as stampede. It is necessary to monitor the movement flow and behaviour of pedestrians in stations to anticipate the risks of overcrowding in real-time during operations, and to predict areas where congestion may occur to implement safety measures [15]. Therefore, forecasting the flow in stations in normal situations and considering emergency events by relying on timely robust data is urgently required. In recent years, many studies have been conducted to assess passenger infrastructure within railway facilities by monitoring and modelling pedestrian flows (“crowd dynamics” models). However, the management of railway stations requires reconsideration in light of new technologies [9,13,16]. In this study, we propose a method for limiting overcrowding and improving the management process. Our model uses an adaptive neuro-fuzzy inference system (ANFIS) for the short-term prediction of risk level relating to overcrowding. This type of fuzzy neural network has been proven to be an effective tool in many fields. Moreover, the use of an artificial neural network (ANN) combines the learning ability, robustness, and extensive parallelism with the fuzzy system to reduce uncertainty in the prediction process. Additionally, this study evaluates a case study using passenger flow data—the transfer efficiency and the retention rate of the platform—from a station in China, as in [17]. The former is related to the passenger in waiting and the latter depends on the transfer distance and transfer time. The proposed method is beneficial to the station design and layout, crowd management, emergency planning, route scheduling, and improvement of health and safety in similar environments, which reflect positively on the industry and raise service satisfaction. Specifically, the novelty of this study lies in the following points. First, unlike most models that rely on simulation data, our model uses real data collected from stations for the prediction of overcrowding. The data include important factors, such as peak time and walking velocity which varies for different equipment (e.g., stairs and escalators) and are used to calculate the transfer efficiency. Second, a learning-based method has been introduced for crowd management in stations and particularly on platforms that are a hot spot in terminals. Then, a smart framework has been presented, which can be generalised for many locations and fields for managing overcrowding. Other contributions of this study are as follows:
- Many models consider the total number of passengers entering a station. However, overcrowding may occur only on one platform. In our study, we consider the number of passengers on a single platform that is determined by the passengers in waiting and the flow from the station to the platform through the escalators or other channels. Additionally, we assume that the delay of one train can affect only one platform. The information fed to the model can be captured from images in the station that include the spatial and temporal dependence of the crowd.
- The ANFIS model used in this study can learn and specify a threshold for the risk level depending on location and crowd standards from accurate real-time data.
- Estimating the risk level is an important outcome of our prediction, unlike traditional prediction studies that focus only on station-level or route-level forecasting (time series).
2. Literature Review
Many studies have presented the risks of overcrowding from different perspectives. Fuzzy logic (FL)-based methods have been utilised for modelling uncertainties in overcrowding dynamics. A fuzzy modelling method has been proposed to simulate and analyse factors such as evacuation time against varying crowd velocities [18]. Takagi–Sugeno-type fuzzy rules have been used in the suggested fuzzy model to convert physical laws of pedestrian motion into a fuzzy inference system (FIS) [19]. Moreover, it was demonstrated that high congestion in railway stations affects the quality of service to travellers, potentially damaging the image of the business, or worse, interrupting operational continuity because of the growth of the dwell time [20,21]. Furthermore, high levels of passenger density have been connected to many psychological and social issues, including perceptions of risk to personal safety and security [22,23,24,25]. Congestion risk management is increasingly important for the railway industry to protect passengers, the public, and employees while enhancing safety and decreasing maintenance costs [14]. Additionally, from a financial perspective, overcrowding affects the rail business by causing significant revenue losses to operators and being a constraint to the government’s rail passenger growth objectives and management of demand [26]. Passenger flow is based on nonlinear relationships in which changes occur naturally. To overcome the limitations of models that assume linearity in passenger forecasting, researchers have used various methods, such as statistics-based approaches, machine learning, hybrid models, and deep learning. Related works are shown in (Table 1).
The literature review suggests that artificial intelligence (AI) methods for flow prediction have become a new trend and have gained a lot of academic and industrial interest. According to such literature, we have entered the era of big data [59,60,61,62]. The new technology will play an important role in the future of flow prediction and in dealing with the flow forecast issues of intelligent transportation systems. Studies have been utilising a wide range of data; however, the acquisition of data is a problem for researchers. More datasets are necessary for training to improve prediction performance. Recently, traffic prediction (both numerical and image based) has greatly developed to cover all transportation types, including vehicles, buses, taxis, and trains, with more studies using road data. Moreover, it is linked to many aspects, such as delays, activity patterns, weather, fuel consumption, pollution, city congestion, driving speed, traffic and public flow, and pedestrian flow characteristics. Therefore, it is a challenge to focus on one specific prediction such as the congestion in railway stations with risk and safety management perspectives. Prior studies provide an excellent source of information for studying the passenger flow risk. Nevertheless, congestion in stations is extremely hard to mitigate because of congestion features such as randomness, diffusivity, and uncertainty. In the last decade, studies have used traffic road safety and time series models as an evaluation method for urban road traffic. However, few studies have focused on passenger safety in rail stations. The recent deep learning models present high performance; however, the modelling has been performed by computer and information technologies rather than the crowd risk and management analysis. Moreover, they often share parallel structures and concepts. Passenger flow has not been completely addressed or is often overlooked, and studies are more focused on vehicles and city congestion. Analysis of the flow will provide knowledge for designing future stations and correcting any deficiency in trains or facilities provided to passengers. This would support the effective planning of essential services, such as transfer services at railway terminals. Many factors must be considered in such cases, including walking speed, crowd density, free-flow speed, and risk level. However, there is still a great need for extensive studies from the perspective of safety and risk. Some of the aspects and methodologies that should be considered while studying flow prediction are listed as follows:
- The risk and consequences of the unwanted events (crowd) must be considered, such as stamping and falling or panicking.
- Real data is essential and will reduce error compared to simulation data.
- Time series models usually neglect many factors and specific locations, such as the platforms in railway stations.
- Appling AI to existing systems in railway stations, such as closed-circuit television CCTV, will be beneficial and cost efficient to operators for timely flow prediction.
- Certain passenger categories, such as the disabled, families, and the elderly, need to be considered to make stations accessible to all.
In this study, we propose a method that utilises data from many digital sources in a station. In fact, a large volume of data is collected daily in railway stations, e.g., smart card data, smart phones applications, sensors, Bluetooth, and video surveillance [63,64,65,66,67]. To monitor the crowd, it is necessary to locate and follow passengers and members of the public whilst they are in the station. This requires extracting crowd information [19] and making a robust prediction of the passenger flow to support the decision maker and assist in managing the operations in the stations. The crowd in the station is related to many characteristics: health and safety, security, ridership, service quality and satisfaction, cost and maintenance, station operation, dwell time, risk assessment, and passenger preferences and travel decisions.
3. Intelligent System for Managing Risks (ISFMR)
We propose a method to advance dynamic risk management in railway stations. Our aim is to minimize risk through automated processes by taking into consideration all the factors in the system and how they work mutually to provide an acceptable level of safety and security in real-time. Accordingly, we use a smart method to create the Intelligent System for Managing Risks (ISFMR) framework. This is expected to increase safety and security and effectively assess and manage risks, thus increasing performance in railway stations, which reflect the whole rail system. To create a smart process for the risk management, timely data are required. Gathering online data offers the benefits of advanced technology in both the collection and analysis of the data. Stations generate a large volume of data on safety and risk history information. Various types of data can be captured, such as video, sensor signals, ticketing system data, and numerical documents. The complete structure of the proposed framework is shown in Figure 1. As illustrated, inputs represent the number of internal and external pieces of information gathered from various attributes and used for crowd flow prediction in stations.
4. Overcrowding at Railway Stations
It is a priority for municipalities worldwide to support citizens’ mobility within the urban environment. Moreover, by 2050, it is estimated that over 75% of the world’s population is expected to be living in cities. The British rail network is likely to boost passenger km by 50%, in accordance with government targets set out in the Ten-Year Plan for Transport [5]. However, absorbing increasing loads in public transportation is a challenge, especially during peak commuting hours where overcrowding creates incredibly high levels of discomfort and unsafe train stations. The industry has some solutions, such as discouraging peak-time travel by means of fare differentiation. However, this has had no observable effect on travellers’ journeys [8,68]. Crowding at railway stations remains one of the main causes of concern for passengers, as evidenced by complaints to operators. It has been noted that crowding increases risks to the health and/or safety of those affected [12,69,70]. Any high congestion in stations could lead to dangerous situations and abnormal consequences. This is because of the dynamic and free-flowing nature of the system. Clogging, flow, narrow paths, and congestion may lead to crowd accidents such as stampede. It is necessary to monitor the condition, movement flow, and behaviour of pedestrians in stations to anticipate the overcrowding risk in real time during operations, and to predict areas where congestion may occur during any situation to implement safety measures, according to Helbing et al. [71]. From the literature, many studies have been conducted that present the danger of overcrowding from a different perspective. Additionally, regarding health and safety and the spread of viruses such as COVID-19, it has been suggested that individuals avoid overcrowded areas such as on public transportation. Thus, it may now be even more imperative to control and prevent overcrowding risks quickly and in real-time in places such as railway stations and platforms [72,73,74].
The outline of related studies for this work will be presented in the next lines. Fuzzy Logic (FL)-based methods have been utilised for uncertainties in overcrowding dynamics. It has proposed a fuzzy modelling method to simulate and analyse possible factors, such as evacuation time against varying velocities of the crowd [18]. Takagi–Sugeno-type fuzzy rules have been used in the suggested fuzzy model to convert physical laws of pedestrian motion into a fuzzy inference system FIS [73]. Moreover, high congestion in railway stations affects the quality of service for travellers and damage might extend to the business images, or worse, it may subsequently interrupt operational continuity because of the growth of the dwell time [20,74,75]. Furthermore, high levels of passenger density have been connected to many psychological and social issues, including perceptions of risk to personal safety and security [12,76], increased anxiety [24], stress, feeling of exhaustion, and the possibility of ill health [22,25,77]. Congestion risk management is increasingly important for the railway industry in order to protect passengers, public, and employees, whereas enhancing safety and decreasing maintenance costs [14]. In addition, from a financial perspective, overcrowded situations affect the rail business, causing significant lost revenue to operators and providing a constraint to the government’s rail passenger growth objectives and management of demand [26]. Furthermore, it has been indicated that overcrowding should be considered a probable threat to the health of both rail business and passengers. Finally, the effect of rail passenger crowding reductions would improve passenger numbers, passenger experience, safety and security, satisfaction, and the long-term sustainability of stations [12]. In this paper, we propose a method that can utilise data from many digital sources in the station. A large volume of data are collected daily in railway stations, such as smart card data, smart phones applications, sensors, Bluetooth, and video surveillance [63,64,65,66]. To monitor the crowd, it is necessary to locate and follow passengers and members of the public whilst they are in the station. This requires the extraction of information from crowds [19].
5. Development of the ANFIS Model and the Framework
ANFIS is a combination of the computational power of ANN and the high-level reasoning capability of an FIS [78], which is developed in [79]. In other words, by inserting the FIS into the framework of adaptive networks, we receive the ANFIS architecture [80,81]. Owing to the effective learning and reasoning competence of the ANFIS model, it has received growing interest from academics in numerous engineering and scientific fields. In the literature, different models implement different learning structures for many applications and surveys [82,83,84,85]. The ANFIS model is utilised in problems connected to parameter identification. This is achieved through a hybrid-learning rule combining back-propagation, gradient descent, and a least-squares method. It is a multilayer feed-forward network that employs an ANN and FLS to map inputs into an output see Figure 2. Therefore, it is an FLS implemented in the structure of an adaptive ANN. Furthermore, ANFIS can construct a network realisation of IF/THEN rules [80]. One of the earliest works in the identification risk literature was completed by [86]. Moreover, for the assessment of risk factors in highway management corporations in China, a back-propagation ANN was used [87]. The output is predicted through an adaptive network, which feeds forward multi-layers of ANN with adaptive nodes. Learning rules are specified for the parameters of the adaptive node and the adjustment of the parameter depends on error values [83,88]. In this work, we use the ANFIS as a smart method or tool for risk prediction and to train on station risk levels as it has been indicated that the model can be utilised to assess risk during a small computational time [89]. We have developed the model for predicting the overcrowding risk, but it can be applied to other risk factors with different indicators. Besides, the suggested tool is used to assess the ISFMR by using overcrowding risk in stations, which supports future smart risk management.
The ANFIS is a hybrid method that has several features of interest. For instance, the ANN can identify patterns in advance using the adaptation to the environment with its learning ability. At the same time, the FLS can combine expert judgment and perform the decision-making process [90]. The ability to handle historical data as well as expert knowledge whilst being flexible to adapt to unusual risky circumstances are important the features of the ANFIS model. Moreover, the model has been employed in emergency management, and analyses of external environments and level of threats [91]. The system is described as smart because of the parameters and fuzzy rules, which are estimated by ANN intelligently [92]. The method utilises supervised learning on a learning algorithm. It consists of five layers with two or more ANFIS inputs (X, Y), which are transformed into fuzzy inputs in Layer 1 (the adaptive node or fuzzification layer), as shown in Figure 3.
Then, the process generates membership functions (MFs) for each of the inputs. There are many MF types, for instance, triangular MF, generalized bell MF, and Gaussian MF. In this study, various MFs have been examined [59,93,94].
The method of fuzzy output clarification is used in Mamdani-type inference systems, whereas the weighted average is used in Sugeno-type inference systems [95]. The ANFIS is a Sugeno-type inference system and is a hybrid method that utilises parallel calculation and the learning ability and FLS features of ANN [96]. Regarding fuzzy identification, a Sugeno-type of fuzzy system is the most common MF. To determine the relation between input and output in the ANFIS model, two algorithms are used, namely error backpropagation and hybrid learning. The ANFIS uses the learning ability of ANN for determining input and output spaces. One of the limitations of this system is the time needed for training. In the Sugeno membership function, the output of the fuzzy rules are in a linear function form (Takagi and Sugeno, 1985), [97]. This assumes that two forms of the first order and zero-order have been considered for this linear relationship (fuzzy inference system). Thus, in this model, two inputs and one output are used, as shown in Figure 4. The linear relation between these inputs (Sugeno fuzzy model) [97] would be:
- Rule 1: If x is A1 and y is B1, THEN f1 = c1x+q1 y+ R1
- Rule 2: If x is A2 and y is B2, THEN f2 = c2x+q2 y+ R2
where ci, qi, and ri, are linear parameters of the Sugeno fuzzy model for determining the relation between input and output, and x and y are numerical inputs, while A and B are numerical variables. The system is formed by five layers with a brief explanation of the ANFIS architecture presented in Figure 4, and more detail of the layers discussed in the following section. All computations can be presented in diagrammatic form. ANFIS typically has five layers of neurons, and each layer is from the same function family. The ANFIS structure also has five layers excluding input layer.
The first layer designates how much each numerical input relates to the different fuzzy set. Let the MF of fuzzy sets Ai, be Bi, then the output of this layer can be calculated by the next equation (Equation (1)) as follows:
As an example, for the MF, a bell function (gbellmf) where {a, b, c} is the parameter set (premise parameters), Equation (2) would be:
The outputs of the previous layer constitute the inputs of the next one. The next layer (layer of rules) operates logic operations “AND” and “OR”, which lead to the output value (called firing strength), which can be calculated by Equation (3) as follows:
where is the value of multiplication of the output of Ai node and that of Bi node, which shows the ignition strength of the rule [98,99]. The next layer (Third layer, layer of normalisation) for each of the outputs of Layer 2 is divided between all of the outputs of that rule, as in Equation (4), as follows:
In the next layer (Layer 4, the clarification layer), the input of each rule for the calculation of model output is computed by Equation (5), as follows:
In the last layer (The fifth, the output layer), where the products of the previous neurons are summed with each other and lastly, by defuzzification, fuzzy outputs are transformed into numerical products. Equation (7) explains how this transformation calculated Equation (6), as follows:
or leaving the arguments out (Equation (7)):
This can be separated into phases by first defining Equation (8), as follows:
and then f can be written as Equation (9), as follows:
Once the premise parameters are fixed, the overall output is a linear combination of the consequent parameters. In symbols, the yield f can be formed as Equation (10), as follows:
which is linear in the consequent parameters cij (i = 1,2, j = 0,1,2). A hybrid algorithm adjusts the consequent parameters cij in a forward pass and the premise parameters {ai, bi, ci} in a backward pass. In Layer 5 (output value layer), the node sums the output values of each node of the previous layer [80,100].
6. Explanation of the ANFIS Model and the Framework
The input of the model is based on data extracted from Beijing’s Guomao metro station. Two parameters (retention rate index and transfer efficiency index) have been selected as input for predicting the overcrowding risk level in the station, and all relevant risk factors have been considered for the input data [17]. In this research, we do not calculate the indices; however, the most important equations will be presented in the following discussion. To calculate the transfer efficiency in the station, which is an essential index (the station state), we require the transfer time (in seconds) and the transfer distance. In an ideal situation, the passenger flow and movement on the platform are a periodically repeated process associated with the departure and arrival of trains. For evaluation and analysis of the process, it has been suggested that the departure and arrival of trains at the platform is a prompt action that finishes quickly. In practice, assume a train denoted (jn−1) is departing from platform (i) with some of the targeted passengers on board. The passengers left on the platform are at the minimum density level. Then, passengers will start gathering again until they reach the maximum density level just before the arrival of the next train (jn). This process is repeated, and the density level of passengers will increase or decrease depending on train schedules and boarding see Figure 5.
It has been suggested that the transfer efficiency index in the station channel location is affected by the amount of equipment in the channel (such as stairs and escalators) [17,101,102]. If () is the walking velocity and (d) is the distance between equipment, the transfer efficiency can be calculated by the following equation:
Regarding the second index, the retention rate captures the number of passengers left at the platform waiting for the next train because of limited space on the current train. The density of these passengers reaches a maximum level depending on the size of the platform and the standard used to estimate how many people can stand in one square meter. Passengers on the platform are grouped into three periods, based on the departure and arrival of trains, assuming the process occurs with quick actions, as follows:
- Train departure
- Train arrival
- Train departure
Therefore, this retention rate of the terminal as the indicator to represent the proportion of the stranded passengers can be calculated by the equation below:
For the ith platform in jth passenger period, the are the passengers who wait on the platform and can not get in the current train, so they planned to wait for the next one. The number of stranded passengers is restrained by the total waiting passengers and boarding passengers . For every specific terminal, the stranded passengers can be calculated by a maximum number of passengers left after boarding by the equation below:
Therefore, the number of waiting passengers can be calculated as follows:
where is the stranded people in the previous period, is the passengers who check in and is the passenger who will alight to the same line in the station in period . To calculate the number of boarding passengers , many factors should be considered, such as the loading rate β and the train passenger fixed number :
To execute the ANFIS model to manage risk factors in the station, we evaluate the performance of the suggested system for overcrowding. The density level of passengers waiting at the platform can be calculated depending on the area of the platform and other factors, such as human factors (e.g., passenger belongings). Existing data from the Chinese metro (see Table 2) have been used for the model as a parameter set. We will use part of these data to train the system, and the remaining data will be used for testing the model.
Applying the ANFIS technique can combine the concepts of the ANN with FIS to design a dynamic method—referred to as soft computing. This model has a number of main features that compare to other systems and methods of risk management, as follows:
- Monitoring the station to provide early precaution of overcrowding risk,
- Flexibility in reaction to overcrowding risk,
- Comparative learning technique of station resources in response to the overcrowding risk,
- Can be an intelligent system with the perspective of the ISFMR,
- Can be based on on-hand data from digital sources, which can be gathered in real time,
- Small scale, which can be generalised for more than just overcrowding risk levels.
By selecting actual data collected from the GuoMao station of Beijing metro in China during peak hours, the model proposes a risk scale rather than a probability of risk, which has been developed in the form of a four-choice range (very unlikely, unlikely, likely, very likely). The risk case selected is congestion in the station. This will be evaluated utilising the following indexes:
- Stranded passengers (platform).
- Transfer efficiency (channel), with each level grouped to an equivalent degree of risk.
The risk level for congestion is divided into sublevels that fluctuate between the levels of the index effect. If the number of warning levels is not clear (either high or low), each group may cover a wide range, leading to an unreliable level of risk management and inaccurate responses to real conditions. Owing to its importance, the level of risk is classified into four levels with diverse colours for ease of reference. The data are related to ratio (stranded) and transfer efficiency in the station; therefore, we need to convert the feature dimension of the inputs to be based on the probability of risk level in the suggested form. Then, we obtain the covariance matrix, and the patterns and colours of the risk level are noted, as presented in (Table 3 and Table 4). The scale maintains the same range of values for each of the inputs of the model [17,90,103].
We select the overcrowding index to apply the ANFIS model to demonstrate AI application in the ISFMR. The overcrowding index for risk management is obtained from the collected data. Then, the input data are compared with the threshold level to evaluate their status in real-time, which assists the decision-maker in responding to issues at an early stage. In the case of an unexpected high number of passengers, various train loops can be arranged for conveying the passengers. In the station, passenger paths or marketing plans can be modified, depending on the capacity and the number of passengers. This process can be applied to other risks; in fact, it can be applied to overcrowding problems in other contexts. The transfer rate has been used as indicator, which relates to the density and walking velocity of passengers at a critical point in the station, such as stairs, channels, lifts, ramps, or gates [104,105,106]. We have assumed different relationships between the passenger density and velocity, such as linear, logarithmic, and triangular functions [107]. Velocity is linked to the density of travellers, and when the density reaches 2.86–5 people per m2, overcrowding might occur [108,109,110,111]. Finally, the essential density for movement is 0.92 people/m2 and the maximal moving velocity is 1.14 m/s [105]. It has been shown that the passenger velocity and density are challenge to estimate within a station setting; therefore, we have selected different indices to evaluate the risk level. Other factors that may impact the risk level are standards, operation management measures, and the size of the area [112,113,114].
7. Results and Analysis
Data were collected during the peak hour 07:30–08:30, with a super peak occurring at 07:45–08:15, and were used to calculate the retention rate. Moreover, to obtain the stranded ratio, we have considered the loading factor (1.05–1.02) for our calculations. Next, the index for the transfer efficiency from channels was calculated; this included the factors of walking velocity (1.5 m/s) and passing time (107 s). The total transfer time, including the time required to cover the distance to the platform, was 152 s. The data of the transfer efficiency show that after 08:00, the congestion remained at a steady rate, and passenger movement was smooth. The congestion risk level fluctuated between very likely and unlikely, as shown in Figure 6 and Figure 7.
For more analysis and to explore the data, we train regression models to predict data using supervised machine learning as the ISFMR framework proposed to advance dynamic risk management in railway stations. Comparison regression learner optimizable models have been conducted, and, to protect against overfitting, the cross-validation has been applied. Moreover, to minimize the model mean squared error (MSE), the model with the optimized hyperparameters has been employed (best point hyperparameters). This analysis is one of the most important statistical methods for examining the relationship between the predictor variables and responses. Four combinations of hyperparameter optimization models have been performed: regression trees, Gaussian process regression model (GPR), support vector machines (SVM), and ensembles of regression trees. The GPR assessment shows the best fit by the minimum MSE (see Table 5). Figure 8 displays the MSE at each iteration and the value of optimization results for each model, the Minimum MSE Plot, which updates as the optimization runs is shown in Figure 9.
The Neuro-Fuzzy Designer has been used as a tool for the model, design, training, and testing in Sugeno-type fuzzy inference systems. The precalculated indices and risk matrices have been utilised for training the system. We selected a partitioning method where grid partitioning is the default scheme of the FIS structure generation with ANFIS, as shown in Figure 10a. From the chosen data, datasets were applied to train the model and the residue was used for assessment and validation of the system. Moreover, for rule generation, subtractive clustering was used, and the extent of influence, squash factor, acceptance ratio, and rejection ratio were set at 0.5, 1.25, 0.5, and 0.15, respectively (see Figure 10b). The MFs can vary in number and are assigned to each input in the ANFIS model.
We have also estimated the risk indices in two segments. Figure 11. Shows the latent class estimation results assuming homogeneity between the indices and the total risk. This indicates the importance of the platform design and punctuality in train schedules and loads to meet the waiting passenger volume. A low risk level indicates a safe platform and smooth passenger flow; however, other platforms or locations may be overcrowded at the same time.
The trained FIS includes 16 rules (clusters), as presented in Figure 12. Each input has 16 Gaussian curve built-in MFs. During training in ANFIS, sets of processed data were used to perform 150 cycles of learning. To consider the relationship between the input variables (risk indices) and the output variable (risk level), several fuzzy sets were assigned to the output data using the Sugeno-type FIS method, which is illustrated in Figure 13.
The ANFIS models are evaluated based on their performance in training and testing sets. Various experiments were conducted with different MFs type inputs, the sizes of 80% of the data used to train the ANFIS and the rest as used to validate the accuracy of the model (test dataset). A random subset used for testing and RMSE values has been used to present the best membership functions and to better reflect the model performance differences [111]. For a comparison of RMSE values for the training and testing process, the experiments cover different MFs, a linear MF types output. Moreover, the mode train FIS can use the optimizer methods as either a backpropagation alone or a hybrid, which is a combination of backpropagation and the least-squares-type method to allow for the fuzzy learn from the data. The number of outputs is only one, and the grid partition method is used in establishing the rule base relationship between the input and output variable. During training with 150 epochs, the MF of dsigmf and psigmf perform the most effectively with minimum RMSE under linear MF type output with training hybrid method (see Table 6). The ANFIS models have shown significant performance variations against the evaluation criteria in terms of error and types of membership functions and the method of outputs. From all the values of RMSE, it appears that the ANFIS models are sensitive in different MFs and datasets, so the model can be learning content for the risk in the stations and provide real-time protection. The type of MF inputs, data and MF type outputs are significant for the design of the ANFIS architecture. In the future, a variety of different and long training and testing datasets will be beneficial for conducting extensive research to cover all the dynamic changes in the crowds and covering all different possibilities of risk over a long time to enhance system performance. Moreover, it has been shown that the increase in epoch numbers for a training dataset does not necessarily develop model performance significantly. The motivations behind our design of an adaptive learner model was to support the framework (Section 3: intelligent system for managing risks (ISFMR)) throughout the learning activity in real-time to capture the risk of crowding by the predictor of the passenger flow in the station and that presented that the learning application is functional and can be a reasoning tool for managing dynamic risks.
By including the ANFIS output in the system, the risk level for overcrowding can be predicted. In addition, the graph of the training error is presented in Figure 14. The model has been set up to train steps of 150 epochs with an addition of the required number of epochs, error diminishes, and error fluctuations to reach a steady state. Clearly, the small amount of training data is a significant performance variable. Moreover, one benefit is that the intended ANFIS example does not require time-consuming iterative training.
The trend of errors of the trained fuzzy system, an example of the increase in the RMSE with training and the output of the ANFIS paradigm, are shown in Figure 15. This shows that the predicted short-term risk level for both the training data and the FIS output are in excellent agreement with the exact results. The surface plot shows that the three-dimensional (3D) surface poses a challenge to the evaluation of the two indices, which have a significant impact on the expected overcrowding prediction (see Figure 16). In general, it can be inferred from the 3D diagram that the risk level increases with the increase in the index probability, which is a logical conclusion. For other risk indices, the same procedure can be followed.
This model is implemented using the selected simple-data sample obtained from the literature to reach conclusions about the effectiveness of the method. The results show the surface and counters of unsafe index levels and the impact of the index of the input obtained in risk level results. Regarding the selection of the best MF, different scenarios are considered, and the scenario with the smallest error is accepted. Regarding the performance of the designed FIS, different RMSEs are observed that indicate a perfect fit to the data.
A 3D surface of all possible values of inputs (indices) of the ANFIS model and the output corresponding to these values has been presented. Variations between the results for different MFs are evident from the 3D surface plots. The response of the 3D surface of risk level versus the indices shows deferent minimal errors depending on the MFs selected. It can be inferred from these figures that the high flow from both indices results in a high overcrowding risk level. The increase in the number of passengers on the platform or in other areas of the station will result in an increasing density, which is predictable. The ability of the prediction model is improved by increasing the size of the training and testing datasets. We can provide many 3D models for training with different MFs to create greater clarification and a more general comprehension of risk factors which need to be managed and of risk indicators in railway stations. The results of the observed data are compared with the ANFIS, as shown in Figure 17, which displays the assessment results from the ANFIS.
The above analyses elucidate that the proposed model of ANFIS can predict the risk and represent their statistical features with reasonable accuracy. In the proposed framework, the dynamic risk can be managed in real-time, which supports the decision making and reflects the speed of the reaction to manage overcrowding risks. Such a framework can use input parameters as the transfer efficiency and retention rate of the platform, in order to predict the flow safety performance. It should also be mentioned that the proposed model can provide great estimations of safety performance, especially for estimating the number of staff needed and for the advance measures of the platforms and machines at the project planning stage of the railway stations. This has to raise the importance of prediction more than any time in the past, as the crowding has led to the spread of COVID-19 and thus affected the safety, security and health concepts and strategies.
8. Conclusions
Station overcrowding indices are introduced to obtain more reliable results for risk management in real-time, leading to systematic, manageable, and identified hazardous events. Overcrowding risk prediction can be used to help analyse risk levels and ensure that a high level of safety is achieved in stations, where passenger density is one of the most critical indicators for the safety and quality of service. It can be concluded that the suggested system has the potential to provide very realistic vulnerability assessments of overcrowding in stations. Certain features, such as the relationship between risk indices, are highlighted. Furthermore, the proposed method can help create novel ways in ISFMR modelling for stations and support risk management sciences based on risk indices. Hence, the evolution of AI technology and big data makes this process more intuitive and timely for decision makers working in railway systems, and at stations in particular, contributing to more efficient outcomes than conventional approaches. The data extracted from Beijing’s Guomao metro station with the two parameters (retention rate index and transfer efficiency index) have been analysed and trained using supervised machine learning, and three optimizable models conducted: regression trees, the Gaussian process regression model (GPR), support vector machines (SVM), and ensembles of regression trees. The prediction results indicate that the Gaussian process regression model (GPR) model shows high accuracy in predicting the risk level performance where the RMSE = 0.0064, and the coefficient of determination (R2) = 1. It seems that the hyperparameter optimization model’s performance shows a high level of fit to the data. Generally, it is thought that this is due to the acceptable performance and a high accuracy modelling for estimating the level of risk. The models enhance the proposed framework for predicting the risks in real-time and supporting decision makers with low human error and learning from the history of the flow in the stations. A dynamic risk management model for railway stations using ANFIS has been developed, which can deal with active risk data indices in real-time. The ANFIS is one of the most successful techniques in terms of its ability to predict risk in railway stations. The selected model appears robust for predicting risks and aiding decision making for dynamic risk management in relation to the danger of overcrowding in railway stations and is a step toward smart future railway stations. The model has the flexibility to deal with a significant number of inputs for future research, which is not an easy task. The ANFIS appears to be more reasonable and appropriate because of its smoothness in calculating the risk levels. In addition, risk can be evaluated effectively from the source of the knowledge base built by modifying data from various sources and indices. Furthermore, the model shows faster learning and higher prediction accuracy. Risk indices are essential to reflect the actual condition of the station and indicators at the early stage of risk factors such as overcrowding. The dynamic risk management model can define risk level and aid decision makers by providing convenient and reliable results based on real-time data. In practice, the ANFIS prediction model provides a decision-support system for managing risk that can be captured through indicators or indices, which creates the rules depending on the inputs. The necessary inputs can be gathered from devices (such as sensor-based programming or CCTV), and the estimate can be calculated with the ANFIS system, generated from servers at the railway stations. Predictions of risk based on some indices can then be presented to decision makers through a web-based program. It is expected that if more data and training are passed through the ANFIS model as input, more accurate results can be obtained. Finally, decision-makers can act depending on real-time knowledge of the congestion risk levels in the station, which need to be maintained. This model promotes and improves safety relating to overcrowding risks and prevents outgrowth. Supervising the selected overcrowding signs (input variables) can prevent harmful events in many hot spots in the station, such as the platforms, ticket gates, and tunnels. From the framework of the model and the relationship between the inputs and results of the system, it is possible to generalise the method for predicting other risk factors and to simplify management by applying new rules. In future, further research will be needed to increase the usability and reliability of the proposed framework with a large scale of data and integration of the data sources to detect traffic flow risks in the stations. Finally, we hope that this study promotes further research on flow prediction in railway stations with the aim of improving decision making and public safety.
Author Contributions
H.A. and S.K. conceived and designed the analyses and critical review criteria; S.K. and M.A. analyzed the data; H.A. contributed materials/analysis advice and tools; S.K., H.A. and M.A. wrote the paper. All authors have read and agreed to the published version of the manuscript.
Funding
This research was funded by Japan Society for the Promotion of Sciences for his Invitation Research Fellowship (Long-term), Grant No. JSPS-L15701 and the European Commission for the H2020-RISE Project No. 691135 “RISEN: Rail Infrastructure Systems Engineering Network”. The APC is sponsored by MDPI’s invited paper program.
Acknowledgments
The corresponding author is sincerely grateful to the Australian Academy of Science and the Japan Society for the Promotion of Sciences for his JSPS Invitation Research Fellowship (Long-term), Grant No. JSPS-L15701 at the Railway Technical Research Institute and the University of Tokyo, Japan. The authors are also wishes to thank to the European Commission for the financial sponsorship of the H2020-RISE Project No. 691135 “RISEN: Rail Infrastructure Systems Engineering Network”, which enables a global research network that tackles the grand challenge of railway infrastructure resilience and advanced sensing in extreme environments (www.risen2rail.eu).
Conflicts of Interest
The authors declare no conflict of interest.
References
- Asada, T.; Roberts, C.; Koseki, T. An algorithm for improved performance of railway condition monitoring equipment: Alternating-current point machine case study. Transp. Res. Part C Emerg. Technol. 2013, 30, 81–92. [Google Scholar] [CrossRef]
- Chen, S.; Di, Y.; Liu, S.; Wang, B. Modelling and analysis on emergency evacuation from metro stations. Math. Probl. Eng. 2017, 2017. [Google Scholar] [CrossRef]
- Lu, K.; Han, B.; Lu, F.; Wang, Z. Urban rail transit in China: Progress report and analysis (2008–2015). Urban Rail Transit 2016, 2, 93–105. [Google Scholar] [CrossRef] [Green Version]
- Munro, A. HS2 railway, UK—Why the country needs it. Proc. Inst. Civ. Eng. Transp. 2018, 1–9. [Google Scholar] [CrossRef]
- Crompton, G.; Jupe, R. Delivering better transport? An evaluation of the ten-year plan for the railway industry. Public Money Manag. 2002, 22, 41–48. [Google Scholar] [CrossRef]
- Gavin, K.; Oslakovic, I.S.; Vajdic, M.; Puz, G.; Sporcic, V. Smart maintenance and analysis of railway transport infrastructure (smart rail). In Proceedings of the 2nd International Conference on Road and Rail Infrastructure, Dubrovnik, Croatia, 7–9 May 2012; pp. 429–435. [Google Scholar]
- Gershon, R.R.M.; Qureshi, K.A.; Barrera, M.A.; Erwin, M.J.; Goldsmith, F. Health and safety hazards associated with subways: A review. J. Urban Heal. 2005, 82, 10–20. [Google Scholar] [CrossRef] [Green Version]
- Lathia, N.; Capra, L. How Smart is your smartcard? Measuring travel behaviours, perceptions, and incentives. In Proceedings of the 13th International Conference on Ubiquitous Information Management and Communication, Beijing, China, 17–21 September 2011. [Google Scholar]
- Alawad, H.; Kaewunruen, S. Wireless sensor networks: Toward smarter railway stations. Infrastructures 2018, 3, 24. [Google Scholar] [CrossRef] [Green Version]
- Chen, M.C.; Wei, Y. Exploring time variants for short-term passenger flow. J. Transp. Geogr. 2011, 19, 488–498. [Google Scholar] [CrossRef]
- Xie, P.; Li, T.; Liu, J.; Du, S.; Yang, X.; Zhang, J. Urban flows prediction from spatiotemporal data using machine learning: A survey. Inf. Fusion 2020, 59, 1–12. [Google Scholar] [CrossRef]
- Cox, T.; Houdmont, J.; Griffiths, A. Rail passenger crowding, stress, health and safety in Britain. Transp. Res. Part A Policy Pract. 2006, 40, 244–258. [Google Scholar] [CrossRef] [Green Version]
- Kabalan, B.; Leurent, F.; Christoforou, Z.; Dubroca-Voisin, M. Framework for centralized and dynamic pedestrian management in railway stations. Transp. Res. Proc. 2017, 27, 712–719. [Google Scholar] [CrossRef]
- An, M.; Chen, Y.; Baker, C.J. A fuzzy reasoning and fuzzy-analytical hierarchy process based approach to the process of railway risk information: A railway risk management system. Inf. Sci. 2011, 181, 3946–3966. [Google Scholar] [CrossRef] [Green Version]
- Davies, A.C. Crowd monitoring using image processing. Electron. Commun. Eng. J. 1995, 7, 37–47. [Google Scholar] [CrossRef] [Green Version]
- Alawad, H.; Codru, S.; Kaewunruen, S. Complex-system decision framework for managing risks to rail stations at airports from terrorist threats. In Proceedings of the 5th International Conference on Road and Rail Infrastructure, Zadar, Croatia, 17–19 May 2018; Volume 5, pp. 855–861. [Google Scholar]
- Lu, K.; Han, B. Congestion risk evaluation and precaution of passenger flow in metro stations. Open Civ. Eng. J. 2016, 10, 93–104. [Google Scholar] [CrossRef] [Green Version]
- Zhu, B.; Liu, T.; Tang, Y. Research on pedestrian evacuation simulation based on fuzzy logic. In Proceedings of the 2008 9th International Conference on Computer-Aided Industrial Design and Conceptual Design, Kunming, China, 22–25 November 2008; pp. 1024–1029. [Google Scholar] [CrossRef]
- Ibrahim, A.M.; Venkat, I.; Subramanian, K.G.; Khader, A.T.; De Wilde, P. Intelligent evacuation management systems: A review. ACM Trans. Intell. Syst. Technol. 2016, 7. [Google Scholar] [CrossRef]
- Boulet, X.; Zargayouna, M.; Leurent, F.; Kabalan, B.; Ksontini, F. A dynamic multiagent simulation of mobility in a train station. Transp. Res. Procedia 2017, 27, 744–751. [Google Scholar] [CrossRef]
- Wei, Y.; Chen, M.-C. Forecasting the short-term metro passenger flow with empirical mode decomposition and neural networks. Transp. Res. Part C Emerg. Technol. 2012. [Google Scholar] [CrossRef]
- Tirachini, A.; Hensher, D.A.; Rose, J.M. Crowding in public transport systems: Effects on users, operation and implications for the estimation of demand. Transp. Res. Part A Policy Pract. 2013, 53, 36–52. [Google Scholar] [CrossRef]
- Katz, D.; Rahman, M. Levels of overcrowding in bus system of Dhaka, Bangladesh. Transp. Res. Record J. Transp. Res. Board 2010, 85–91. [Google Scholar] [CrossRef]
- Cheng, Y.H. Exploring passenger anxiety associated with train travel. Transportation (Amst.) 2010, 37, 875–896. [Google Scholar] [CrossRef]
- Mohd Mahudin, N.D.; Cox, T.; Griffiths, A. Measuring rail passenger crowding: Scale development and psychometric properties. Transp. Res. Part F Traffic Psychol. Behav. 2012, 15, 38–51. [Google Scholar] [CrossRef]
- Rose, W. Modelling the impact of alternative fare structures on train overcrowding. In Proceedings of the European Transport Conference, Strasbourg, France, 8–10 October 2003. [Google Scholar]
- Zhang, Y.; Han, J.; Liu, J.; Zhou, T.; Suni, J.; Luo, J. Safety prediction of rail transit system based on deep learning. In Proceedings of the 16th IEEE/ACIS International Conference on Computer and Information Science, Wuhan, China, 24–26 May 2017; pp. 851–856. [Google Scholar]
- Ma, S.; Weng, J.; Wang, C.; Alivanistos, D.; Lin, P. Bus passenger flow congestion risk evaluation model based on the pressure-state-response framework: A case study in Beijing. Artic. Sci. Prog. Sci. Prog. 2020, 103, 1–14. [Google Scholar] [CrossRef] [PubMed]
- Ning, Y.; Huang, Y.; Li, J.; Liu, Q.; Yang, D.; Zheng, W.; Liu, H. ST-DRN: Deep residual networks for spatio-temporal metro stations crowd flows forecast. In Proceedings of the 2018 International Joint Conference on Neural Networks (IJCNN), Rio de Janeiro, Brazil, 8–13 July 2018. [Google Scholar] [CrossRef]
- Lu, L.; Peng, H. Research on urban rail transit operation safety evaluation system based on ISM. In Proceedings of the APCIM & ICTTE 2018, Beijing, China, 21–23 December 2018; pp. 72–75. [Google Scholar]
- Dinmohammadi, F.; Alkali, B.; Shafiee, M.; Bérenguer, C.; Labib, A. Risk evaluation of railway rolling stock failures using FMECA technique: A case study of passenger door system. Urban Rail Transit 2016, 2, 128–145. [Google Scholar] [CrossRef] [Green Version]
- Lan, Y.J.; Han, B.M.; Li, D.W. Research on safety risk assessment of large-scale railway passenger station. Appl. Mech. Mater. 2013, 361–363, 1923–1926. [Google Scholar] [CrossRef]
- Huang, Z.; Xu, R.; Zhou, F. A multilevel fuzzy comprehensive evaluation model for operation safety of the large high-speed railway passenger station. In Proceedings of the 2017 4th International Conference on Transportation Information and Safety, Banff, AB, Canada, 8–10 August 2017; pp. 844–851. [Google Scholar]
- Liu, Y.; Wang, T.; Ding, H.; Wu, Z. Research and application on risk assessment DEA model of crowd crushing and trampling accidents in subway stations. Proc. Eng. 2012, 43, 494–498. [Google Scholar]
- Xu, H.; Zhang, Y.; Li, H.; Skitmore, M.; Yang, J.; Yu, F. Safety risks in rail stations: An interactive approach. J. Rail Transp. Plan. Manag. 2019, 11, 100148. [Google Scholar] [CrossRef]
- Zhang, X.; Deng, Y.; Li, Q.; Skitmore, M.; Zhou, Z. An incident database for improving metro safety: The case of shanghai. Saf. Sci. 2016, 84, 88–96. [Google Scholar] [CrossRef] [Green Version]
- Gu, X.; Zhang, L.; Li, D.; Ma, L. Analysis on operation risk factors of urban rail transit based on fuzzy analytical hierarchy process. In Proceedings of the 2012 International Conference on Information Management, Innovation Management and Industrial Engineering, Sanya, China, 20–21 October 2012; Volume 3, pp. 214–218. [Google Scholar]
- Zhang, H.; Sun, Q. An integrated MCDM approach to train derailment risk response strategy selection. Symmetry (Basel) 2020, 12, 47. [Google Scholar] [CrossRef] [Green Version]
- Sun, Y.; Zhang, G.; Yin, H. Passenger flow prediction of subway transfer stations based on nonparametric regression model. Discret. Dyn. Nat. Soc. 2014, 2014. [Google Scholar] [CrossRef]
- Tu, Q.; Weng, J.C.; Wang, C. A dynamic identification method of passenger flow congestion risk in rail transit hub station based on grey clustering. In Proceedings of the 2017 4th International Conference on Transportation Information and Safety, Banff, AB, Canada, 8–10 August 2017; pp. 806–811. [Google Scholar]
- Huang, W.; Zhang, Y. Railway dangerous goods transportation system risk assessment: An approach combining FMEA with pessimistic–optimistic fuzzy information axiom considering acceptable risk coefficient. IEEE Trans. Reliab. 2020. [Google Scholar] [CrossRef]
- Tang, S.; Gao, H. Traffic-incident detection-algorithm based on nonparametric regression. IEEE Trans. Intell. Transp. Syst. 2005, 6, 38–42. [Google Scholar] [CrossRef]
- Gong, Y.; Li, Z.; Zhang, J.; Liu, W.; Zheng, Y. Online spatio-temporal crowd flow distribution prediction for complex metro system. IEEE Trans. Knowl. Data Eng. 2020, 1. [Google Scholar] [CrossRef]
- Guo, J.; Xie, Z.; Qin, Y.; Jia, L.; Wang, Y. Short-term abnormal passenger flow prediction based on the fusion of SVR and LSTM. IEEE Access 2019, 7, 42946–42955. [Google Scholar] [CrossRef]
- Zhang, Q.; Zhuang, Y.; Wei, Y.; Jiang, H.; Yang, H. Railway safety risk assessment and control optimization method based on FTA-FPN: A case study of chinese high-speed railway station. J. Adv. Transp. 2020, 2020. [Google Scholar] [CrossRef]
- Guo, J.; Xie, Z.; Li, Q.; Zhan, S.; Xu, J. Railway passenger flow recognition algorithm for terminal station based on cost theory and automatic frequency control. IEEE Access 2020, 8, 26885–26892. [Google Scholar] [CrossRef]
- Heidarysafa, M.; Kowsari, K.; Barnes, L.; Brown, D. Analysis of railway accidents’ narratives using deep learning. In Proceedings of the 17th IEEE International Conference on Machine Learning and Applications, Orlando, FL, USA, 17–20 December 2018; pp. 1446–1453. [Google Scholar]
- Li, Y.; Wang, X.; Sun, S.; Ma, X.; Lu, G. Forecasting short-term subway passenger flow under special events scenarios using multiscale radial basis function networks. Transp. Res. Part C Emerg. Technol. 2017, 77, 306–328. [Google Scholar] [CrossRef]
- Alawad, H.; Kaewunruen, S.; An, M. Learning from accidents: Machine learning for safety at railway stations. IEEE Access 2020, 8, 633–648. [Google Scholar] [CrossRef]
- Hua, L.; Zheng, W.; Gao, S. Extraction and analysis of risk factors from Chinese railway accident reports. In Proceedings of the 2019 IEEE Intelligent Transportation Systems Conference, ITSC, Auckland, New Zealand, 27–30 October 2019; pp. 869–874. [Google Scholar]
- Liu, P.; Xie, M.; Bian, J.; Li, H.; Song, L. A hybrid PSO–SVM model based on safety risk prediction for the design process in metro station construction. Int. J. Environ. Res. Public Health 2020, 17, 1714. [Google Scholar] [CrossRef] [Green Version]
- Noor Syeda, K.; Noorulhassan Shirazi, S.; Asad Ali Naqvi, S.; Parkinson, H.J.; Bamford, G. Big Data and Natural Language Processing for Analysing Railway Safety. In Innovative Applications of Big Data in the Railway Industry; IGI Global Publishing: Hershey, PA, USA, 2017. [Google Scholar]
- Coppola, P.; Silvestri, F. Assessing travelers’ safety and security perception in railway stations. Case Stud. Transp. Policy 2020. [Google Scholar] [CrossRef]
- Gintschel, S.; Kirawanich, P. A risk-based analysis of design practices in regard to passenger hazard exposure in open mass transit stations. Urban Rail Transit 2020, 6, 15–27. [Google Scholar] [CrossRef] [Green Version]
- Ying, M.; Kaminishi, K.; Duysters, G.; De Hoyos, A.; Takala, J.; Yusof, R. The Safety Risk Assessment of Railway Station under Terrorist Attacks Based on AHP, 2016; ISBN 9787562956600.
- Ding, X.; Yang, X.; Hu, H.; Liu, Z. The safety management of urban rail transit based on operation fault log. Saf. Sci. 2017, 94, 10–16. [Google Scholar] [CrossRef]
- Chen, W.; Zhang, Y.; Khasawneh, M.T.; Geng, Z. Risk analysis on Beijing metro operation initiated by human factors. J. Transp. Saf. Secur. 2019, 11, 683–699. [Google Scholar] [CrossRef]
- Peng, W.; Lin, Z. Research on risk assessment of railway freight station based on nonlinear combination of ahp-entropy. In Proceedings of the 2018 15th International Conference on Service Systems and Service Management, ICSSSM, Hangzhou, China, 21–22 July 2018. [Google Scholar]
- Liu, Y.; Liu, Z.; Jia, R. DeepPF: A deep learning based architecture for metro passenger flow prediction. Transp. Res. Part C Emerg. Technol. 2019, 101, 18–34. [Google Scholar] [CrossRef]
- Lv, Y.; Duan, Y.; Kang, W.; Li, Z.; Wang, F.Y. Traffic flow prediction with big data: A deep learning approach. IEEE Trans. Intell. Transp. Syst. 2015, 16, 865–873. [Google Scholar] [CrossRef]
- Jiang, R.; Song, X.; Wang, Z.; Huang, D.; Song, X.; Kim, K.S.; Xia, T.; Cai, Z.; Shibasaki, R. Deepurbanevent: A system for predicting citywide crowd dynamics at big events. In Proceedings of the 25th ACM SIGKDD International Conference on Knowledge Discovery & Data Mining, Anchorage, AK, USA, 4–8 August 2019; pp. 2114–2122. [Google Scholar] [CrossRef]
- Alawad, H.; Kaewunruen, S.; An, M. A Deep Learning Approach Towards Railway Safety Risk Assessment. IEEE Access 2020, 8, 102811–102832. [Google Scholar] [CrossRef]
- Lopez, A.J.; Semanjski, I.; Gautama, S.; Ochoa, D. Assessment of smartphone positioning data quality in the scope of citizen science contributions. Mob. Inf. Syst. 2017, 2017. [Google Scholar] [CrossRef] [Green Version]
- Van Den Heuvel, J.P.A.; Hoogenraad, J.H. Monitoring the performance of the pedestrian transfer function of train stations using automatic fare collection data. Transp. Res. Procedia 2014, 2, 642–650. [Google Scholar] [CrossRef] [Green Version]
- Van Den Heuvel, J.; Voskamp, A.; Daamen, W.; Hoogendoorn, S.P. Using bluetooth to estimate the impact of congestion on pedestrian route choice at train stations. In Traffic and Granular Flow ‘13; Springer International Publishing: Cham, Switzerland, 2015; pp. 73–82. [Google Scholar]
- Ganansia, F.; Carincotte, C.; Descamps, A.; Chaudy, C. A promising approach to people flow assessment in railway stations using standard CCTV networks. In Proceedings of the Transport Research Arena (TRA), Paris, France, 14–17 April 2014; pp. 1–10. [Google Scholar]
- Kaewunruen, S.; Alawad, H.; Cotruta, S. A Decision Framework for Managing the Risk of Terrorist Threats at Rail Stations Interconnected with Airports. Safety 2018, 4, 36. [Google Scholar] [CrossRef] [Green Version]
- Ceapa, I.; Smith, C.; Capra, L. Avoiding the crowds: Understanding Tube station congestion patterns from trip data. In Proceedings of the ACM SIGKDD International Conference on Knowledge Discovery and Data Mining, Beijing, China, 12–16 August 2012; pp. 134–141. [Google Scholar]
- Health and Safety Laboratory. Health and Safety Effects of Crowding; Rail Safety and Standards Board: London, UK, 2005.
- Rail Safety and Standards Board Limited. RIS-3703-TOM/3:2017—Passenger Train Dispatch and Platform Safety Measures; Rail Safety and Standards Board: London, UK, 2017. [Google Scholar]
- Helbing, D.; Johansson, A.; Al-Abideen, H.Z. Dynamics of crowd disasters: An empirical study. Phys. Rev. E Stat. Nonlinear, Soft Matter Phys. 2007, 75. [Google Scholar] [CrossRef] [PubMed] [Green Version]
- Feng, S.; Shen, C.; Xia, N.; Song, W.; Fan, M.; Cowling, B.J. Rational use of face masks in the COVID-19 pandemic. Lancet Respir. Med. 2020, 8, 434–436. [Google Scholar] [CrossRef]
- Helbing, D.; Molnár, P. Social force model for pedestrian dynamics. Phys. Rev. E 1995, 51, 4282–4286. [Google Scholar] [CrossRef] [Green Version]
- Ning, B.; Dong, H.R.; Wen, D.; Li, L.; Cheng, C.J. ACP-based control and management of urban rail transportation systems. IEEE Intell. Syst. 2011, 26, 84–88. [Google Scholar] [CrossRef]
- Dindar, S.; Kaewunruen, S.; An, M. Rail accident analysis using large-scale investigations of train derailments on switches and crossings: Comparing the performances of a novel stochastic mathematical prediction and various assumptions. Eng. Fail. Anal. 2019, 103, 203–216. [Google Scholar] [CrossRef]
- Dindar, S.; Kaewunruen, S.; An, M. Bayesian network-based human error reliability assessment of derailments. Reliab. Eng. Sys. Safe. 2020, 197, 106825. [Google Scholar] [CrossRef]
- Mohd Mahudin, N.D.; Cox, T.; Griffiths, A. Modelling the spillover effects of rail passenger crowding on individual well being and organisational behaviour. WIT Trans. Built Environ. 2011, 116, 227–238. [Google Scholar] [CrossRef] [Green Version]
- Negnevitsky, M. Artificial Intelligence—A Guide to Intelligent Systems; Addison Wesley: Boston, MA, USA, 2002; Volume 110, ISBN 0321204662. [Google Scholar]
- Jang, J.S.R. Self-learning fuzzy controllers based on temporal back propagation. IEEE Trans. Neural Networks 1992, 3, 714–723. [Google Scholar] [CrossRef] [Green Version]
- Jang, J.S.R. ANFIS: Adaptive-network-based fuzzy inference system. IEEE Trans. Syst. Man Cybern. 1993, 23, 665–685. [Google Scholar] [CrossRef]
- Mitra, S.; Hayashi, Y.; Member, S. Neuro-fuzzy rule generation: Survey in soft computing network. IEEE Trans. Neural Netw. 2000, 11, 748–768. [Google Scholar] [CrossRef] [Green Version]
- Feng, G. A survey on analysis and design of model-based fuzzy control systems. IEEE Trans. Fuzzy Syst. 2006, 14, 676–697. [Google Scholar] [CrossRef] [Green Version]
- Shihabudheen, K.V.; Pillai, G.N. Recent advances in neuro-fuzzy system: A survey. Knowl. Based Syst. 2018, 152, 136–162. [Google Scholar] [CrossRef]
- Nelles, O. Nonlinear System Identification; Springer: Heidelberg/Berlin, Germany, 2001; ISBN 3540673695. [Google Scholar]
- Vieira, J.; Dias, F.; Mota, A. Neuro-fuzzy systems: A survey. WSEAS Trans. Syst. 2004, 3, 414–419. [Google Scholar]
- Ebrat, M.; Ghodsi, R. Construction project risk assessment by using adaptive-network-based fuzzy inference system: An empirical study. KSCE J. Civ. Eng. 2014, 18, 1213–1227. [Google Scholar] [CrossRef]
- Zhu, W.; Cao, D. Expressway management risk evaluation based on fuzzy neural networks. In Proceedings of the 2009 Second International Conference on Intelligent Computation Technology and Automation, Changsha, Hunan, China, 10–11 October 2009; pp. 700–703. [Google Scholar] [CrossRef]
- Şamandar, A. A model of adaptive neural-based fuzzy inference system (ANFIS) for prediction of friction coefficient in open channel flow. Sci. Res. Essays 2011, 6, 1020–1027. [Google Scholar] [CrossRef]
- Zhou, Q.; Wong, Y.D.; Loh, H.S.; Yuen, K.F. ANFIS model for assessing near-miss risk during tanker shipping voyages. Marit. Policy Manag. 2019, 46, 377–393. [Google Scholar] [CrossRef]
- Osman, M.; Kaewunruen, S. Value of rescheduling of rail inspection. Proc. Inst. Mech. Eng. Part F J. Rail Rapid Transit 2020, 234, 321–330. [Google Scholar] [CrossRef]
- Öztaysi, B.; Behret, H.; Kabak, Ö.; Sarı, I.U.; Kahraman, C. Fuzzy inference systems for disaster response. In Decision Aid Models for Disaster Management and Emergencies; Atlantis Press: Paris, France, 2013; pp. 75–94. [Google Scholar]
- Ebrat, M.; Ghodsi, R. Risk assessment of construction projects using network based adaptive fuzzy system. Int. J. Acad. Res. 2011, 3, 411–417. [Google Scholar]
- Zhao, J.; Bose, B.K. Evaluation of membership functions for fuzzy logic controlled induction motor drive. In Proceedings of the IEEE 2002 28th Annual Conference of the Industrial Electronics Society, IECON 02, Sevilla, Spain, 5–8 November 2002; pp. 229–234. [Google Scholar] [CrossRef]
- Nedjah, N.; Mourelle, L.d.M. Fuzzy Systems Engineering: Theory and Practice; Springer: Heidelberg/Berlin, Germany, 2006. [Google Scholar]
- Kaur, A.; Kaur, A. Comparison of Mamdani-type and Sugeno-type fuzzy inference systems for air conditioning system. Int. J. Soft Comput. Eng. 2012, 2, 323–325. [Google Scholar]
- Shoorehdeli, M.A.; Teshnehlab, M.; Sedigh, A.K.; Khanesar, M.A. Identification using ANFIS with intelligent hybrid stable learning algorithm approaches and stability analysis of training methods. Appl. Soft Comput. J. 2009, 9, 833–850. [Google Scholar] [CrossRef]
- Takagi, T.; Sugeno, M. Fuzzy identification of systems and its applications to modeling and control. IEEE Trans. Syst. Man Cybern. 1985, SMC-15, 116–132. [Google Scholar] [CrossRef]
- Kumar, S.; Taheri, F. Neuro-fuzzy approaches for pipeline condition assessment. Nondestruct. Test. Eval. 2007, 22, 35–60. [Google Scholar] [CrossRef]
- Kaynak, S.; Evirgen, H.; Kaynak, B. Adaptive neuro-fuzzy inference system in predicting the success of student’s in a particular course. Int. J. Comput. Theory Eng. 2014, 7, 34–39. [Google Scholar] [CrossRef] [Green Version]
- Babuška, R.; Verbruggen, H. Neuro-fuzzy methods for nonlinear system identification. Annu. Rev. Control 2003, 27, 73–85. [Google Scholar] [CrossRef]
- Li, J.P. Train station passenger flow study. Winter Simul. Conf. Proc. 2000, 2, 1173–1176. [Google Scholar] [CrossRef]
- Wang, S.W.; Sun, L.S.; Rong, J.; Yang, Z.F. Transit station congestion index research based on pedestrian simulation and gray clustering evaluation. Discret. Dyn. Nat. Soc. 2013, 2013. [Google Scholar] [CrossRef]
- Gu, Z.; Osaragi, T.; Lu, W. Simulating pedestrians’ spatio-temporal distribution in underground spaces. Sustain. Cities Soc. 2019, 48, 101552. [Google Scholar] [CrossRef]
- Seer, S.; Bauer, D.; Brändle, N.; Ray, M. Estimating pedestrian movement characteristics for crowd control at public transport facilities. In Proceedings of the 2008 11th International IEEE Conference on Intelligent Transportation Systems, Beijing, China, 12–15 October 2008; pp. 742–747. [Google Scholar] [CrossRef]
- Fang, Z.; Yuan, J.P.; Wang, Y.C.; Lo, S.M. Survey of pedestrian movement and development of a crowd dynamics model. Fire Saf. J. 2008, 43, 459–465. [Google Scholar] [CrossRef]
- Hankin, B.D.; Wright, R.A. Passenger flow in subways. J. Oper. Res. Soc. 1958, 9, 81–88. [Google Scholar] [CrossRef]
- Smith, R.A. Density, velocity and flow relationships for closely packed crowds. Saf. Sci. 1995, 18, 321–327. [Google Scholar] [CrossRef]
- Li, Z.; Hensher, D.A. Crowding in public transport: A review of objective and subjective measures. J. Public Transp. 2013, 16, 107–134. [Google Scholar] [CrossRef]
- Løvås, G.G. Modeling and simulation of pedestrian traffic flow. Transp. Res. Part B 1994, 28, 429–443. [Google Scholar] [CrossRef]
- Ye, J.H.; Chen, X.; Yang, C.; Wu, J. Walking behavior and pedestrian flow characteristics for different types of walking facilities. Transp. Res. Rec. 2008, 43–51. [Google Scholar] [CrossRef]
- Armstrong, J.S.; Collopy, F. Error measures for generalizing about forecasting methods: Empirical comparisons. Int. J. Forecast. 1992, 8, 69–80. [Google Scholar] [CrossRef] [Green Version]
- Binti Sa’adin, S.L.; Kaewunruen, S.; Jaroszweski, D. Operational readiness for climate change of Malaysia high-speed rail. Proc. Inst. Civ. Eng. Transp. 2016, 169, 308–320. [Google Scholar] [CrossRef]
- Sresakoolchai, J.; Kaewunruen, S. Comparative studies into public private partnership and traditional investment approaches on The High-Speed Rail Project Linking 3 Airports in Thailand. Transp. Res. Int. Persp. 2020, 5, 100116. [Google Scholar] [CrossRef]
- Kaewunruen, S.; Sussman, J.M.; Matsumoto, A. Grand challenges in transportation and transit systems. Front. Built Environ. 2016, 2, 1–5. [Google Scholar] [CrossRef] [Green Version]
Figure 1.
Process framework suggested for the Intelligent System for Managing Risks (ISFMR) in the railway stations.
Figure 1.
Process framework suggested for the Intelligent System for Managing Risks (ISFMR) in the railway stations.
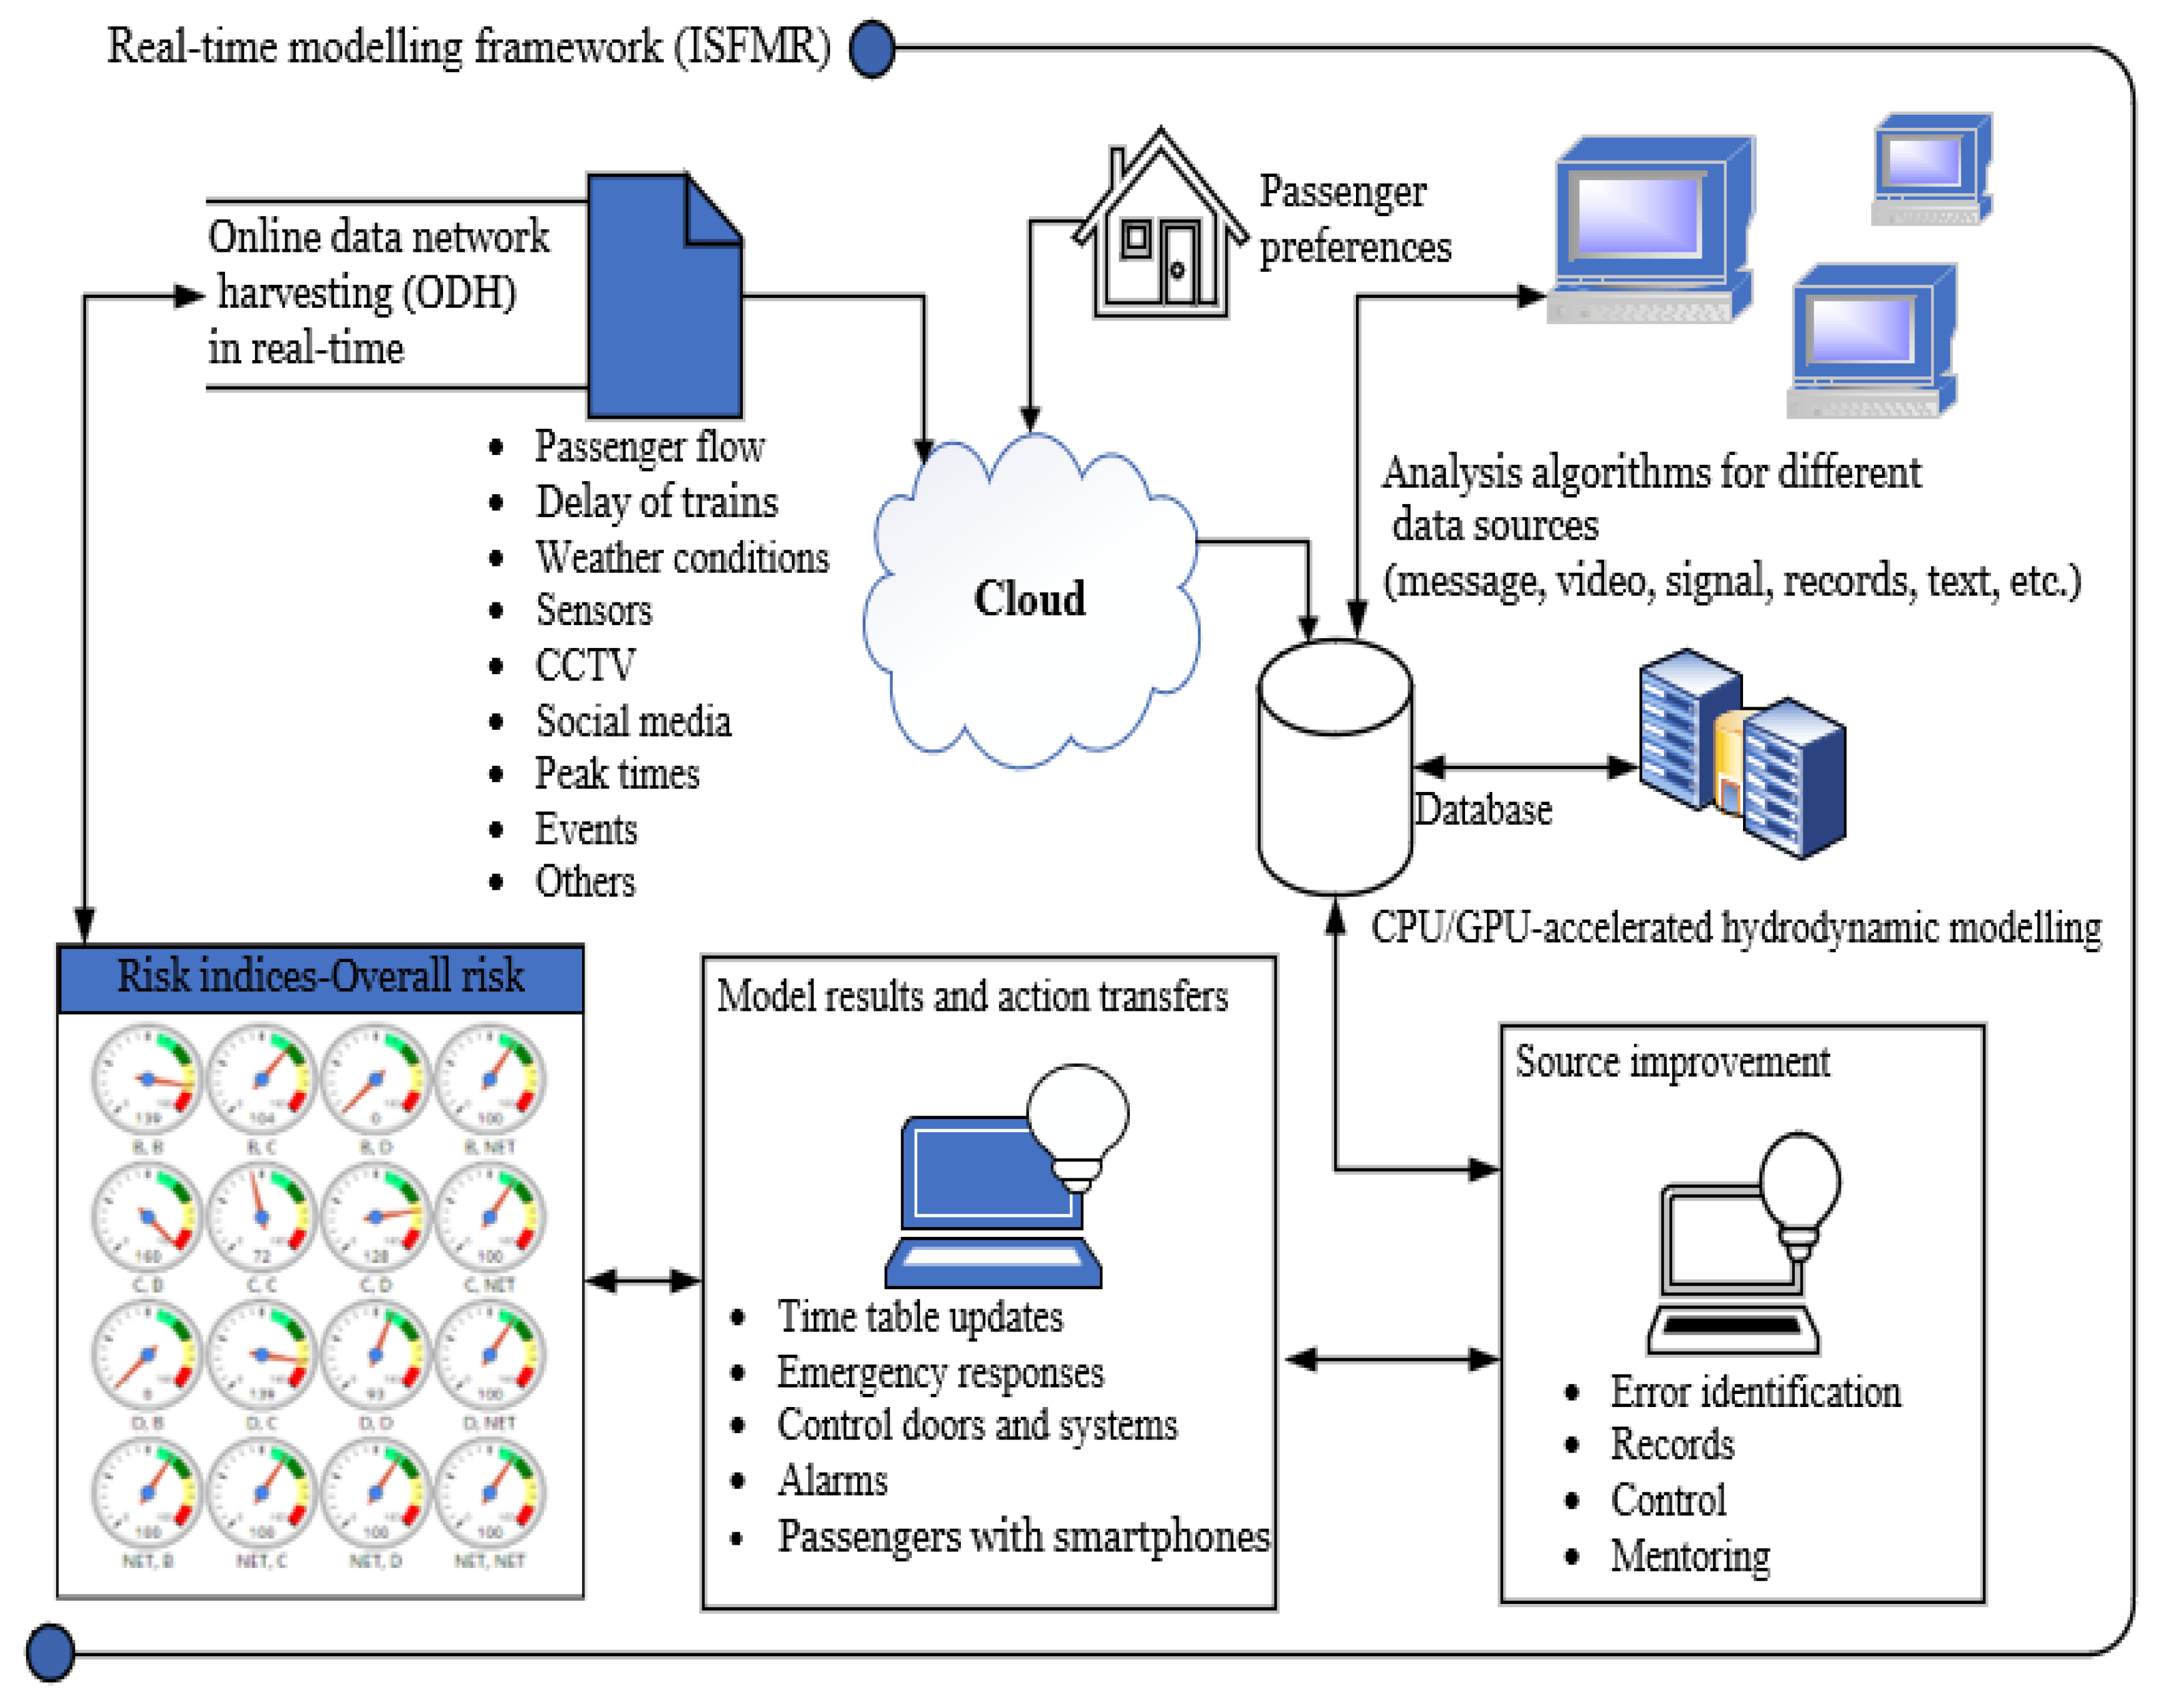
Figure 2.
Proposed Fuzzy logic inference system for risk management in railway stations.
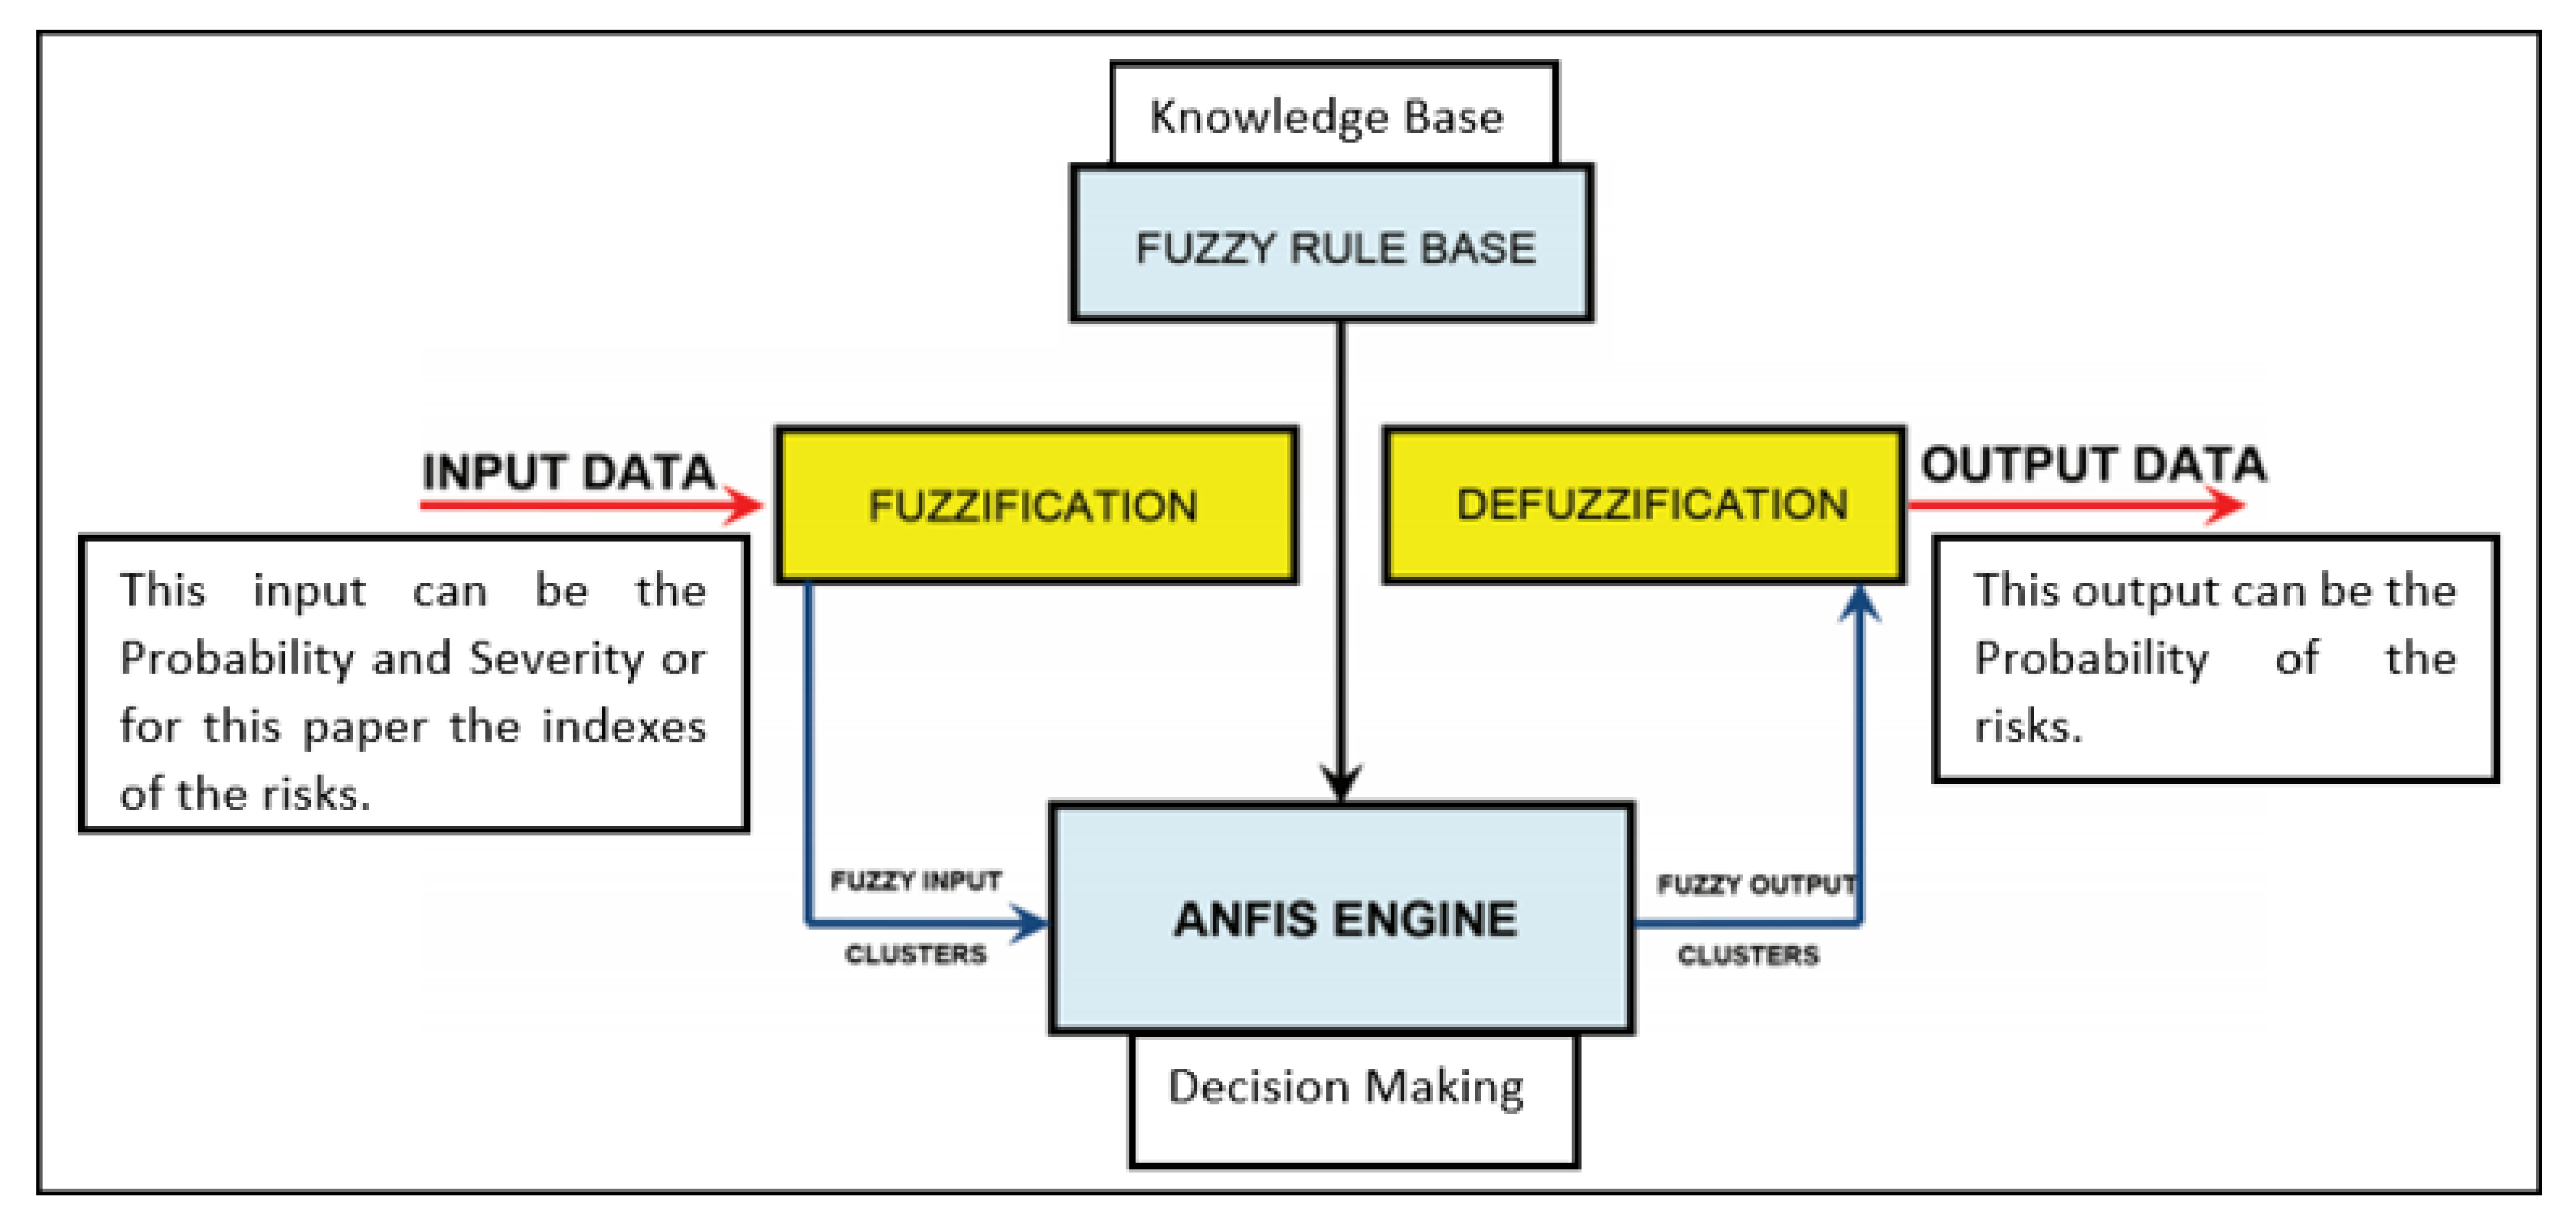
Figure 3.
ANFIS architecture of a two-input model with four rules.
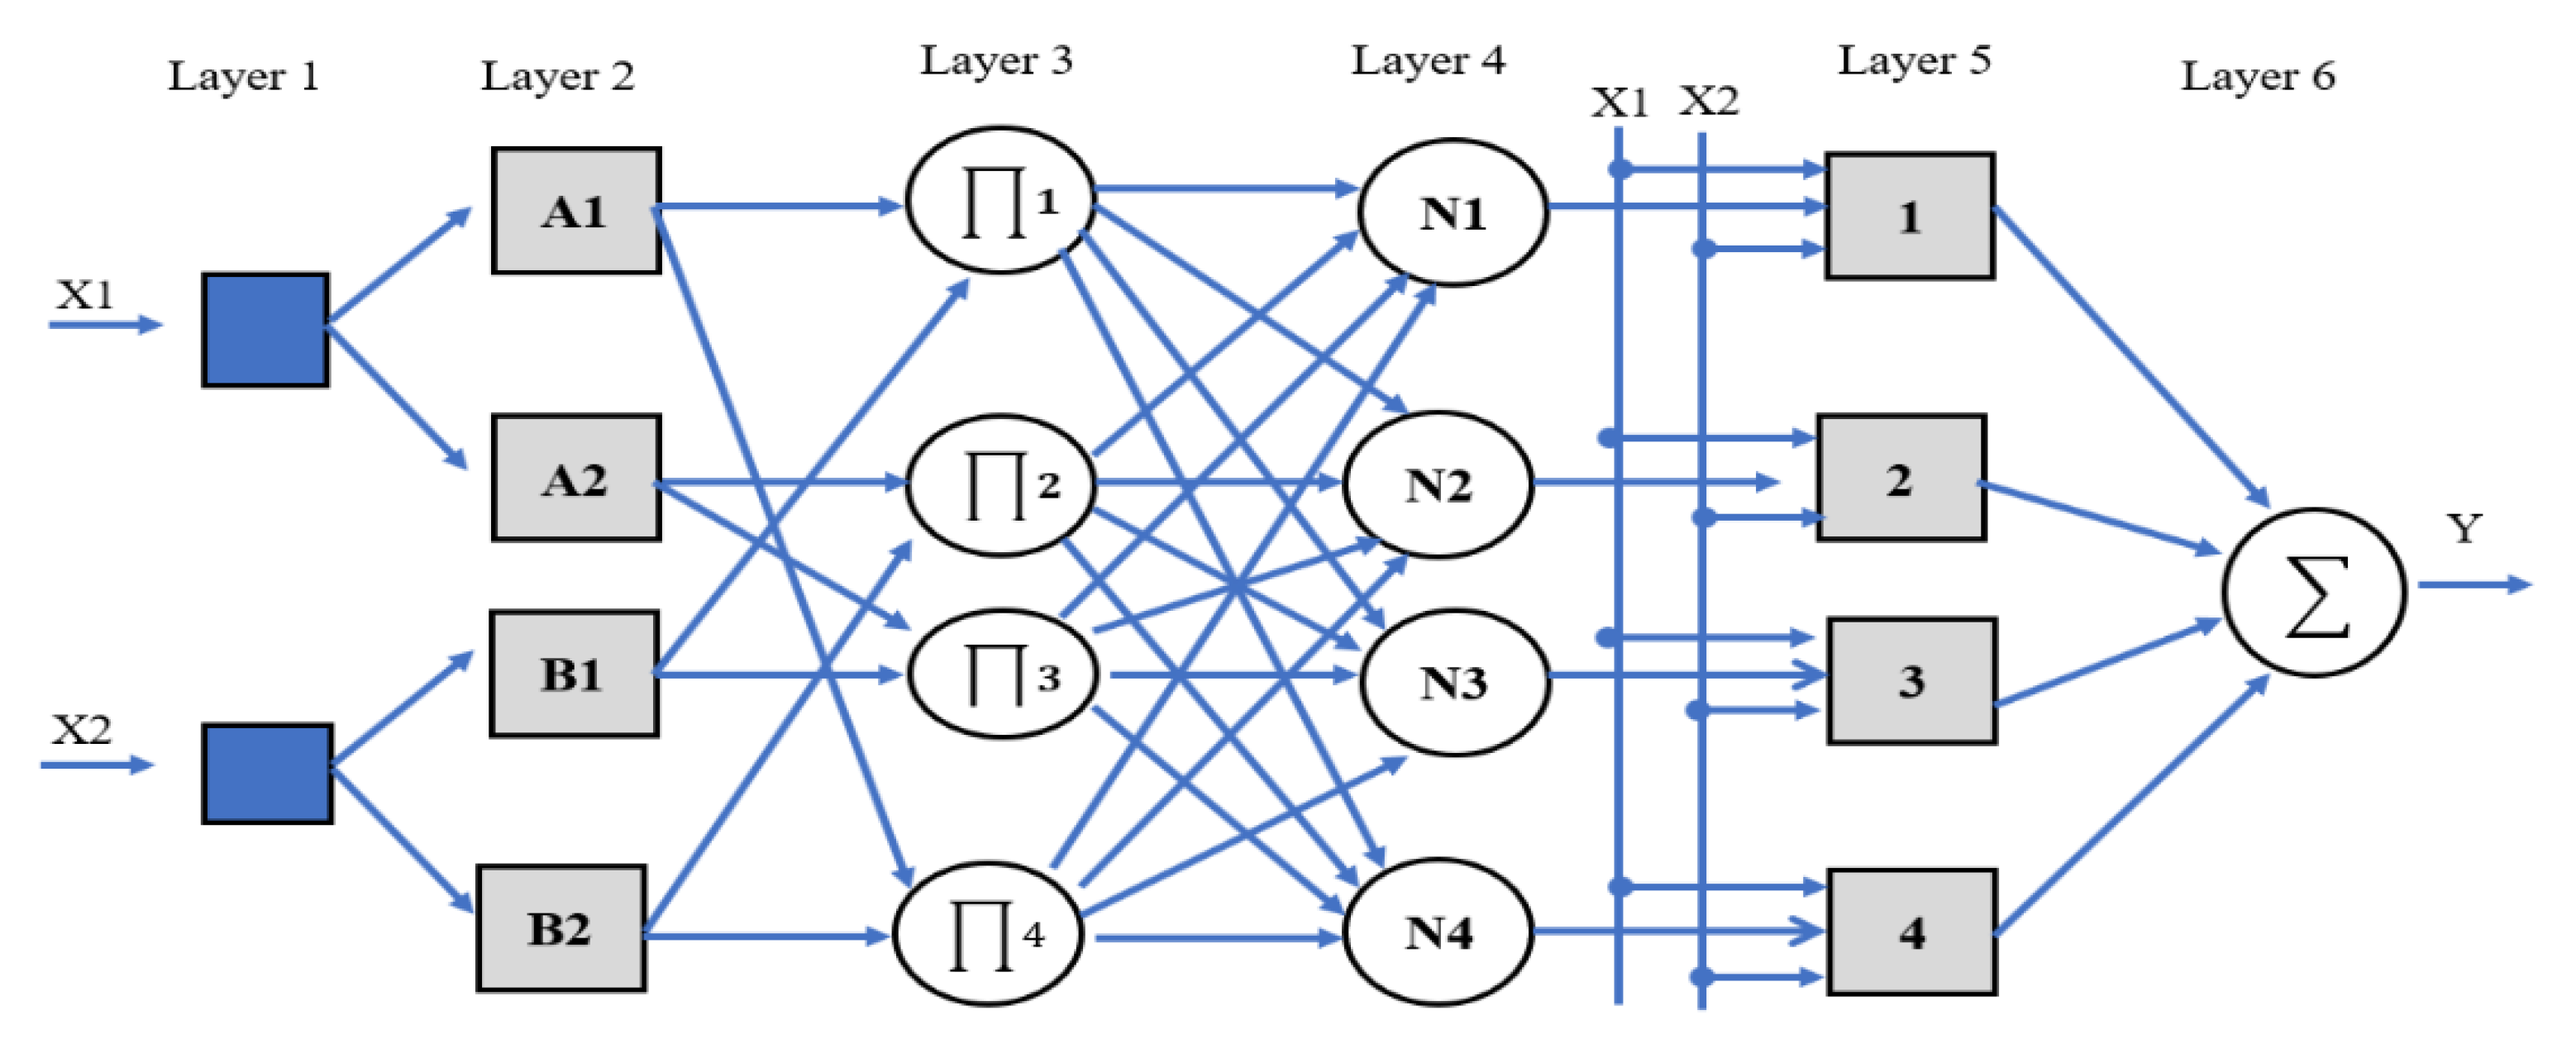
Figure 4.
ANFIS with 5 layers of neurons.
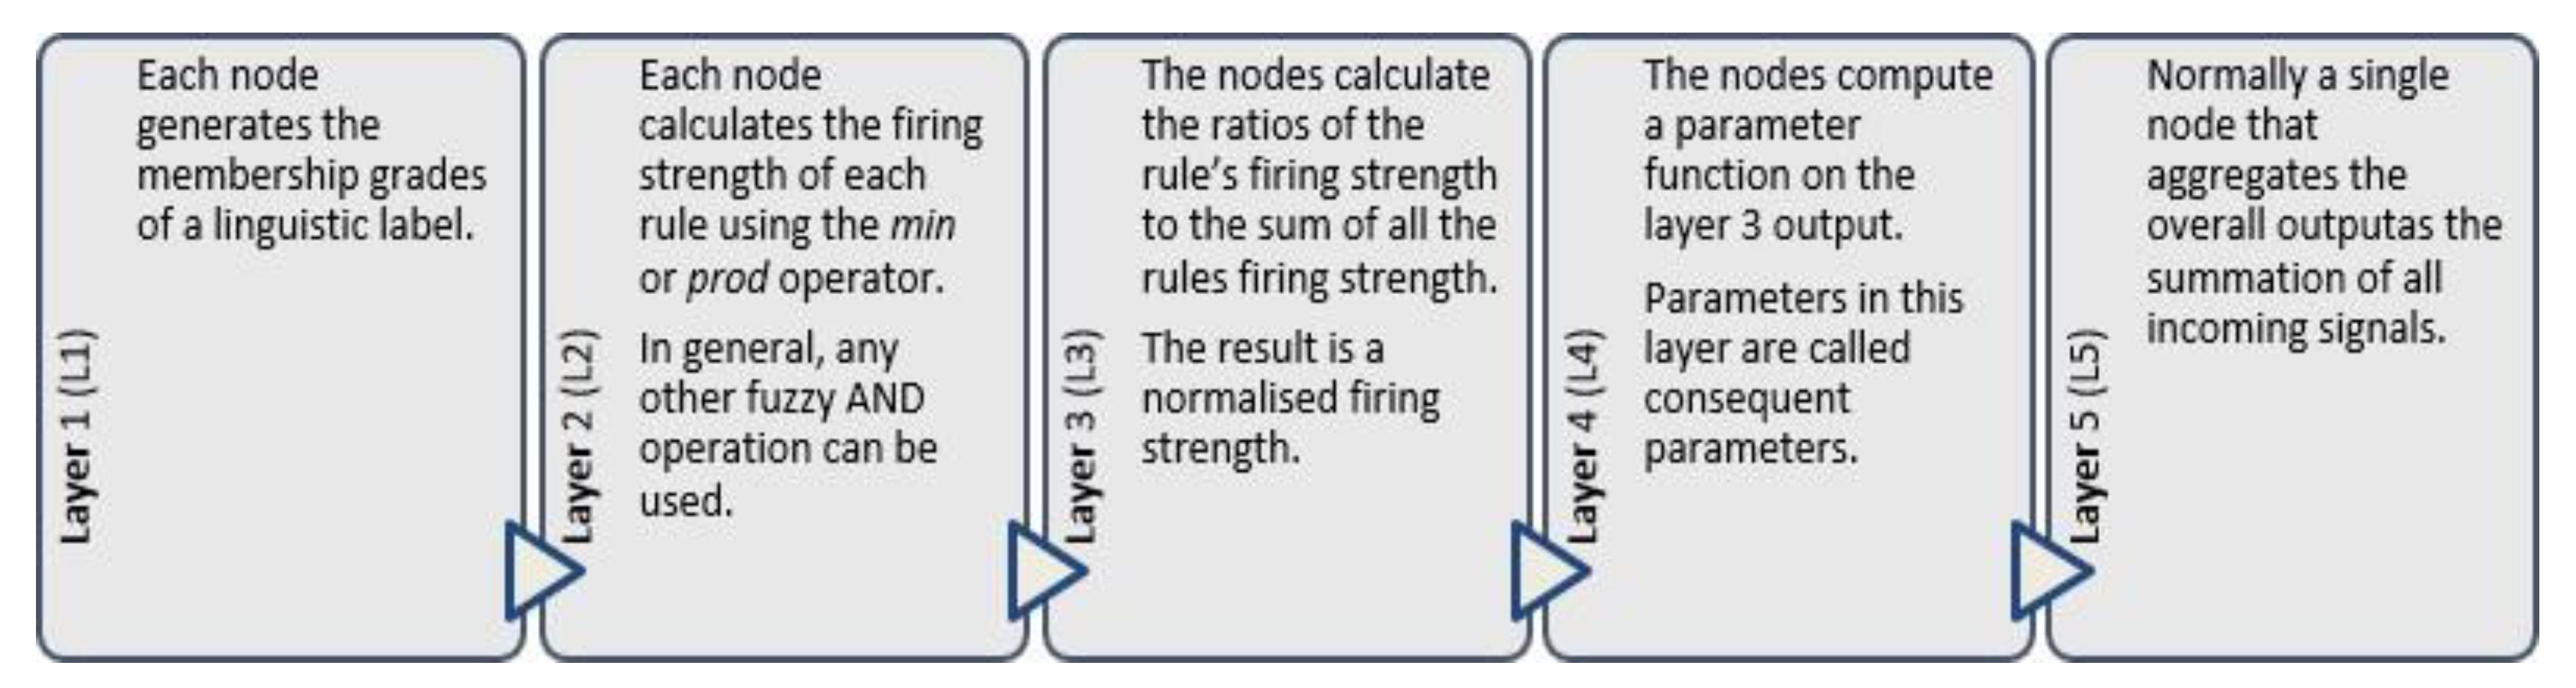
Figure 5.
Three-dimensional diagram of an ideal platform with simple train movement and timelines.
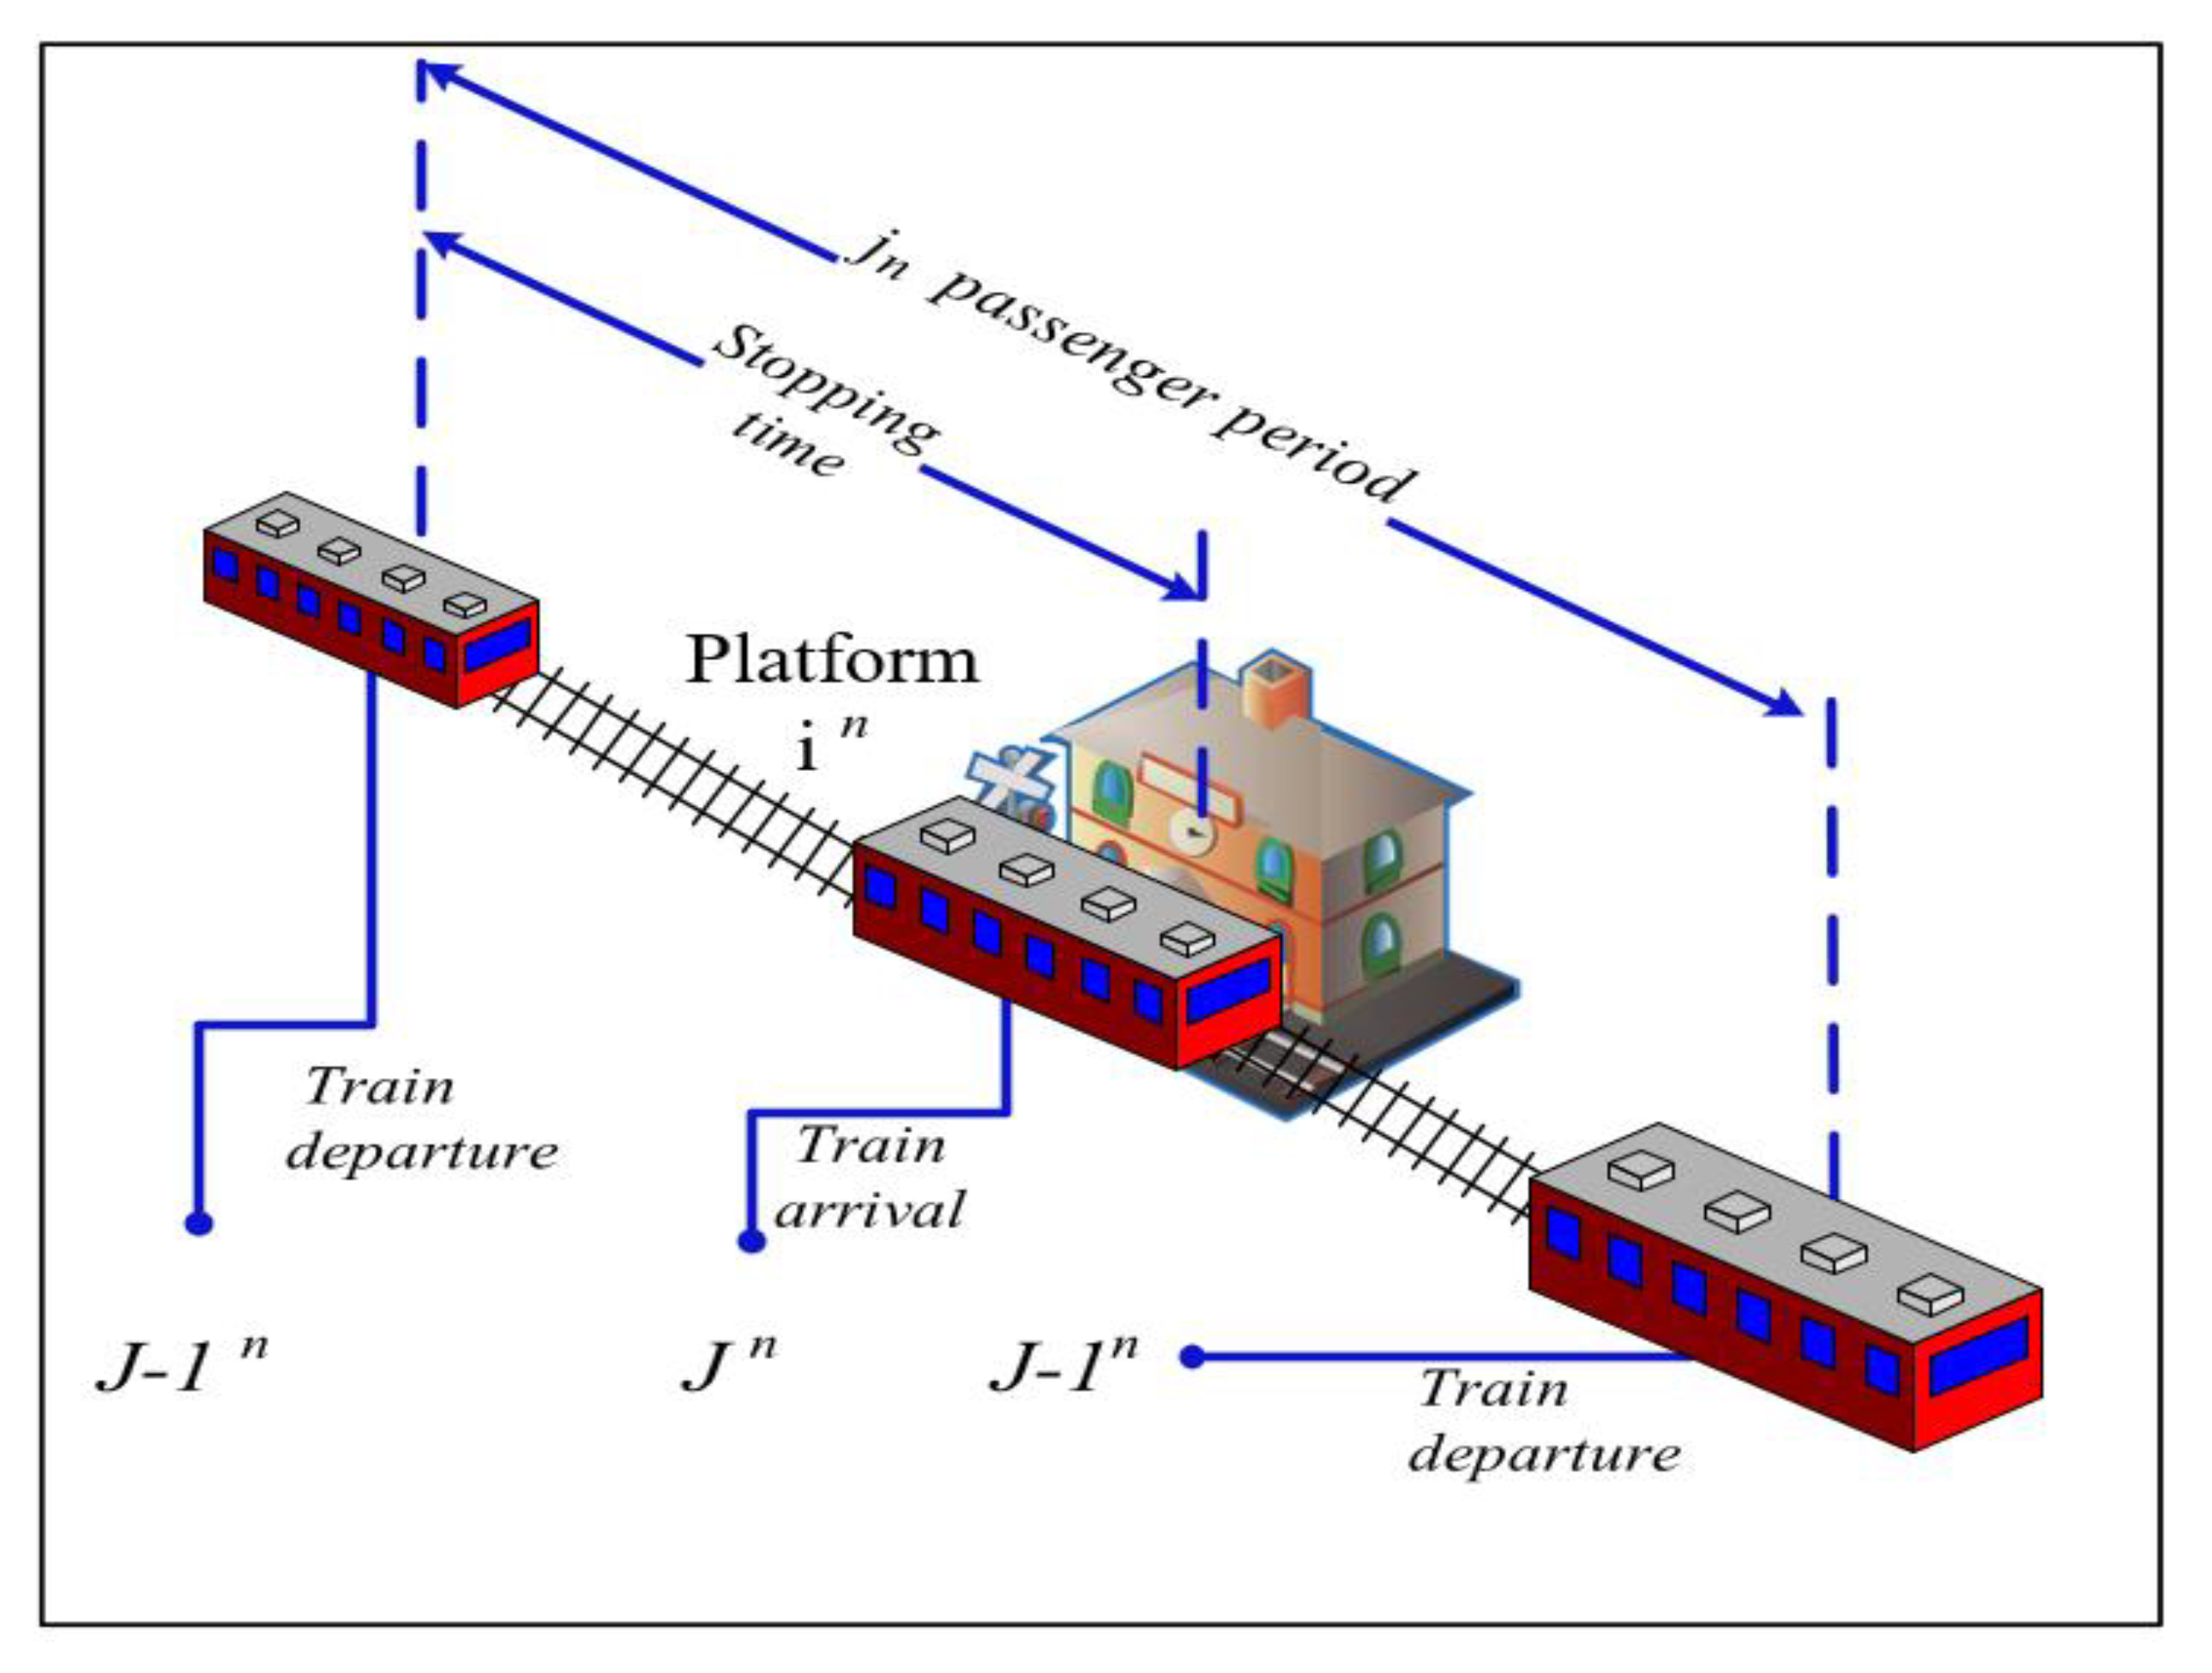
Figure 6.
Correlations between the inputs and the risk level.
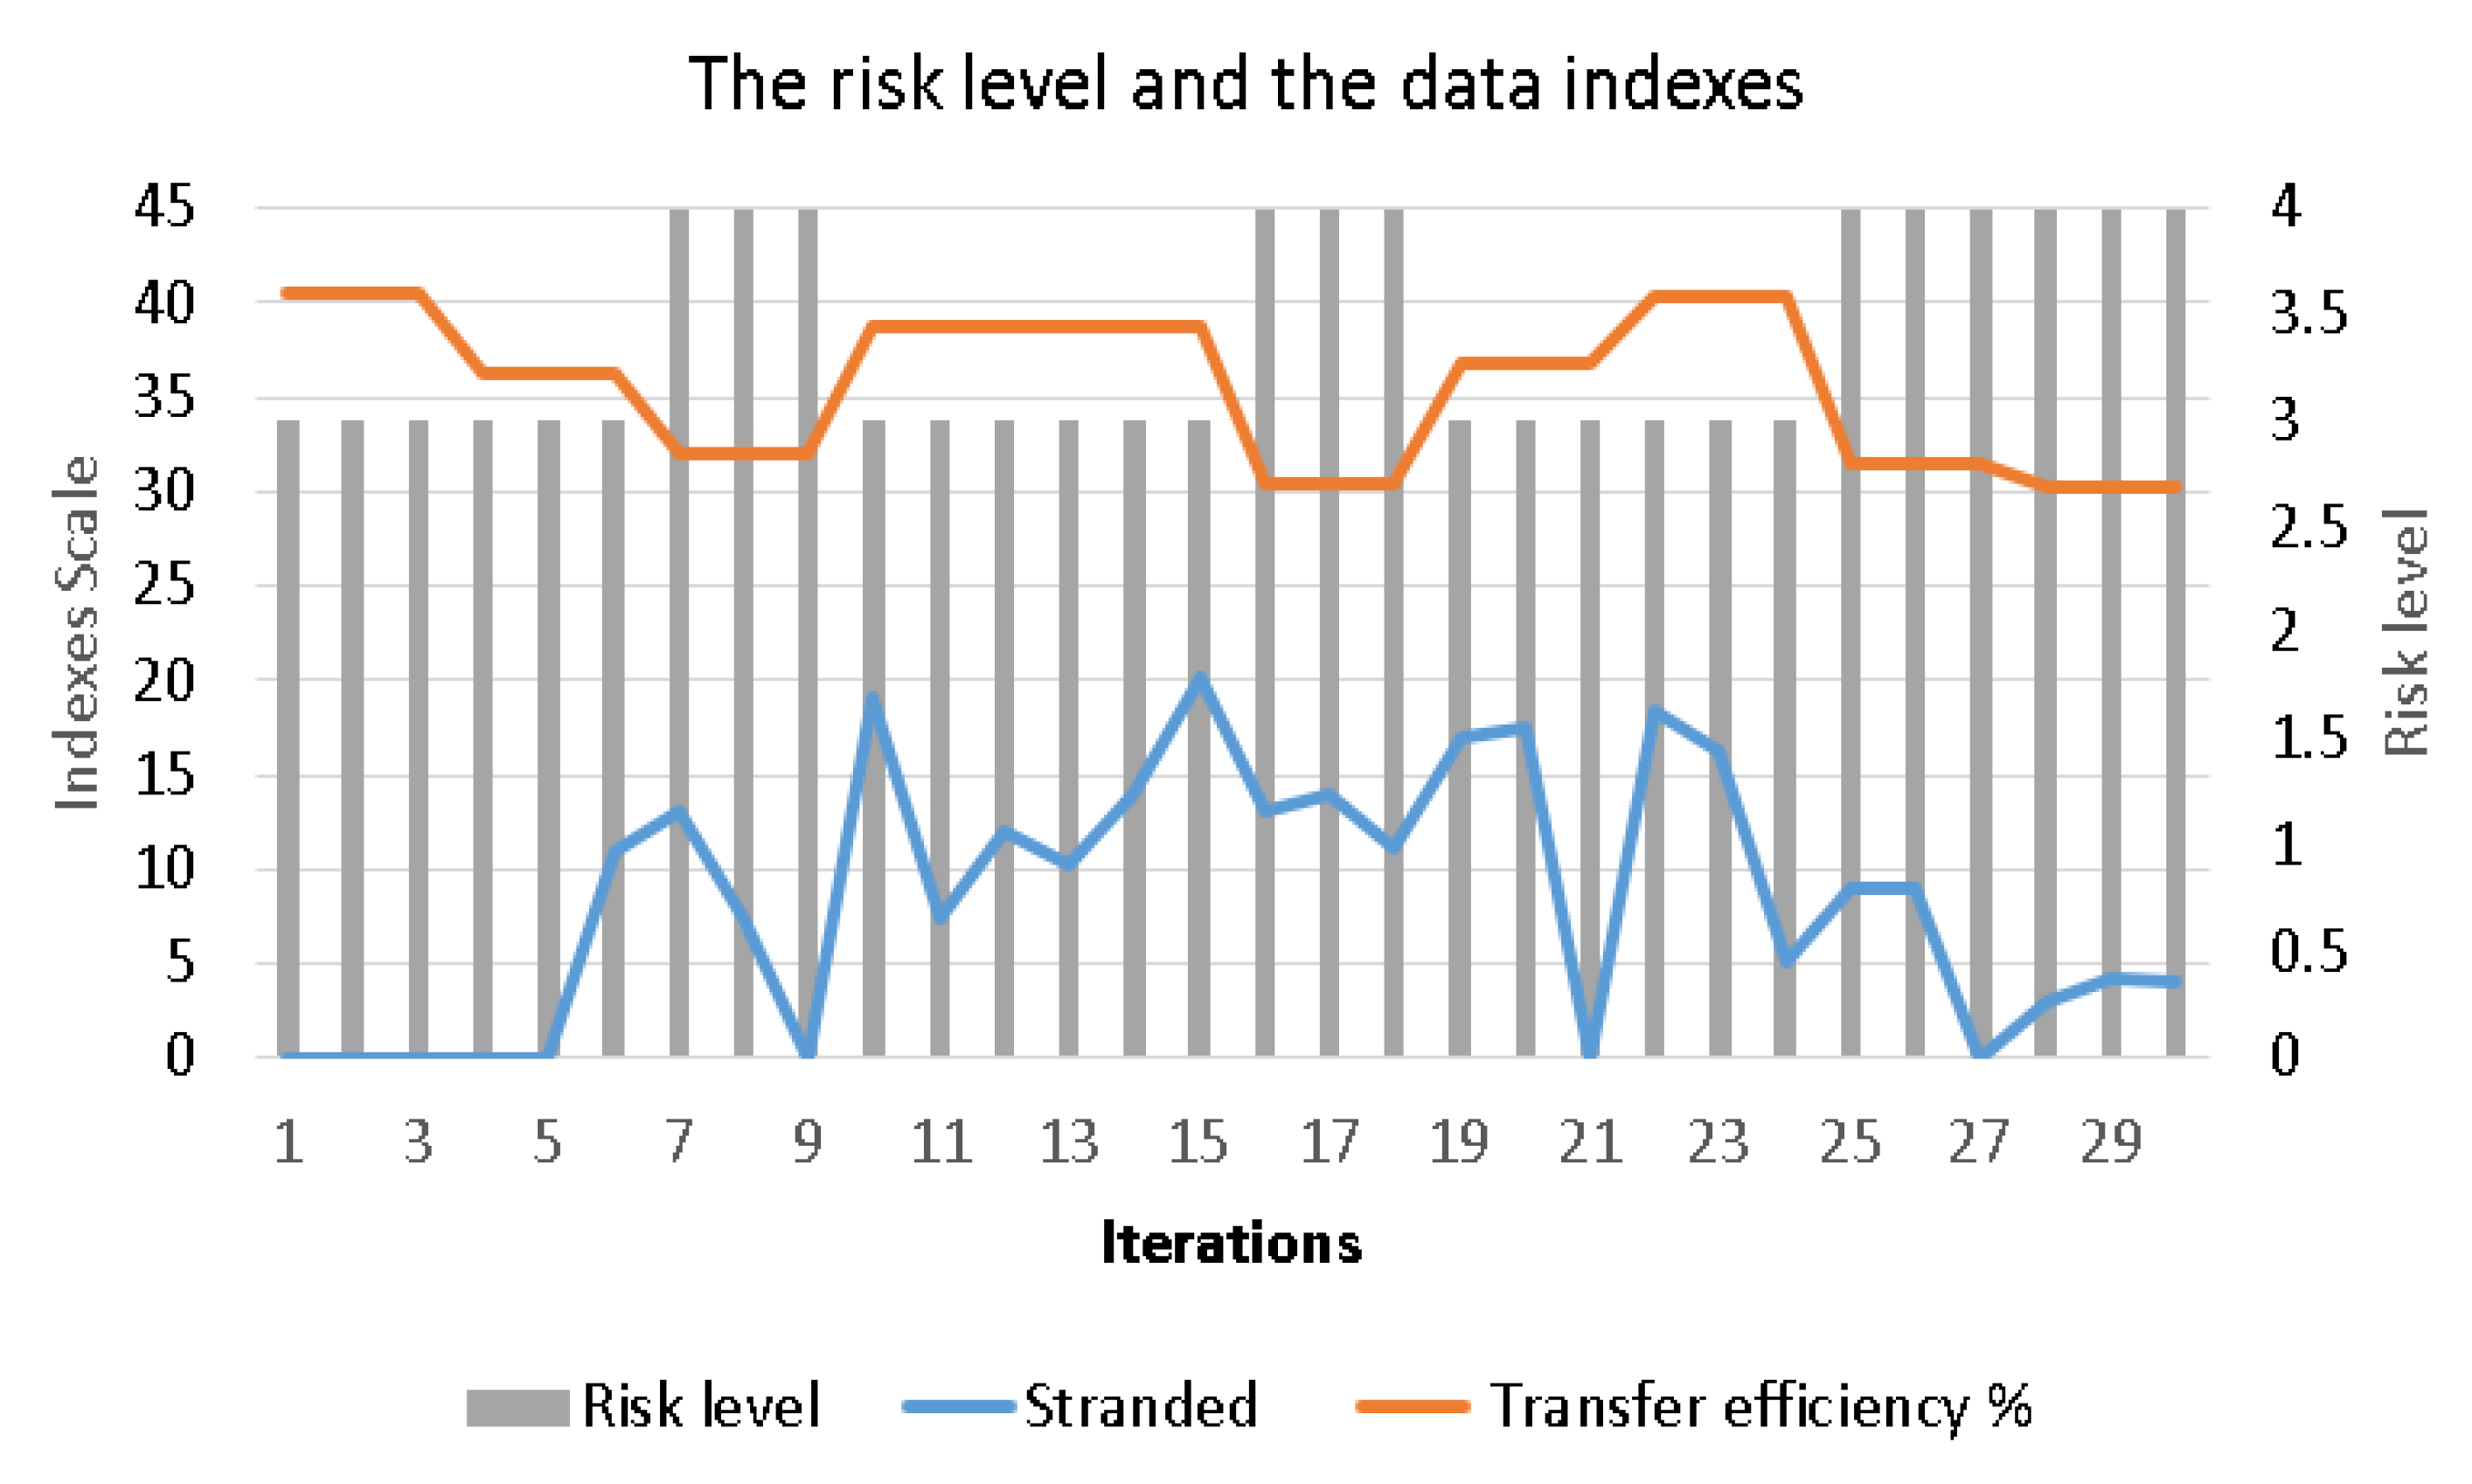
Figure 7.
Results of latent class analysis with two segments and 25 samples.
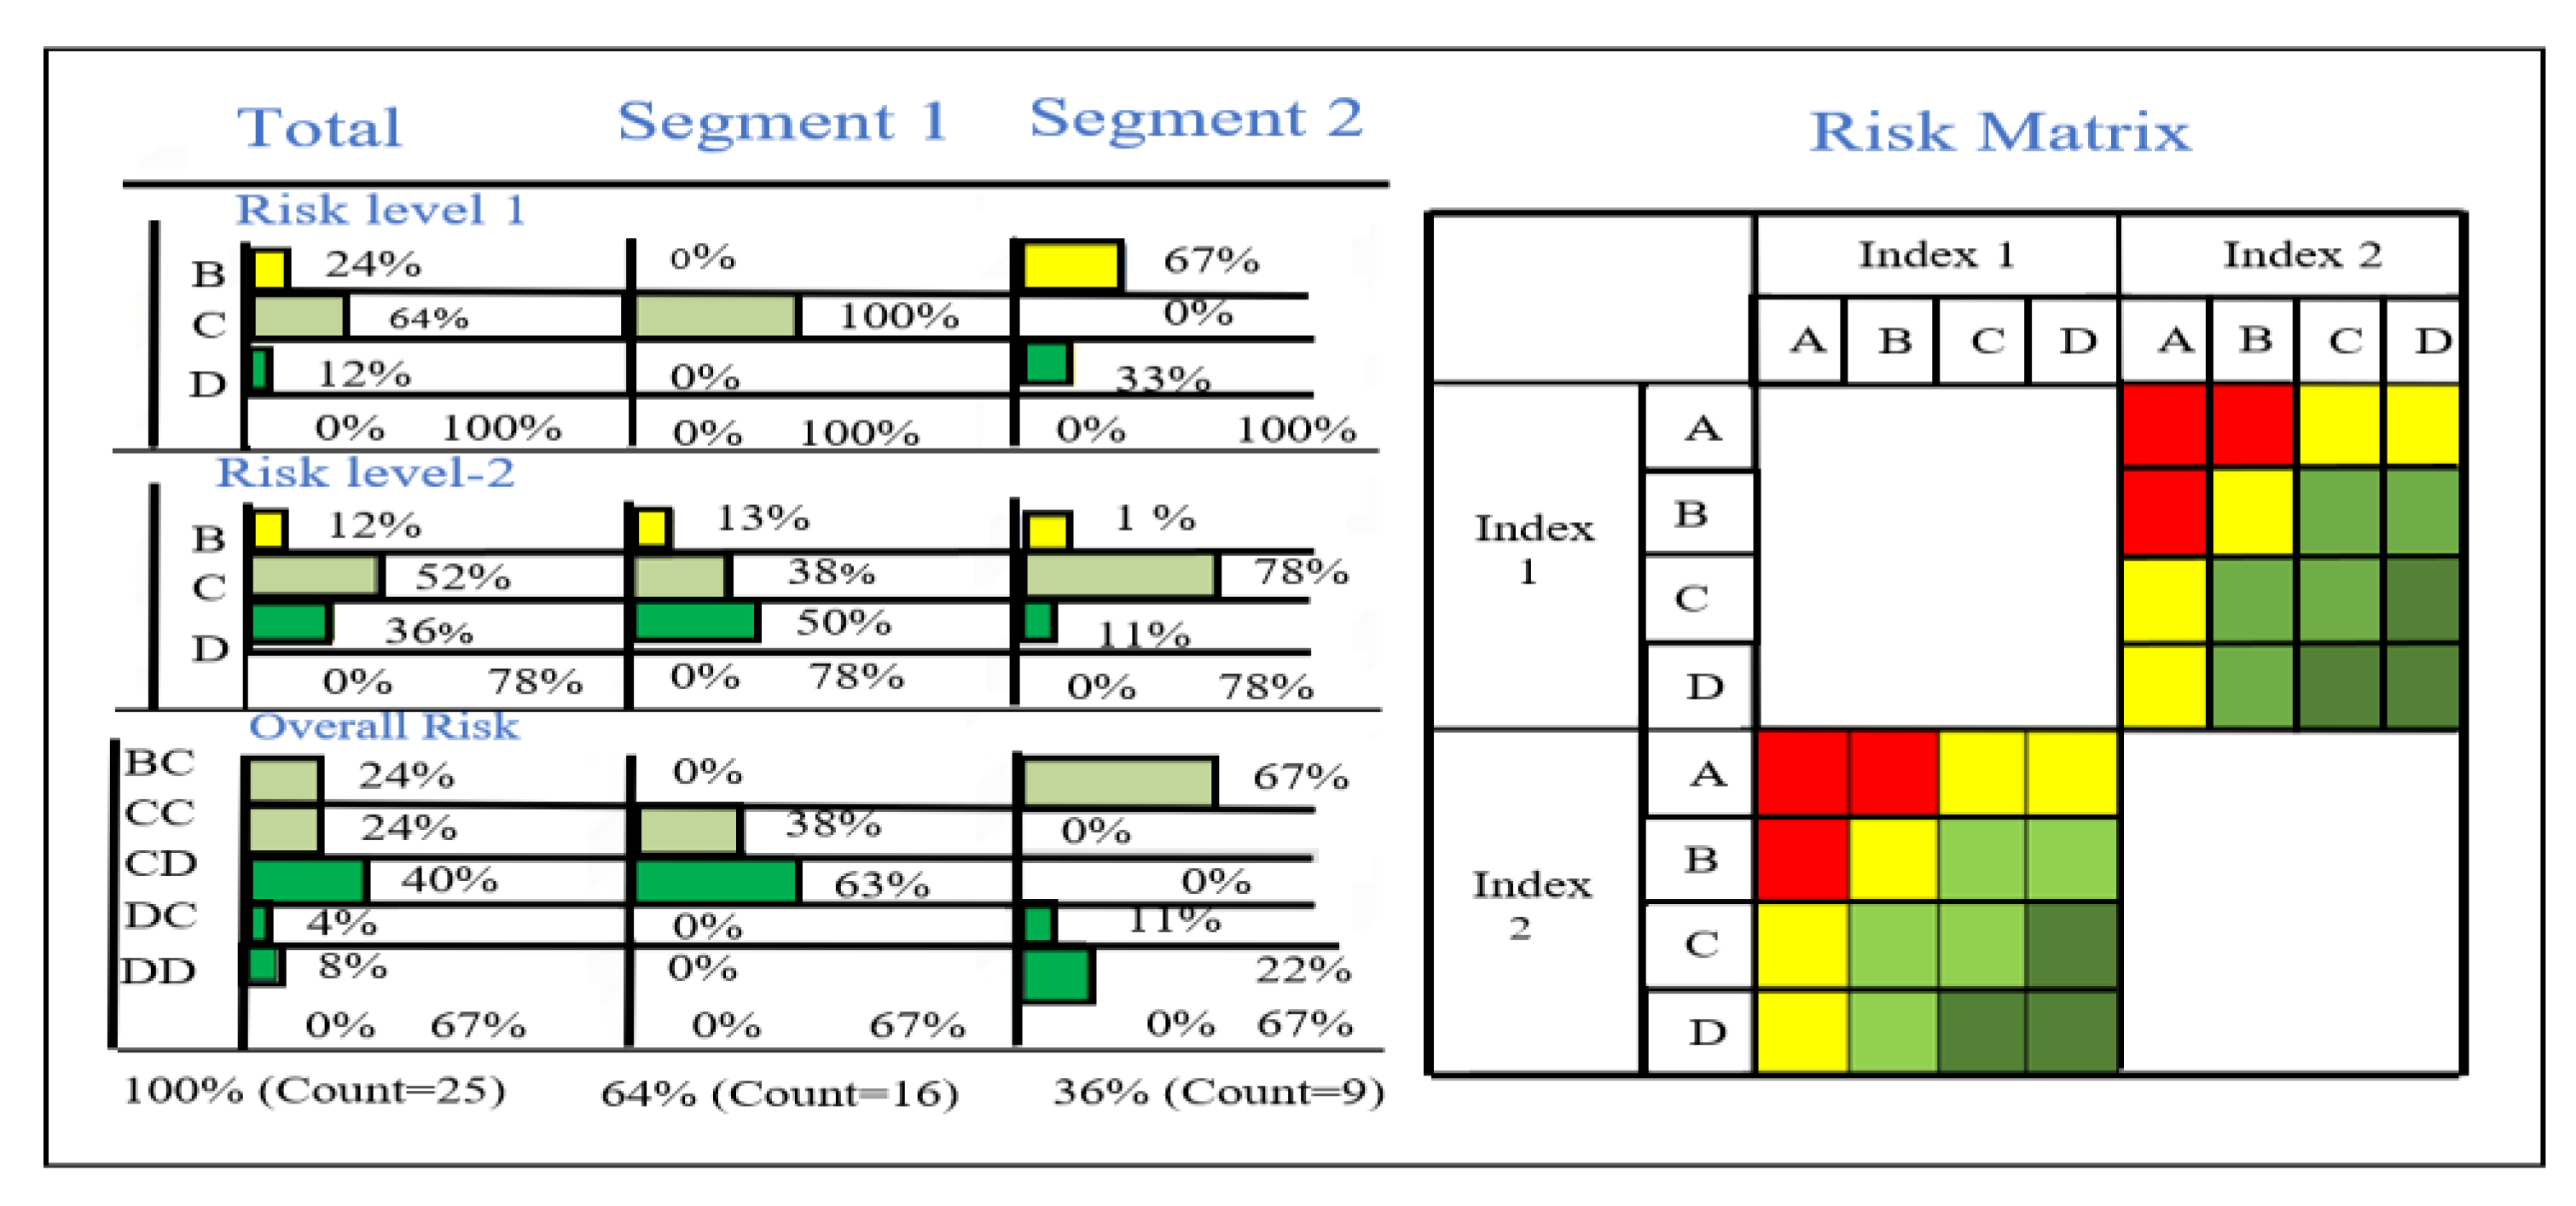
Figure 8.
Multi-comparison performances scatter plots of the predicted and actual values for different types of regression learner optimizable models: (a) prediction (Optimizable SVM), (b) prediction (Optimizable Tree), (c) prediction (Optimizable Gaussian Process Regression Model (GPR)) and (d) prediction (Optimizable Ensemble).
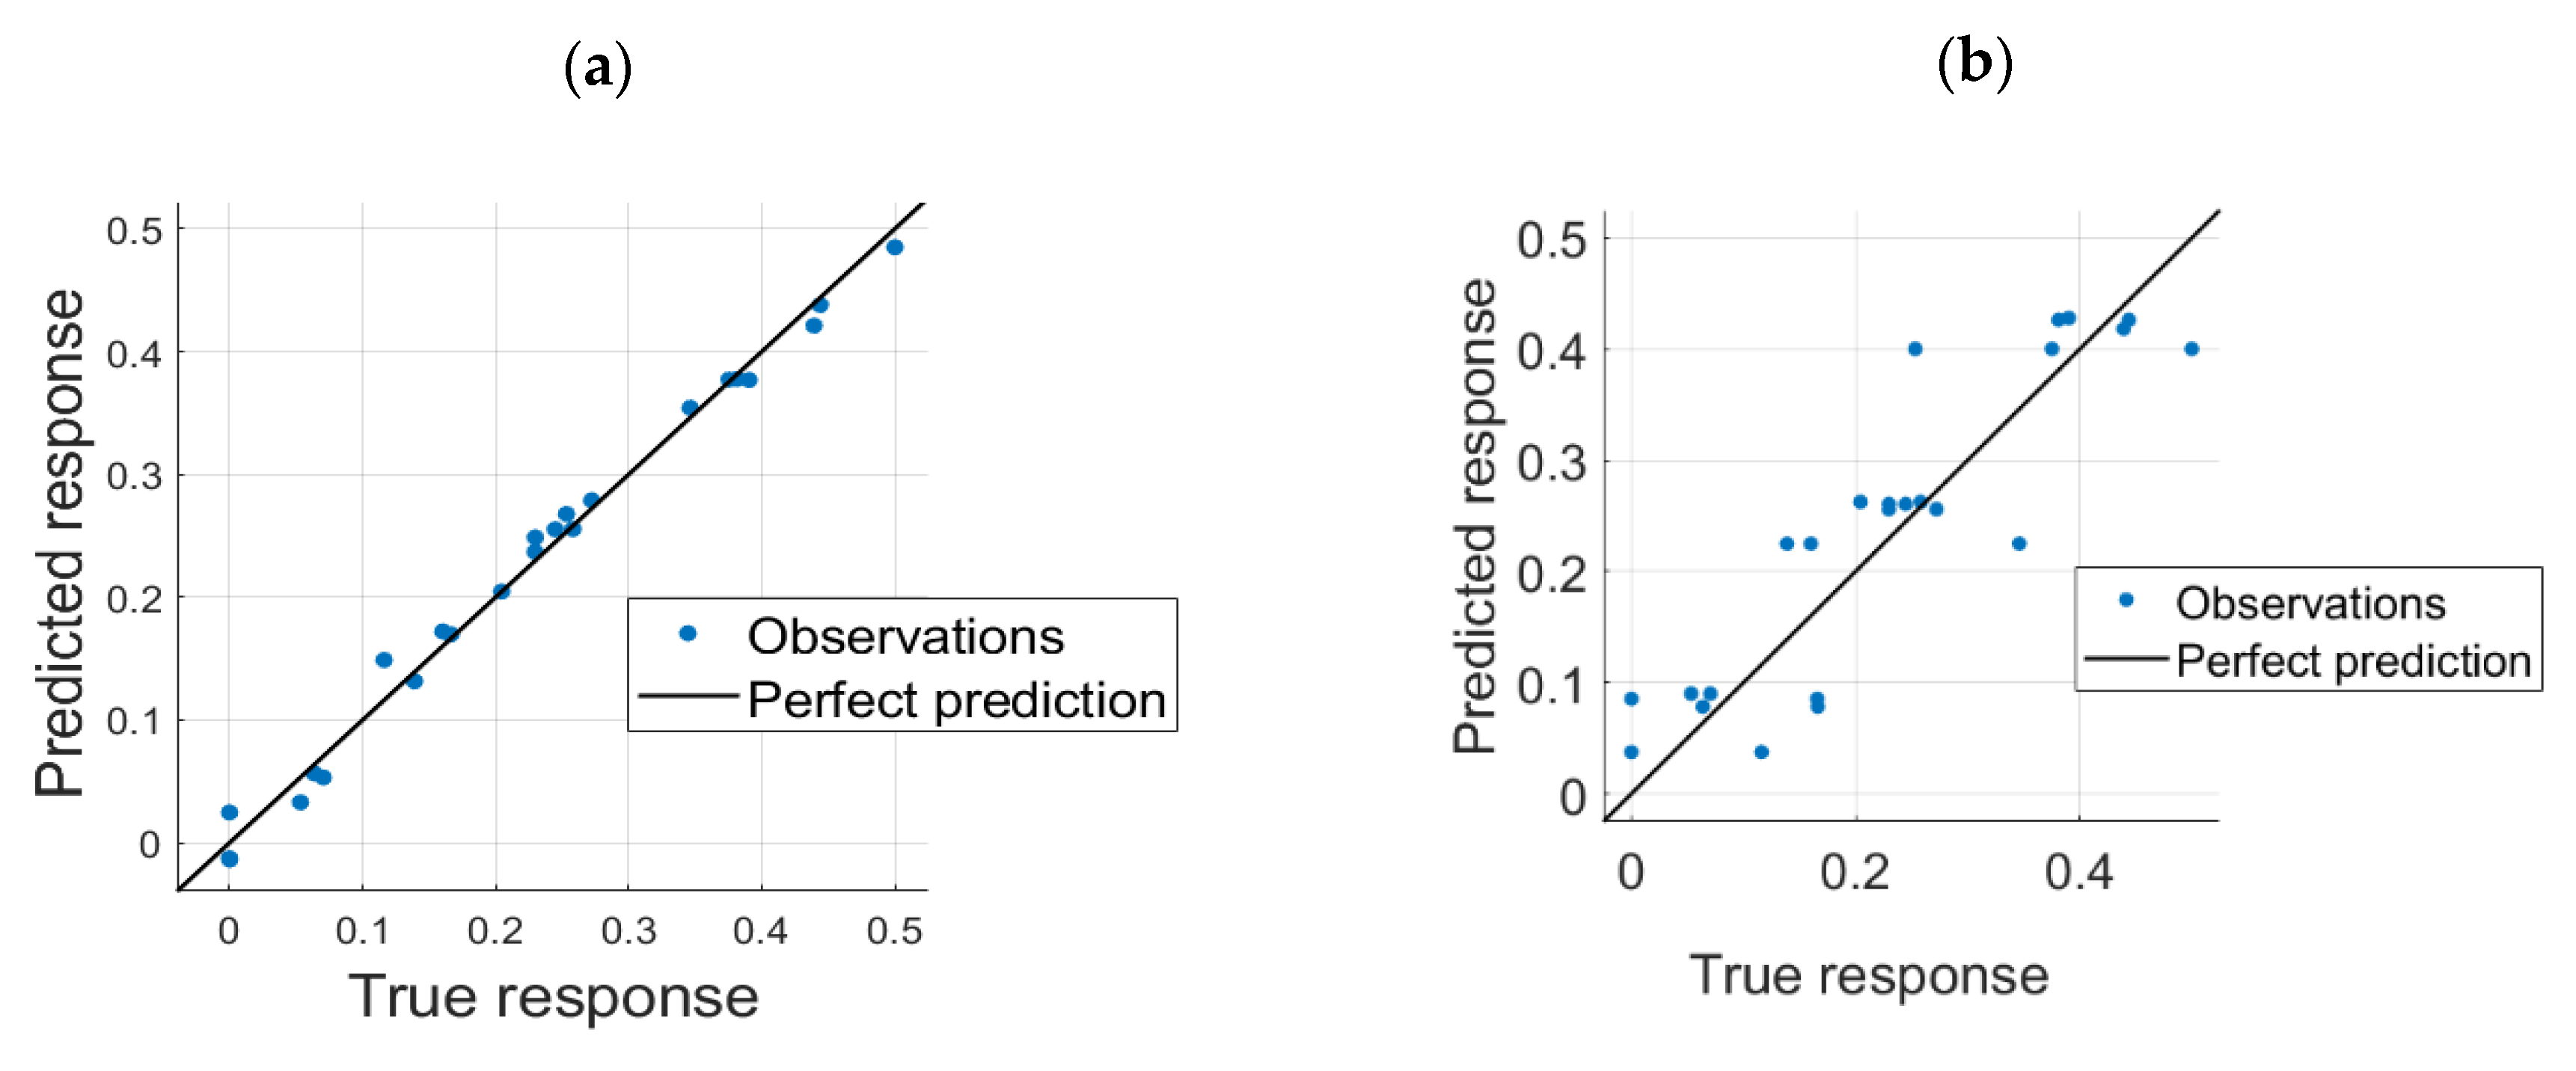
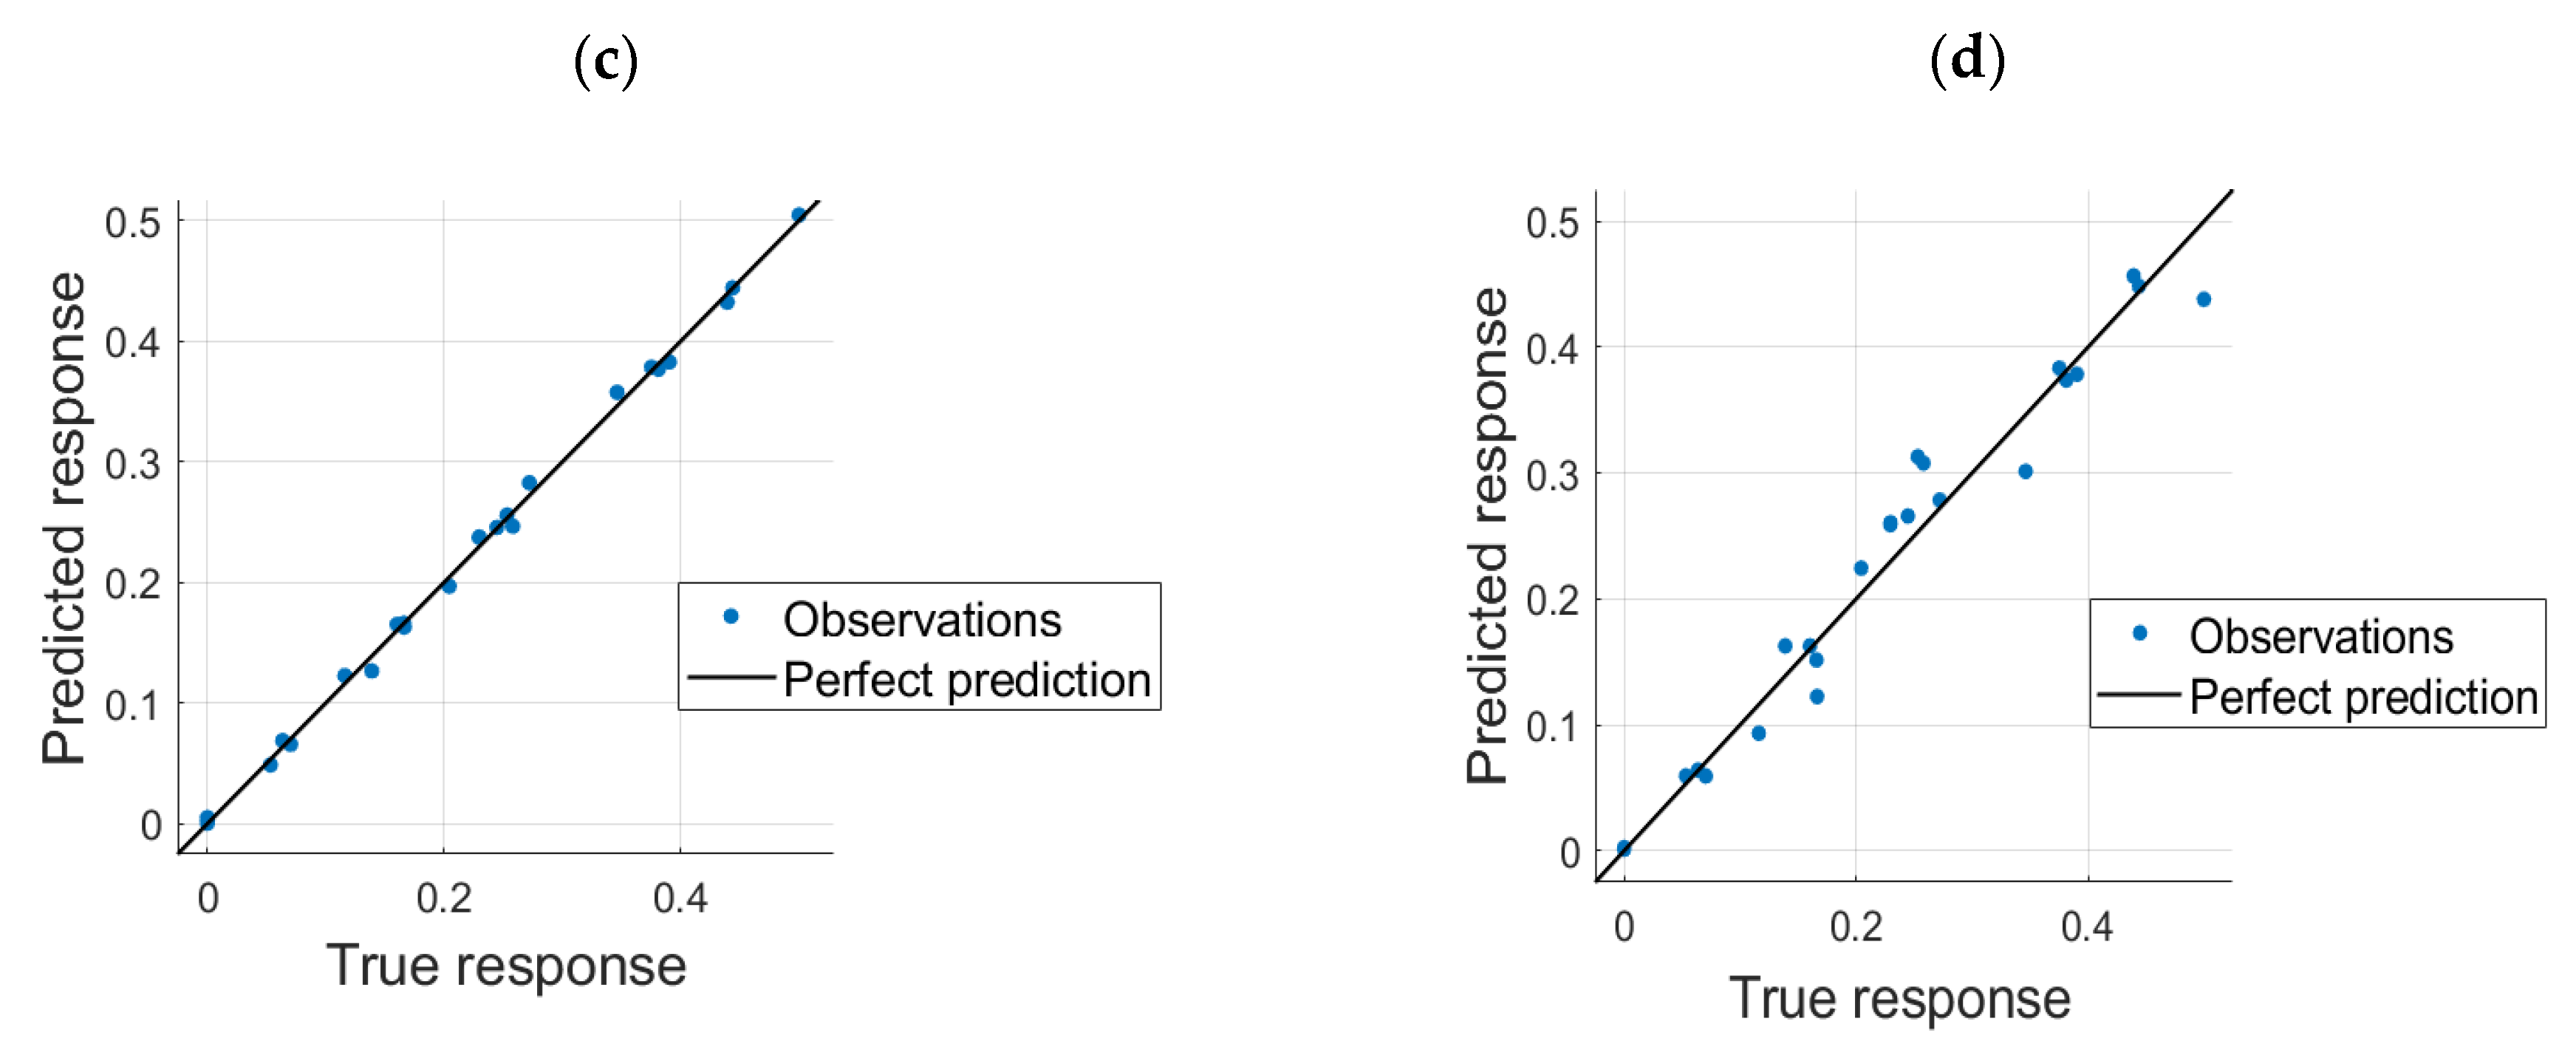
Figure 9.
Minimum mean squared error (MSE) for the various regression learner optimizable models: (a) Optimizable SVM, (b) Optimizable Tree, (c) Optimizable GPR, (d) Optimizable Ensemble.
Figure 9.
Minimum mean squared error (MSE) for the various regression learner optimizable models: (a) Optimizable SVM, (b) Optimizable Tree, (c) Optimizable GPR, (d) Optimizable Ensemble.
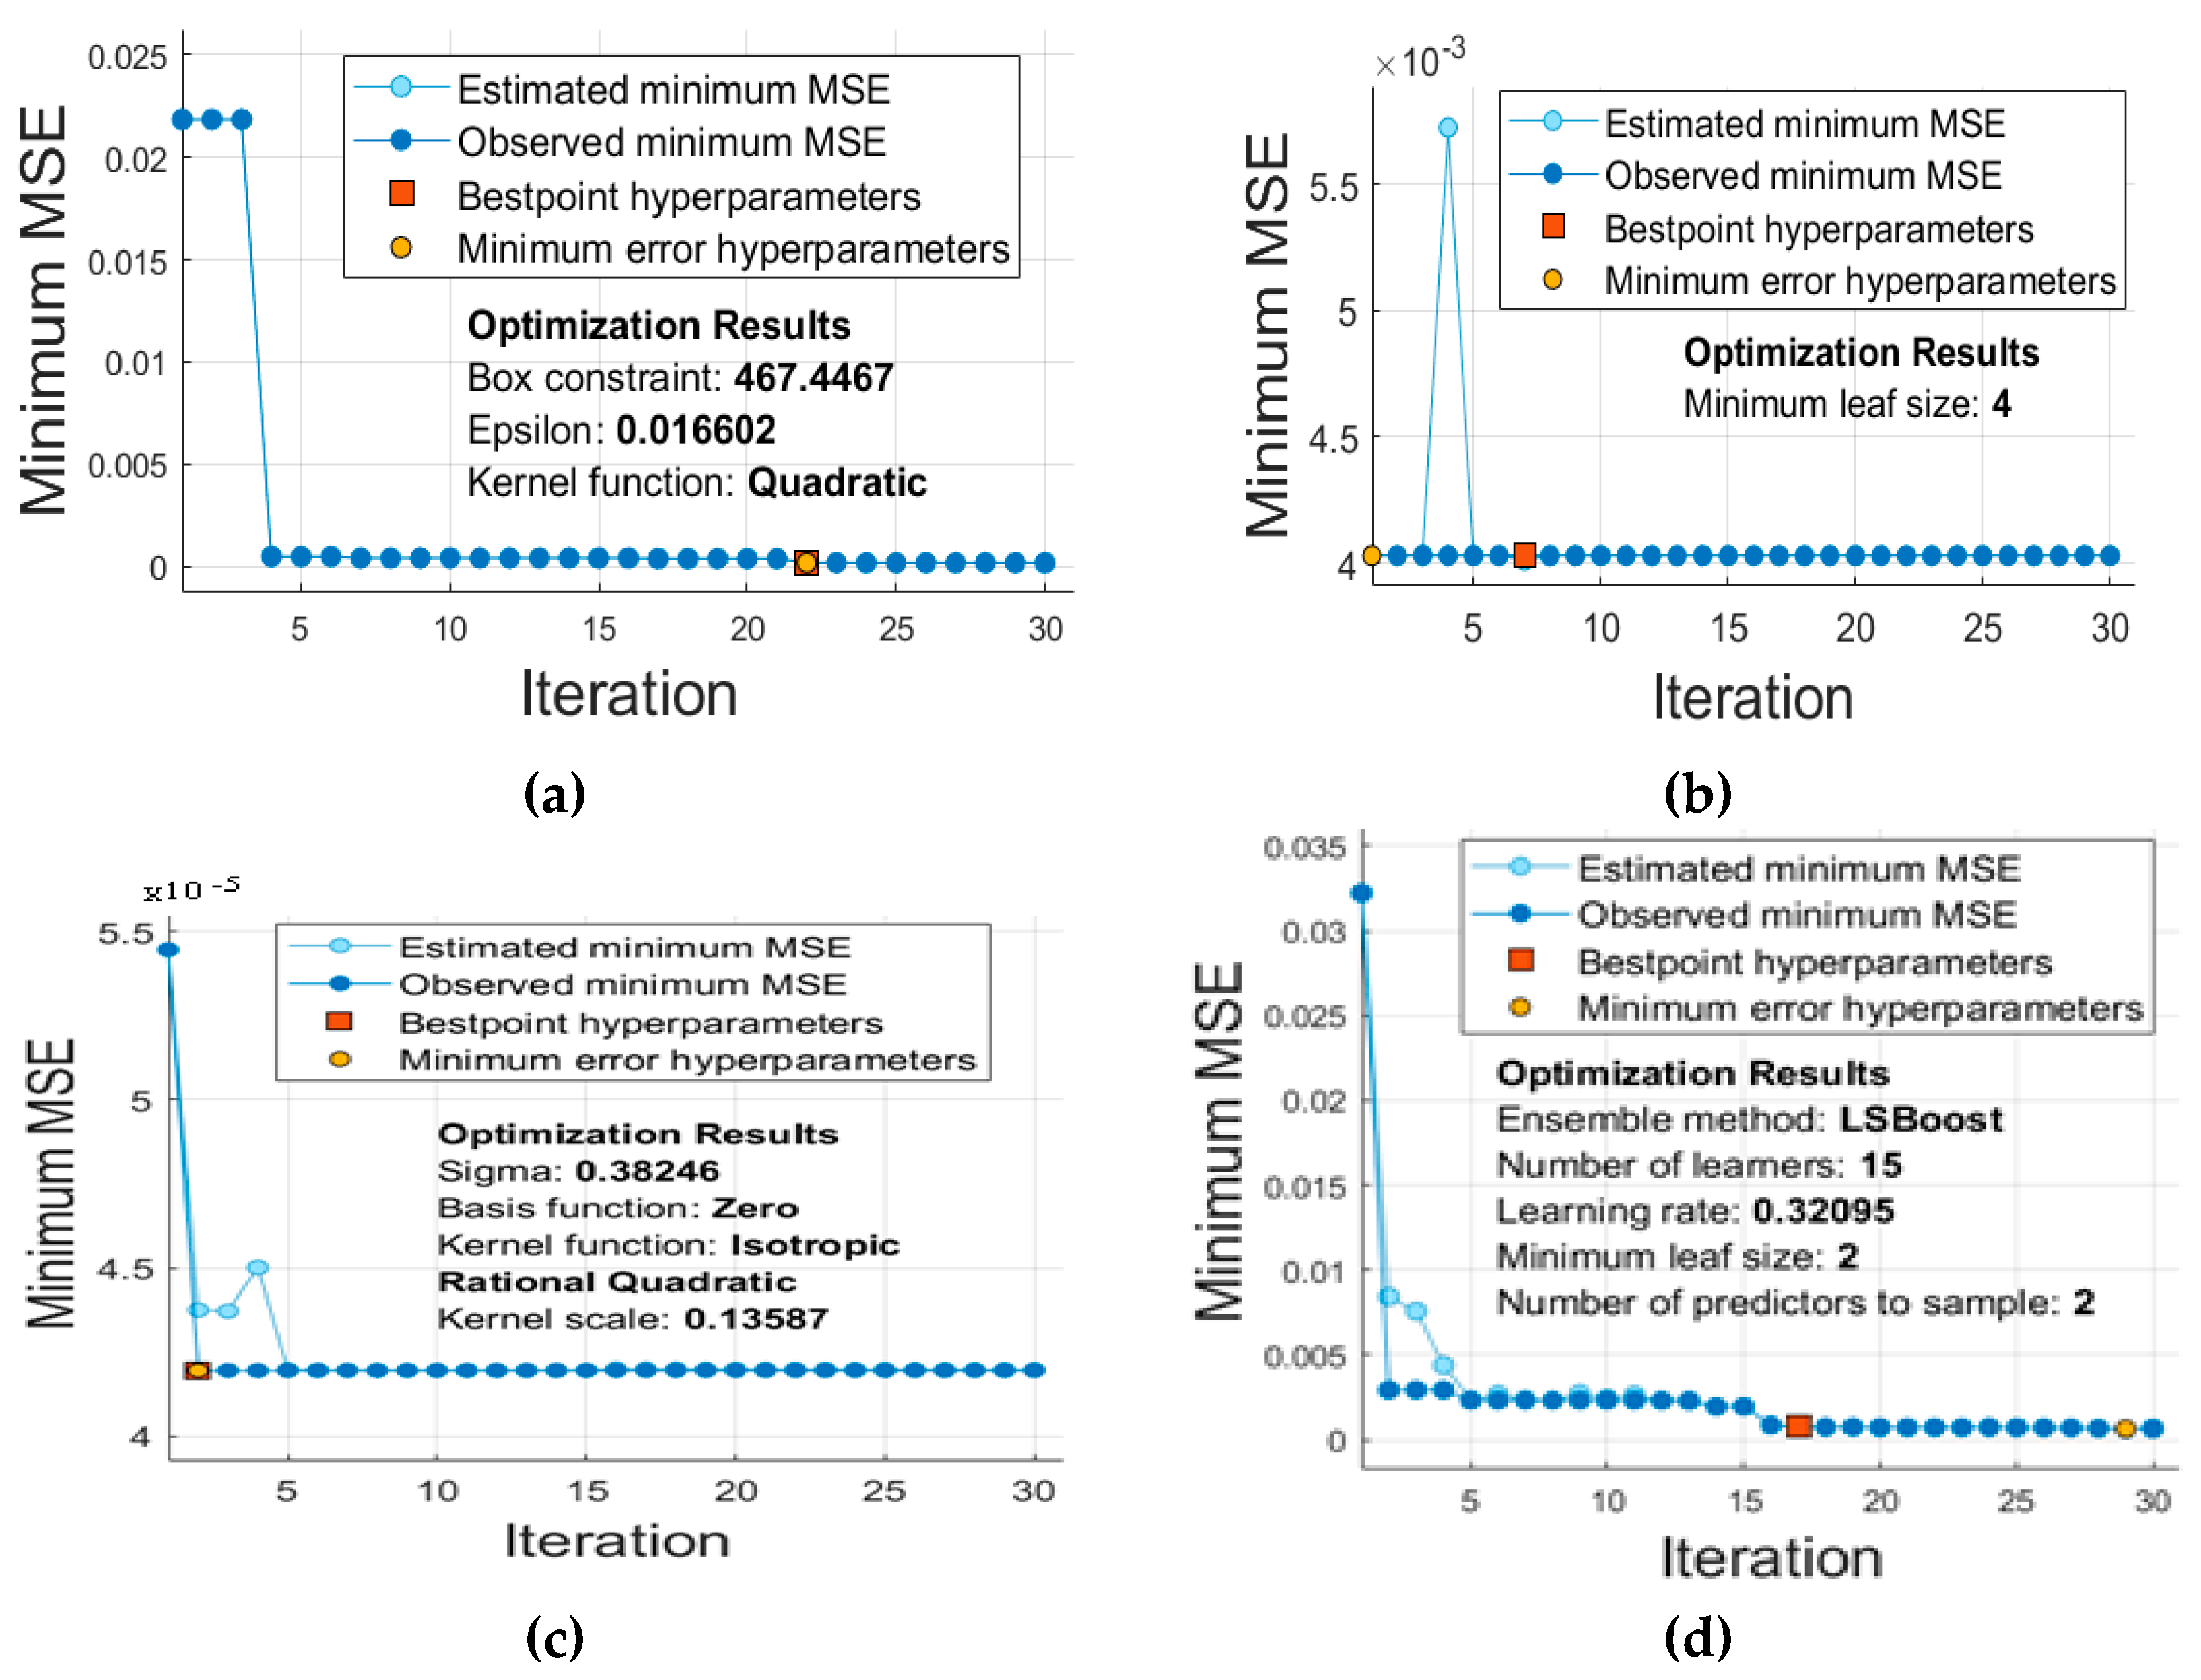
Figure 10.
(a) ANFIS model architecture for overcrowding risk level prediction where the branches show the characteristics of the ANFIS model structure beside the feed-forward network; (b) ANFIS network after applying subtractive clustering.
Figure 10.
(a) ANFIS model architecture for overcrowding risk level prediction where the branches show the characteristics of the ANFIS model structure beside the feed-forward network; (b) ANFIS network after applying subtractive clustering.
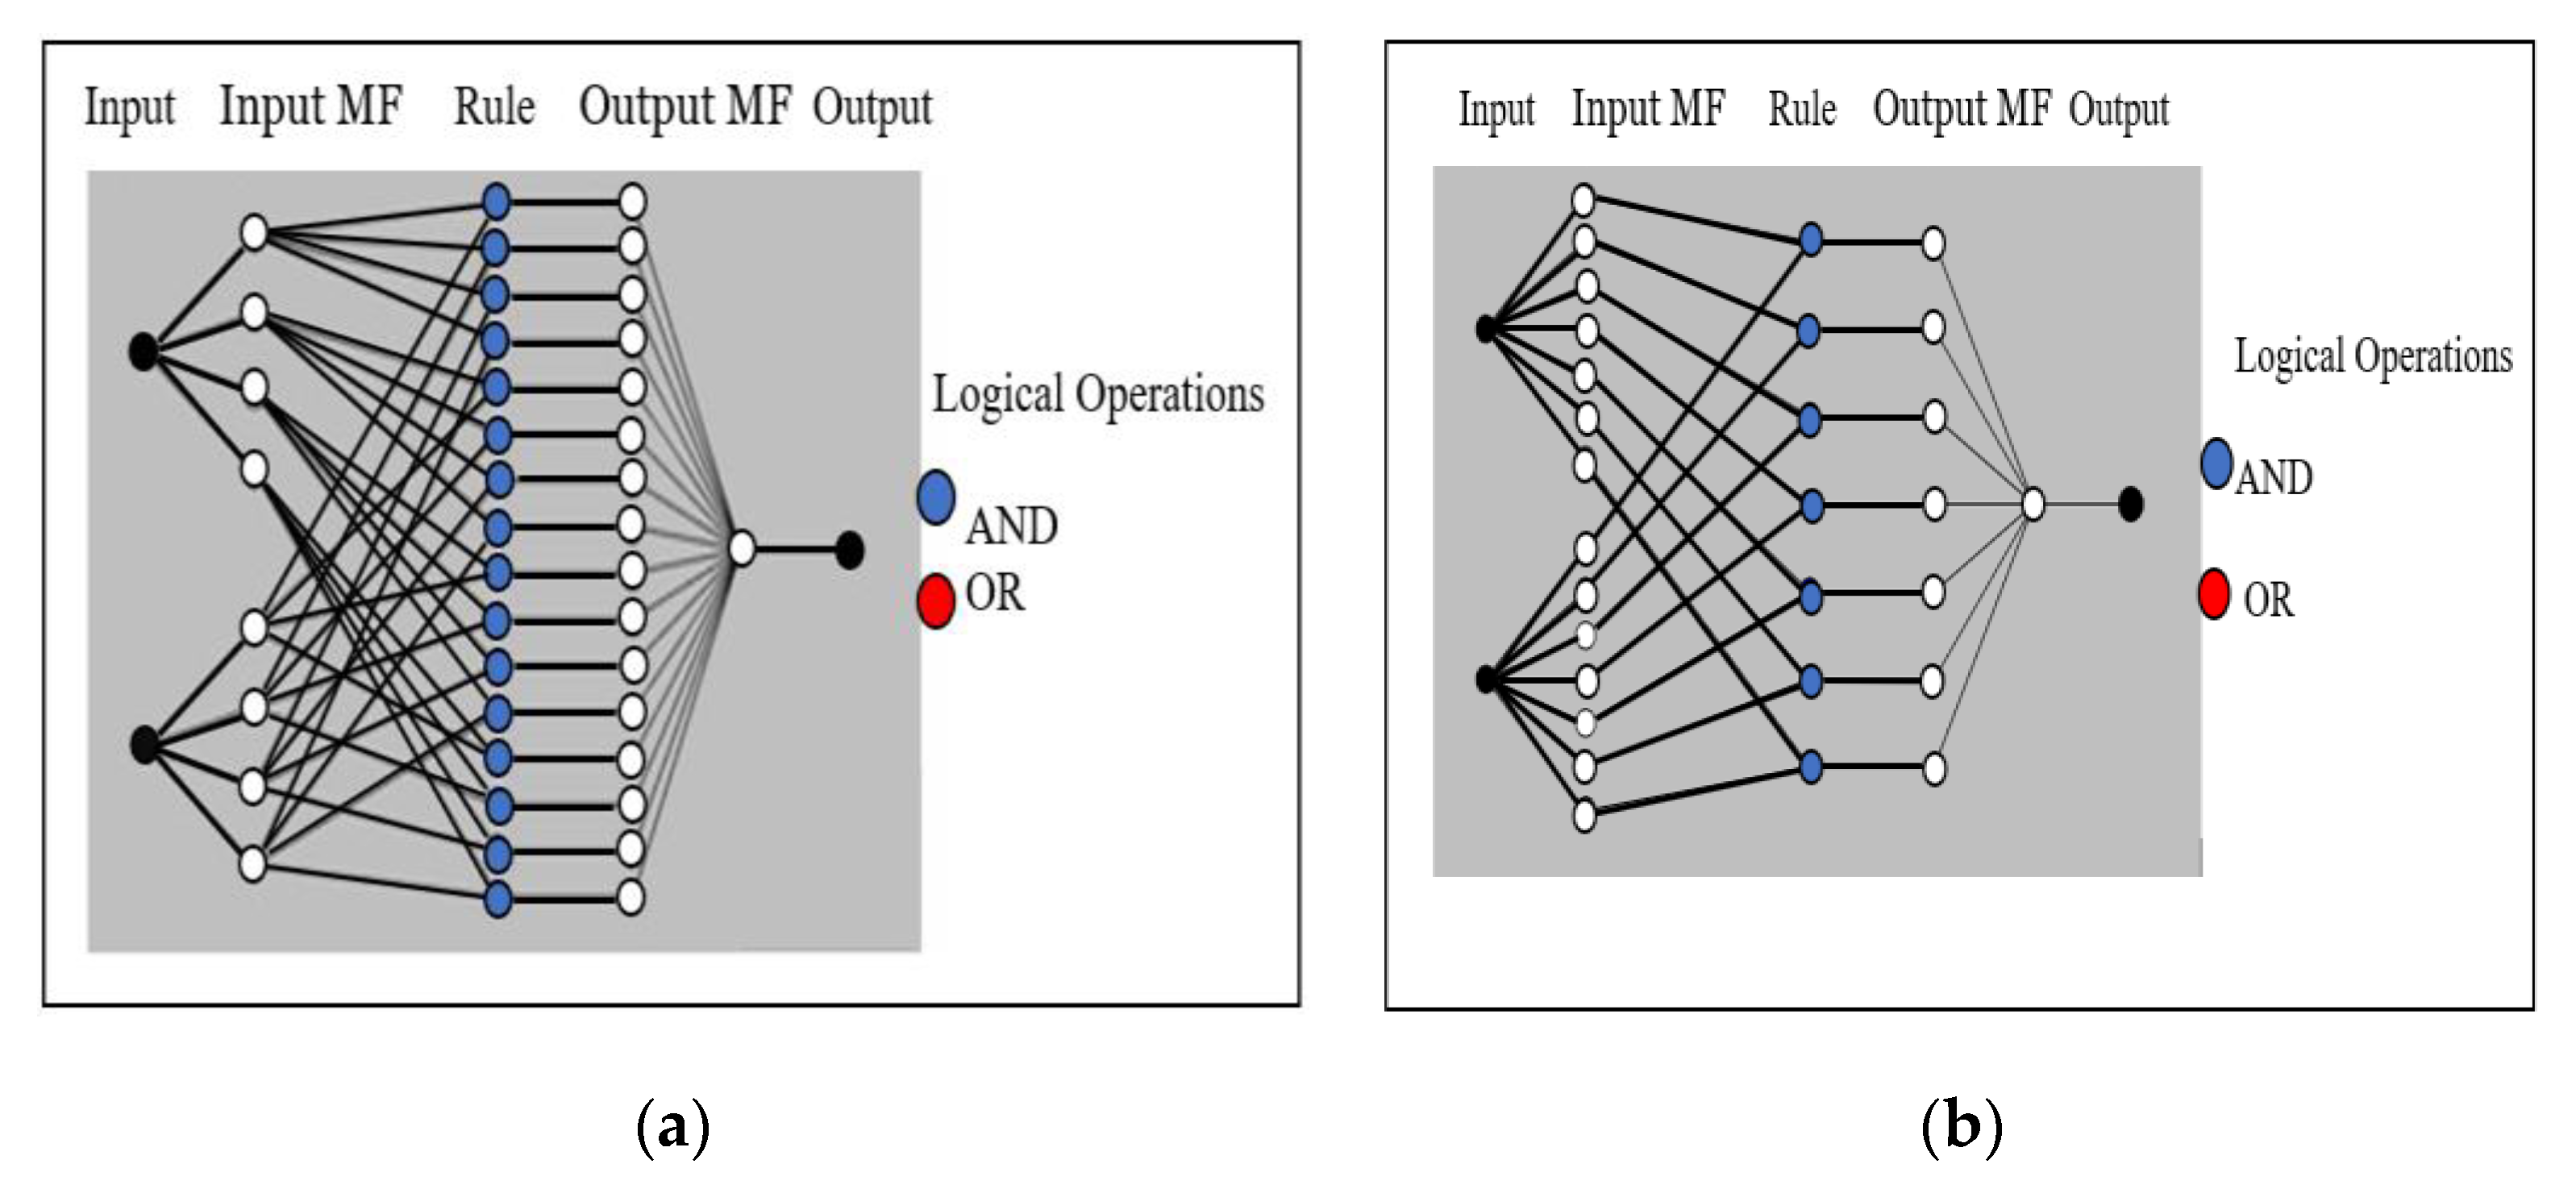
Figure 11.
Heat map showing the correlation between the inputs and the risk levels.
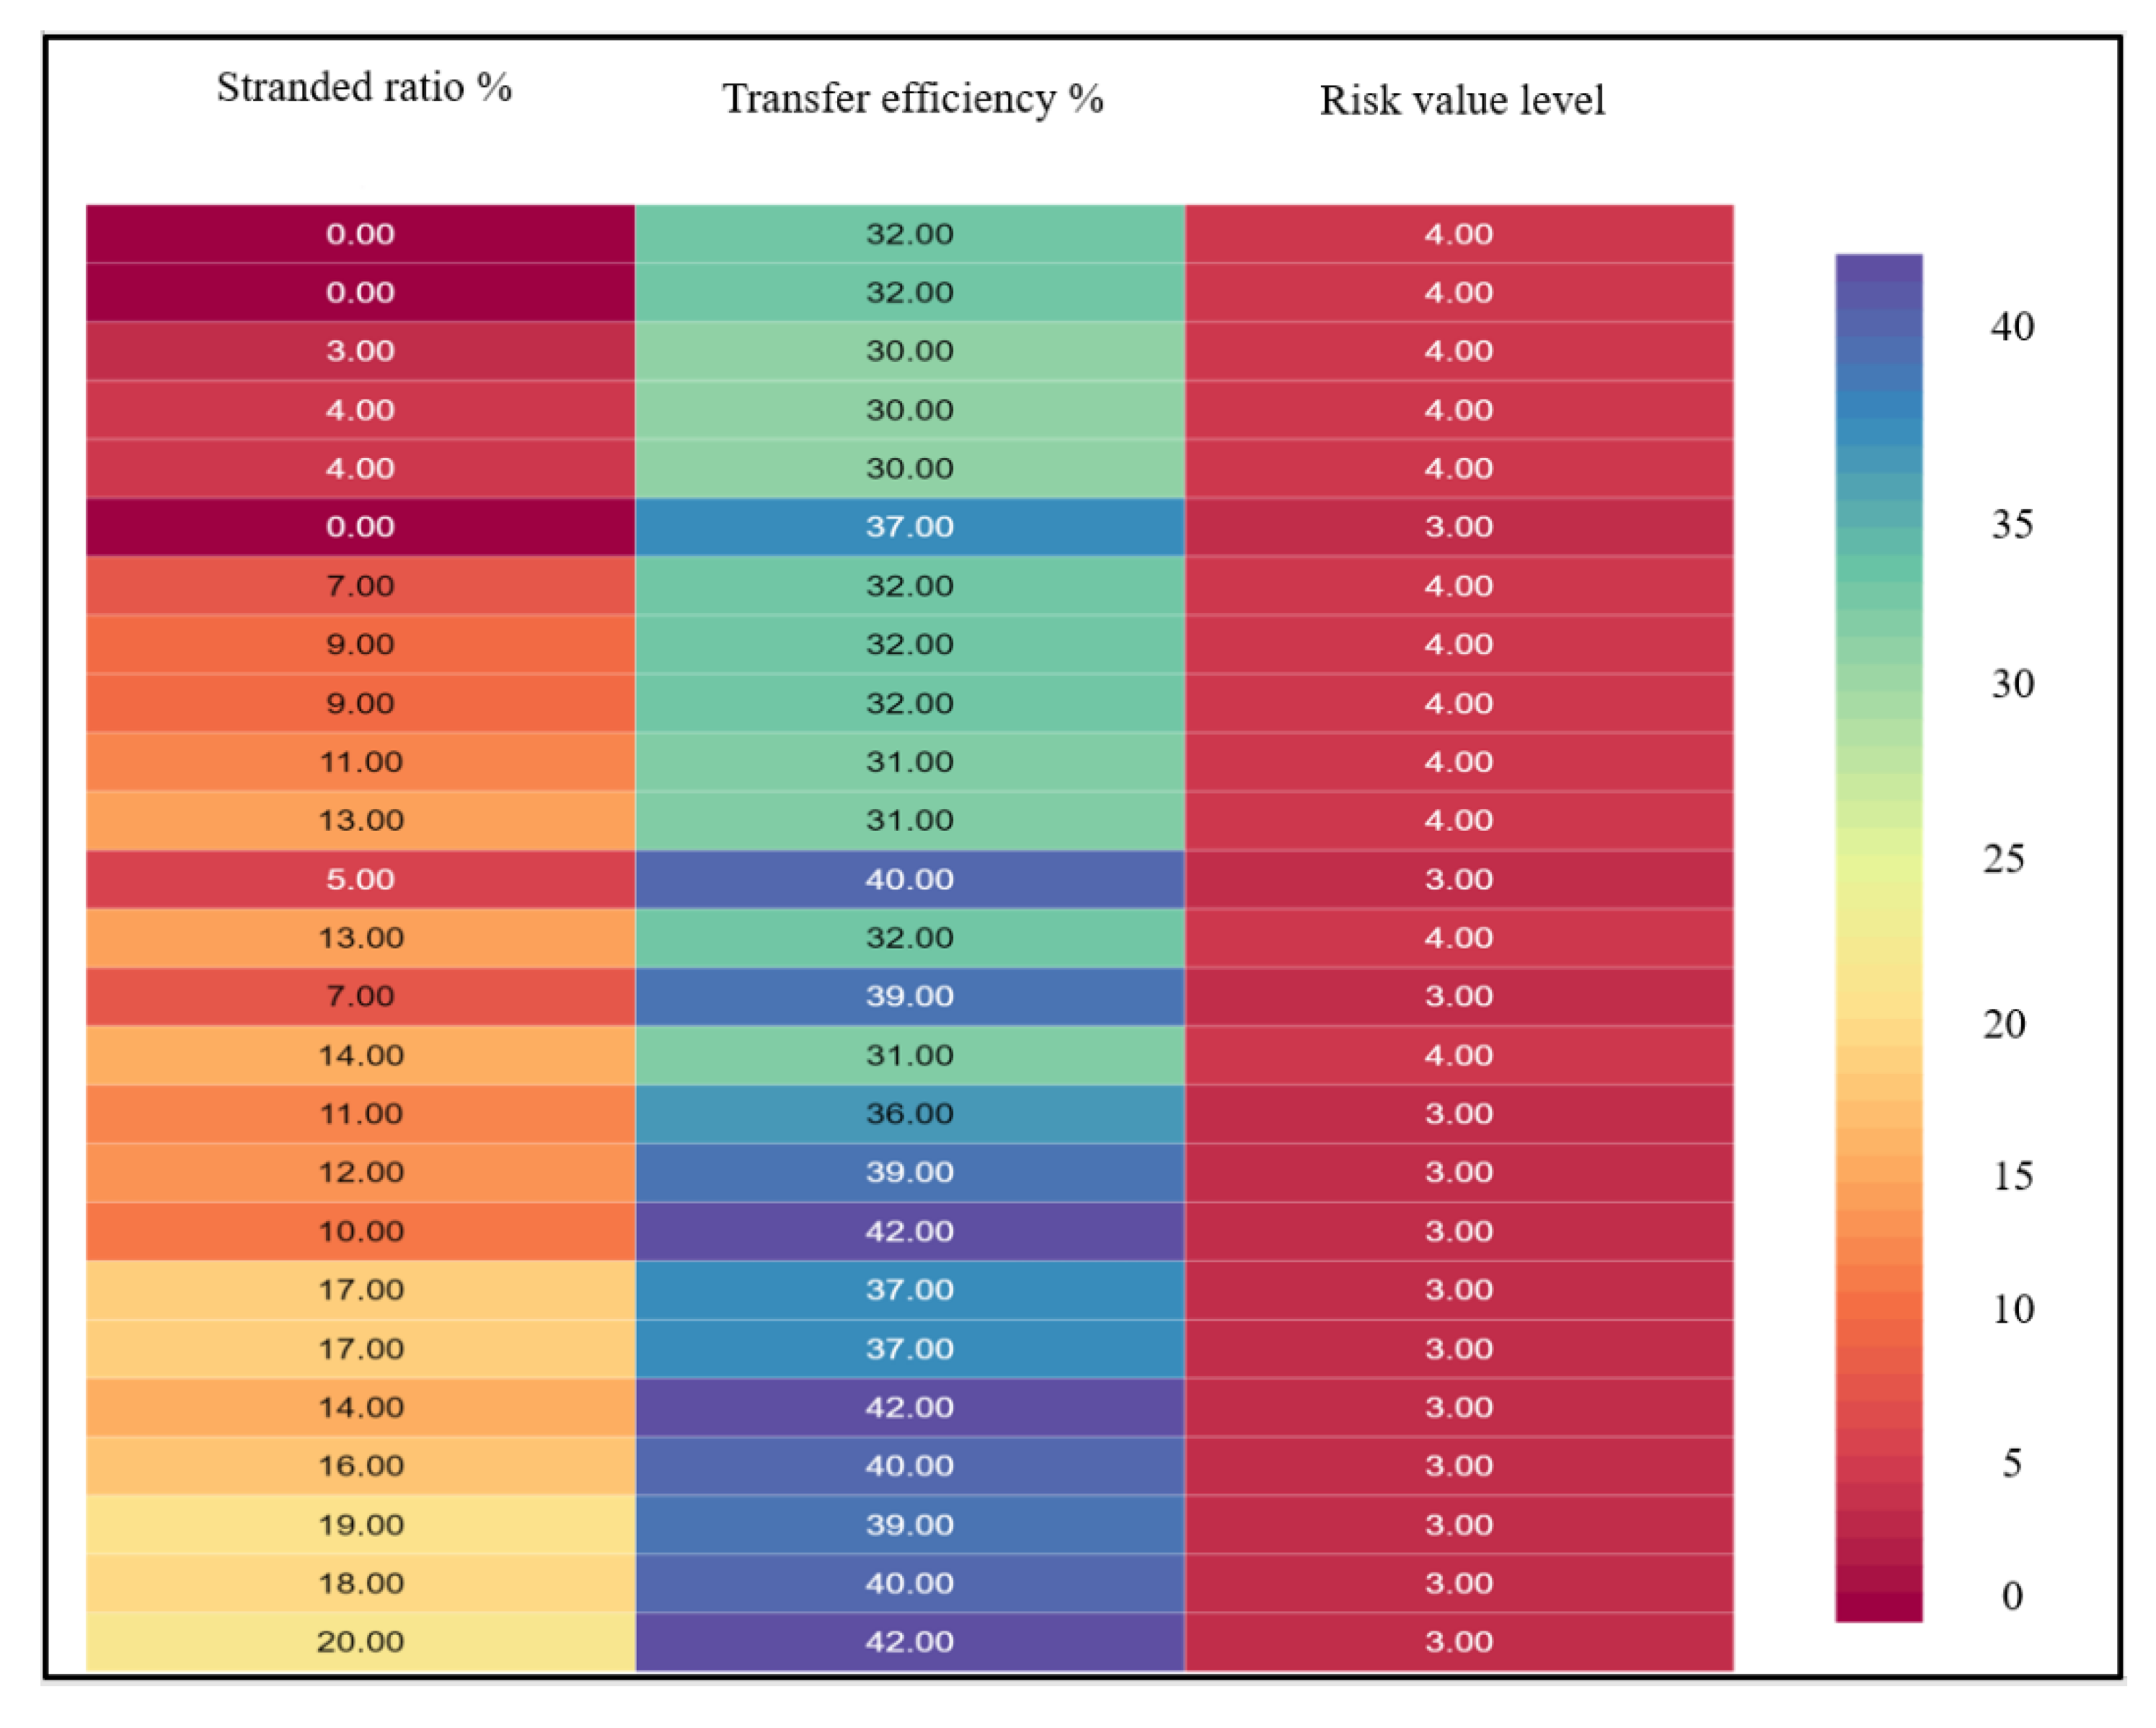
Figure 12.
Trained main ANFIS of indexes and output of risk (Matlab’s rule viewer).
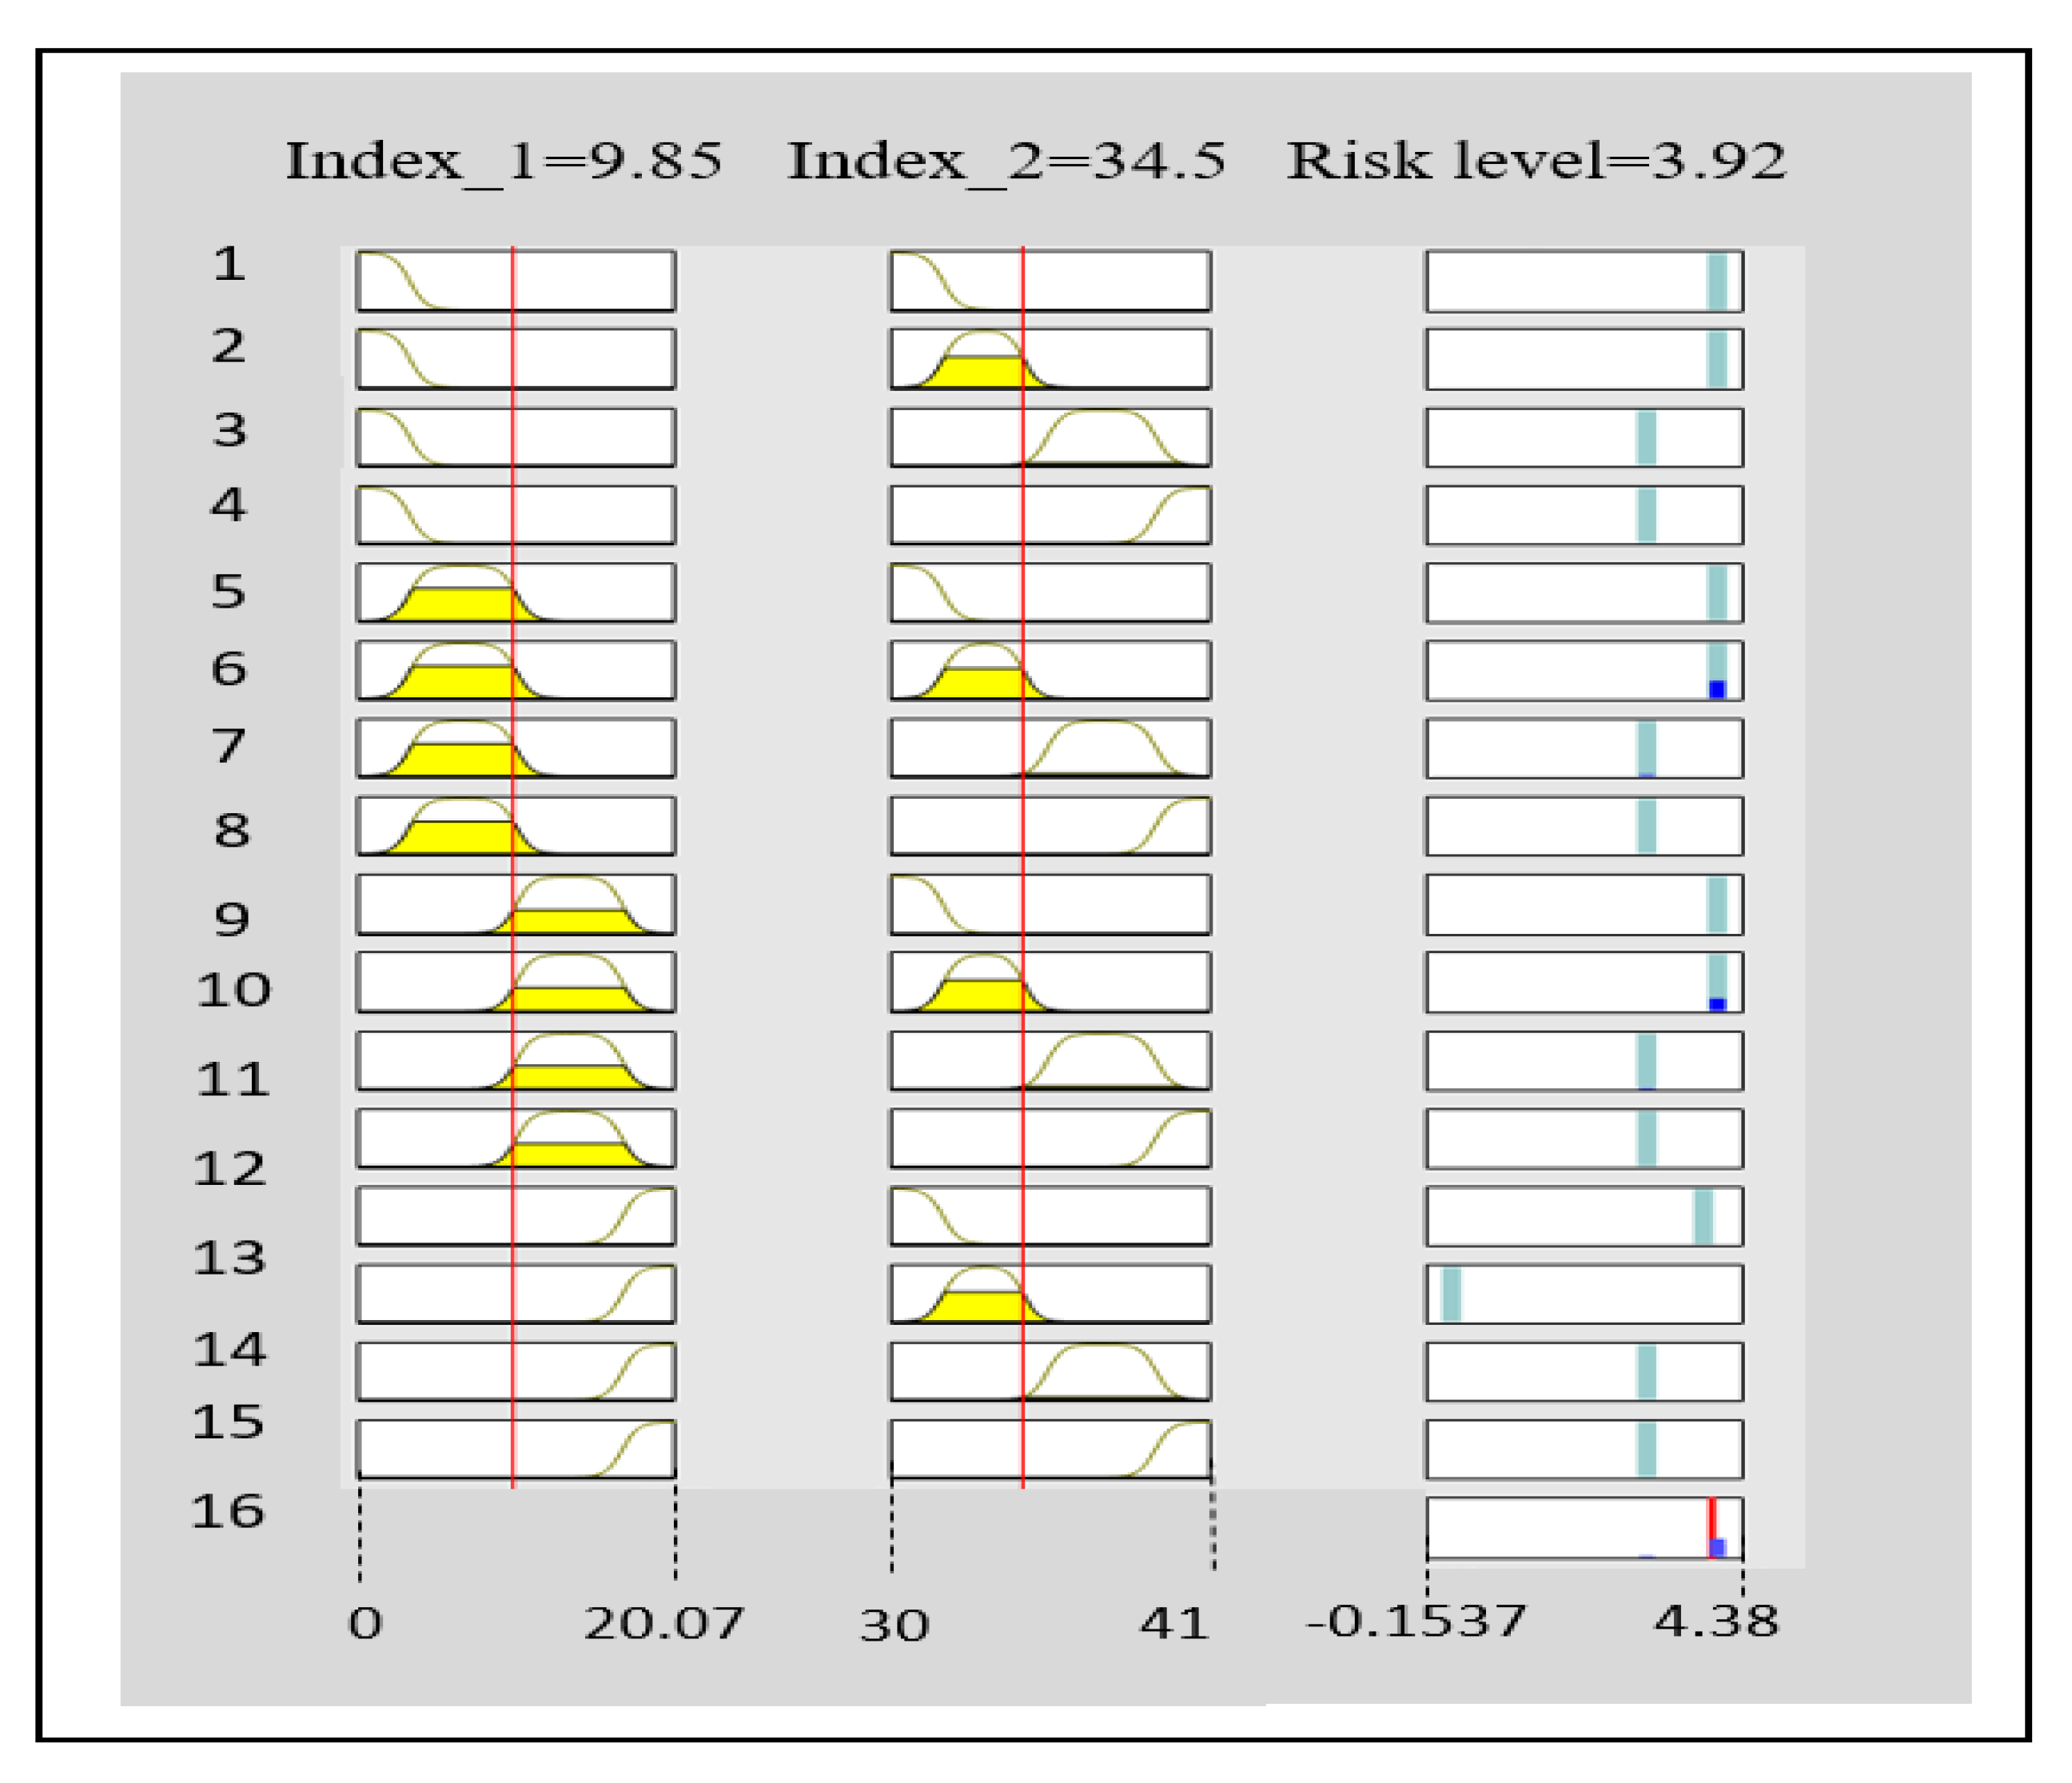
Figure 13.
Using the Sugeno-type FIS method in the proposed method.
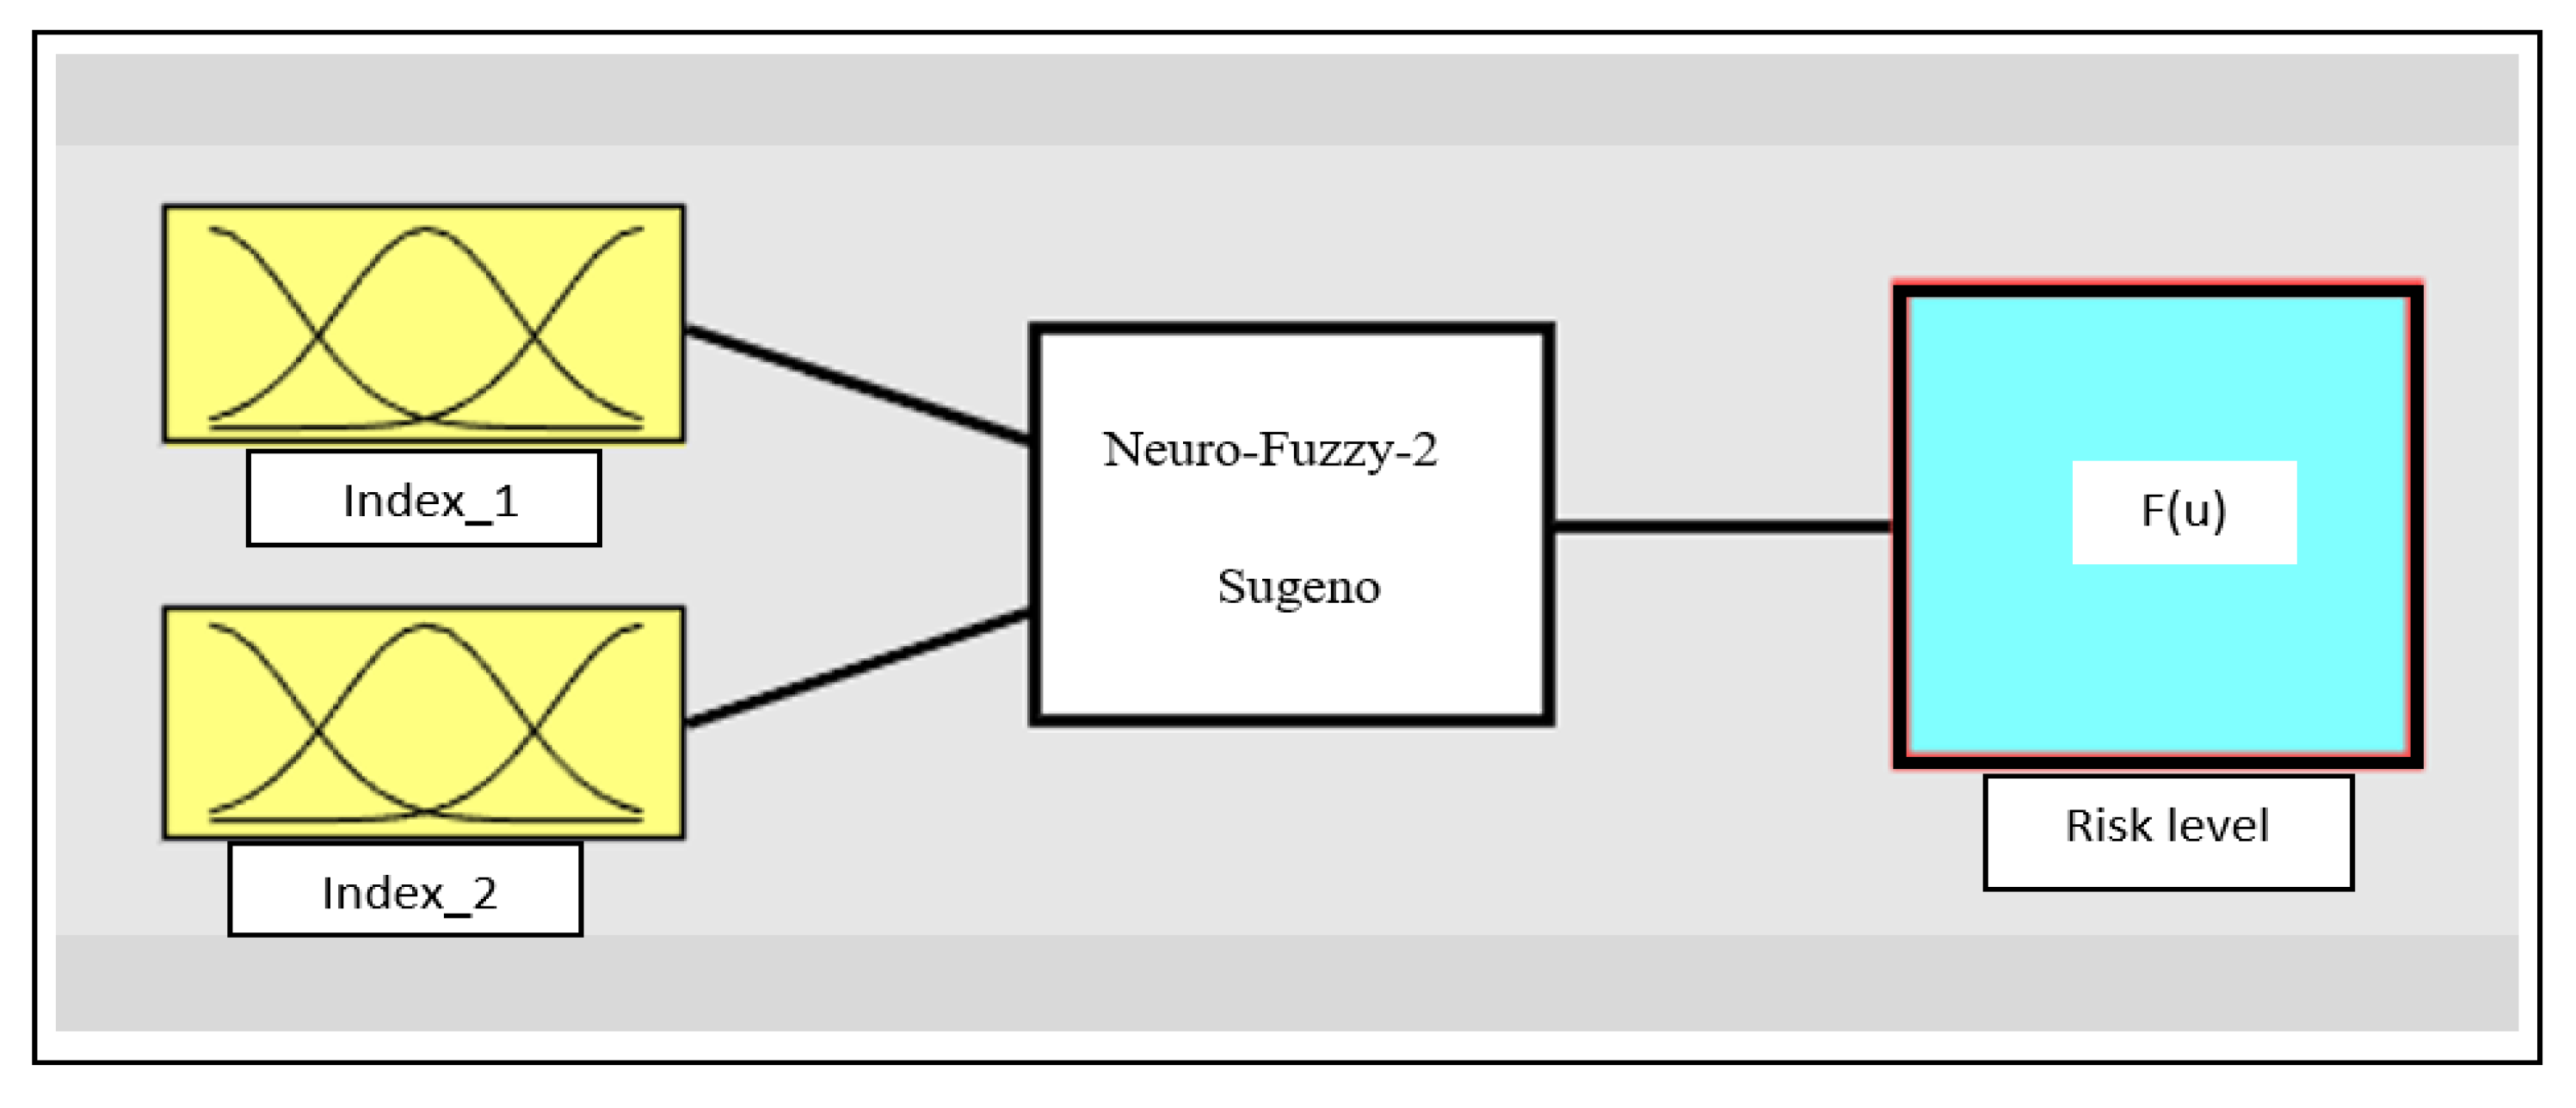
Figure 14.
Trend of errors of the trained fuzzy system.
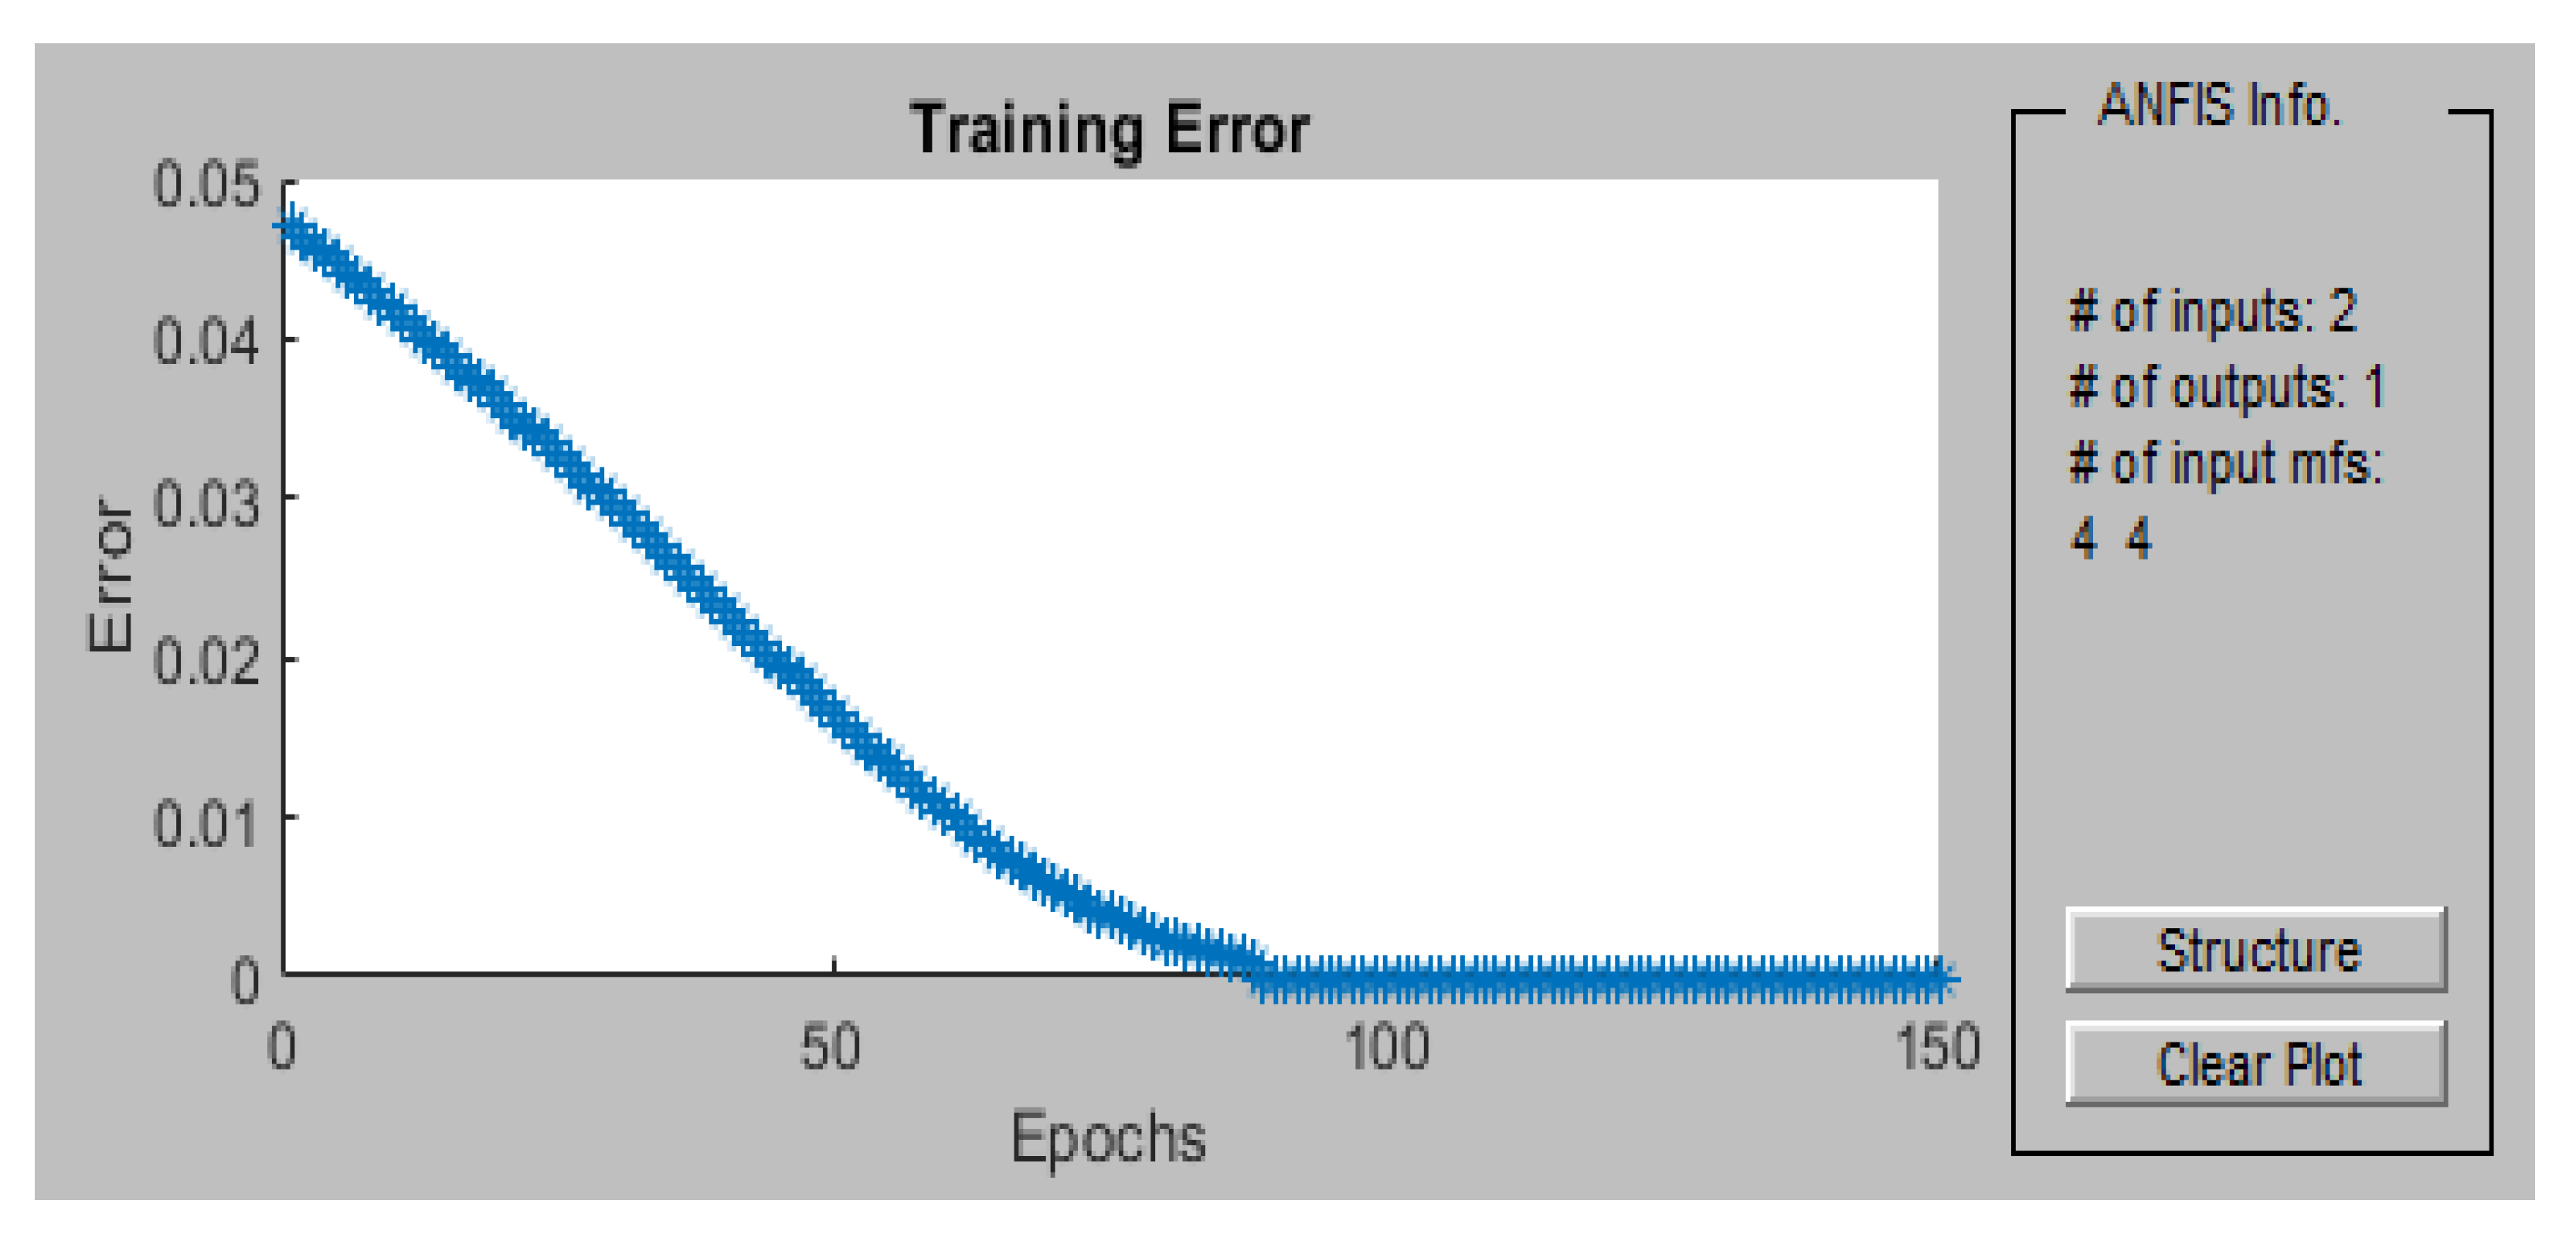
Figure 15.
Training data and FIS output with two inputs and one output.
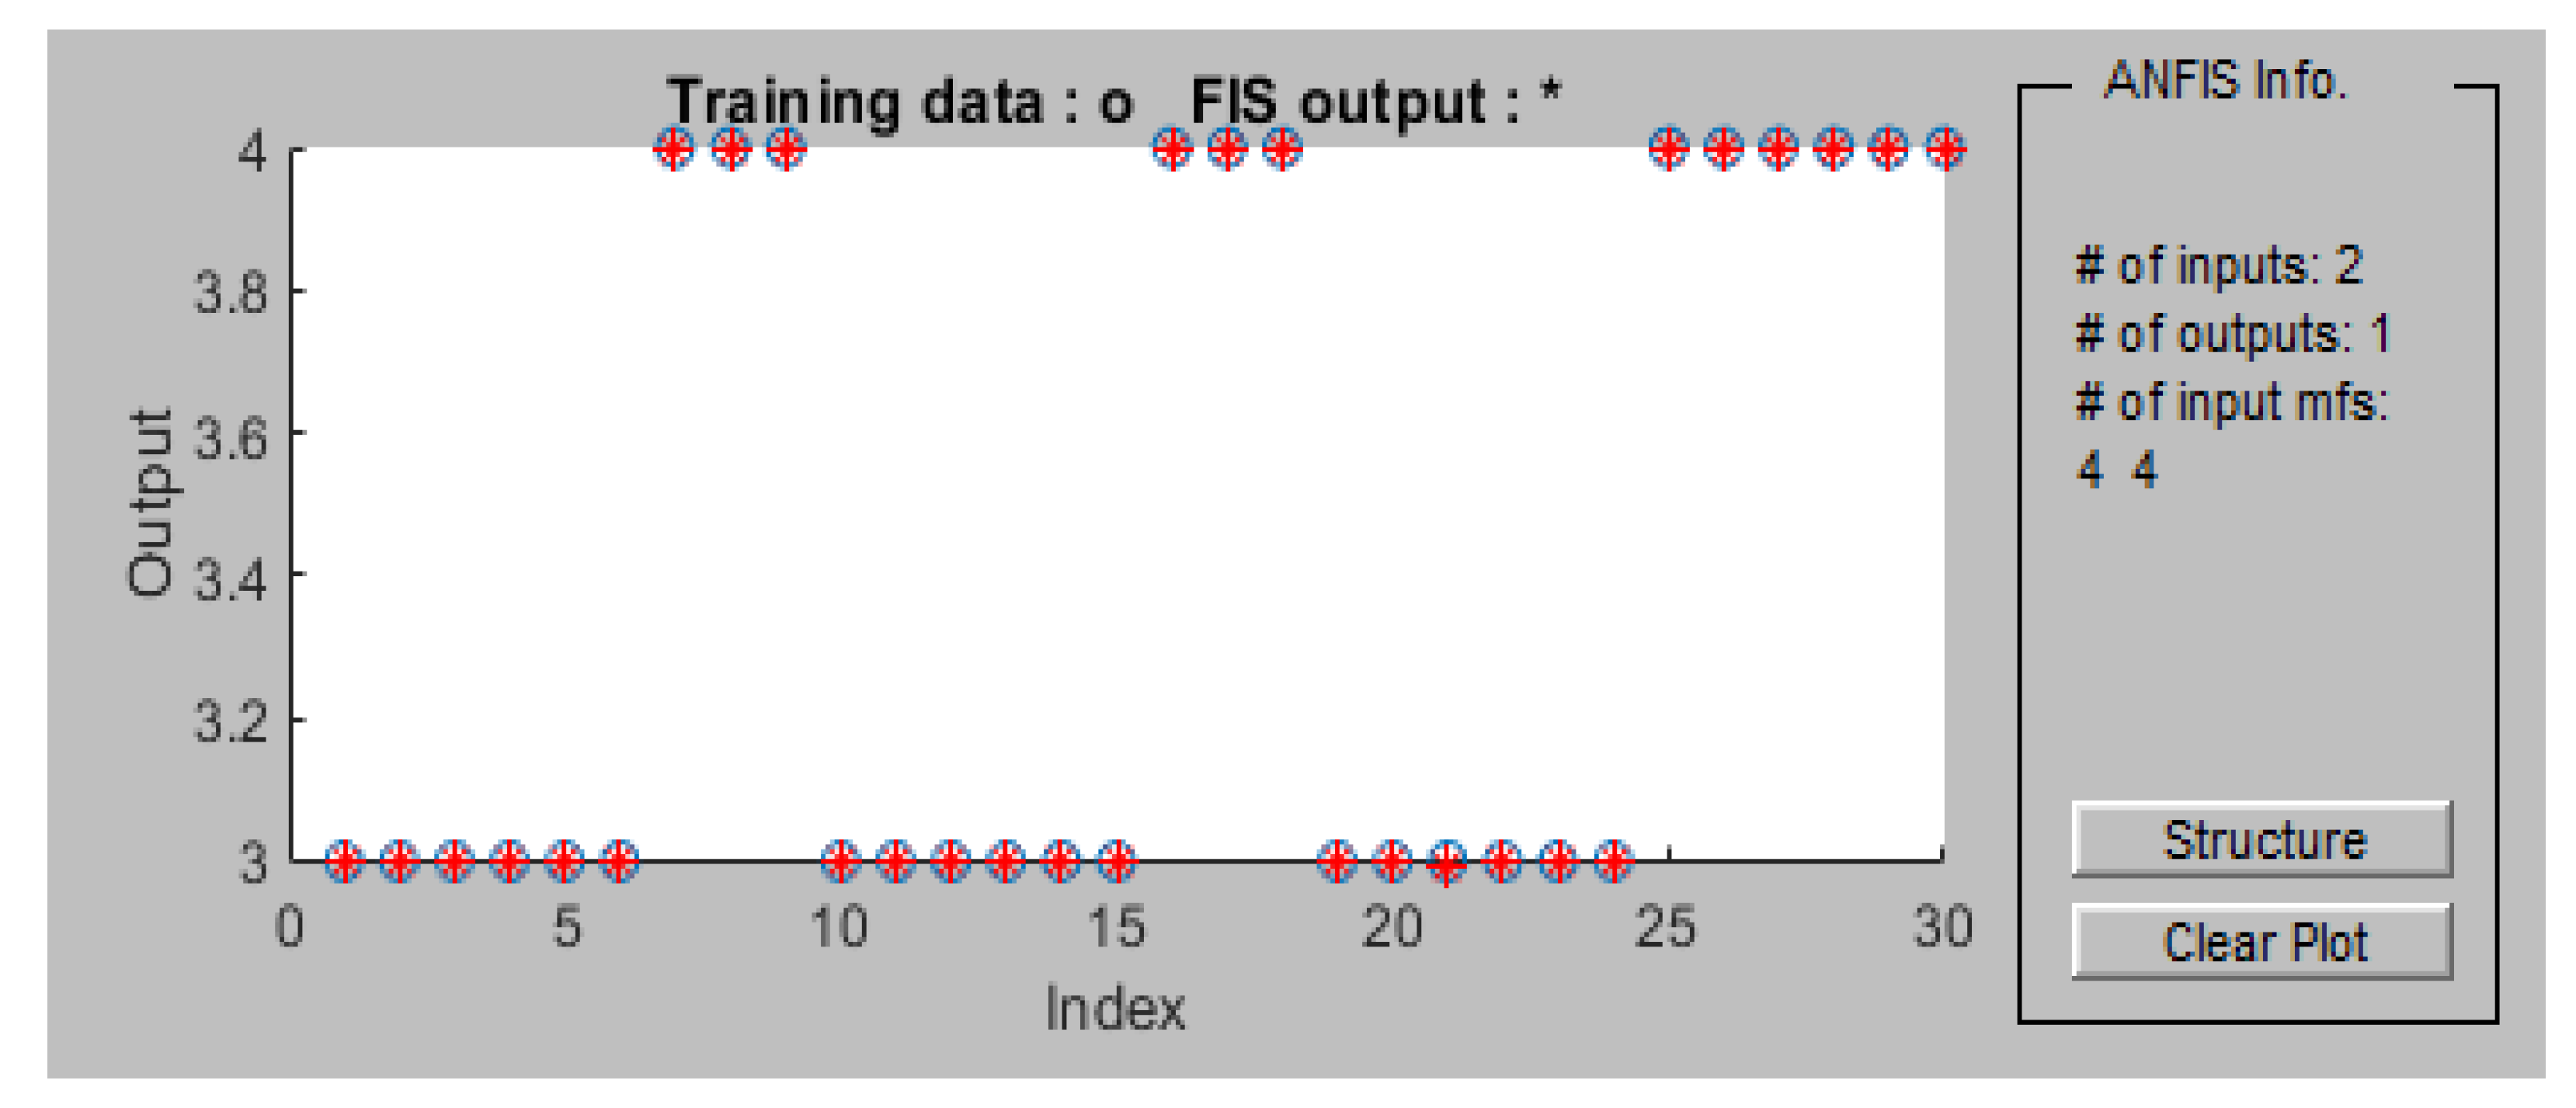
Figure 16.
Example of the 3D surface plots of the rule base system adapted for the data for different mf types; (a) dsigmf, (b) gbellmf.
Figure 16.
Example of the 3D surface plots of the rule base system adapted for the data for different mf types; (a) dsigmf, (b) gbellmf.
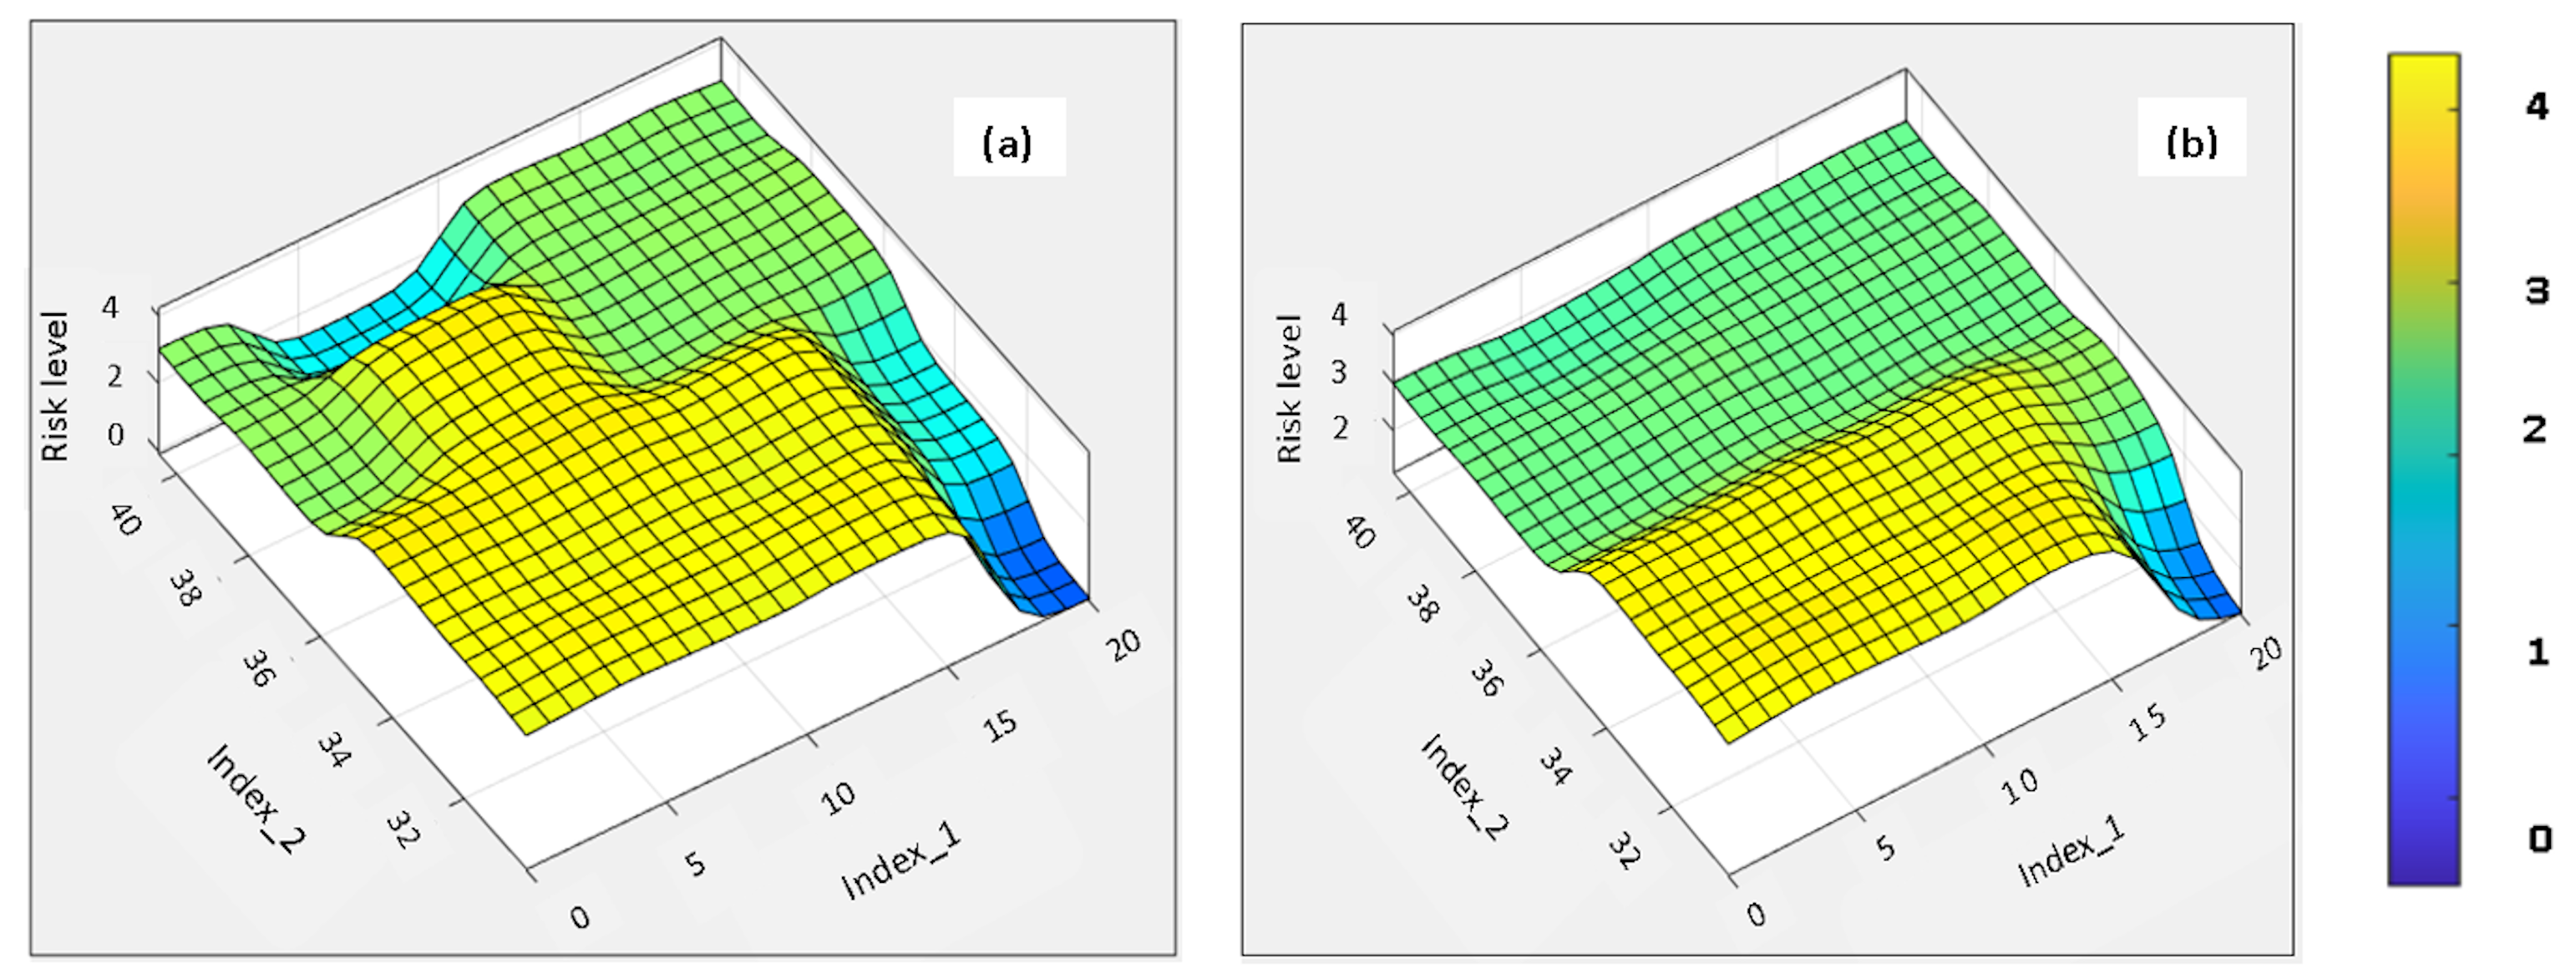
Figure 17.
Comparison of the proposed model between predicted risk level and the observed.
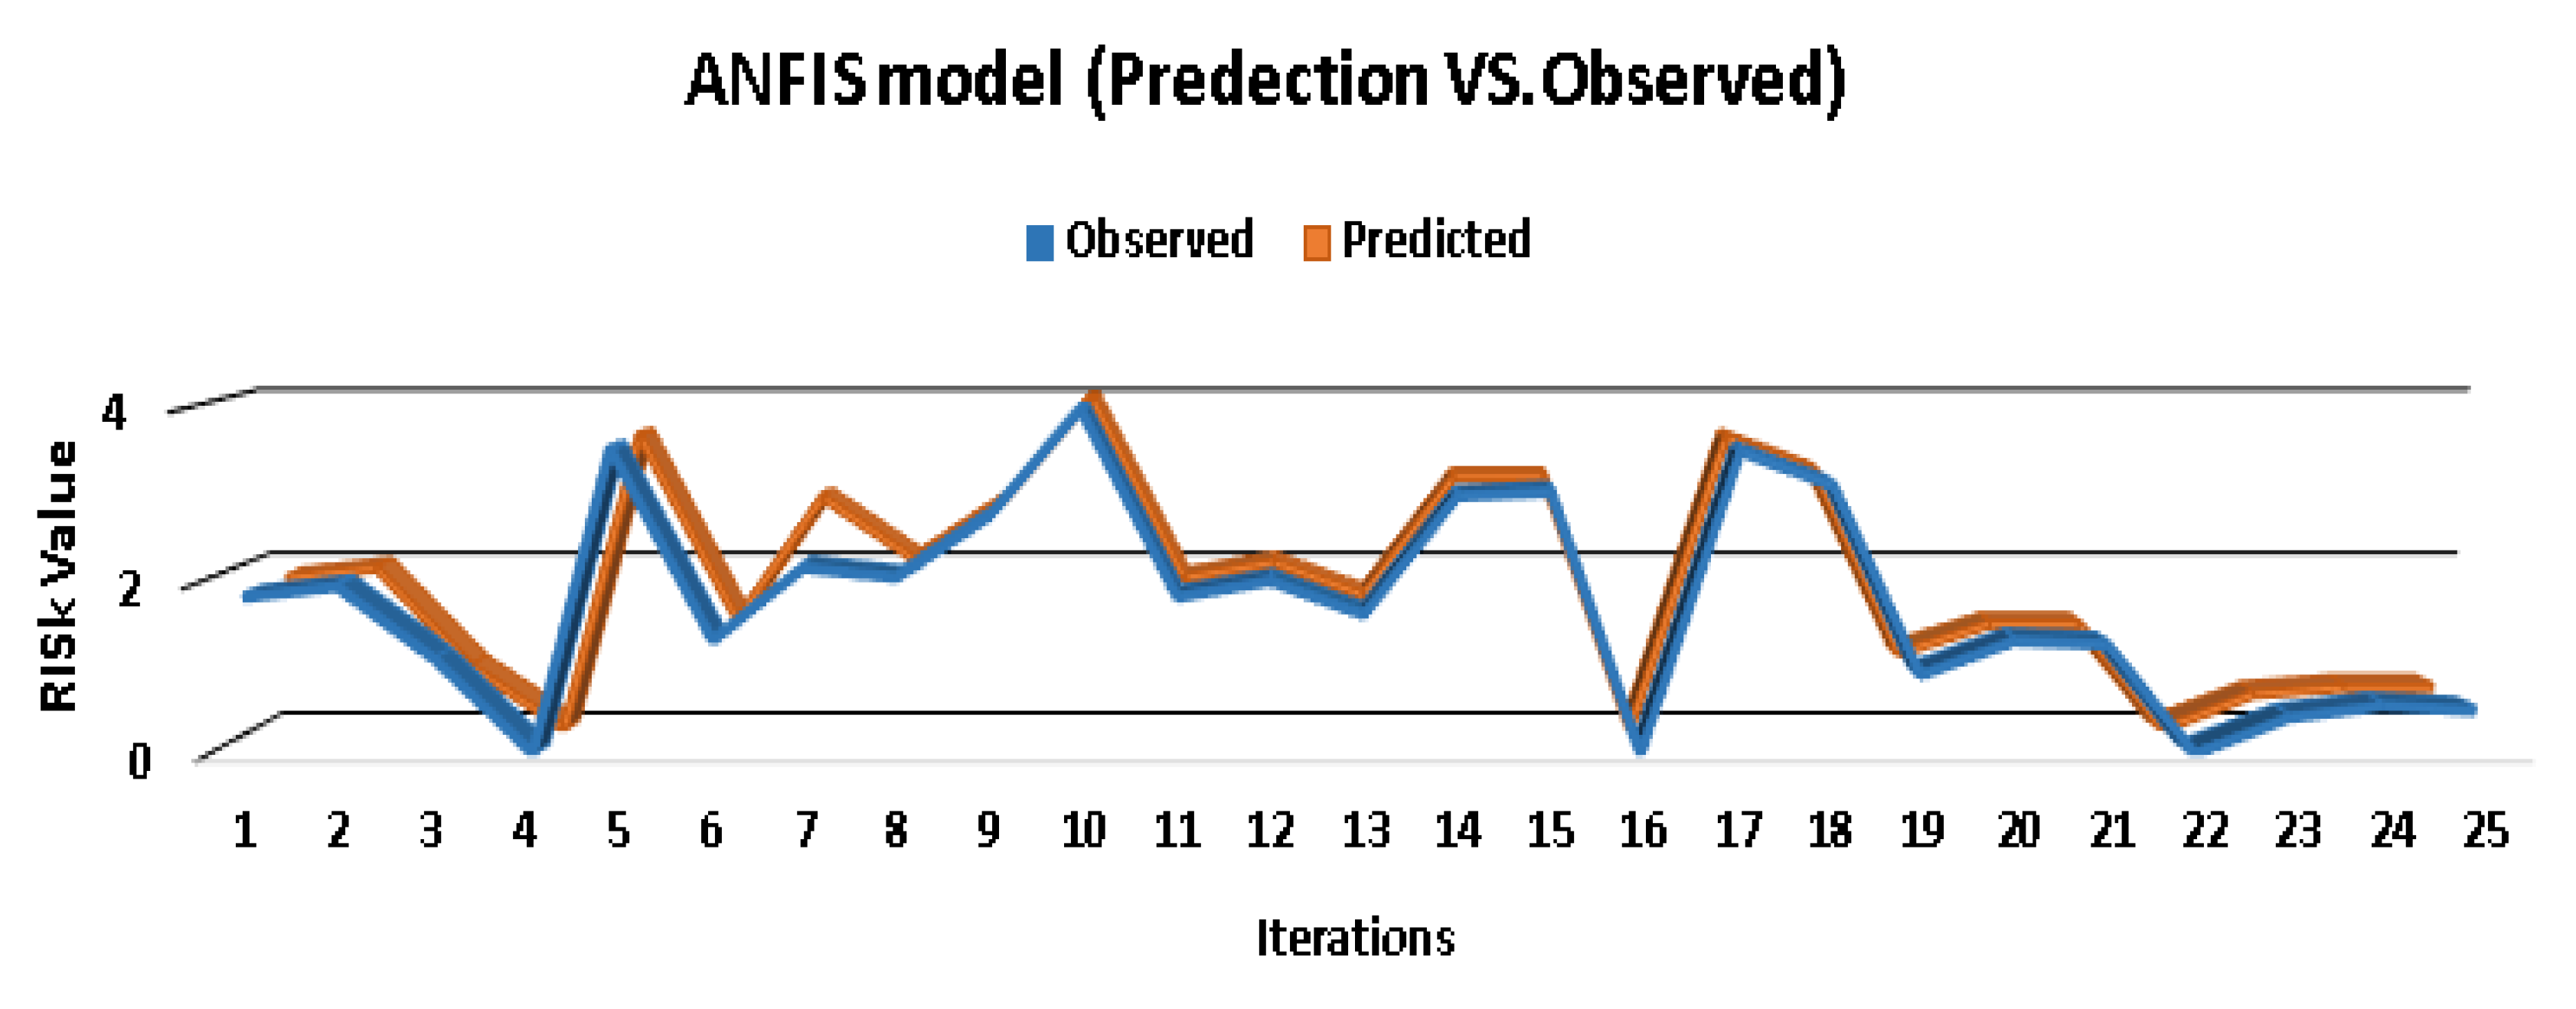

Table 1.
Review of flow prediction methods from previous studies.
| Reference | Method | Task | Data Source |
|---|---|---|---|
| [27] | Deep learning | Safety prediction of rail transit system | Datasets based on the Beijing metro in China |
| [28] | K-means and the entropy method | The risk of passenger flow congestion | 3rd ring road corridor in Beijing (the bus passenger) |
| [29] | Deep residual neural network framework | Forecast metro station crowd flows | Using the records collected by automated fare collection (AFC) data in Suzhou, China |
| [30] | Interpretative Structural Modeling (ISM) | Urban rail transit operation safety evaluation | Beijing metro |
| [31] | Failure mode and effects criticality analysis (FMECA) | Risk evaluation of railway rolling stock failures | Data collected from the literature, the company’s maintenance management software system called EQUINOX and the UK’s railway performance management software DATASYS BUGLE |
| [32] | Analysed the whole process of safety risk assessment | The concept of the safety risk assessment of large-scale railway stations | Beijing South railway station |
| [33] | Multilevel fuzzy comprehensive evaluation model | Operation safety of the large high-speed railway station. | Guangzhou South railway station in China |
| [34] | Data envelopment analysis (DEA) | Design the risk evaluation index system of crowd agglomeration and stampedes | In 13 subway stations in Beijing |
| [35] | Bayesian network | Safety risk interactions in rail stations | Risk events were collected from 62 stations worldwide and 241 from China |
| [36] | Quantitative statistics for safety risk analysis | Metro incident management | Shanghai metro operation incident database (MOID) |
| [37] | Fuzzy analytical hierarchy | Analysis of operation risk factors of urban rail transit | Experts’ judgement information |
| [17] | Risk evaluation model | For the safety of passengers and improving the operation efficiency in metro stations | A practical application in Beijing’s GuoMao metro station. |
| [38] | Multi-Criteria Decision-Making (MCDM) model | Train derailment risk response strategy | Yangyangcheng station in Shenmu city in China |
| [39] | Nonparametric regression model | Predicting the transfer passenger flow to forecast pedestrian congestions | Transfer passenger flow for one month in the XIDAN transfer station |
| [40] | Grey clustering and dynamic identification method | Passenger flow congestion risk in rail transit hub station | Real-time data of AFC (Automatic Fare Collection) system from Dongzhimen rail transit hub station in China |
| [41] | Combines failure mode and effect analysis (FMEA) and pessimistic–optimistic fuzzy information axiom (POFIA) considering acceptable risk coefficient (ARC) | Evaluate the risk of railway dangerous goods transportation system | The historical data of Chinese railway dangerous goods transportation system (RDNGTS) accidents from 1986 to 2017 |
| [42] | Nonparametric regression model | Forecasting traffic flow incidents | Collected incident-free data in the freeway in San Francisco Bay |
| [43] | Online spatio-temporal | Crowd flow prediction | Dataset of Sydney trains network and the weather data from the Australian Bureau of Meteorology |
| [44] | Fusion of support vector regression and neural network | Predicting abnormal passenger flow | Yangji station in Guangzhou, China |
| [45] | Combining fuzzy petri net (FPN) and fault tree analysis (FTA) | Railway safety risk assessment and control optimization. | The Shijiazhuang high-speed railway station |
| [46] | Algorithm utilizing the cost theory and automatic frequency control (CT-AFC) | Railway passenger flow recognition in the terminal station | A questionnaire survey of the passenger travel characteristics for the passengers of the Shanghai railway, AFC data and dynamic video data |
| [47] | Deep learning method | Analysis of railway accidents | The accident reports from the Federal Railroad Administration (FRA) in the U.S. |
| [48] | Multiscale radial basis function network | Forecasting the irregular fluctuation of subway passenger flows | Transit smart card data in Beijing’s subway |
| [49] | Machine learning for safety at railway stations | Analysis of accidents at railway stations | The history of the accidents at railway stations in the UK |
| [50] | Text mining and natural language process (NLP) techniques | Extraction and analysis of risk factors | Chinese railway accident reports |
| [51] | Hybrid particle swarm optimization and support vector machine PSO–SVM model | A hybrid risk-prediction framework for design safety of metro station construction | Using an expert interview method |
| [52] | Big data and natural language processing | Identify heightened risk on the railway | Reports of railway accidents in the UK from 2008 to 2010 |
| [53] | An ordinal regression model | Assessing safety and security in a railway station as perceived by travellers | Data collected from a survey carried out in the station of Frosinone (Italy) |
| [54] | A safety-related risk assessment model | Design practices regarding passenger hazard | National Thai station design practices as a baseline |
| [55] | Analytic hierarchy process (AHP) | Safety risk assessment of railway station | A Wuhan railway station in China |
| [56] | Dispatching fault log management and analysis database system ((DFLMIS) | Risk early-warning and promoting the safety management level of metro | Shanghai rail transit operation data in China |
| [57] | Cause Consequence Analysis (CCA) and Fuzzy Causal Model (FCM) | Risk analysis initiated by human factors (passengers and operators) | Historical incident data from metro Beijing operational risks in China |
| [58] | Nonlinear combined weighting method based on AHP and entropy-weighted method | Risk assessment of railway freight station | A station in North China |
Table 2.
Example of the calculated data in the station platform during peak time Lu and Han (2016).
| Time | Transfer Passenger % | Train Capacity % | Stranded Passengers % | Waiting Passengers % | Stranded Ratio % | Transfer Efficiency |
|---|---|---|---|---|---|---|
| 7:31:30 | 0.77 | 100 | 0.00 | 68.29 | 0 | 1.62 |
| 7:33:30 | 0.65 | 100 | 0.00 | 57.62 | 0 | 1.62 |
| 7:35:30 | 0.78 | 100 | 0.00 | 68.90 | 0 | 1.62 |
| 7:37:30 | 0.78 | 100 | 0.00 | 69.21 | 0 | 1.45 |
| 7:39:30 | 0.76 | 100 | 0.00 | 67.07 | 0 | 1.45 |
| 7:41:30 | 0.84 | 0.83 | 0.40 | 74.70 | 0.11 | 1.45 |
| 7:43:30 | 0.88 | 0.83 | 0.55 | 85.98 | 0.13 | 1.28 |
| 7:45:30 | 0.82 | 0.83 | 0.31 | 83.84 | 0.07 | 1.28 |
| 7:47:30 | 0.75 | 0.83 | 0.00 | 72.56 | 0 | 1.28 |
| 7:49:30 | 0.93 | 0.83 | 0.80 | 82.62 | 0.19 | 1.55 |
| 7:51:30 | 0.83 | 0.83 | 0.32 | 89.02 | 0.07 | 1.55 |
| 7:53:30 | 0.87 | 0.83 | 0.49 | 82.93 | 0.12 | 1.55 |
| 7:55:30 | 0.86 | 0.83 | 0.45 | 85.06 | 0.10 | 1.67 |
| 7:57:30 | 0.89 | 0.83 | 0.62 | 87.80 | 0.14 | 1.67 |
| 7:59:30 | 0.98 | 0.83 | 1.00 | 98.78 | 0.20 | 1.67 |
| 8:01:30 | 0.90 | 100 | 0.63 | 99.09 | 0.13 | 1.22 |
| 8:03:30 | 0.90 | 100 | 0.65 | 92.07 | 0.14 | 1.22 |
| 8:05:30 | 0.87 | 100 | 0.51 | 89.63 | 0.11 | 1.22 |
| 8:07:30 | 0.93 | 100 | 0.80 | 92.68 | 0.17 | 1.47 |
| 8:09:30 | 0.95 | 100 | 0.88 | 100.00 | 0.17 | 1.47 |
| 8:11:30 | 0.72 | 100 | 0.00 | 81.40 | 0 | 1.47 |
| 8:13:30 | 0.92 | 0.83 | 0.75 | 81.71 | 0.18 | 1.61 |
| 8:15:30 | 0.93 | 0.83 | 0.80 | 97.56 | 0.16 | 1.61 |
| 8:17:30 | 0.96 | 100 | 0.25 | 100 | 0.05 | 1.61 |
| 8:19:30 | 1.00 | 100 | 0.42 | 93.29 | 0.09 | 1.26 |
| 8:21:30 | 1.00 | 100 | 0.43 | 96.65 | 0.09 | 1.26 |
| 8:23:30 | 0.81 | 100 | 0.00 | 79.88 | 0 | 1.26 |
| 8:25:30 | 0.93 | 100 | 0.12 | 82.62 | 0.03 | 1.21 |
| 8:27:30 | 0.94 | 100 | 0.18 | 85.98 | 0.04 | 1.21 |
| 8:29:30 | 0.94 | 100 | 0.15 | 86.59 | 0.04 | 1.21 |
Table 3.
Scale of the level of the risk probability (green: low risk; yellow; moderate risk; red: high risk).
Table 3.
Scale of the level of the risk probability (green: low risk; yellow; moderate risk; red: high risk).
| Result | Description (Retention Rate of the Platform) | Description (Transfer Efficiency) | Risk Levels Indexes |
|---|---|---|---|
| Very unlikely | Full capacity and have chance to ride without being stranded | Passengers can move easily | D |
| Unlikely | A few stand and wait for the next train | A few lines before the lift and stairs | C |
| Likely | Some are waiting for the next train | Some lines before the lift and stairs | B |
| Very likely | Highly crowded and no chance to ride | Very slow movement | A |
Table 4.
Risk matrix and the scale for two indexes (green: low risk; yellow; moderate risk; red: high risk).
Table 4.
Risk matrix and the scale for two indexes (green: low risk; yellow; moderate risk; red: high risk).
| Index 1 | Index 2 | Risk Levels of Indexes 1 & 2 | Risk Values Index 1 | Ratio Range of Index 2 | The Scale Factor (R) of Index 2 | Risk Value Level | ||||||||
|---|---|---|---|---|---|---|---|---|---|---|---|---|---|---|
| A | B | C | D | A | B | C | D | |||||||
| Index 1 | A | D | R ≤ 0 | 1.3 < R ≤ 1 | 32.5 ≤ R ≤ 0 | 4 | ||||||||
| B | ||||||||||||||
| C | C | 0 < R ≤ 15 | 1.7 < R ≤ 1.3 | 42.5 < R < 32.5 | 3 | |||||||||
| D | ||||||||||||||
| Index 2 | A | B | 15 < R < 50 | 2 < R ≤ 1.7 | 50 < R ≤ 42.5 | 2 | ||||||||
| B | ||||||||||||||
| C | A | R ≥ 50 | R ≥ 2 | R ≥ 50 | 1 | |||||||||
| D | ||||||||||||||
Table 5.
Combinations of hyperparameter optimization models error measures.
| Model Type | RMSE | R2 | MSE | MAE |
|---|---|---|---|---|
| Optimizable SVM | 0.013656 | 0.99 | 0.0001864 | 0.01128 |
| Optimizable Tree | 0.063478 | 0.82 | 0.0040295 | 0.051834 |
| Optimizable GPR | 0.00647 | 1 | 0.00004194 | 0.0054809 |
| Optimizable Ensemble | 0.02726 | 0.97 | 0.0007431 | 0.020145 |
Table 6.
RMSE results for different membership functions (MFs) with Membership Functions Number (4*4) from the training and testing datasets.
Table 6.
RMSE results for different membership functions (MFs) with Membership Functions Number (4*4) from the training and testing datasets.
| ANFIS Info | MF | Number of Nonlinear Parameters | Training RMSE | Testing RMSE | ||
|---|---|---|---|---|---|---|
| Back Propagation | Hybrid | Back Propagation | Hybrid | |||
| Grid partition Method | trimf | 24 | 0.073364 | 0.000119 | 0.214272 | 0.234563 |
| trapmf | 32 | 0.064496 | 0.000061 | 0.152923 | 0.771647 | |
| gbellmf | 24 | 0.063835 | 0.000001 | 0.100628 | 0.103621 | |
| gaussmf | 16 | 0.063897 | 0.000001 | 0.176282 | 0.079462 | |
| Gauss2mf | 32 | 0.074480 | 0.000001 | 0.136584 | 0.87736 | |
| pimf | 32 | 0.058077 | 0.000061 | 0.19069 | 3.89485 | |
| dsigmf | 32 | 0.071541 | 0.000000 | 0.117291 | 0.726872 | |
| psigmf | 32 | 0.039306 | 0.000000 | 0.717619 | 0.720104 | |
| Number of linear parameters | 48 | |||||
| Number of Epochs | 150 | |||||
| Number of nodes | 53 | |||||
© 2020 by the authors. Licensee MDPI, Basel, Switzerland. This article is an open access article distributed under the terms and conditions of the Creative Commons Attribution (CC BY) license (http://creativecommons.org/licenses/by/4.0/).
Share and Cite
MDPI and ACS Style
Alawad, H.; An, M.; Kaewunruen, S. Utilizing an Adaptive Neuro-Fuzzy Inference System (ANFIS) for Overcrowding Level Risk Assessment in Railway Stations. Appl. Sci. 2020, 10, 5156. https://doi.org/10.3390/app10155156
AMA Style
Alawad H, An M, Kaewunruen S. Utilizing an Adaptive Neuro-Fuzzy Inference System (ANFIS) for Overcrowding Level Risk Assessment in Railway Stations. Applied Sciences. 2020; 10(15):5156. https://doi.org/10.3390/app10155156
Chicago/Turabian StyleAlawad, Hamad, Min An, and Sakdirat Kaewunruen. 2020. "Utilizing an Adaptive Neuro-Fuzzy Inference System (ANFIS) for Overcrowding Level Risk Assessment in Railway Stations" Applied Sciences 10, no. 15: 5156. https://doi.org/10.3390/app10155156
Note that from the first issue of 2016, this journal uses article numbers instead of page numbers. See further details here.