Article

Seismic AVOA Inversion for Weak Anisotropy Parameters and Fracture Density in a Monoclinic Medium

1
School of Earth Science and Technology, Southwest Petroleum University, Chengdu 610500, China
2
State Key Laboratory of Petroleum Resources and Prospecting, China University of Petroleum, Beijing 102249, China
*
Author to whom correspondence should be addressed.
Appl. Sci. 2020, 10(15), 5136; https://doi.org/10.3390/app10155136
Submission received: 24 June 2020 / Revised: 16 July 2020 / Accepted: 22 July 2020 / Published: 26 July 2020
(This article belongs to the Special Issue Advances in Applied Geophysics)

Abstract

:
In shale gas development, fracture density is an important lithologic parameter to properly characterize reservoir reconstruction, establish a fracturing scheme, and calculate porosity and permeability. The traditional methods usually assume that the fracture reservoir is one set of aligned vertical fractures, embedded in an isotropic background, and estimate some alternative parameters associated with fracture density. Thus, the low accuracy caused by this simplified model, and the intrinsic errors caused by the indirect substitution, affect the estimation of fracture density. In this paper, the fractured rock of monoclinic symmetry assumes two non-orthogonal vertical fracture sets, embedded in a transversely isotropic background. Firstly, assuming that the fracture radius, width, and orientation are known, a new form of P-wave reflection coefficient, in terms of weak anisotropy (WA) parameters and fracture density, was obtained by substituting the stiffness coefficients of vertical transverse isotropic (VTI) background, normal, and tangential fracture compliances. Then, a linear amplitude versus offset and azimuth (AVOA) inversion method, of WA parameters and fracture density, was constructed by using Bayesian theory. Tests on synthetic data showed that WA parameters, and fracture density, are stably estimated in the case of seismic data containing a moderate noise, which can provide a reliable tool in fracture prediction.

1. Introduction

In a variety of complex oil and gas reservoirs, fractured reservoirs widely exist in shale and igneous rock. Natural and induced fractures in reservoirs play an important role in determining fluid flow during production, and knowledge of the orientation and density of fractures is useful to optimize production from fractured reservoirs [1]. Areas of high fracture density may represent ‘sweet spots’ of high permeability, and it is important to be able to target such locations for infill drilling [2]. Recent developments in geophysics have revealed the viscous behavior of the underground strata, and demonstrated that the propagation of seismic waves has dispersion and attenuation, for fluid discrimination in porous rocks [3,4,5]. However, there are methods available to compensate for dispersion and attenuation. In the current implementation of the method, we also ignore the loss of seismic amplitude due to attenuation. Seismic anisotropy is defined as the dependence of seismic velocity upon angle. P-waves propagating parallel to fractures are faster than those propagating perpendicular to fractures [6]. For transversely isotropic (TI) media, empirical and analytical studies have shown that the presence of anisotropy can significantly distort conventional amplitude variation with offset (AVO) analysis [7,8,9], and that soil and rock anisotropy can markedly affect the dynamic and seismic response of geostructures [10,11,12].
Previous anisotropic models used to invert the seismic response of fractured reservoirs often assume a single set of aligned fractures, with horizontally transverse isotropic (HTI) symmetry [13,14], whereas most reservoirs contain several sets of fractures with variable orientations within a given fracture set [15,16,17]. Furthermore, in the HTI model, horizontal layering of the crust, leading to a polar anisotropic background (vertical transverse isotropic, VTI), is ignored. Hence, HTI is not a suitable model for the sedimentary crust. Reflection amplitudes have advantages over seismic velocities for characterizing fractured reservoirs, because they have higher vertical resolution, and are more sensitive to the properties of the reservoir. Therefore, amplitude versus offset and azimuth (AVOA) inversion is an effective method for predicting fractures [18]. The Zoeppritz equation for HTI anisotropy is obtained by linearized approximation [13]. Using the linear P-wave reflection coefficient formula, the feasibility of fracture compliance tensor inversion in orthorhombic and monoclinic media is analyzed [6,19]. In the inversion process, it is assumed that the weak anisotropy (WA) parameters of VTI background media are known. Under the assumption of HTI and orthogonal media, the elastic impedance (EI) is re-expressed in terms of the normal and tangential fracture weaknesses, and the EI inversion for fracture weaknesses is implemented, based on the linear-slip model [20,21]. Based on HTI media, many scholars have used normal move out (NMO) velocity elliptical inversion, or prestack AVOA inversion, to indirectly calculate fracture density. Scholars [22] have implemented a qualitative analysis of fracture density and orientation, based on P-wave (PP) and converted wave (PS) velocity anisotropy. They have used elliptical inversion to estimate the magnitude of anisotropy associated with fracture density, from PP data, and then qualitatively estimated fracture density, from time differences of the fast and slow PS velocities. It has been suggested that the difference in NMO times be used to estimate the axial ratio of the ellipse, which is proportional to fracture density [23]. A non-linear Bayesian inversion of the seismic amplitude versus incident and azimuthal angle (AVAZ) and dynamic production data is used to calculate the fracture density and aperture for an HTI fractured reservoir in which the fracture parameters are invariant [24]. The prestack AVAZ inversion method is used to extract the anisotropy parameters or shear-wave splitting factor, γ , which is related to fracture density [25]. The inversion algorithm has also been deeply studied by many scholars [26,27,28].
However, with indirect substitution there exists intrinsic errors, and the inversion methods based on simplified models such as the HTI medium can be misleading when applied to shale fractured reservoirs with a complex medium. These limit the improvement to the prestack inversion accuracy. Therefore, it cannot satisfy the accuracy requirements for obtaining fracture density.
In this paper, based upon previous research, and combined with rock physics theories, assuming that the fracture reservoir has monoclinic symmetry, and under the condition that the fracture radius, width, and orientation are known, we derived a new form of P-wave reflection coefficient, consisting of the WA parameters, and the fracture density. This was achieved by substituting the stiffness coefficients of the VTI background, and normal and tangential fracture compliances. The new form of P-wave reflection coefficient was then used to build a theoretical framework of linear AVOA inversion, based on Bayesian theory, that can avoid the assumption that the WA parameters of VTI background media are known, and avoid the intrinsic errors introduced from the indirect substitution. Finally, synthetic data, which contain Gaussian random noise with different signal-to-noise ratios (SNRs), were utilized to verify the stability of the proposed approach.

2. Methods

2.1. Elastic Compliance Tensor of Fractured Medium

In an elastic medium that contains an arbitrary number of sets of fractures, with an arbitrary orientation distribution, by using the divergence theorem and Hooke’s law, it can be shown that the elastic compliance tensor of the fractured medium can be written in the following form [29,30]:
S i j k l = S i j k l 0 + Δ S i j k l
where S 0 is the compliance matrix of the medium (including the effects of pores, cracks, and stress, except for those fractures explicitly included in Δ S ). The subscripts i, j, k, and l are the free index. The effective excess compliance Δ S i j k l , due to the presence of the fractures, with rotationally invariant shear compliance, can be written as [27]:
Δ S i j k l = 1 4 ( δ i k α j l + δ i l α j k + δ j k α i l + δ j l α i k ) + β i j k l .
Here, δ i j is the Krönecker delta, α i j is a second-rank tensor, and β i j k l is a fourth-rank tensor. If the two fracture sets are not orthogonal, but are perfectly aligned (within each set), the compliance tensors become [6]:
α = N V 1 A ¯ 1 B ¯ T 1 [ sin 2 φ 1 cos φ 1 sin φ 1 0 cos φ 1 sin φ 1 cos 2 φ 1 0 0 0 0 ] + N V 2 A ¯ 2 B ¯ T 2 [ sin 2 φ 2 cos φ 2 sin φ 2 0 cos φ 2 sin φ 2 cos 2 φ 2 0 0 0 0 ]
β = N V 1 A ¯ 1 ( B ¯ N 1 B ¯ T 1 ) [ sin 4 φ 1 sin 2 φ 1 cos 2 φ 1 0 0 0 2 sin 3 φ 1 cos φ 1 sin 2 φ 1 cos 2 φ 1 cos 4 φ 1 0 0 0 2 sin φ 1 cos 3 φ 1 0 0 0 0 0 0 0 0 0 0 0 0 0 0 0 0 0 0 2 sin 3 φ 1 cos φ 1 2 sin φ 1 cos 3 φ 1 0 0 0 4 sin 2 φ 1 cos 2 φ 1 ] + N V 2 A ¯ 2 ( B ¯ N 2 B ¯ T 2 ) [ sin 4 φ 2 sin 2 φ 2 cos 2 φ 2 0 0 0 2 sin 3 φ 2 cos φ 2 0 cos 4 φ 2 0 0 0 2 sin φ 2 cos 3 φ 2 0 0 0 0 0 0 0 0 0 0 0 0 0 0 0 0 0 0 2 sin 3 φ 2 cos φ 2 2 sin φ 2 cos 3 φ 2 0 0 0 4 sin 2 φ 2 cos 2 φ 2 ]
where N V is the number of fractures per unit volume (fracture density), A ¯ is the average area of the fractures in the set, B ¯ T and B ¯ N are the (area-weighted) average specific tangential and normal compliances, and φ is the azimuthal angle between the fracture strike and the survey 1-axis. The subscripts 1 and 2 denote the 1st and 2nd fracture set, respectively. If the background medium is isotropic, or transversely isotropic, and there are at least two non-orthogonal vertical fracture sets, this leads to monoclinic symmetry of the fractured rock, as shown in Figure 1.
The additional compliance, due to two or more sets of aligned vertical fractures not aligned with the coordinate system, has the form [6]:
Δ S = [ α 11 + β 1111 β 1122 0 0 0 α 12 + 2 β 1112 β 1122 α 22 + β 2222 0 0 0 α 12 + 2 β 1222 0 0 0 0 0 0 0 0 0 α 22 α 12 0 0 0 0 α 12 α 11 0 α 12 + 2 β 1112 α 12 + β 1222 0 0 0 α 11 + α 22 + 4 β 1122 ]
When the fracture’s additional compliance Δ S is small, one can directly calculate the stiffness matrix using the background stiffness matrix C 0 [2]:
C = C 0 C 0 Δ S C 0 .
We assumed a polar anisotropic background. An isotropic background is a special case of this. Thomsen [31] proposed a simple elastic constant expression:
V p = C 33 / ρ V s = C 44 / ρ ε = C 11 C 33 2 C 33 γ = C 66 C 44 2 C 44 δ = ( C 13 + C 44 ) 2 ( C 33 C 44 ) 2 2 C 33 ( C 33 C 44 ) .

2.2. PP-Wave Reflection Coefficient and Generalized Anisotropy Parameters

In this study, the elastic contrast between the overburden and the reservoir was assumed to be small. In this situation, the plane-wave/P-wave reflection coefficient for a plane separating media, with arbitrary elastic symmetry and with WA, can be written in the form [32]
R p p ( θ , ϕ ) = R P P i s o ( θ ) + 1 2 Δ ε z + 1 2 [ ( Δ δ x 8 V s ¯ 2 V p ¯ 2 Δ γ x ) cos 2 ϕ + ( Δ δ y 8 V s ¯ 2 V p ¯ 2 Δ γ y ) sin 2 ϕ + 2 ( Δ X z 4 V s ¯ 2 V p ¯ 2 Δ ε 45 ) cos ϕ sin ϕ Δ ε z ] sin 2 θ + 1 2 [ Δ ε x cos 4 ϕ + Δ ε y sin 4 ϕ + Δ δ z cos 2 ϕ sin 2 ϕ + 2 ( Δ ε 16 cos 2 ϕ + Δ ε 26 sin 2 ϕ ) cos ϕ sin ϕ ] sin 2 θ tan 2 θ
where R P P i s o ( θ ) denotes the weak-contrast reflection coefficient at an interface separating two slightly different isotropic media, and the generalized Thomsen anisotropy parameters are given by
δ x = A 13 + 2 A 55 V p 2 V p 2 , δ y = A 23 + 2 A 44 V p 2 V p 2 , δ z = A 12 + 2 A 66 V p 2 V p 2 , X z = A 36 + 2 A 45 V p 2 , ε 16 = A 16 V p 2 , ε 26 = A 26 V p 2 , ε 45 = A 45 V s 2 , ε x = A 11 V p 2 2 V p 2 , ε y = A 22 V p 2 2 V p 2 , ε z = A 33 V p 2 2 V p 2 , γ x = A 55 V s 2 2 V s 2 , γ y = A 44 V s 2 2 V s 2
where V p   and V s are the P- and S-wave velocities of the background isotropic medium, respectively, and A i j = C i j ρ is the density-normalized elastic stiffness.
Incorporating Equations (5) and (7) and substituting the density-normalized elastic stiffness of Equation (9), we obtained a new expression of the generalized Thomsen anisotropy parameters, for the monoclinic medium, in terms of WA parameters and the compliance tensors. These parameters are presented in Appendix A. Under the assumption of small compliance tensors and WA parameters, we neglected the product terms of the compliance tensors and the weak anisotropic parameters.
By substituting the generalized WA parameters in Equation (8) with Equation (A1), a P-wave reflection coefficient, in terms of WA parameters and the compliance tensors, was obtained:
R p p ( θ , ϕ ) = R P P i s o ( θ ) + R P P a d i ( θ ) + F 1 ( θ ) δ p s d + F 2 ( θ ) ε + F 3 ( θ , ϕ ) α 11 + F 4 ( θ , ϕ ) α 12 + F 5 ( θ , ϕ ) α 22 + F 6 ( θ , ϕ ) β 1111 + F 7 ( θ , ϕ ) β 1112 + F 8 ( θ , ϕ ) β 1122 + F 9 ( θ , ϕ ) β 1222 + F 10 ( θ , ϕ ) β 2222
where the pseudo weak anisotropic parameter δ p s d = M μ + 2 M δ . The second term on the righthand side is only a function of offset because the background is VTI, which does not depend on the azimuth. Equations for sensitivities, F, are given in Appendix B.
In order to realize the direct inversion of fracture density, the linear P-wave reflection coefficient, in terms of weak anisotropic parameters and fracture density, could be obtained by combining Equations (3) and (4) and Equation (10).
R p p ( θ , ϕ ) = R P P i s o ( θ ) + R P P a d i ( θ ) + F 1 ( θ ) δ p s d + F 2 ( θ ) ε + a ( θ , ϕ ) N V 1 + b ( θ , ϕ ) N V 2
where the sensitivities a ( θ , ϕ ) and b ( θ , ϕ ) for fracture density are given in Appendix C.
The interpretation of the fracture reservoir showed that the fracture apertures within hydrocarbon reservoirs were 5 mm, and the majority were 1 mm or less [1,33]. The length of the open fracture is dependent on the formation pressure. The numerical analysis results showed that an open fracture with a width of 1 mm generally does not exceed 40 cm in reservoir depth. However, it is probably reasonable to think of the 40 cm value as an average distance between weld points. In that case, the fracture length can be 1 m long or 30 m long [33]. However, fracture orientations of shale can be easily obtained by field exposure or the formation microimager (FMI) log [19]. In this paper, under the assumption that the fracture width, radius, and strike were known, the WA parameters and fracture density could be directly estimated by Equation (11).

2.3. Bayesian Inversion for Weak Anisotropy Parameters and Fracture Density

Assuming that there are two sets of fractures, we produced a matrix of data equations for the case of m incidence angles and n azimuthal angles:
[ d o b s ( θ 1 , ϕ 1 ) d o b s ( θ m , ϕ n ) ] = [ w ( θ 1 , ϕ 1 ) w ( θ m , ϕ n ) ] [ R P P i s o ( θ 1 ) + R P P a d i ( θ 1 ) R P P i s o ( θ m ) + R P P a d i ( θ m ) ] + [ w ( θ 1 , ϕ 1 ) w ( θ m , ϕ n ) ] [ F 1 ( θ 1 ) F 2 ( θ 1 ) a ( θ 1 , ϕ 1 ) b ( θ 1 , ϕ 1 ) F 1 ( θ m ) F 2 ( θ m ) a ( θ m , ϕ n ) b ( θ m , ϕ n ) ] [ δ p s d ε N V 1 N V 2 ] + [ n ( θ 1 , ϕ 1 ) n ( θ m , ϕ n ) ]
From the above equation, it can be seen that elastic parameters of the isotropic background should be known for the accurate inversion of weak anisotropic parameters and fracture density. The V p , V s , and ρ values for all layers of interest were obtained from well logs using Backus averaging [34]. The forward problem has the simple form:
d = W F m + n = L m + n
where the forward operator L = W F , n is random noise added into clear data, and the model parameters are:
m = [ δ p s d , ε , N V 1 , N V 2 ] T
and the wavelet matrix is:
W = [ w ( θ 1 , ϕ 1 ) w ( θ m , ϕ n ) ] .
In Bayesian theory, the posterior probability density function (PDF) is calculated by the prior PDF and the likelihood function [35]:
p ( m | d ) p ( m ) p ( d | m )
where p ( m | d ) is the posterior PDF, p ( m ) is the prior PDF, and p ( d | m ) is the likelihood function.
In the case of observed seismic data containing Gaussian random noise, the likelihood function p ( d | m ) is given by
p ( d | m ) = 1 ( 2 π σ e 2 ) N 2 exp { [ d G ( m ) ] T [ d G ( m ) ] 2 σ e 2 }
where σ e 2 is the variance of the noise, N is the number of the input data samples, and G is the linear operator G = L m .
Under the assumption of model parameters being independent of each other, the prior PDF p ( m ) was expressed as
p ( m ) = 1 ( 2 π ) N 2 | C m | 1 / 2 exp ( 1 2 m T C m 1 m )
where C m is the variance of the model parameters.
According to Bayesian theory, we could convert the inversion problem by solving the minimum value of the objective function
J ( m ) = 1 2 exp { 1 2 σ d 2 [ d G ( m ) ] T [ d G ( m ) ] + R ( m ) }
where R ( m ) = 1 2 m T C m 1 m , σ d 2 is the variance of data. By solving the derivative of the objective function with respect to the model parameters, we could obtain
J ( m ) m = 1 σ d 2 L T ( L m d ) + R ( m ) m
setting J ( m ) m to zero gives the model parameters
m = ( L T L + 1 2 μ h C m 1 ) 1 ( L T d + 1 2 μ h C m 1 )
where super parameter μ h allowed us to estimate the model parameters along the tuning curve, mainly through experiments. In this paper, the derived P-wave reflection coefficient, after removing the background effect, was completely linear, thus allowing us to invert the model parameters from seismic data d.

3. Numerical Analysis

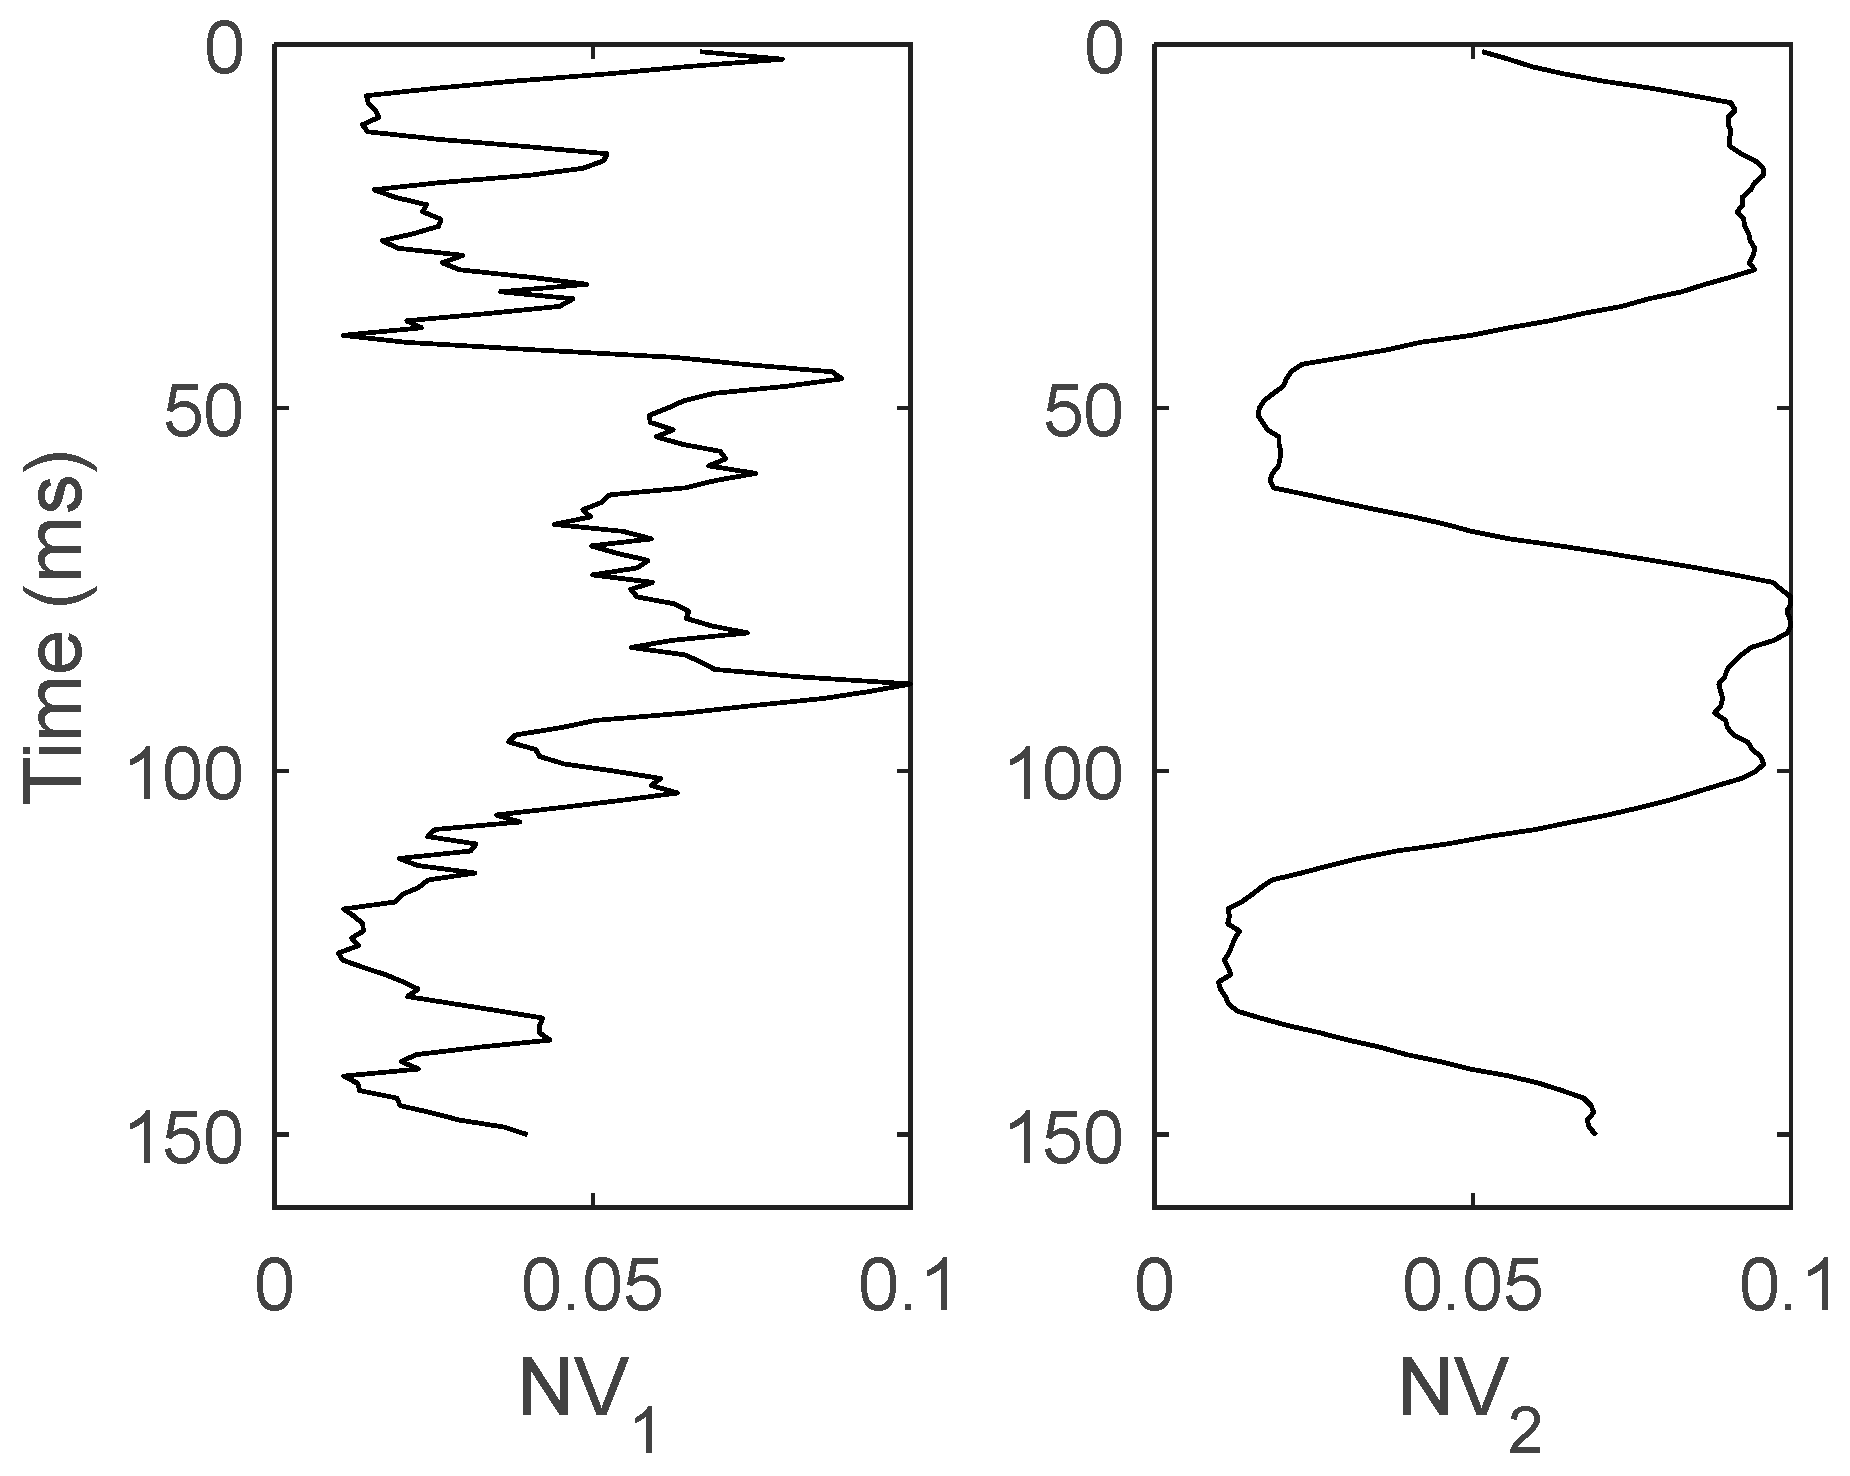
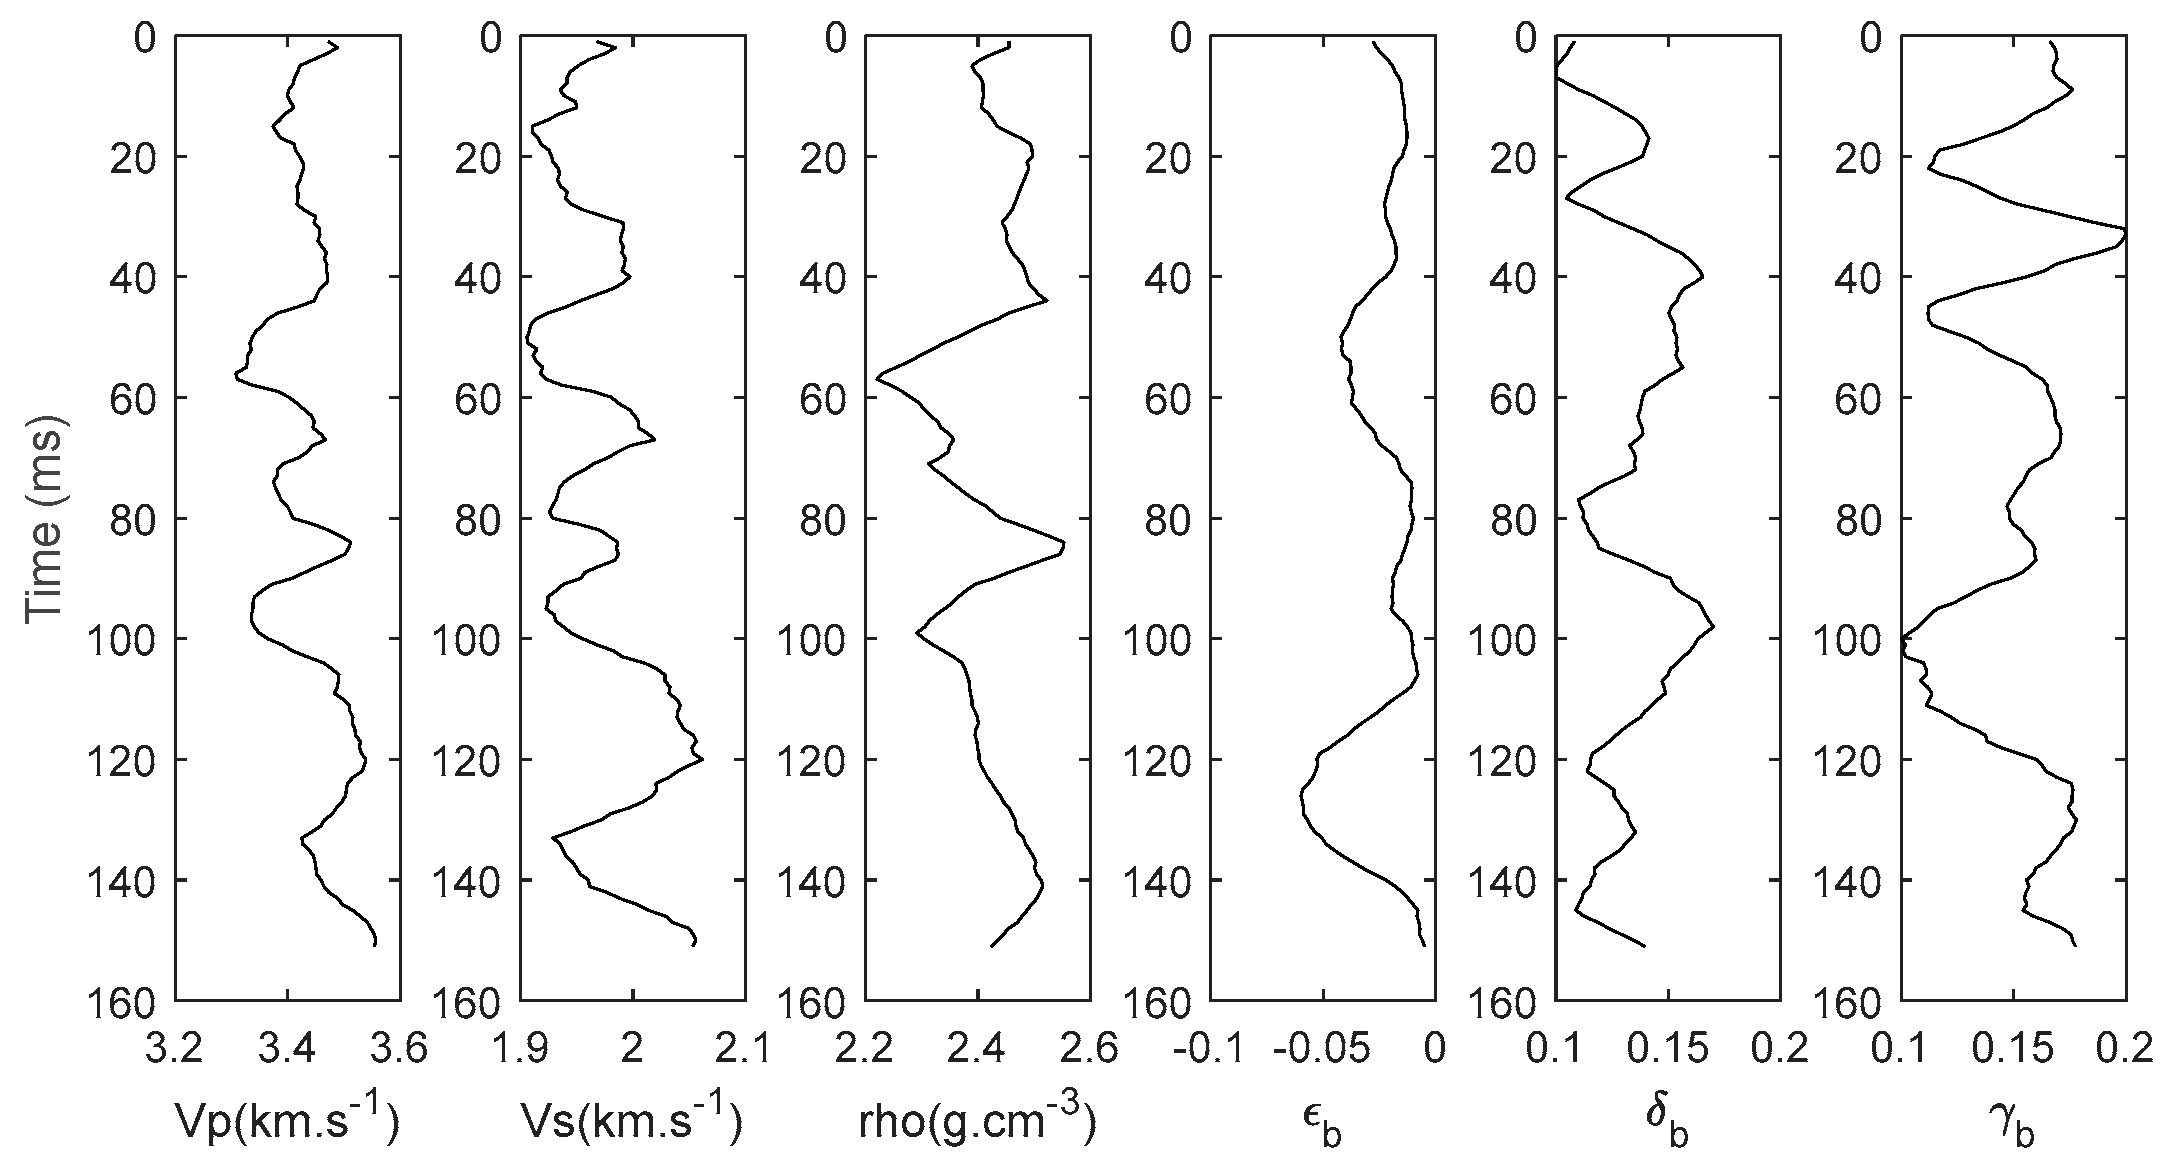
Synthetic seismic data were created by using interpretation results of well log data and vertical seismic profiling (VSP) data, which provided input for the AVOA inversion. It was assumed that the fracture medium had monoclinic symmetry, the azimuths of the two fracture sets were 10° and 70°, respectively, the average fracture width was 1 mm, the average fracture radius was 10 m, and the average area of the fracture was 0.02 m2. Figure 2 shows two sets of fracture densities from the well log interpretation results as model parameters for inversion. Figure 3 shows the well log and VSP interpretation results, among which the isotropic elastic parameters were used as the known parameters, to calculate the reflection coefficient of isotropic background and sensitivities.
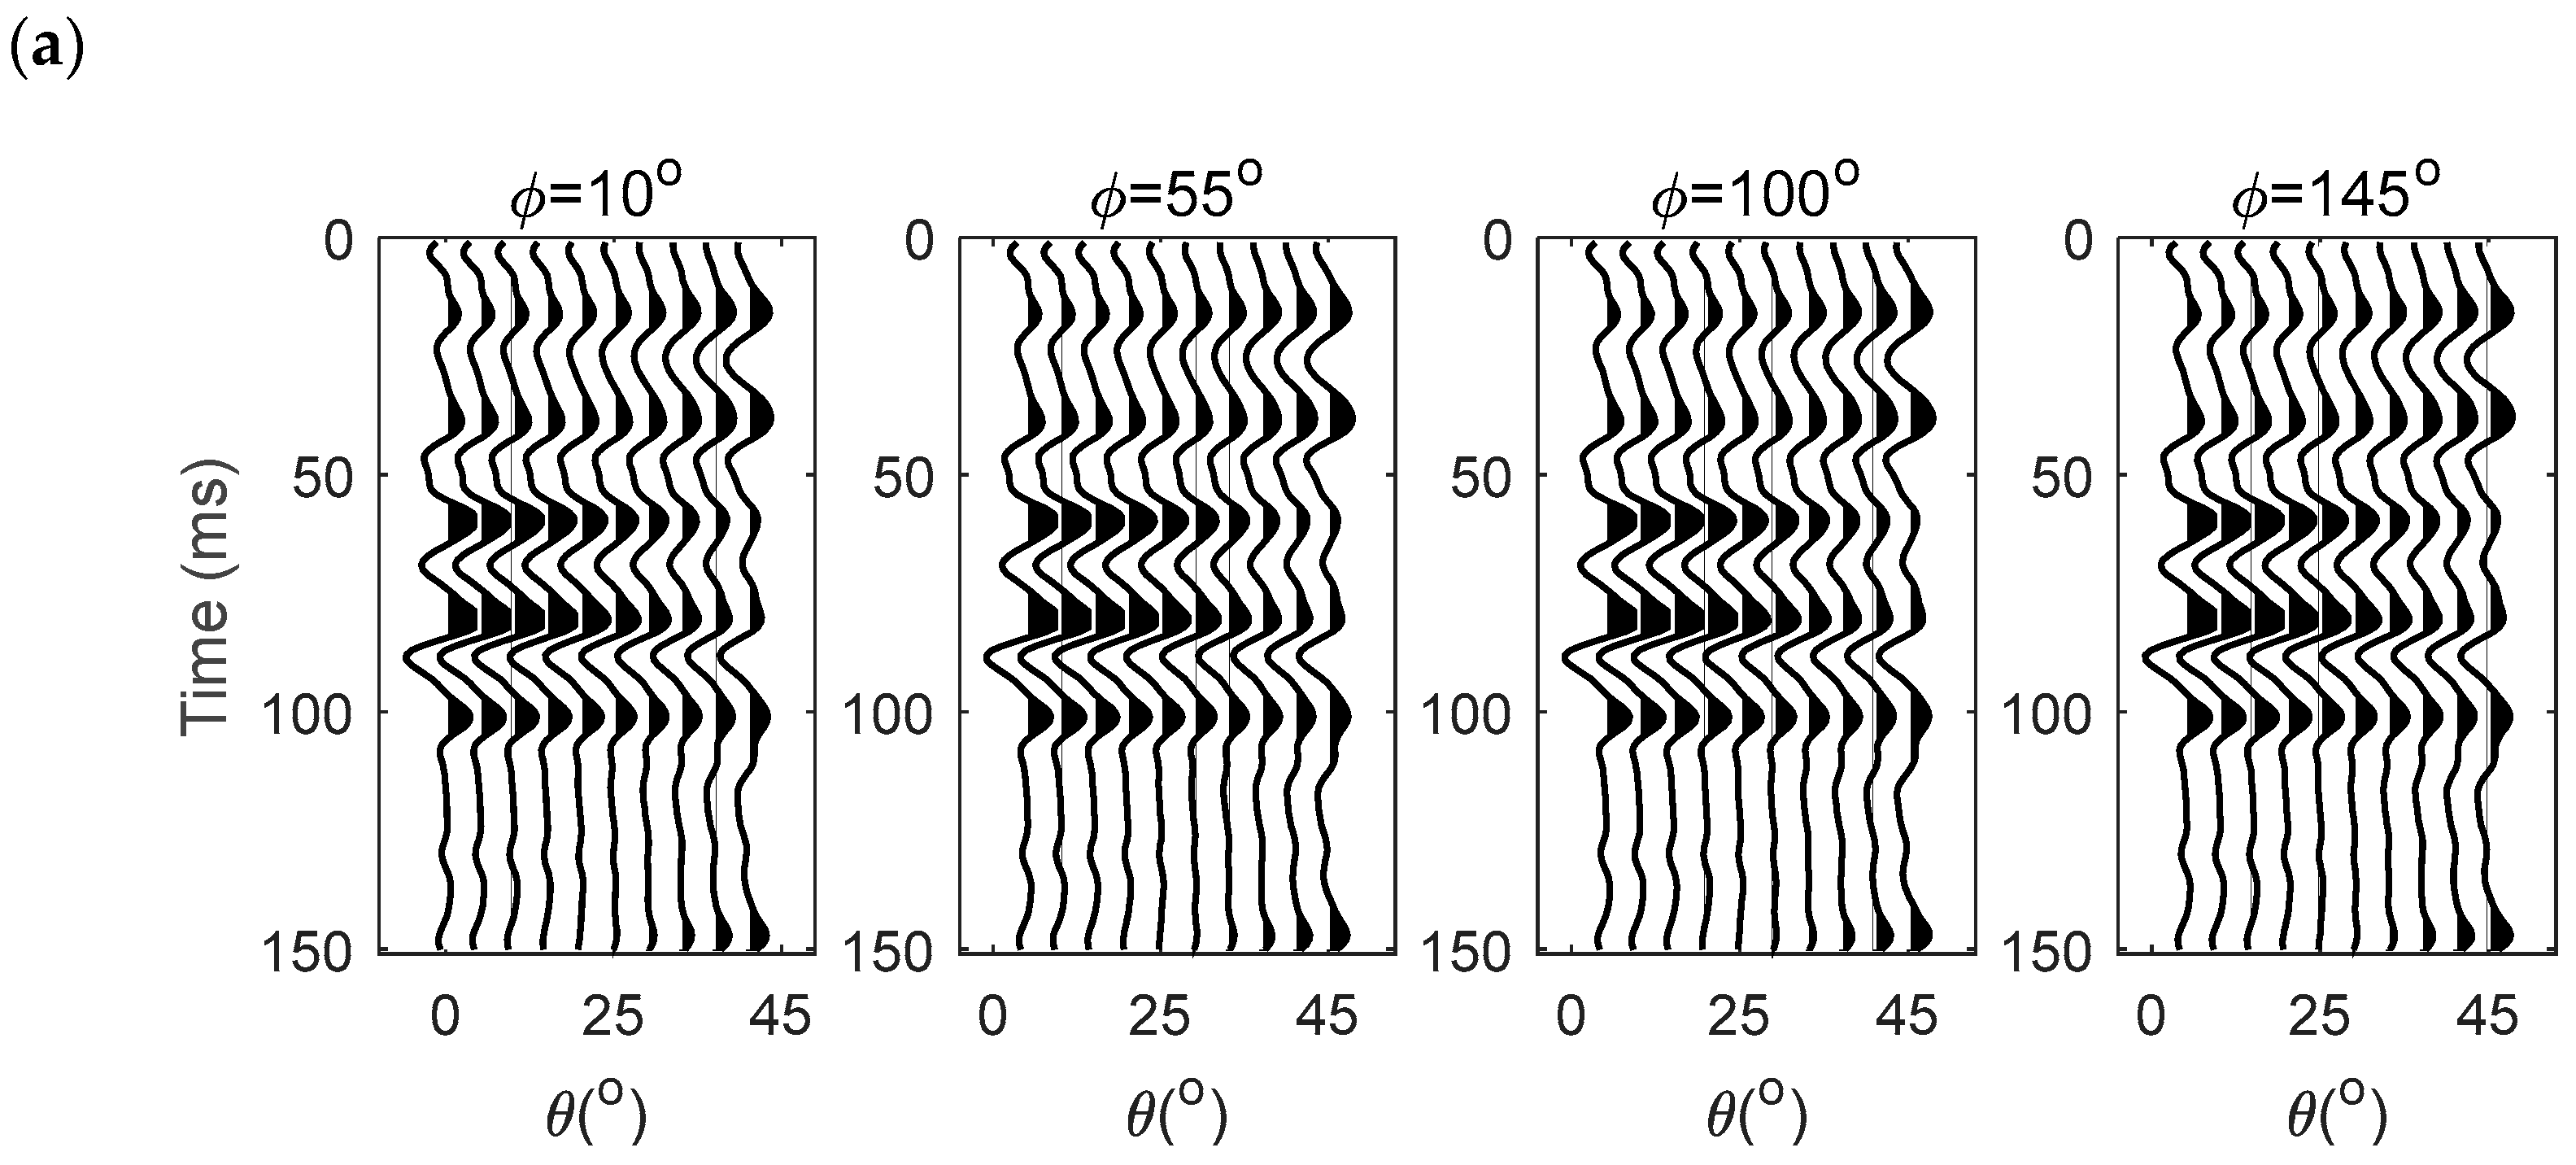
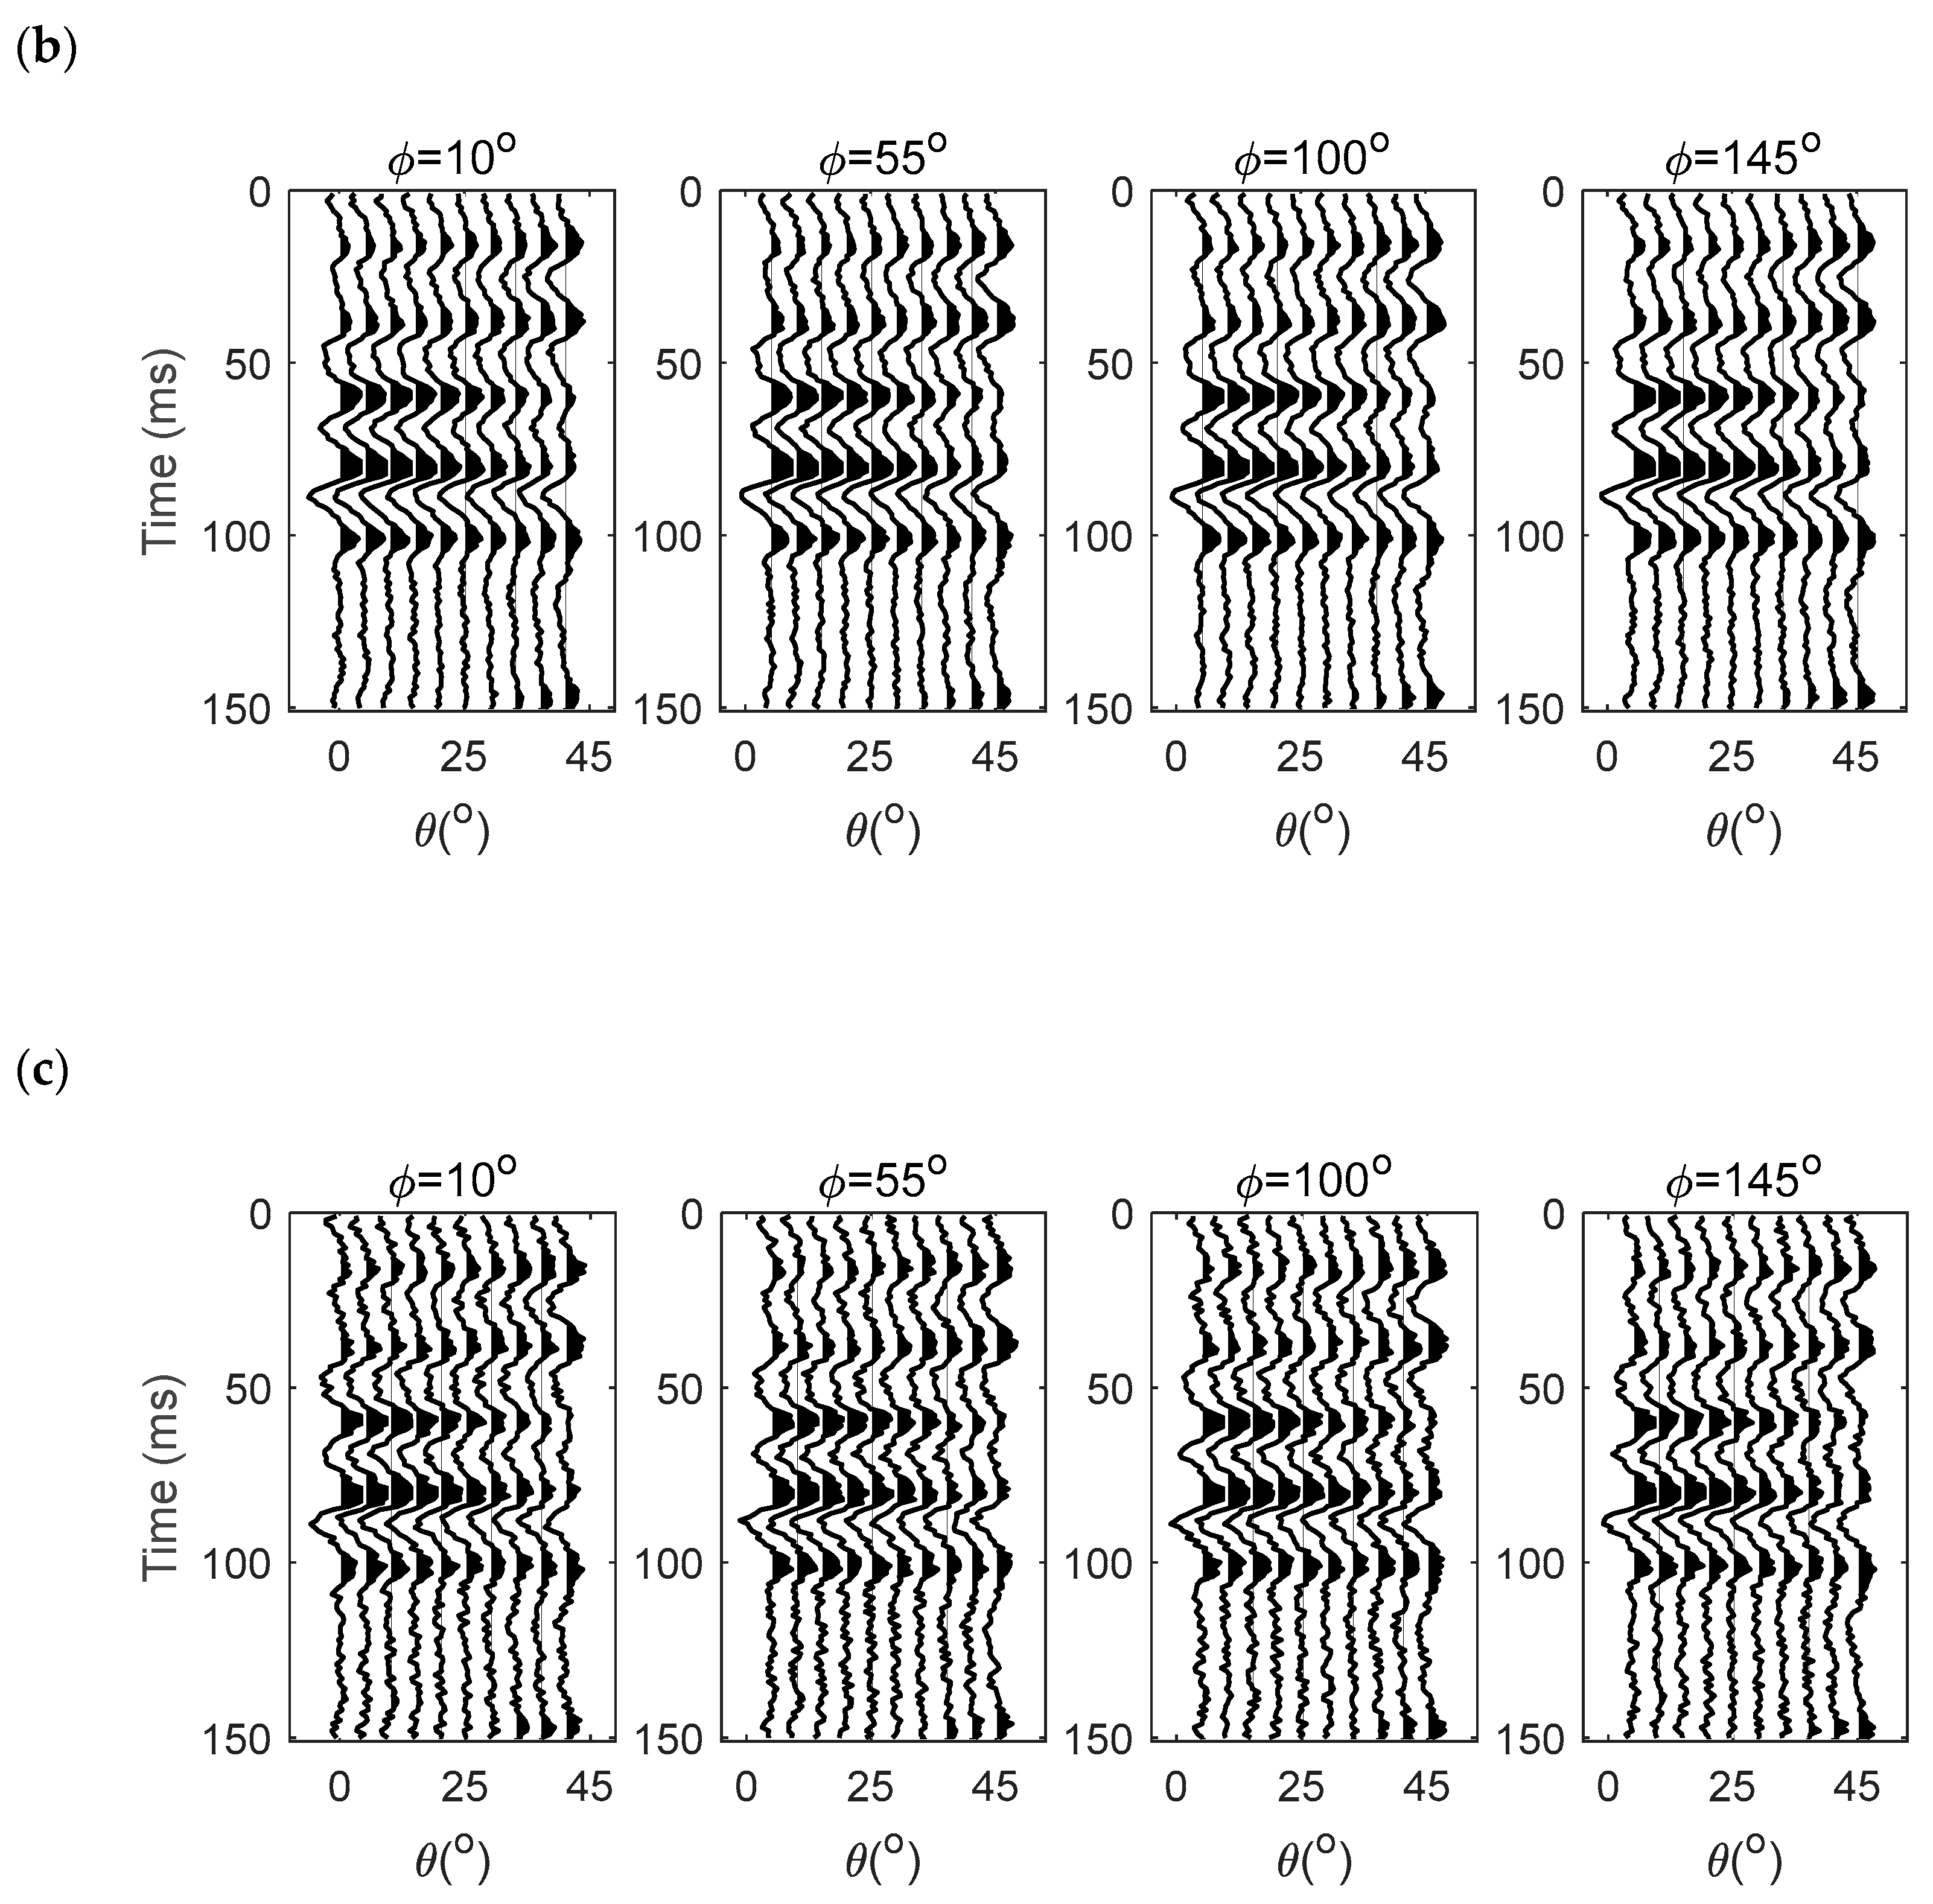
In order to test the robustness of the proposed inversion algorithm, synthetic seismic data were created by the model parameters shown in Figure 2 and Figure 3, as well as a 30 Hz Ricker wavelet, based on the derived PP-wave reflection coefficient, Equation (13), and the convolution model shown in Figure 4a. The incident angle had 10 angles between 0° and 45°, and the azimuths were 10°, 55°, 100°, and 145°.
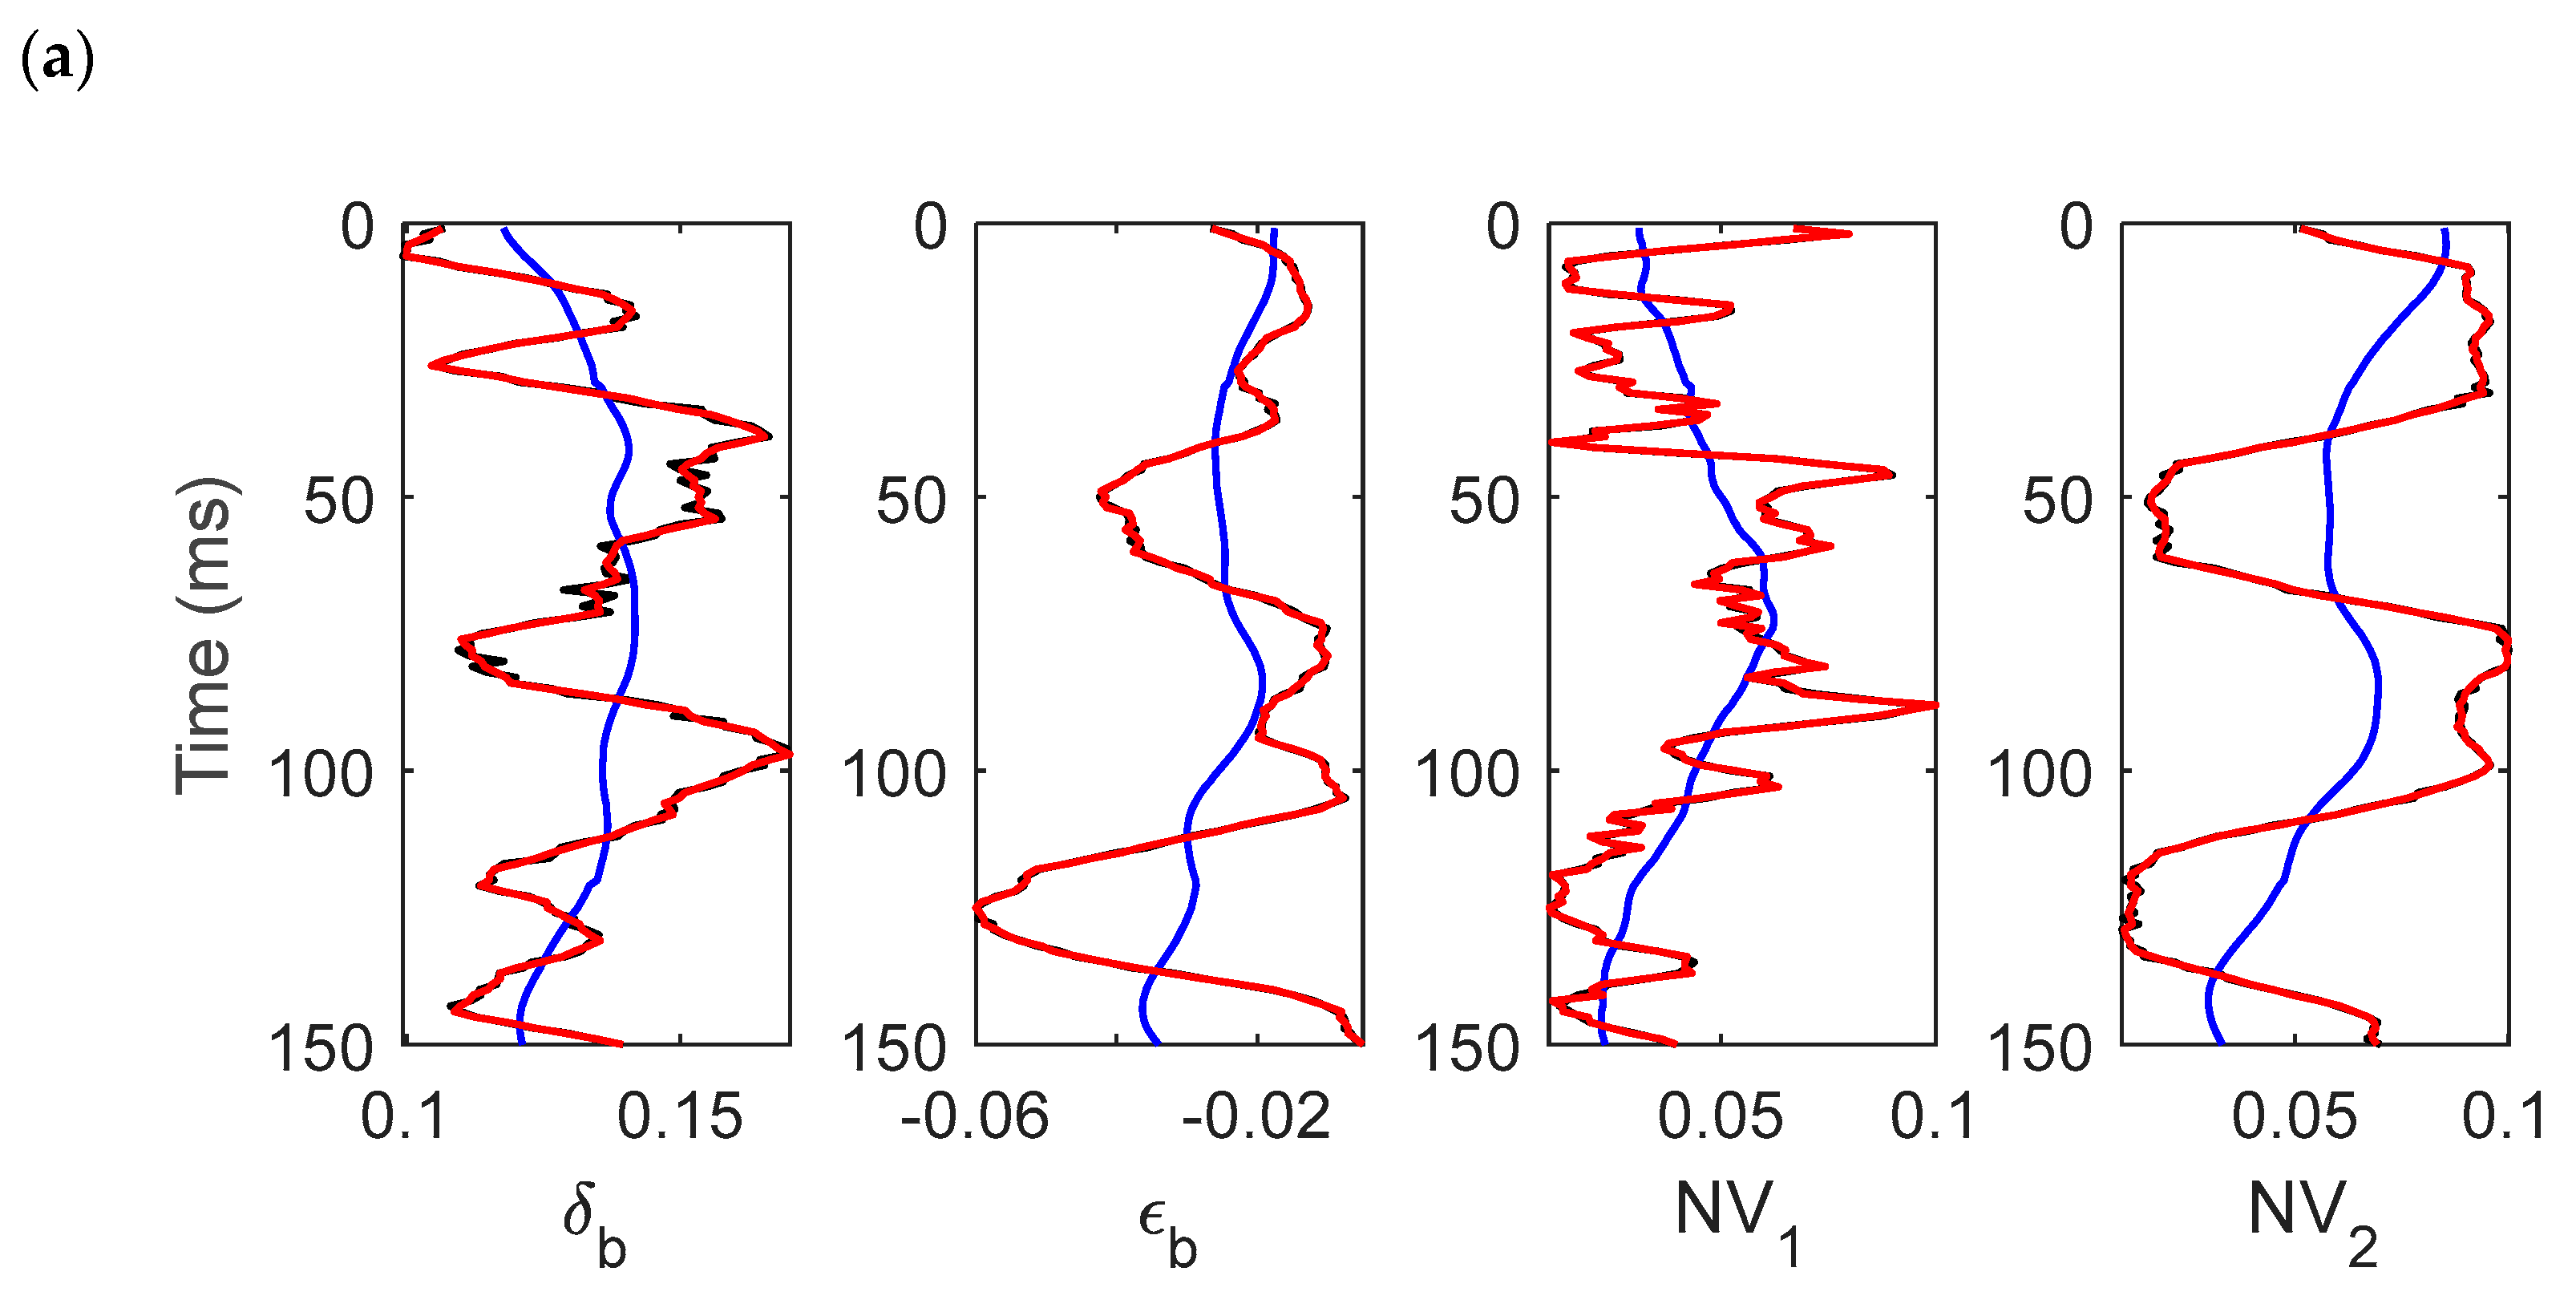
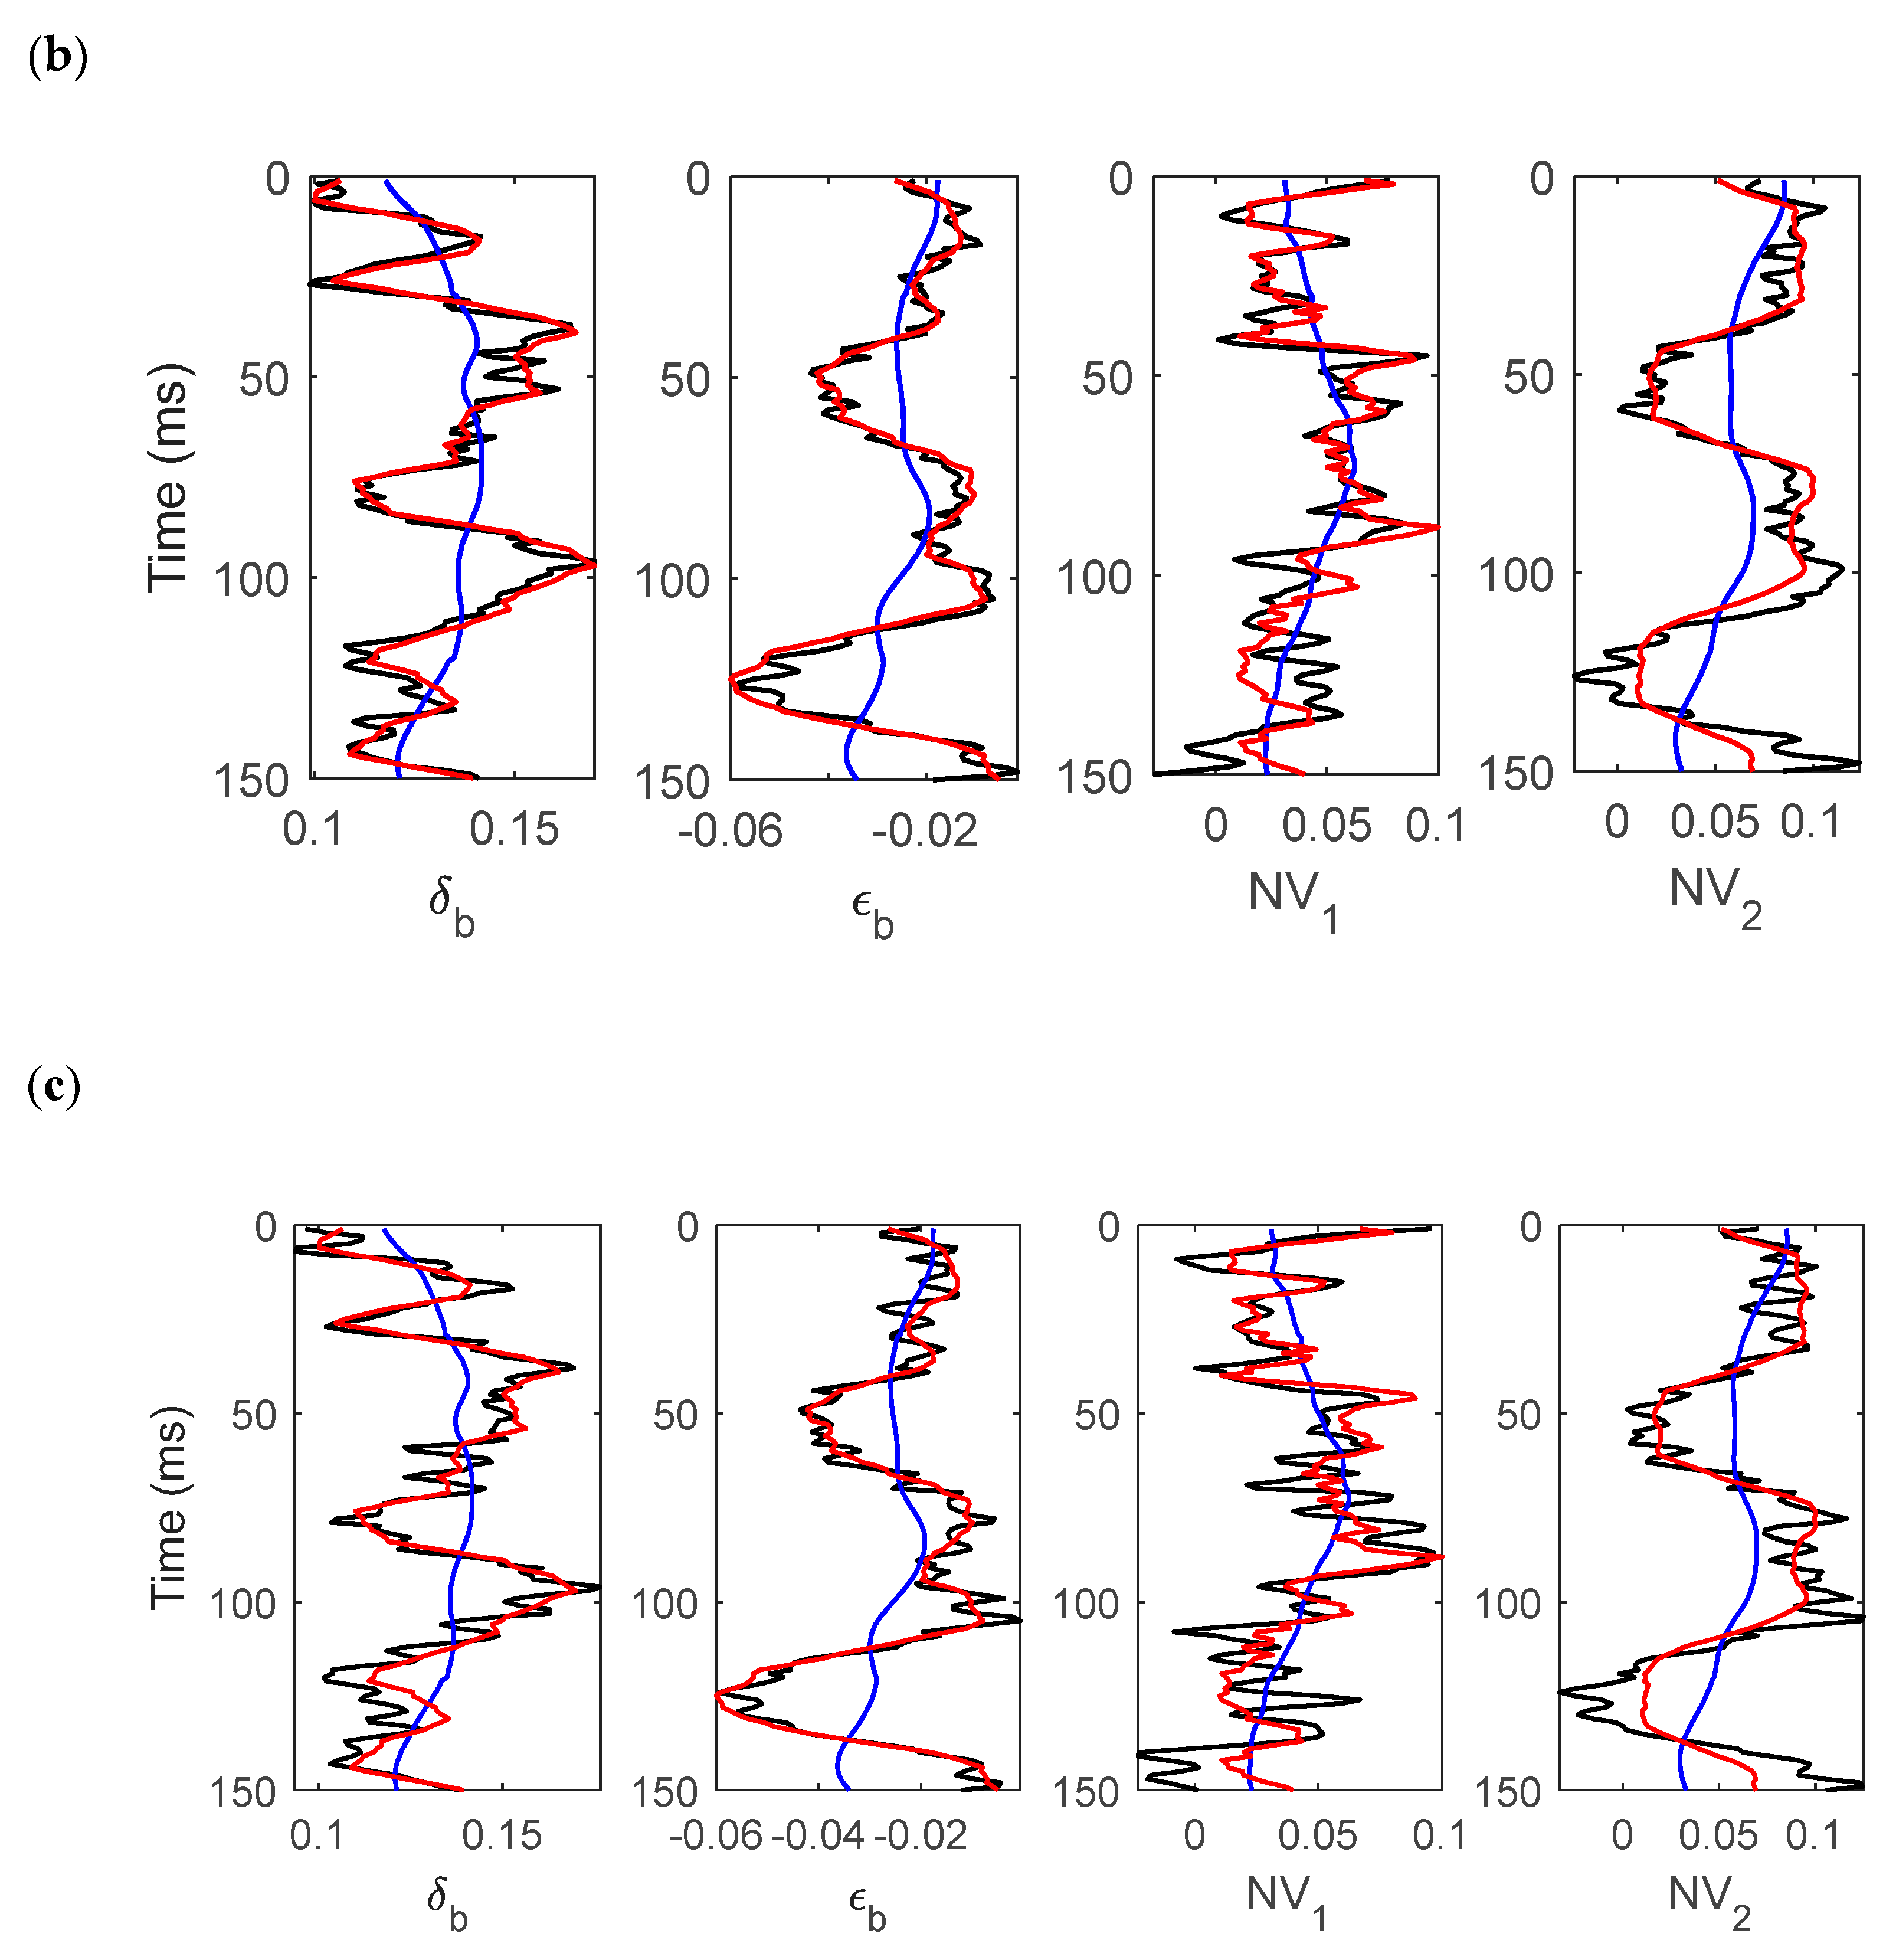
Gaussian random noises (the signal-to-noise ratios (SNRs) were 5 and 2) were added into the synthetic data, as shown in Figure 4b,c. Comparisons between the inversion results (black) of the WA parameters, the fracture density, and the true values (red) are displayed in Figure 5. We can see that, in the case of the SNR being 5, the proposed inversion method could make a stable estimation of WA parameters and fracture density; however, when the SNR was 2, the inversion results of fracture density exhibited more instabilities. Random noise had some influence on the WA parameters and fracture density, but the overall agreement was good. In general, it can be concluded that the proposed inversion method is stable and valid.
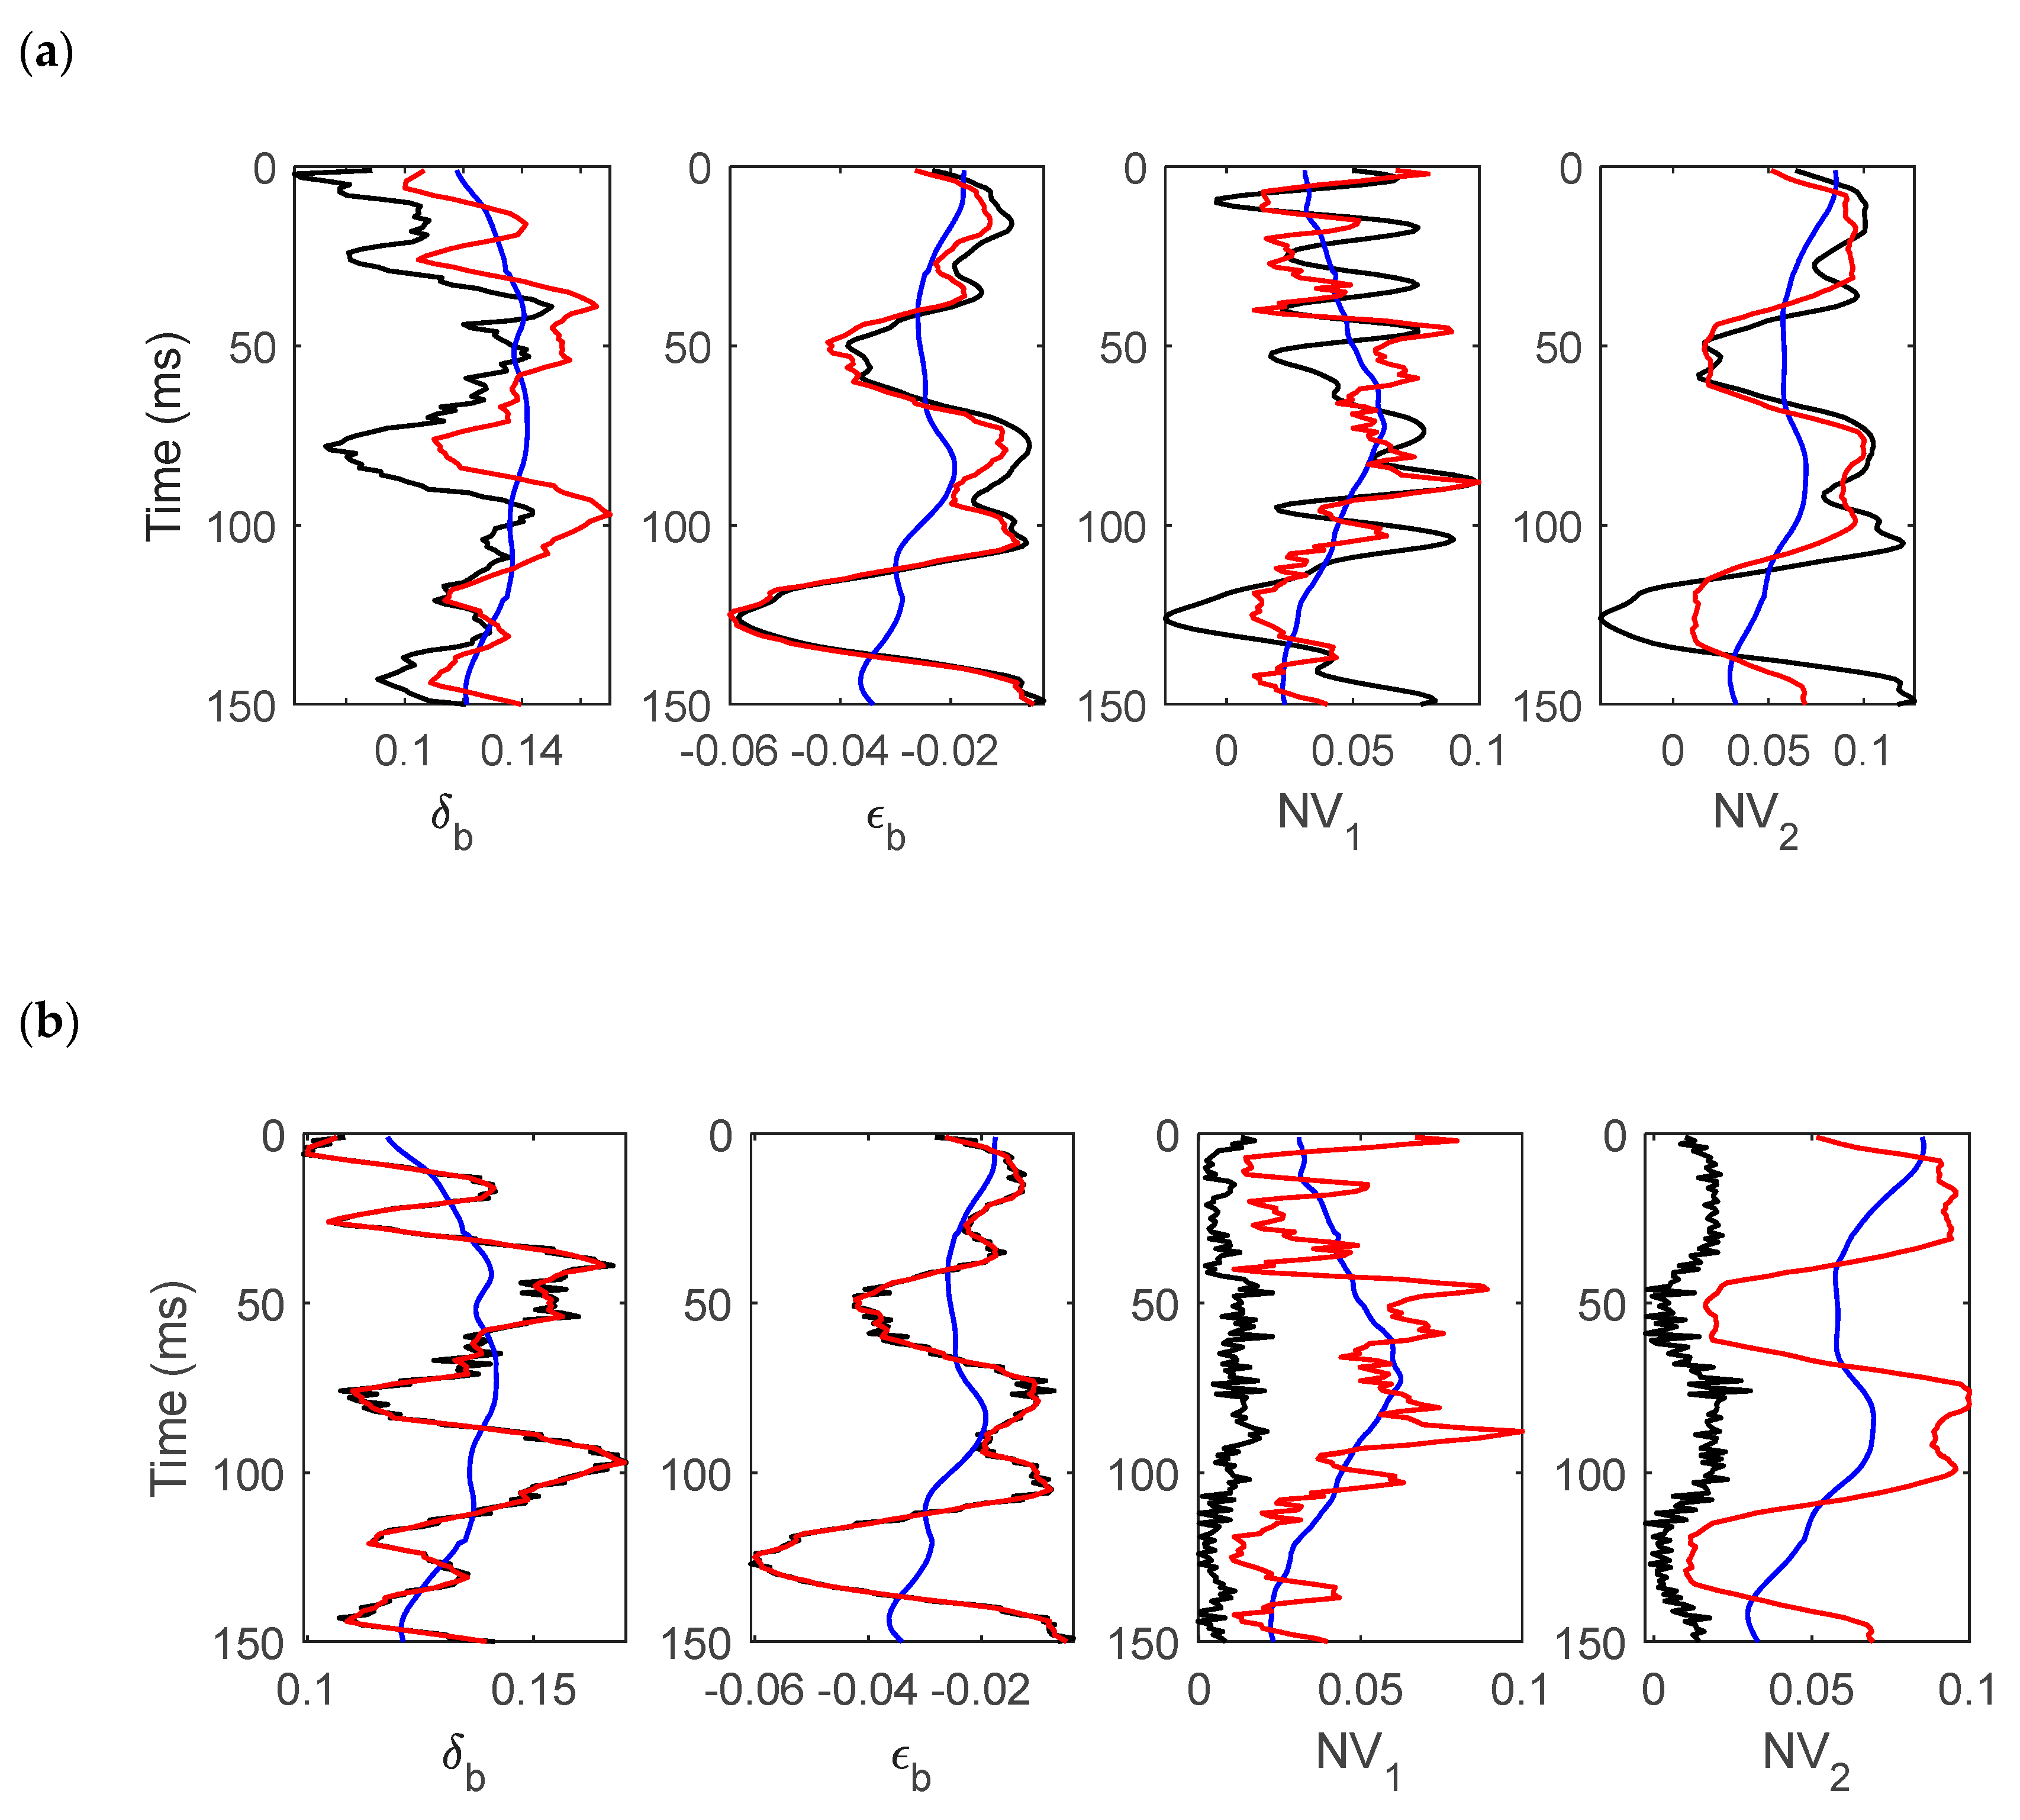
In the approach proposed, the fracture width, radius, and strike are required to be assumed. The dimensions of fractures are a priori functions of many factors in the medium and cannot be readily assumed in practice. In order to test the impact of this assumption (the dimensions assumed for the fractures) on the predicted results, the results of inversion, using the same synthetic data as used in Figure 4a, but with the forward operators, that fracture radius is 0.25 m and fracture width is 5 mm (wrong assumptions), are shown in Figure 6a,b, respectively. Comparing the inversion results with Figure 5a, we observed that, in the case of the fracture radius being 0.25 m, the incorrect assumption of fracture radius introduced larger errors into the prediction of WA parameters and fracture density. In general, the inverted model parameters captured the amplitudes and variability of the true models. When the fracture width was 5 mm, the incorrect assumption of fracture width almost had no impact on WA parameters; however, the accuracy and stability of the fracture density inversion was seriously influenced. More accurate information on fracture radius and width may help to improve the accuracy of WA parameters and fracture density inversion.
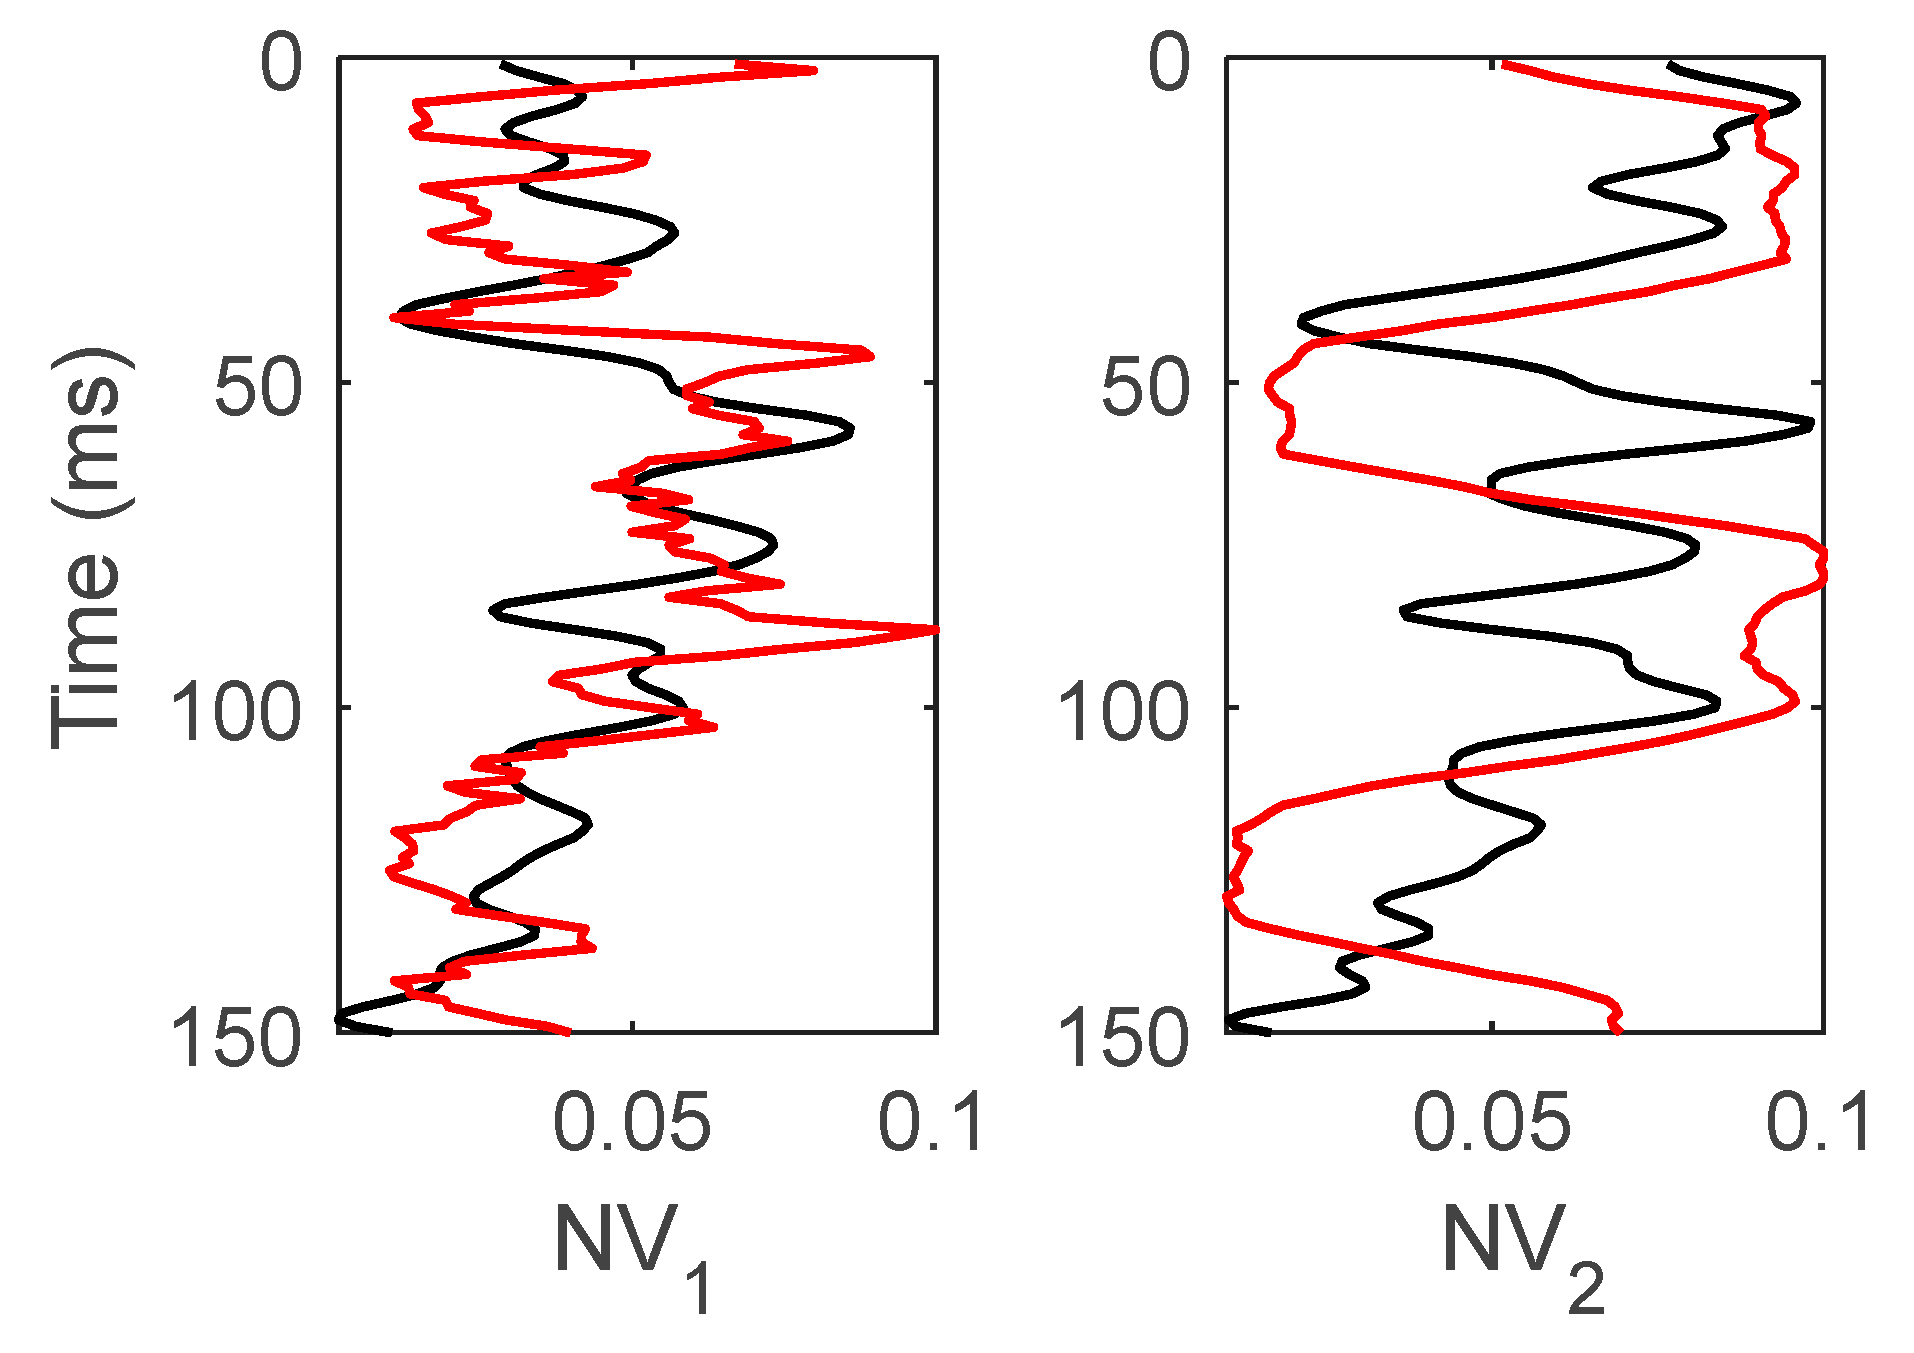
In order to demonstrate the advantage of the proposed algorithm in fracture density estimation, we made use of the same synthetic data as used in the Figure 4a and estimated anisotropy through elliptical inversion of interval velocities. The resulting NMO velocity varied ellipsoidally with the azimuth. The anisotropy intensity was defined by the axial ratio. To compare with the true value of fracture density, the anisotropy intensity, multiplied by a factor, is shown in Figure 7. We can see that the accuracy of the proposed inversion, in relative terms, is greater than that of elliptical inversion.

4. Conclusions

Assuming that the fractured reservoir has a monoclinic symmetry of VTI background, a new form of P-wave reflection coefficient, in terms of WA parameters and fracture density, was obtained by substituting the stiffness matrix coefficient of the VTI background, and normal and tangential fracture compliances. The new expression of the reflection coefficient for a monoclinic medium can avoid calculation errors due to the assumption of a simple model (such as an HTI medium). Additionally, the inversion parameters contain WA parameters, which avoid the assumption that the parameters of the VTI background are known in the traditional form of a P-wave reflection coefficient. Finally, we achieved the direct inversion of WA parameters and fracture density, and avoided the intrinsic errors introduced by indirect substitution. The synthetic test demonstrated that this method can be used to accurately estimate WA parameters and fracture density, which significantly benefits further calculation of reservoir porosity or permeability, the prediction of the “sweet spot”, and the evaluation of a reservoir’s reconstruction.
In the approach proposed, the fracture width, radius, and strike are required to be assumed. Incorrect assumptions of fracture width and radius will yield erroneous results, for WA parameters and fracture density, in practice. A priori knowledge about fracture width is important in the prediction of fracture density. However, the interpretation of fracture reservoirs shows that the fracture apertures in reservoir depth are about 1 mm, and have little variation.

Author Contributions

Conceptualization, Z.G. and S.P.; methodology, Z.G. and S.P.; software, J.L.; validation, J.L.; formal analysis, S.P.; investigation, Z.G.; resources, S.P.; data curation, Z.G.; writing—original draft preparation, Z.G.; writing—review and editing, S.P. and J.L.; visualization, S.P.; supervision, J.L.; project administration, S.P.; funding acquisition, S.P. All authors have read and agreed to the published version of the manuscript.

Funding

This research received no external funding.

Acknowledgments

We appreciate the helpful comments and suggestions from editors and two anonymous reviewers that led to the substantial improvement of this article. We are grateful for the financial support of the following institutions: the Science and Technology Cooperation Project of the CNPC-SWPU Innovation Alliance and Open Projects Fund of the State Key Laboratory of Oil and Gas Reservoir Geology and Exploitation (PLN201733), and the National Natural Science Foundation of China (NSFC 41204101).

Conflicts of Interest

The authors declare no conflicts of interest.

Appendix A

In terms of the specific compliance matrices, generalized anisotropy parameters are defined as below:
δ x = M λ ( α 11 + β 1111 ) λ 2 β 1122 λ 2 ( α 22 + β 2222 ) M λ β 1122 + 2 ( μ μ 2 α 11 ) M + 2 M ( M μ ) δ + ( M μ ) 2 μ M M δ y = λ 2 ( α 11 + β 1111 ) M λ β 1122 M λ ( α 22 + β 2222 ) λ 2 β 1122 + 2 ( μ μ 2 α 22 ) M + 2 M ( M μ ) δ + ( M μ ) 2 μ M M δ z = M λ ( α 11 + β 1111 ) λ 2 β 1122 + 2 ( μ μ 2 ( α 11 + α 22 + 4 β 1122 ) ) M λ ( α 22 + β 2222 ) M M β 1122 M + 2 M ε + λ M M X z = μ λ ( α 12 + 2 β 1112 ) μ λ ( α 12 + 2 β 1222 ) μ 2 α 12 M ε 16 = μ M ( α 12 + 2 β 1112 ) μ λ ( α 12 + 2 β 1222 ) M ε 26 = μ λ ( α 12 + 2 β 1112 ) μ M ( α 12 + 2 β 1222 ) M ε 45 = μ α 12 ε x = M 2 ( α 11 + β 1111 ) λ 2 ( α 22 + β 2222 ) 2 M λ β 1122 + 2 M ε 2 M ε y = λ 2 ( α 11 + β 1111 ) λ λ β 1122 M 2 ( α 22 + β 2222 ) M λ β 1122 + 2 M ε 2 M ε z = λ 2 ( α 11 + β 1111 + β 1122 ) λ 2 ( α 22 + β 2222 + β 1122 ) 2 M γ x = μ α 11 2 γ y = μ α 22 2
where M = ρ V p 2 , μ = ρ V s 2 , λ = M 2 μ .

Appendix B

Sensitivities in Equation (10) are obtained as:
F 1 ( θ ) = 1 2 M μ 2 M sin 2 θ F 2 ( θ ) = 1 2 sin 2 θ tan 2 θ F 3 ( θ , ϕ ) = 1 2 λ 2 2 M + 1 2 [ ( M λ 2 μ 2 M 8 g μ 2 ) cos 2 ϕ + ( λ 2 2 M ) sin 2 ϕ + λ 2 2 M ] sin 2 θ + 1 2 [ M 2 cos 4 ϕ λ 2 2 M sin 4 ϕ + M λ 2 μ 2 M cos 2 ϕ sin 2 ϕ ] sin 2 θ tan 2 θ F 4 ( θ , ϕ ) = 1 2 [ 2 ( 2 μ λ 2 μ 2 M 8 g μ 2 ) cos ϕ sin ϕ ] sin 2 θ + 1 2 [ 2 ( μ ( M + λ ) M ) cos ϕ sin ϕ ] sin 2 θ tan 2 θ F 5 ( θ , ϕ ) = 1 2 λ 2 2 M + 1 2 [ ( λ 2 M ) cos 2 ϕ + ( M λ 2 μ 2 2 M 8 g μ 2 ) sin 2 ϕ + λ 2 2 M ] sin 2 θ + 1 2 [ λ 2 2 M cos 4 ϕ + M 2 sin 4 ϕ + M λ 2 μ 2 M cos 2 ϕ sin 2 ϕ ] sin 2 θ tan 2 θ F 6 ( θ , ϕ ) = 1 2 λ 2 2 M + 1 2 [ λ cos 2 ϕ λ 2 M sin 2 ϕ + λ 2 M ] sin 2 θ + 1 2 [ M 2 cos 4 ϕ λ 2 2 M sin 4 ϕ λ cos 2 ϕ sin 2 ϕ ] sin 2 θ tan 2 θ F 7 ( θ , ϕ ) = 1 2 [ 2 ( 2 μ λ M ) cos ϕ sin ϕ ] sin 2 θ + 1 2 [ 2 ( 2 μ cos 2 ϕ 2 μ λ M sin 2 ϕ ) cos ϕ sin ϕ ] sin 2 θ tan 2 θ F 8 ( θ , ϕ ) = 1 2 λ 2 M + 1 2 [ M λ λ 2 M + λ 2 M ] sin 2 θ + 1 2 [ λ cos 4 ϕ + λ 2 λ M 2 M sin 4 ϕ + λ 2 8 μ 2 M M M cos 2 ϕ sin 2 ϕ ] sin 2 θ tan 2 θ F 9 ( θ , ϕ ) = 1 2 [ 2 ( 2 μ λ M ) cos ϕ sin ϕ ] sin 2 θ + 1 2 [ 2 ( 2 μ λ M cos 2 ϕ 2 μ sin 2 ϕ ) cos ϕ sin ϕ ] sin 2 θ tan 2 θ F 10 ( θ , ϕ ) = 1 2 λ 2 2 M + 1 2 [ ( λ 2 M ) cos 2 ϕ λ sin 2 ϕ + λ 2 2 M ] sin 2 θ + 1 2 [ λ 2 2 M cos 4 ϕ + M 2 sin 4 ϕ λ cos 2 ϕ sin 2 ϕ ] sin 2 θ tan 2 θ
where g = V S 2 V p 2 It should be noted that sensitivity F is only related to the elastic properties of the isotropic background.

Appendix C

Sensitivities a ( θ , ϕ ) and b ( θ , ϕ ) for fracture density in Equation (11) are obtained as:
a ( θ , ϕ ) = A ¯ 1 B ¯ T 1 [ F 3 ( θ , ϕ ) sin 2 φ 1 + F 4 ( θ , ϕ ) sin φ 1 cos φ 1 + F 5 ( θ , ϕ ) cos 2 φ 1 ] + A ¯ 1 ( B ¯ N 1 B ¯ T 1 ) [ F 6 ( θ , ϕ ) sin 4 φ 1 + F 7 ( θ , ϕ ) 2 sin 3 φ 1 cos φ 1 + F 8 ( θ , ϕ ) sin 2 φ 1 cos 2 φ 1 + F 9 ( θ , ϕ ) 2 sin φ 1 cos 3 φ 1 + F 10 ( θ , ϕ ) cos 4 φ 1 ] b ( θ , ϕ ) = A ¯ 2 B ¯ T 2 [ F 3 ( θ , ϕ ) sin 2 φ 2 + F 4 ( θ , ϕ ) sin φ 2 cos φ 2 + F 5 ( θ , ϕ ) cos 2 φ 2 ] + A ¯ 2 ( B ¯ N 2 B ¯ T 2 ) [ F 6 ( θ , ϕ ) sin 4 φ 2 + F 7 ( θ , ϕ ) 2 sin 3 φ 2 cos φ 2 + F 8 ( θ , ϕ ) sin 2 φ 2 cos 2 φ 2 + F 9 ( θ , ϕ ) 2 sin φ 2 cos 3 φ 2 + F 10 ( θ , ϕ ) cos 4 φ 2 ]
For open penny-shaped cracks with radius r in a homogeneous background medium with Poisson’s ratio σ and Young’s modulus E:
B N = 16 ( 1 σ 2 ) r 3 π E B T = 32 ( 1 σ 2 ) r 3 π E ( 2 σ )
In an isotropic medium, the relationships among P-wave moduli M, S-wave moduli μ, Poisson’s ratio, and Young’s modulus are shown below [36]
M = μ 4 μ E 3 μ E M = μ 2 2 σ 1 2 σ
The normal and tangential compliances can be obtained by combining Equations (A4) and (A5).

References

  1. Nelson, R.A. Geologic Analysis of Naturally Fractured Reservoirs; Gulf Publishing Company: Houston, TX, USA, 1985. [Google Scholar]
  2. Sayers, C.M. Seismic characterization of reservoirs containing multiple fracture sets. Geophys. Prospect. 2009, 57, 187–192. [Google Scholar] [CrossRef]
  3. Dvorkin, J.; Mavko, G.; Nur, A. Squirt flow in fully saturated rocks. Geophysics 1995, 60, 97–107. [Google Scholar] [CrossRef]
  4. Rubino, J.; Holliger, K. Research note: Seismic attenuation due to wave-induced fluid flow at microscopic and mesoscopic scales. Geophys. Prospect. 2013, 61, 882–889. [Google Scholar] [CrossRef]
  5. Chen, H.; Innanen, K.A.; Chen, T. Estimating P-and S-wave inverse quality factors from observed seismic data using an attenuative elastic impedance. Geophysics 2018, 83, R173–R187. [Google Scholar] [CrossRef]
  6. Far, M.E.; Sayers, C.M.; Thomsen, L.; Han, D.; Castagna, J.P. Seismic characterization of naturally fractured reservoirs using amplitude versus offset and azimuth analysis. Geophys. Prospect. 2013, 61, 427–447. [Google Scholar] [CrossRef]
  7. Wright, J. The effects of transverse isotropy on reflection amplitude versus offset. Geophysics 1987, 52, 564–567. [Google Scholar] [CrossRef]
  8. Banik, N.C. An effective anisotropy parameter in transversely isotropic media. Geophysics 1987, 52, 1654–1664. [Google Scholar] [CrossRef]
  9. Kim, K.Y.; Wrolstad, K.H.; Aminzadeh, F. Effects of transverse isotropy on P-wave AVO for gas sands. Geophysics 1993, 58, 883–888. [Google Scholar] [CrossRef]
  10. Rahimian, M.; Eskandari-Ghadi, M.; Pak, R.Y.; Khojasteh, A. Elastodynamic Potential Method for Transversely Isotropic Solid. J. Eng. Mech. 2007, 133, 1134–1145. [Google Scholar] [CrossRef]
  11. Shahbodagh, B.; Ashari, M.; Khalili, N. A hybrid element method for dynamics of piles and pile groups in transversely isotropic media. Comput. Geotech. 2017, 85, 249–261. [Google Scholar] [CrossRef]
  12. Moghaddasi, H.; Shahbodagh, B.; Khalili, N. Lateral Vibration of Piles and Pile Groups in Nonhomogeneous Transversely Isotropic Media. Int. J. Geomech. 2020, 20, 04020124. [Google Scholar] [CrossRef]
  13. Rüger, A. P-wave reflection coefficients for transversely isotropic media with vertical and horizontal axis of symmetry. Geophysics 1997, 62, 713–722. [Google Scholar] [CrossRef] [Green Version]
  14. Sayers, C.M.; Rickett, J.E. Azimuthal variation in AVO response for fractured gas sands. Geophys. Prospect. 1997, 45, 165–182. [Google Scholar] [CrossRef]
  15. Bakulin, A.V.; Grechka, V.; Tsvankin, I. Estimation of fracture parameters from reflection seismic data. Part III: Fractured models with monoclinic symmetry. Geophysics 2000, 65, 1818–1830. [Google Scholar] [CrossRef]
  16. Sayers, C.M.; Dean, S. Azimuth-dependent AVO in reservoirs containing non-orthogonal fracture sets. Geophys. Prospect. 2001, 49, 100–106. [Google Scholar] [CrossRef]
  17. Far, M.E. Seismic Characterization of Naturally Fractured Reservoirs. Ph.D. Dissertation, University of Houston, Houston, TX, USA, 2011. [Google Scholar]
  18. Sil, S.; Davidson, M.; Zhou, C.; Olson, R.; Swan, H.; Howell, J.; Chiu, S.; Willis, M. Effect of near-surface anisotropy on a deep anisotropic target layer. In Proceedings of the 81st Annual International Meeting, SEG, Expanded Abstracts, San Antonio, TX, USA, 18–23 September 2011; pp. 305–309. [Google Scholar]
  19. Far, M.E.; Hardage, B.; Wagner, D. Fracture parameter inversion for Marcellus Shale. Geophysics 2014, 79, C55–C63. [Google Scholar] [CrossRef]
  20. Chen, H.; Yin, X.; Qu, S.; Zhang, G. AVAZ inversion for fracture weakness parameters based on the rock physics model. J. Geophys. Eng. 2014, 11, 65–70. [Google Scholar] [CrossRef]
  21. Chen, H.; Pan, X.; Ji, Y.; Zhang, G. Bayesian Markov Chain Monte Carlo inversion for weak anisotropy parameters and fracture weaknesses using azimuthal elastic impedance. Geophys. J. Int. 2017, 210, 801–818. [Google Scholar] [CrossRef]
  22. Chaveste, A.; Hall, M.; Verm, R.; Gaiser, J.E. Estimation of fracture density and orientation through azimuthal processing and interpretation of seismic data. In Proceedings of the Canadian Unconventional Resources Conference, Calgary, AB, Canada, 15–17 November 2011. [Google Scholar]
  23. Cortes-Gómez, D.-M.; Agudelo-Zambrano, W.-M.; Montes-Vides, L.-A. Estimation of density and fracture orientation in HTI media through azimuthal analysis of P-waves. CT F-Cienc. Tecnol. y Futuro 2013, 5, 5–18. [Google Scholar] [CrossRef] [Green Version]
  24. Shahraini, A.; Jakobsen, M.; Ali, A. Non linear Bayesian inversion of seismic AVAZ and production data with respect to the fracture aperture and density. In Proceedings of the 11th International Congress of the Brazilian Geophysical Society & EXPOGEF, Salvador, Bahia, Brazil, 24–28 August 2009. [Google Scholar]
  25. Mahmoudian, F.; Margrave, G.F.; Wong, J.; Henley, D.C. Fracture orientation and intensity from AVAz inversion. A physical modeling study. In Proceedings of the 83rd Annual International Meeting, SEG, Expanded Abstracts, Houston, TX, USA, 22–27 September 2013. [Google Scholar]
  26. Shulin, P.; Ke, Y.; Hai-Qiang, L.; José, B.; Ziyu, Q. Adaptive step-size fast iterative shrinkage-thresholding algorithm and sparse-spike deconvolution. Comput. Geosci. 2020, 134, 104343. [Google Scholar]
  27. Shulin, P.; Ke, Y.; Hai-Qiang, L.; Ziyu, Q. A Bregman adaptive sparse-spike deconvolution method in the frequency domain. Appl. Geophys. 2019, 16, 463–472. [Google Scholar]
  28. Shulin, P.; Ke, Y.; Hai-Qiang, L.; José, B.; Ziyu, Q. A Sparse Spike Deconvolution Algorithm Based on a Recurrent Neural Network and the Iterative Shrinkage-Thresholding Algorithm. Energies 2020, 13, 3074. [Google Scholar]
  29. Hill, R. Elastic properties of reinforced solids: Some theoretical principles. J. Mech. Phys. Solids 1963, 11, 357–372. [Google Scholar] [CrossRef]
  30. Sayers, C.M.; Kachanov, M. Microcrack-induced elastic wave anisotropy of brittle rocks. J. Geophys. Res. 1995, 100, 4149–4156. [Google Scholar] [CrossRef]
  31. Thomsen, L. Weak elastic anisotropy. Geophysics 1986, 51, 1954–1966. [Google Scholar] [CrossRef]
  32. Pšencík, I.; Martins, J.L. Properties of weak contrast PP reflection/transmission coefficients for weakly anisotropic elastic media. Studia Geophys. Geod. 2001, 45, 176–199. [Google Scholar] [CrossRef]
  33. Worthington, M.H. Interpreting seismic anisotropy in fractured reservoirs. First Break 2008, 26, 57–63. [Google Scholar] [CrossRef]
  34. Backus, G.E. Long-wave elastic anisotropy produced by horizontal layering. J. Geophys. Res. 1962, 67, 4427–4440. [Google Scholar] [CrossRef] [Green Version]
  35. Buland, A.; Omre, H. Bayesian linearized AVO inversion. Geophysics 2003, 68, 185–198. [Google Scholar] [CrossRef] [Green Version]
  36. Birch, F. The velocity of compressional waves in rocks to 10 kilobars. J. Geophys. Res. 1961, 66, 2199–2224. [Google Scholar] [CrossRef]
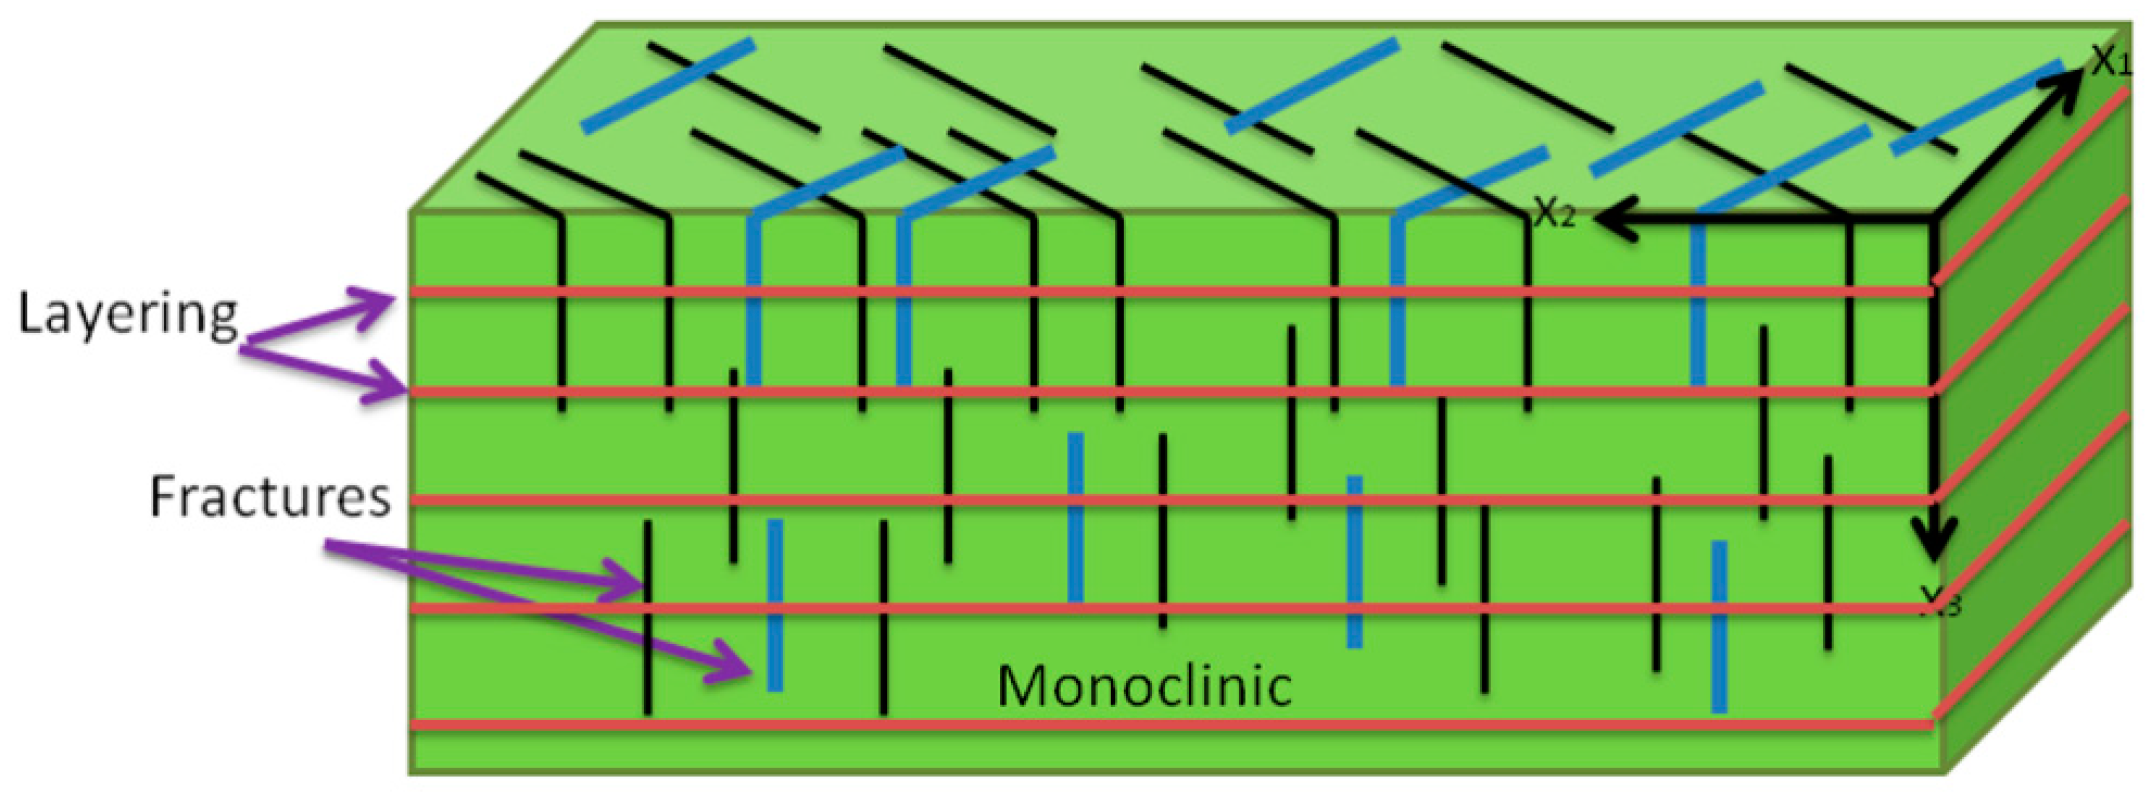
Figure 1. Two non-orthogonal vertical fracture sets with a vertical transverse isotropic (VTI) background.
Applsci 10 05136 g001
Figure 2. Interpretation results of well log data (fracture density).
Applsci 10 05136 g002
Figure 3. Interpretation results of well log and vertical seismic profiling (VSP) data (P- and S-wave velocity, density, and WA parameters).
Applsci 10 05136 g003
Figure 4. Synthetic seismic profiles. (a) noise-free, (b) S/N of 5, (c) S/N of 2.
Applsci 10 05136 g004aApplsci 10 05136 g004b
Figure 5. Comparisons between the estimated results (black curves) and the true values (red curves). The blue curves represent initial models that were constructed by smoothing the true values. (a) noise-free, (b) S/N of 5, (c) S/N of 2.
Applsci 10 05136 g005aApplsci 10 05136 g005b
Figure 6. Inversion results using synthetic data (Figure 4a), computed with the fracture radius at 10 m and fracture width at 1 mm. (a) Inversion results with the forward operator that the fracture radius was 0.25 m, (b) Inversion results with the forward operator that the fracture width was 5 mm.
Applsci 10 05136 g006
Figure 7. Fracture density (anisotropy intensity multiplied by a factor) obtained through elliptical inversion using synthetic data (Figure 4a).
Applsci 10 05136 g007