1. Introduction
The geothermal flow of the Earth’s interior is generated mainly by conduction and convection. Based on conduction and convection, the geothermal temperature increases steadily with depth. The equilibrium temperature of groundwater in a borehole with an overall linear or nonlinear thermal gradient represents the Earth’s temperature at that depth. Heat transfer inside the Earth occurs predominantly through conduction. The temperature distribution in the continental crust and lithosphere is governed largely by heat generated from the radioactive decay of rocks and by heat conduction from mantle to the surface through heat-transfer media and pathways [
1]. Thermal gradients have been estimated by using constant temperature gradients in states unaffected by fluid flows or based on the average slope of an entire section of boreholes from the surface and bottom temperatures (using temperature-log data) [
2,
3].
In South Korea, due to the lack of thermal energy generated from young volcanic activity [
4], research on deep geothermal energy began only in the 2000s. The Pohang area in South Korea has the largest geothermal energy potential, with heat flows greater than 80 mWm
−2 [
4,
5]. Moreover, the Pohang area, with the youngest tectonic movements in the Korean peninsula, has possible deep-stressed fracture zones [
6,
7,
8]. To evaluate the geothermal energy potential, the Korea Institute of Geoscience and Mineral Resources drilled four deep boreholes (BH-1 to BH-4) from January 2003 to November 2006. BH-4 is a pumping borehole for developing deep groundwater; it has the largest diameter (200 mm at the final depth) of the four boreholes, with a depth greater than 2 km [
9]. The distance between BH-1 and BH-2 is 157 m, and the distance between BH-3 and BH-4 is 123 m. As geothermal water in Korea has a higher probability of geothermal flow along secondary pores, such as faults and fractures, than along primary pores, it is important to understand how deep geothermal water is associated with faults and geological structures [
10]. The construction of a geothermal binary power plant using an enhanced geothermal system with a planned generation capacity of 1.5 MW was expected to be completed in the Pohang area by 2017. However, its construction was stopped owing to the Mw 5.4 Pohang earthquake on November 15, 2017, which damaged buildings in Pohang.
Bredehoeft and Papadopulos [
11] derived a simple steady-state solution for estimating vertical water fluxes from deep temperature profiles in homogeneous environments. This approach has been used in several studies, i.e., to calculate water fluxes from the curvatures of temperature profiles recorded in boreholes [
12,
13]. Furthermore, the estimation of the borehole vertical flow is of specific interest, as it can be used to derive large-scale hydraulic connections [
14]. In addition, the temperature profiles display a strong correlation with the vertical borehole velocity profiles [
15].
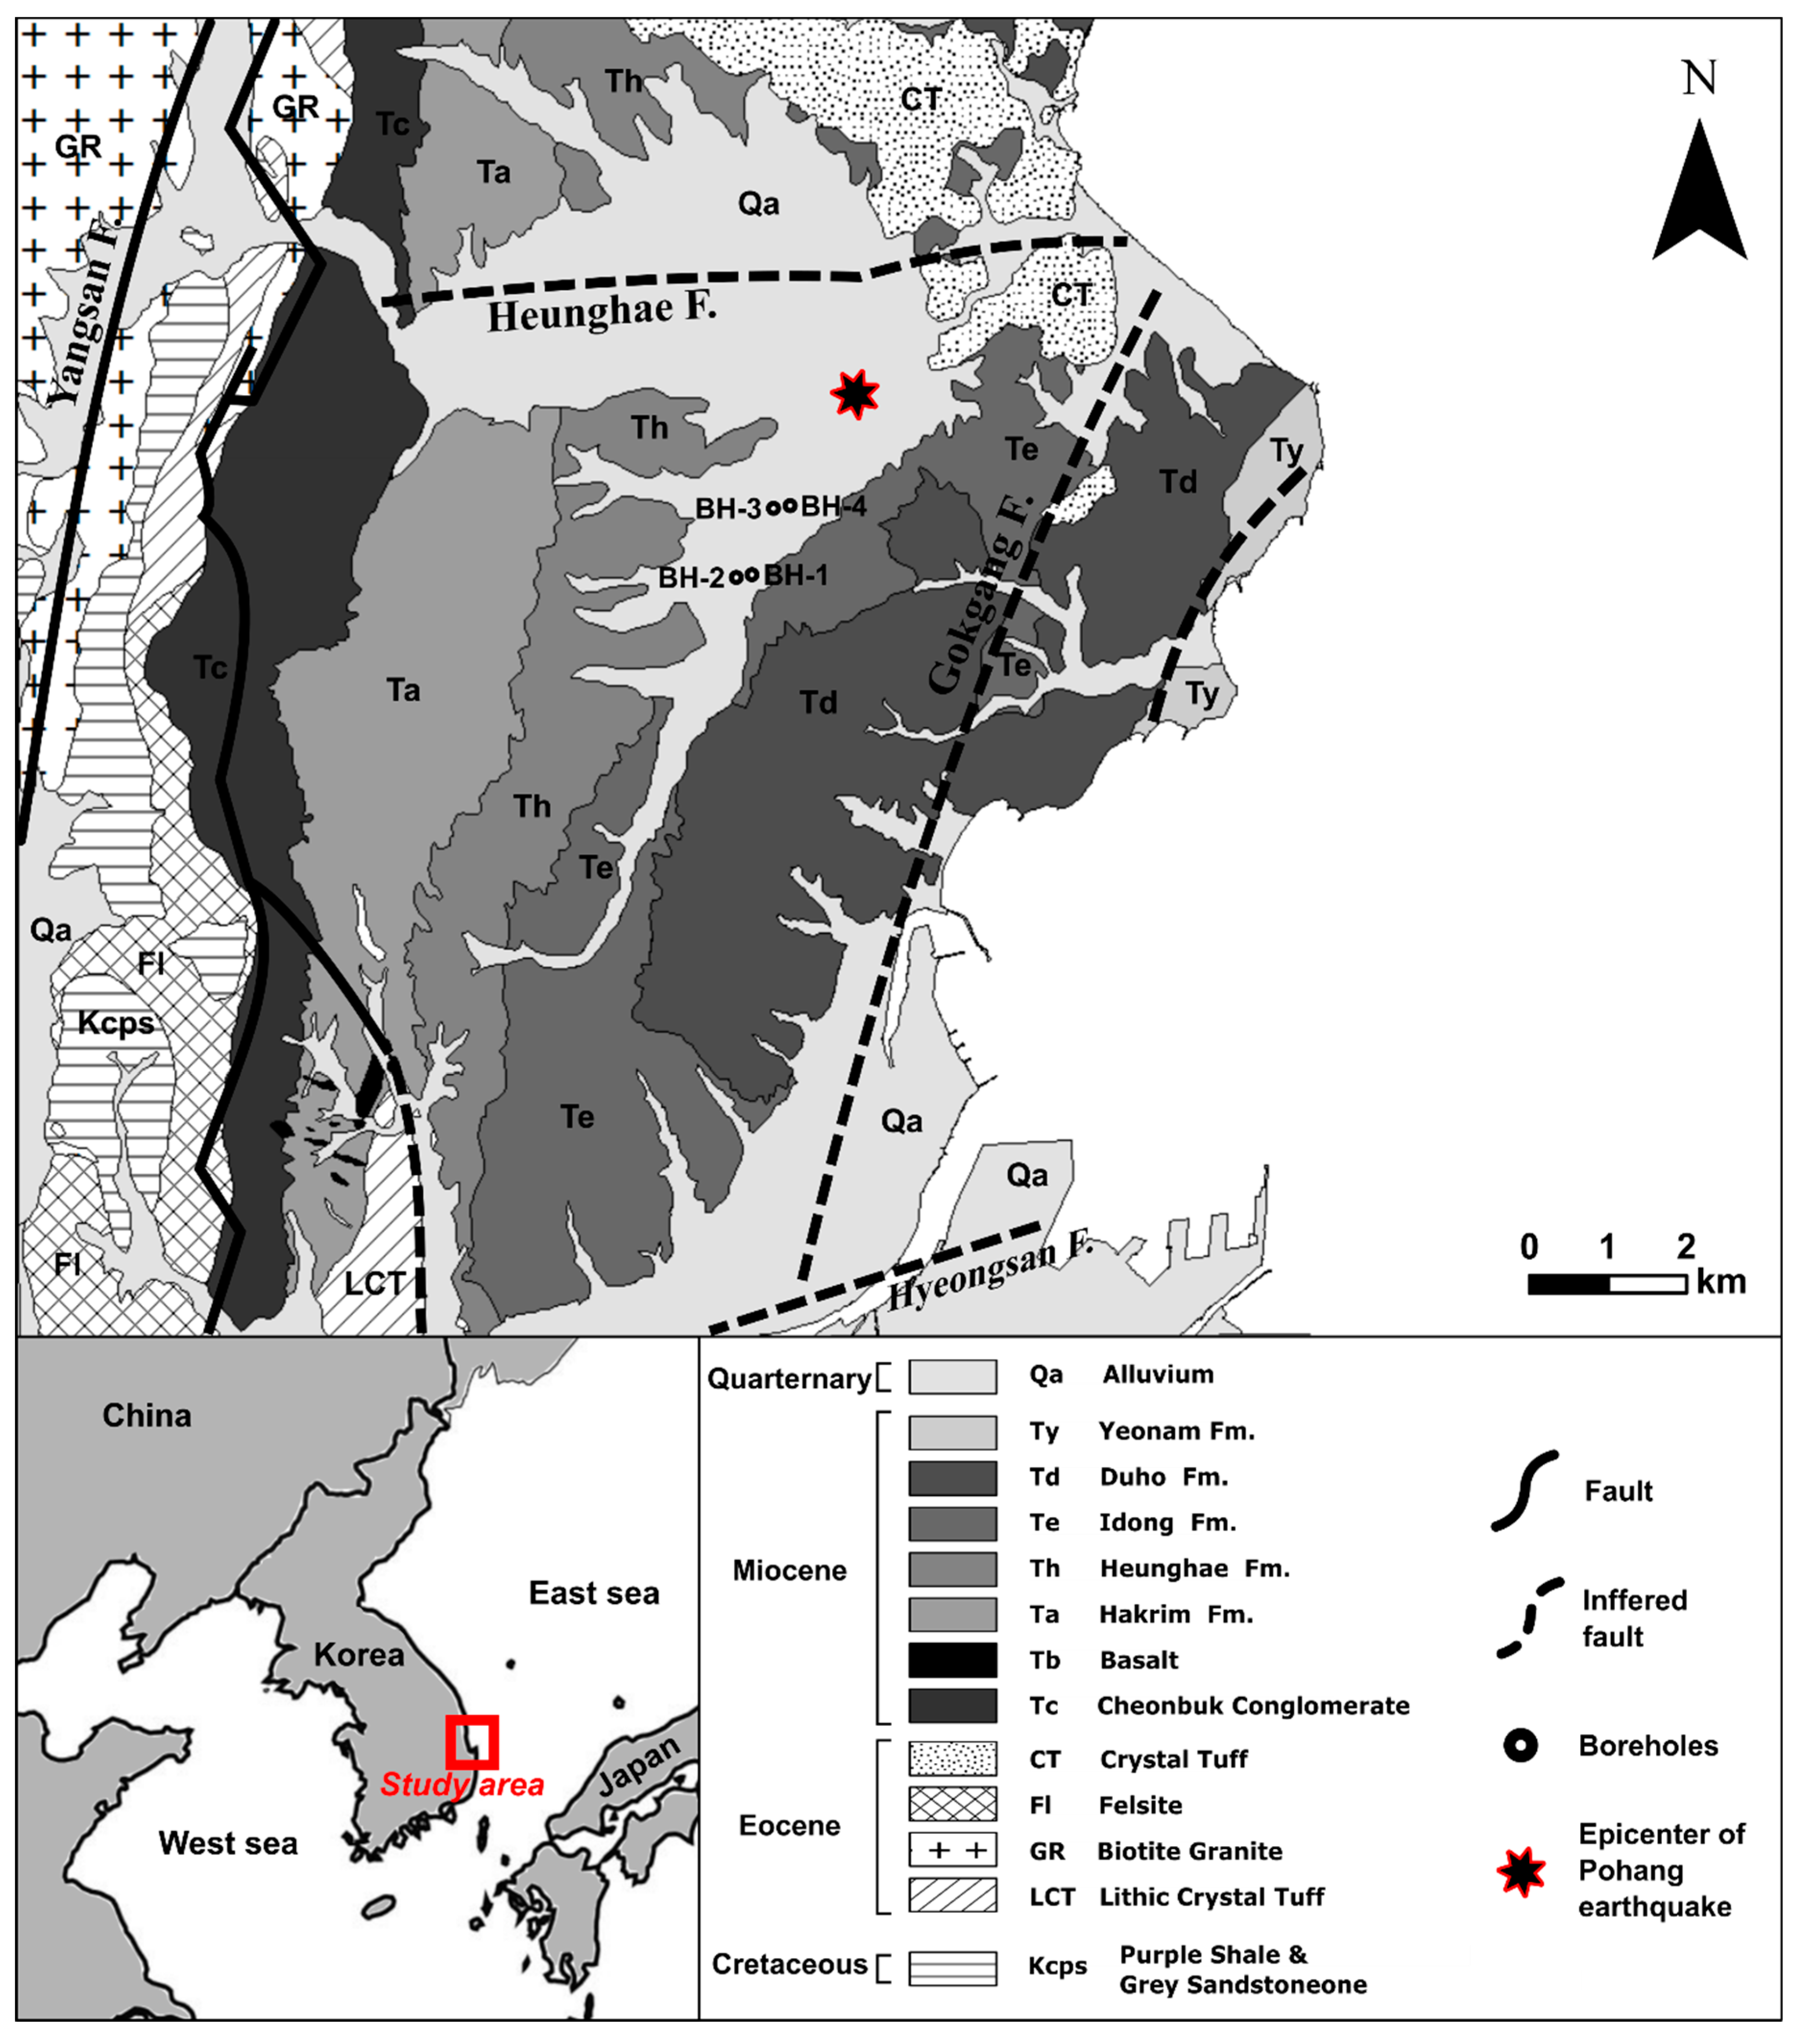
The aim of this study was to characterize deep groundwater flows and temperatures, based on the geophysical logs and lithology profiles of four deep boreholes in Heunghae-eup, Pohang, South Korea (
Figure 1). The lithology profiles and geophysical logs can be used to effectively detect the fractures intersecting a borehole. Additionally, the temperature, caliper, electrical conductivity (EC), and natural gamma ray logging can be implemented for geological and stratigraphic interpretation, thermal gradient measurement, groundwater flow pattern determination, casing installation, and screen section determination [
16,
17].
2. Geological Setting
Pohang belongs to the East Sea alkaline volcanic zone [
18], occupying the central part of the Tertiary Pohang Basin. Granodiorite bedrock was formed as a result of the igneous activity at the end of the Paleozoic Era and is overlain by repeated layers of Cretaceous sandstone/mudstone (
Figure 1 [
19]). Cretaceous lapilli tuff overlies the Cretaceous sedimentary rocks. Layers of Eocene crystal tuff and lithic crystal tuff are present on the Cretaceous rocks. In the middle Eocene, biotite granite intruded on the older rocks. Moreover, Miocene semiconsolidated sedimentary rocks (the Cheonbuk conglomerate, Hakrim Formation, Heunghae Formation, Idong Formation, Duho Formation, and Yeonam Formation) belonging to the Yeonil Group and composed of sandstone, shale, and mudstone were deposited along the east/southeast direction as a result of several marine transgressions and regressions, with a thickness greater than 1000 m [
20,
21,
22,
23].
The four deep boreholes were drilled vertically in the study area, at 1.8–2.8 km from the epicenter of the Mw 5.4 Pohang earthquake in 2017 (
Figure 1). The borehole diameters decrease with depth. BH-1 has a depth of 1100 m, with a diameter of 76.2–101.6 mm; BH-2 has a depth of 1505 m, with a diameter of 88.9–203.2 mm; BH-3 has a depth of 950 m, with a diameter of 254–355.6 mm; and BH-4 has a depth of 2383 m, with a diameter of 203.2–254 mm. From top to bottom, the rock types of BH-1, BH-2, BH-3, and BH-4 consist of semiconsolidated mudstone, crystal tuff, lapilli tuff, sandstone/mudstone, rhyolite, andesitic breccia, dacite, and granodiorite; these were identified using a drilling slurry. The thickness of the rock types is as follows: 200–370 m for the semiconsolidated mudstone, 73–240 m for the crystal and lapilli tuffs, 46–907 m for the mudstone/sandstone, 259–375 m for the rhyolite, and 834 m for the andesitic breccia [
9,
24].
The depth to the water is −60 m at BH-1 (−45 m, mean above sea level (masl)), −120 m at BH-2 (−107 m, masl), −120 m at BH-3 (−109 m, masl), and −110 m at BH-4 (−99 m, masl).
3. Methods
3.1. Theoretical Background of Thermal Heat Transfer
The geothermal flux inside the Earth variably affects the thermal gradient [
25]. The transient heat transfer in homogeneous and isotropic saturated porous media can be expressed as follows [
26]:
where
T denotes the temperature at time
t;
and
denote the specific heat and density of the fluid, respectively;
c,
ρ, and
κ denote the specific heat, density, and thermal conductivity of the rock matrix in fluid-filled rocks, respectively; and
vx,
vy, and
vz denote the fluid velocities in the
x-,
y-, and
z-directions, respectively. In the case of 1D heat conduction in the vertical direction [
11], the assumptions are as follows: the borehole is filled with fluid at a steady state and without the influence of drilling and pumping; thermal conductivity is constant at the object section; fluid flow occurs only in the vertical direction; temperature changes in the borehole occur owing to the vertical flow; and the fluid flow rate of the object section is uniform. From Equation (1), the 1D steady-state heat transfer equation for an inclined fracture zone can be expressed as follows [
11]:
where
v is the fluid velocity vector. Equation (1) can be simplified as Equation (4) based on Ge’s assumptions [
27], as follows:
where
vξ denotes the fluid velocity vector in the fracture direction (the direction of the local coordinate
ξ),
γ denotes the average magnitude of the temperature gradient in the fracture zone, and
denotes the Peclet number, equal to
.
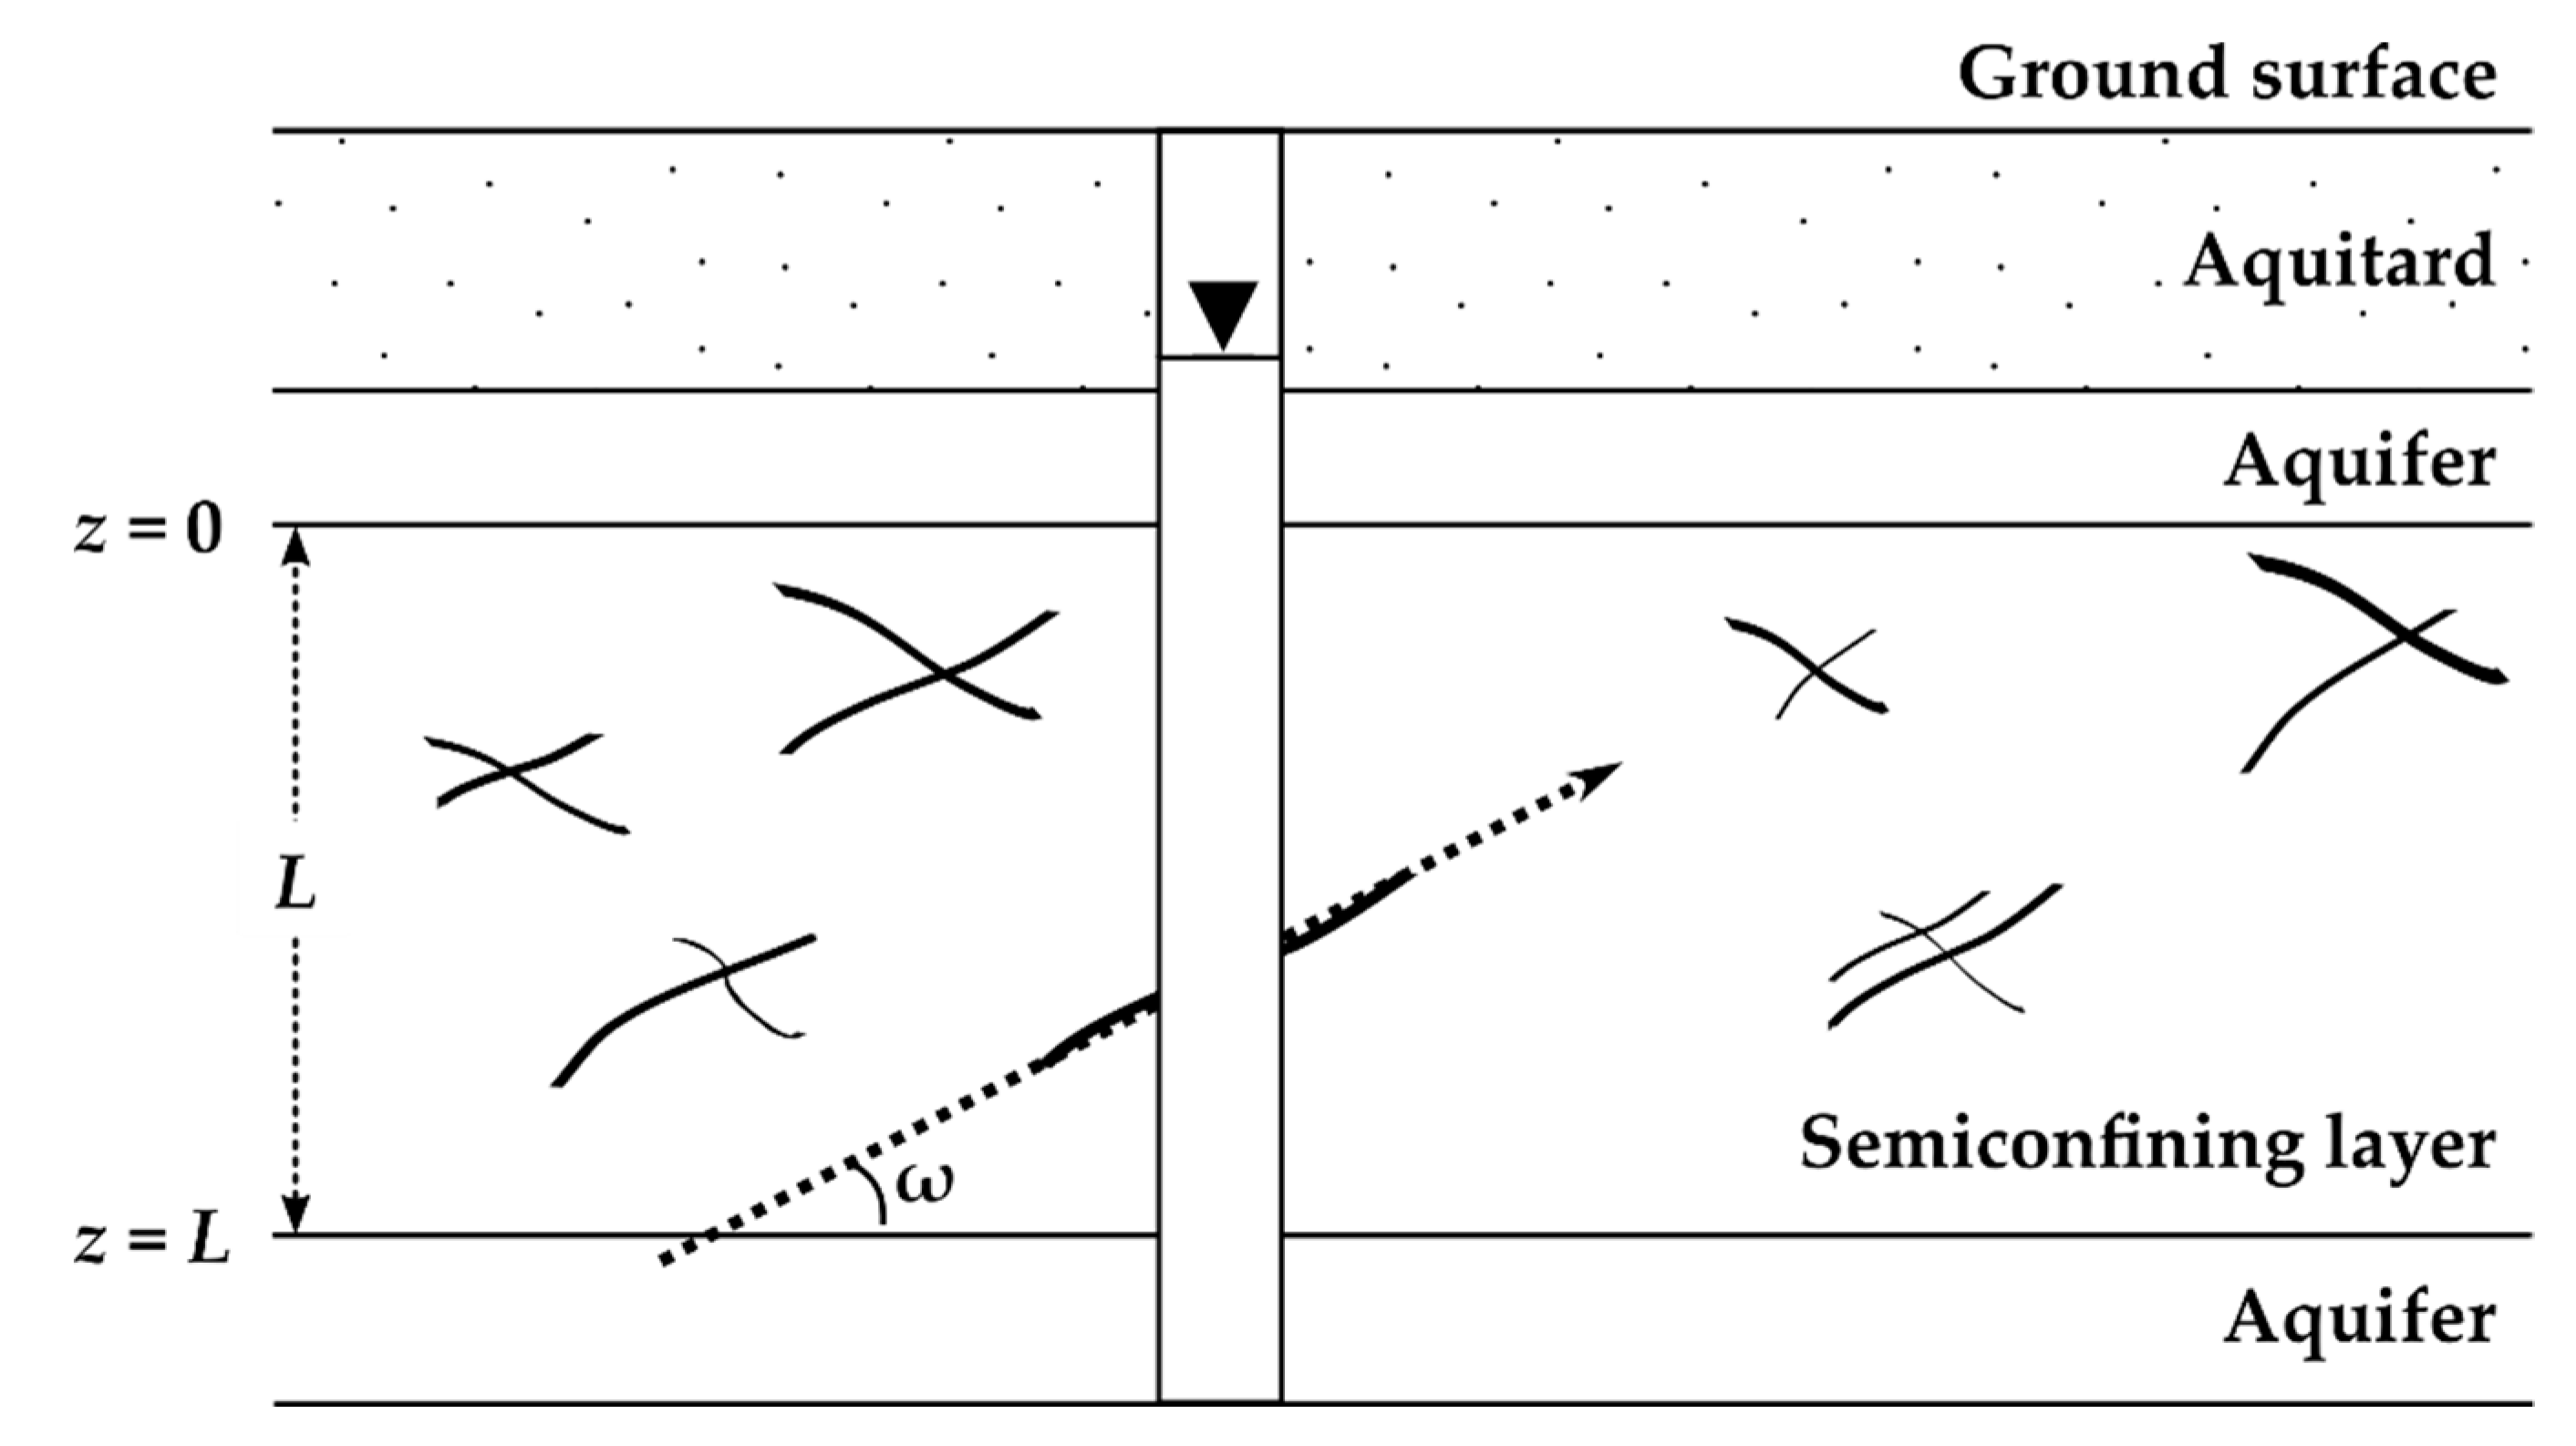
When the upper and lower boundary temperatures of the aquifer or geological formation are
T =
T0 (at
z = 0) and
T =
TL (at
z =
L), respectively (
Figure 2), Equation (4) can be expressed as follows [
27]:
where
L denotes the thickness of the fractured aquifer, i.e., the vertical distance between
z = 0 and
z =
L. The parameter
zD (dimensionless) is equal to
z/
L. The parameter
β (dimensionless) can be expressed as follows:
where
denotes the average angle of the fracture zone from the horizontal plane. The parameter
β has a different sign depending on the direction of the flux: zero in the case of conduction, positive in the case of downward flow, and negative in the case of upward flow.
3.2. Determining Thermal Conductivity, Specific Heat, and Density
Thermal conductivity is a vital factor for determining the temperature inside the Earth [
28,
29]. In this study, a Nanoflash instrument (model LFA-447 of Netzsch Co., Germany) equipped with an infrared thermometer was used to measure the thermal diffusivity, by transferring heat from the bottom side to the top side of the rock sample. The LFA-447 was calibrated with a standard sample (pyroceram 9606) of thermal diffusivity of 1.926 mm
2/s at 25 °C; the measurement error is no greater than ±3% between the measured value and true value.
The thermal conductivity of a dried rock sample can be estimated as follows:
where
ρ denotes the bulk density of the sample,
D denotes the thermal diffusivity, and
cp denotes the specific heat. The dry sample is prepared in a vacuum dryer for 24 h.
The thermal conductivity changes significantly according to the dried/saturated state and porosity of the sample. The weighted geometric mean of the thermal conductivity of a saturated sample can be expressed as follows [
30]:
where
κwater denotes the thermal conductivity of water (0.62 W/mK),
κ denotes the thermal conductivity of the dry sample, and
n denotes the porosity (used to determine the thermal conductivity of the saturated natural rock). The porosity was determined from the volume differences between saturated and dried samples. Yalcin and Dumlu [
31] assumed a constant specific heat of 4.2 kJ/kgK and density of 1000 kg/m
3 for estimating the vertical flow velocity. In contrast, in this study, specific heat and density values were applied for different temperature intervals of the temperature profile in the boreholes, as shown in
Table 1.
3.3. Geophysical Logs
Temperature logging is mainly used to estimate groundwater flows and the locations of aquifers and to identify different thermal gradients [
32,
33,
34]. The thermal gradients can be classified into three categories: linear thermal gradients, wherein the fluid temperature in the borehole is in equilibrium with the underground temperature (
Figure 3a); multiple thermal gradients, wherein the borehole consists of several strata with different thermal conductivities (
Figure 3b); and nonlinear thermal gradients, wherein the fluid flows through fractures (
Figure 3c,d) [
35].
A caliper log uses a mechanical caliper, acoustic caliper, and sonar caliper to continuously measure a borehole diameter. Caliper log anomalies indicate fracture depths, based on the enlargement of the borehole diameter [
36,
37]. Inflows to and outflows from the borehole can be attributed to the bedding planes or fractures identified by the caliper log. The advantages of this approach are clearly demonstrated by the number of possible water-producing zones indicated by the caliper logs. In geothermal drilling activity, a caliper log is mainly used for detecting cavities in a well, measuring the wellbore volume to estimate the required cement volume, determining the placing of casing in a well, inspecting the casing for damage either during or after drilling throughout the lifetime of the well, and calibrating the well depth (as combined with the lithological and natural gamma-ray logs) [
38,
39].
EC logging detects the EC values of water in various aquifers, thereby providing a general indication of water quality and hydraulic information [
40,
41]. A systematic analysis of EC logging data can predict the location of possible hydraulically active zones in a borehole [
42]. In general, the EC depends on the porosity, water temperature, and salinity, as it is controlled by ionic diffusion and dispersion, as well as by the moving water. Under the equilibrium condition, the ionic content at a given depth in a water-filled borehole effectively represents a balance of the various processes at that depth [
43,
44]. A depth with less saline water may represent the mixing point of formation waters, and high-salinity zones can be attributed to inflows of saline water into the borehole [
45].
Natural gamma-ray logging is useful with respect to the stratigraphic identification of basic intrusive rocks, such as rhyolite. In addition, gamma-ray logging is an effective method for identifying felsic rock among the basalt formations in a borehole, using a linear relationship between the silica content in the volcanic rock and the natural gamma-ray intensity. Moreover, a natural gamma-ray log is often used to discriminate between Mesozoic sedimentary rock and Tertiary formations. For example, the presence of sandstone in semiconsolidated mudstone exhibits a lower gamma-ray intensity [
46,
47,
48].
In this study, the geophysical logger of Robertson Geologging (UK) with the console of Micrologger II was used for temperature log with an accuracy ±0.5 °C, EC log with an accuracy ±2.5% at 500 μ S/cm, and caliper log with an accuracy ±6 mm.
4. Results
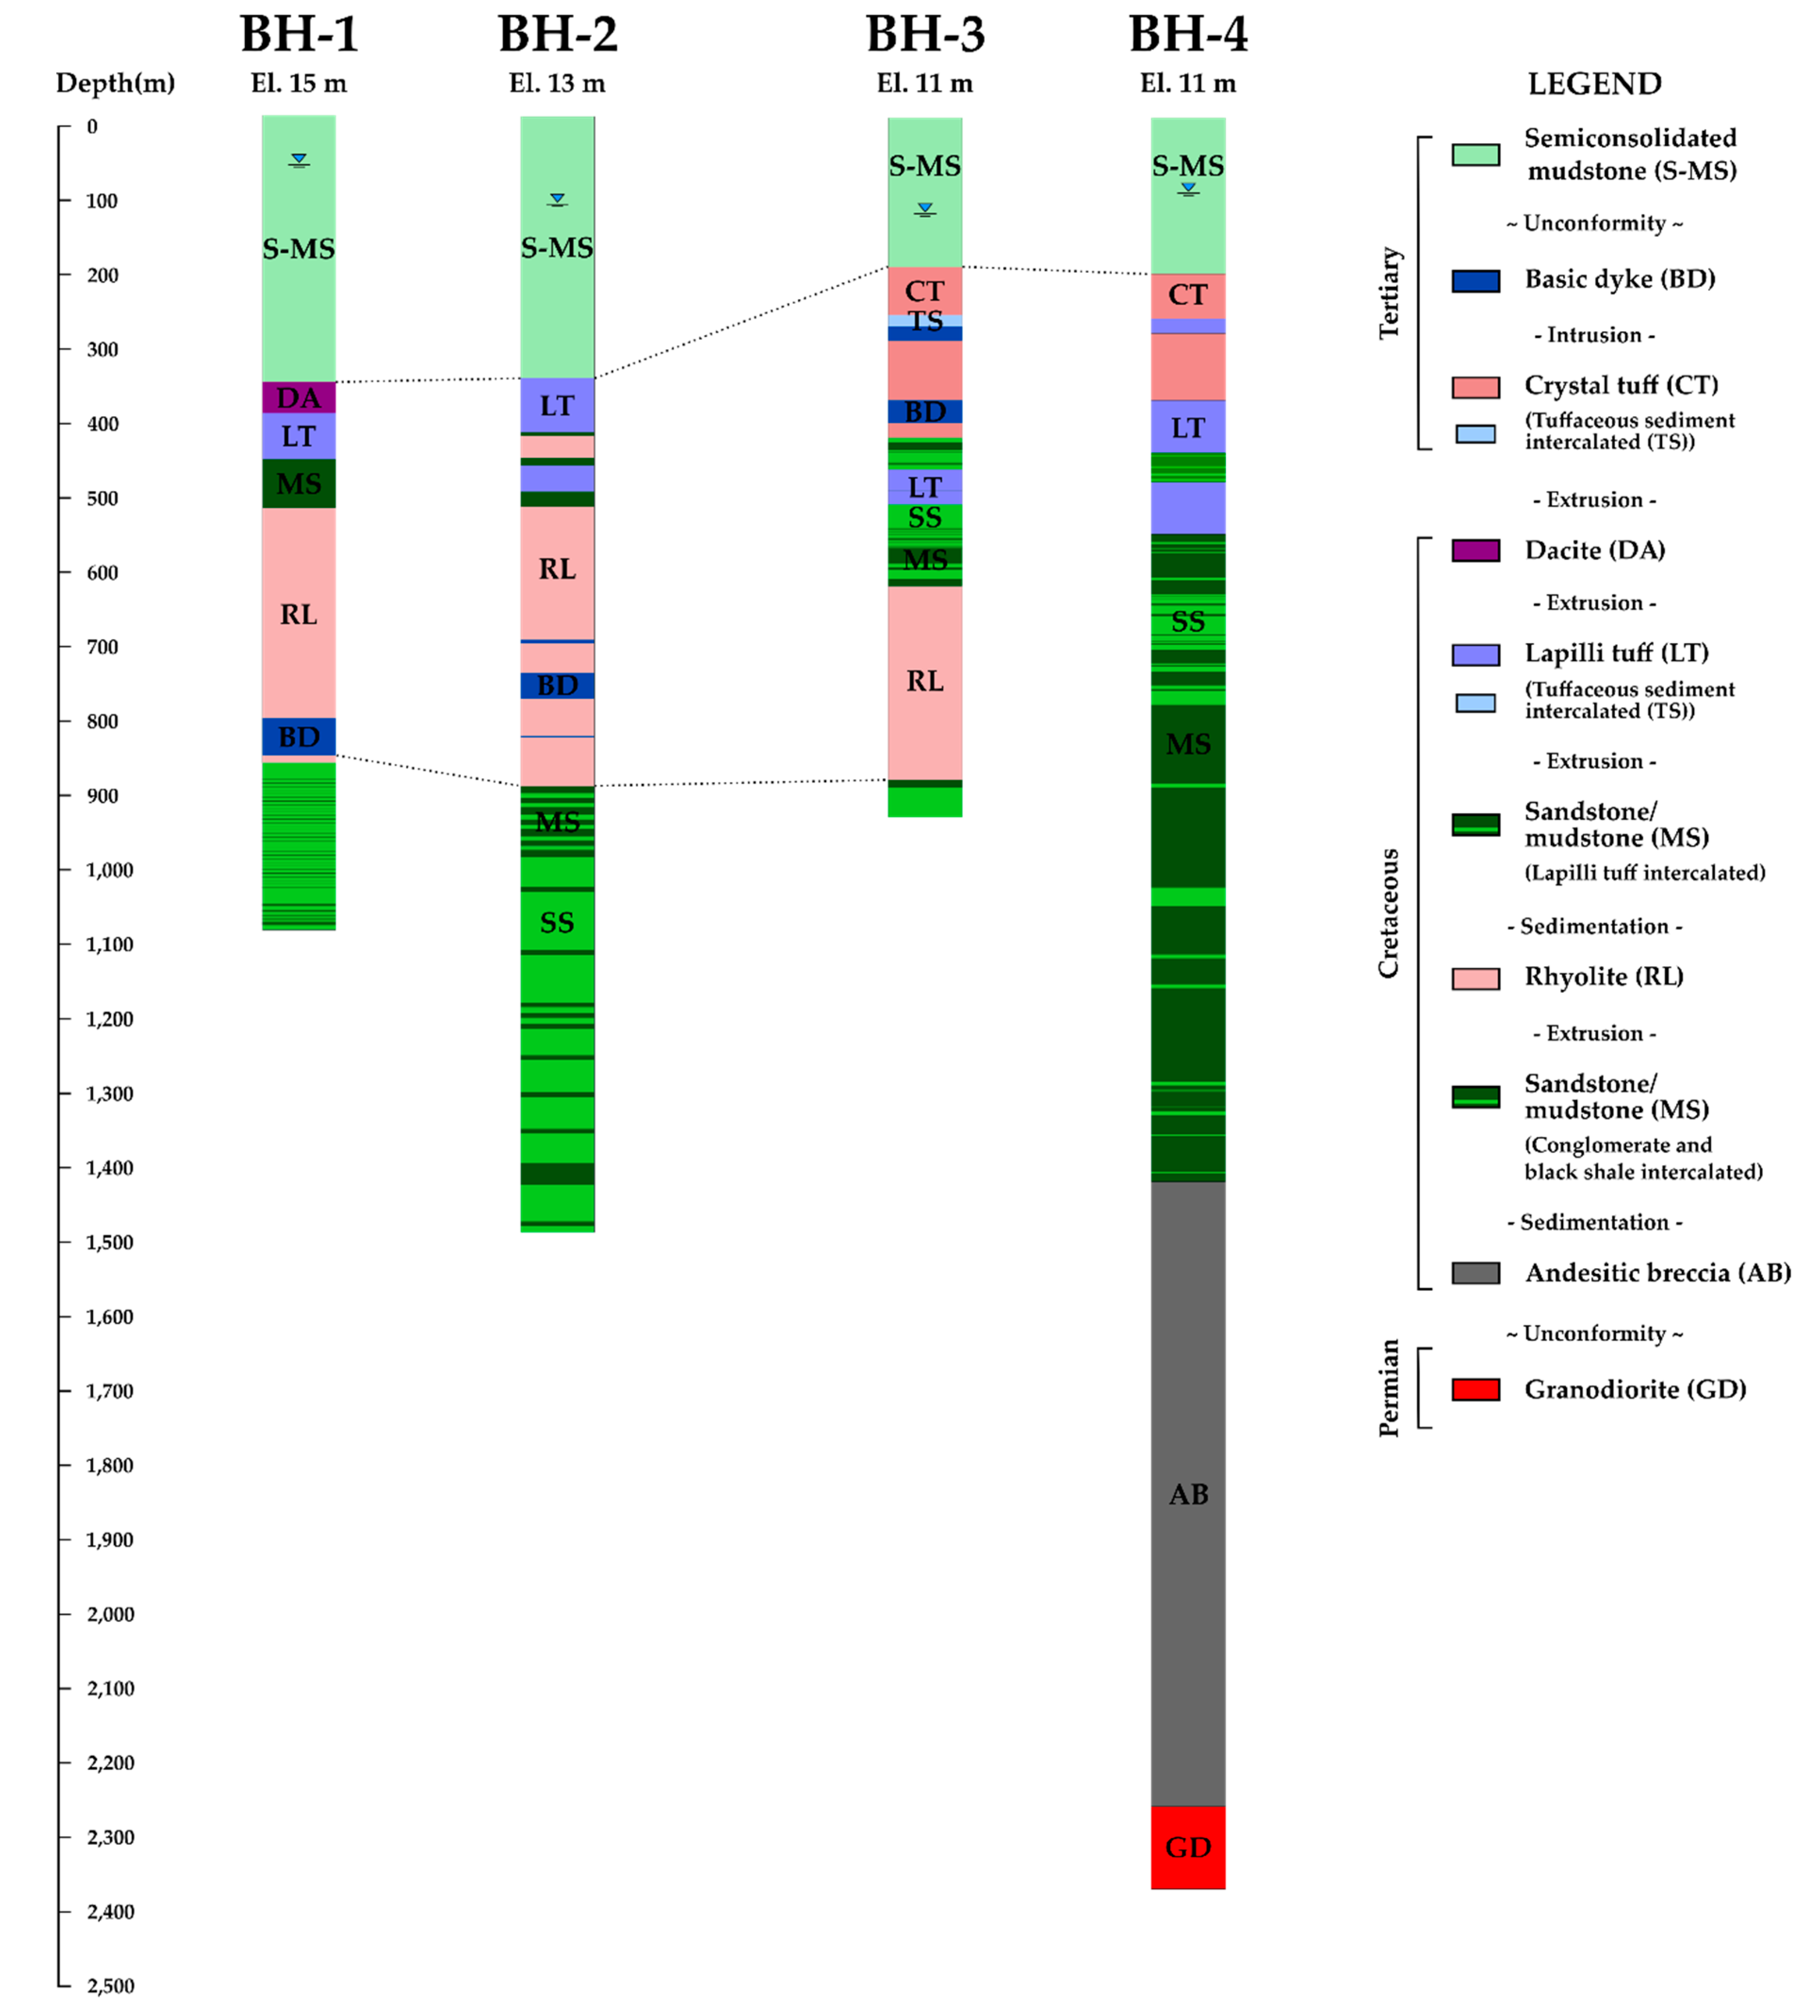
4.1. Lithological Profiles
Figure 4 shows the stratigraphic columns of the four deep boreholes; it is evident that crystal tuff lies below the semiconsolidated mudstone at the following depths: 206–428 m for BH-3 and 217–443 m for BH-4. Crystal tuff was not observed for BH-1 and BH-2. The crystal tuff exhibits a moderately weathered grade and light-green color in the upper section (212–270 m in depth), with oxidized pyrite in the disseminated state and a relatively fresh grade in the lower section, which is light gray [
9].
Dacite can only be observed in BH-1 and is located between the semiconsolidated mudstone and crystalline/lapilli tuff at a depth of 359.1–401.4 m. It is dark gray and has a generally dense lithology. At a depth of 372–374 m, the dacite is moderately weathered; at 400.7–401.4 m, it is highly weathered.
Numerous basic dykes and tuffaceous sediments are distributed between the crystal tuff layers. The basic dykes intrude to a shallow depth, with sufficient horizontal elongation at the sandstone and lapilli tuff zones. The lapilli tuff, which is light green, exhibits a moderately weathered grade over the entire section. In BH-3, rhyolite is distributed at a depth of 630–900 m with a thin layer of sandstone/mudstone in the bottom section, and sandstone (525–630 m in depth) underlies the lapilli tuff in a different manner from that in BH-2, even though the two boreholes have a similar geological stratigraphy. The lapilli tuff in BH-2 lies between 352 and 425 m from the land surface with a thickness of approximately 357–427 m.
Sandstone/mudstone mostly alternate in the lower part of the lapilli tuff with a few intercalations. The sandstone is greenish-gray, and the mudstone is dark gray and reddish-brown; similar colors can be seen in BH-1, BH-2, and BH-3. Slightly weathered coarse-grained light gray tuffaceous sandstone can be observed in BH-4 at depths of 900–900.3 and 902.9–903 m. In BH-1, BH-2, BH-3, and BH-4, the sandstone/mudstone is dark gray in the upper parts and reddish-brown in the lower parts at a depth of 1000 m, suggesting an environmental change from oxidation to reduction. In BH-3, dark-gray mudstone is predominant, except for two reddish-brown zones in the lower part, at a depth of 428 m.
Dark greenish-gray andesitic breccia can be observed at a zone lower than that of the sandstone/mudstone beds in BH-4; it cannot be observed in BH-1, BH-2, and BH-3. Andesitic breccia generally contains dark-red volcanic blocks and is fresher than the tuff. Medium-grained granodiorite contains a large amount of biotite and a minor amount of hornblende; it is light/dark gray and generally has a darker color than that of biotite granite.
The detailed lithologies, fractures/faults, and casing installations of the four boreholes are presented in
Appendix A.
4.2. Geophysical Log Profiles
The geophysical logging was conducted under steady-state conditions (without the influence of drilling and pumping) in October 2010 and December 2014, after the drilling of BH-1, BH-2, BH-3, and BH-4 from January 2003 to November 2006. Temperature, caliper, EC, and natural gamma-ray loggings were conducted to interpret the lithology, aquifer, and flow characteristics of the four boreholes (
Figure 5,
Figure 6,
Figure 7 and
Figure 8). Owing to the difficulty in acquiring highly reliable water temperature data immediately after drilling, the geophysical logging was executed at the stabilization of the groundwater temperature. In BH-1, only the temperature log data were available for the entire depth; the caliper and natural gamma-ray logs were measured up to 359 m, owing to a borehole collapse. The accuracy of the geophysical logging for BH-3 was uncertain with respect to the EC and temperature data, owing to the influence of drilling mud. In BH-4, geophysical logging was conducted to a depth of 2000 m, owing to temperature and pressure sensor limits [
24].
An accurate temperature log is critical in determining the thermal gradient and thermal conductivity; however, this was difficult to achieve, owing to the high specific weight of the drilling mud used to maintain the borehole wall during excavation and because of the casing installed after the excavation. The temperature log data for BH-3 have low accuracy because the data were obtained during drilling and because of the effect of the drilling mud. The thermal gradients of the boreholes (as well as the groundwater flow rate and direction) were estimated from the temperature logs. The decreasing tendency of the temperature from the surface to a depth of 100 m indicates the influence of the surface air temperature on the underground temperature [
49,
50,
51].
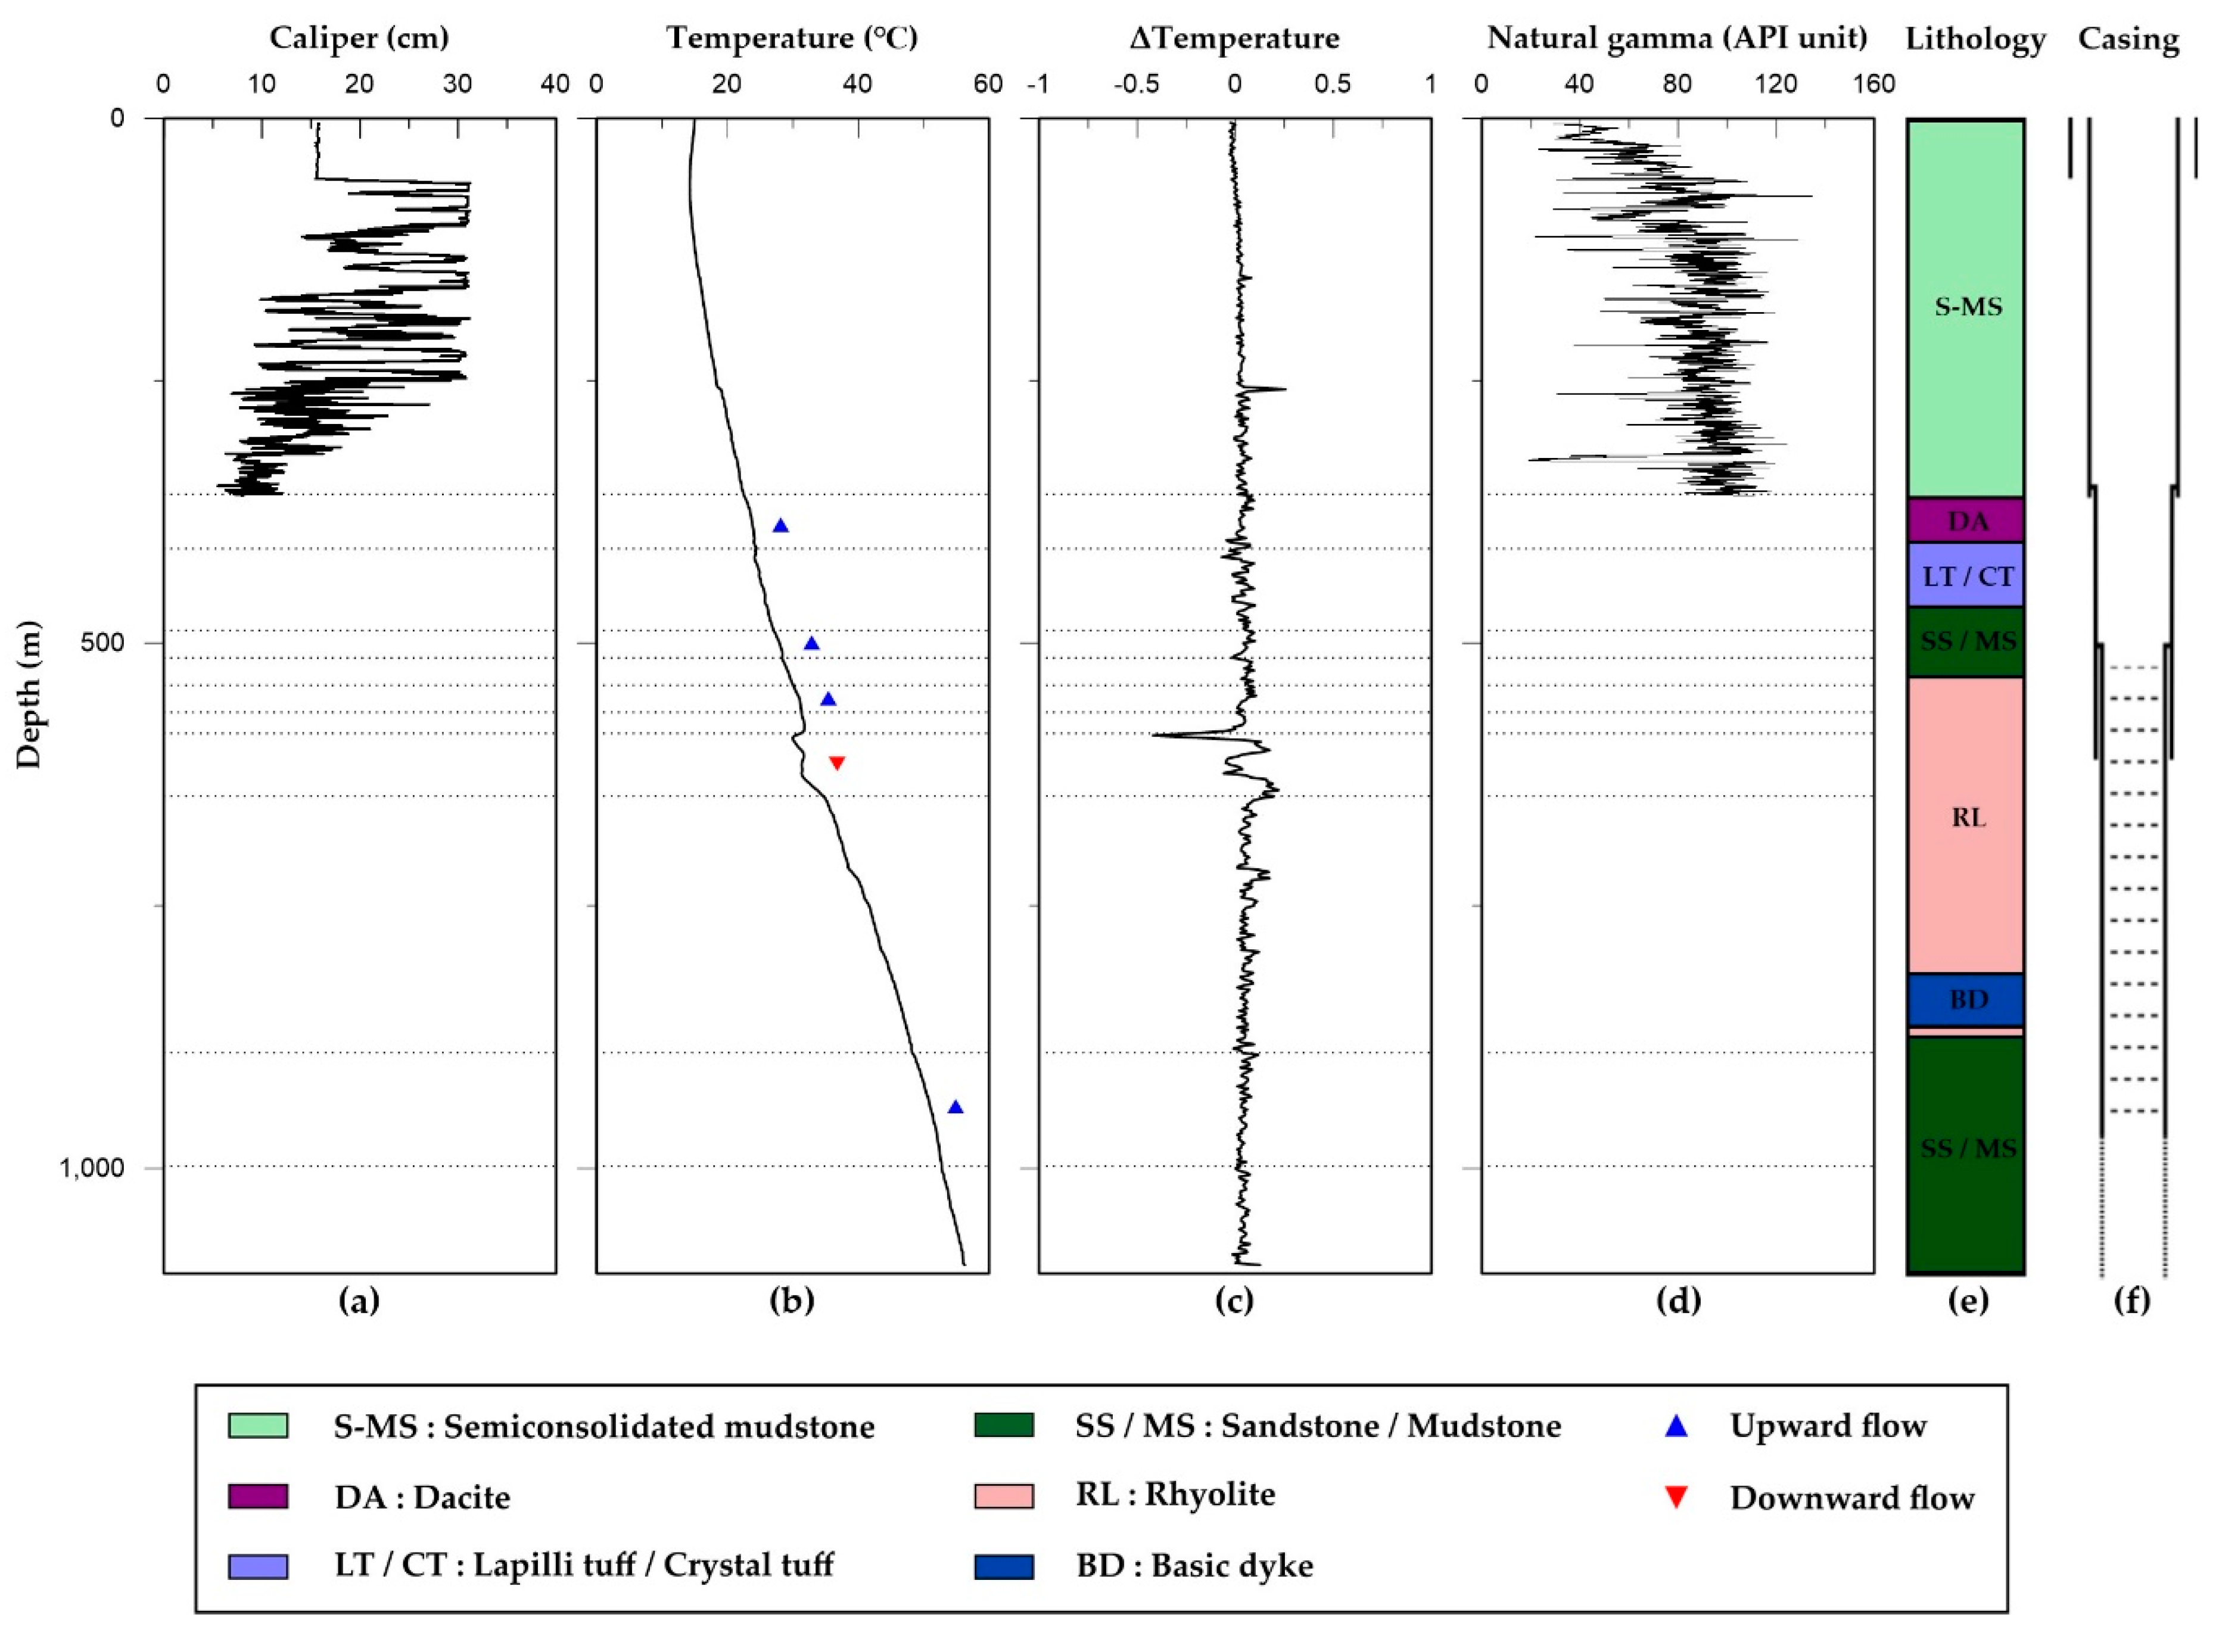
4.2.1. BH-1
Owing to the collapse of the borehole, only temperature logging was conducted for the entire depth; the caliper and natural gamma-ray loggings were performed only in the upper zone (
Figure 5). The temperature log zones were identified at the following depths: 358–410 m for the dacite section, 488–514 and 890–998 m for the sandstone/mudstone section, and 540–566 and 586–646 m for the rhyolite section (
Figure 5b,c). The highest temperature for BH-1 was 56.28 °C at a depth of 1092 m. Based on the temperature log, the thermal gradient of BH-1 was 30.77 °C/km at a depth of 258–420 m, 22.37 °C/km at a depth of 430–715 m, and 25.01 °C/km at a depth of 820–1092 m.
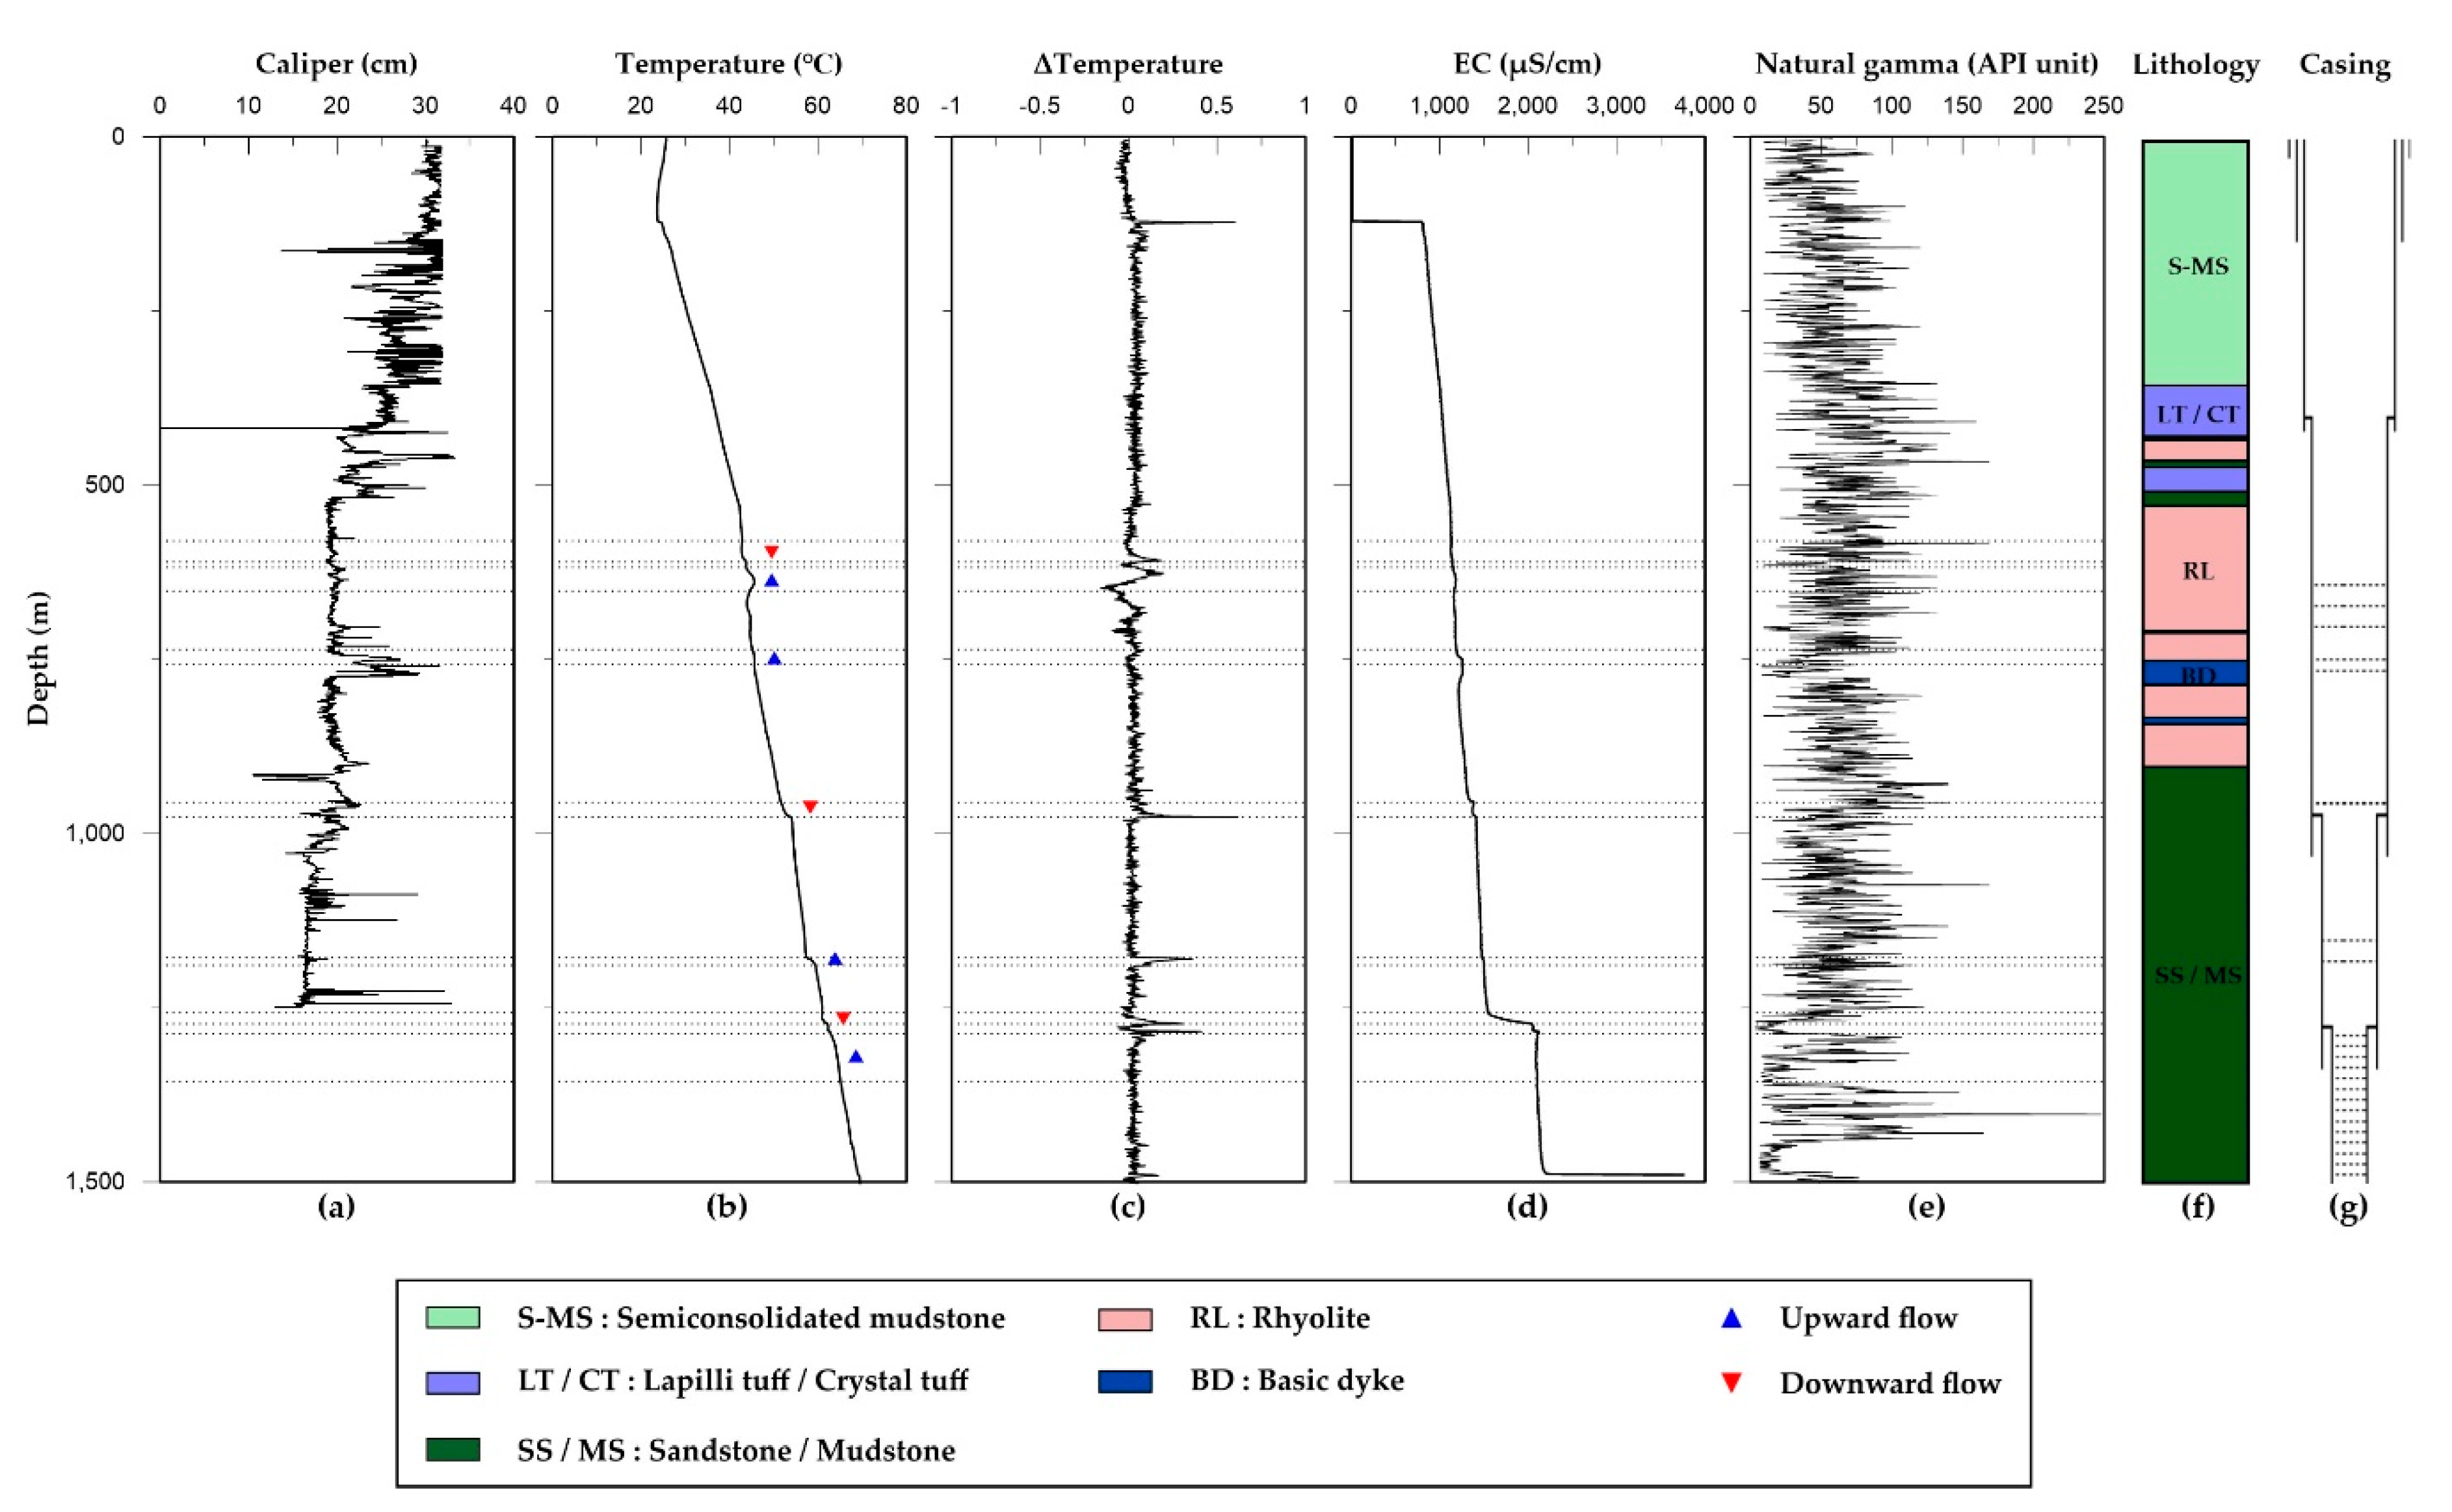
4.2.2. BH-2
Compared with the lithology data for the other boreholes, more caliper log anomalies were observed at the following depths: 576.4, 636.4, 704–773 m for rhyolite and basic dyke and 900, 960.75, 1065.55, 1087.25, 1124.8, 1181, 1126.9, and 1245 m for sandstone/mudstone (
Figure 6a).
The temperature log zones were identified at depths of 580–610, 618–652, and 736–757 m for the rhyolite section and 955–976, 1178–1189, 1257–1273, and 1287–1356 m for the sandstone/mudstone section (
Figure 6b,c). The highest temperature was 69.51 °C, at a depth of 1502 m. The thermal gradient of BH–2 was 22.89 °C/km at a depth of 130–370 m, 26.78 °C/km at a depth of 370–538 m, 64.52 °C/km at a depth of 538–770 m, and 33.33–35.67 °C/km at a depth of 770–1502 m.
The EC values at a depth of 122–1490 m ranged from 801 to 3758 μS/cm. The most distinctive anomalous zones of the EC were found at depths of 578–581, 622–627, 665, 737, 762, 943–955, 966–972, 1170, 1181, 1251, 1273, 1284, and 1360 m (
Figure 6d).
The semiconsolidated mudstone had an average natural gamma radioactivity of 51 American Petroleum Institute (API) units at a depth of 0–356.7 m; lapilli tuff had 71 API units at a depth of 356.7–423.7 m; tuffaceous sediment had 103 API units at a depth of 423.7–426.4 m and 70 API units at a depth of 450.6–461.8 m; crystal tuff had 93 API units at a depth of 426.4–450.6 m; sandstone/mudstone had 72 APIs unit at a depth of 461.8–521.6 m and 56 API units at a depth of 876.4–1501.3 m; rhyolite had 64 API units at a depth of 521.6–701.1 m, 63 API units at a depth of 708.0–744.5 m, 65 API units at a depth of 775.7–827.9 m, and 66 API units at a depth of 830.6–876.4 m; and, finally, basic dyke had 33 API units at a depth of 701.1–708.0 m, 35 API units at a depth of 744.5–775.7 m, and 36 API units at a depth of 827.9–830.6 m (
Figure 6e). The lower natural gamma-ray intensities represented sandstone at a depth of 1200–1440 m based on the core samples, as well as the basic dyke at a depth of 1440–1490 m. The zone of 1200–1440 m approximately corresponded with an anomaly depth of 1245 m based on the caliper log. The trend of the caliper log was different from that for the EC log, which could not distinguish between sandstone and basic dyke at depths greater than 1200 m. Rhyolite at a depth of 520–825 m exhibited a distinct natural gamma-ray intensity. Three basic dykes intruding into the rhyolite could be easily distinguished from the rhyolite, by their low natural gamma-ray values. At a depth of 460–520 m, the natural gamma-ray values of the semiconsolidated mudstone overlying the rhyolite were approximately the same with those of sandstone.
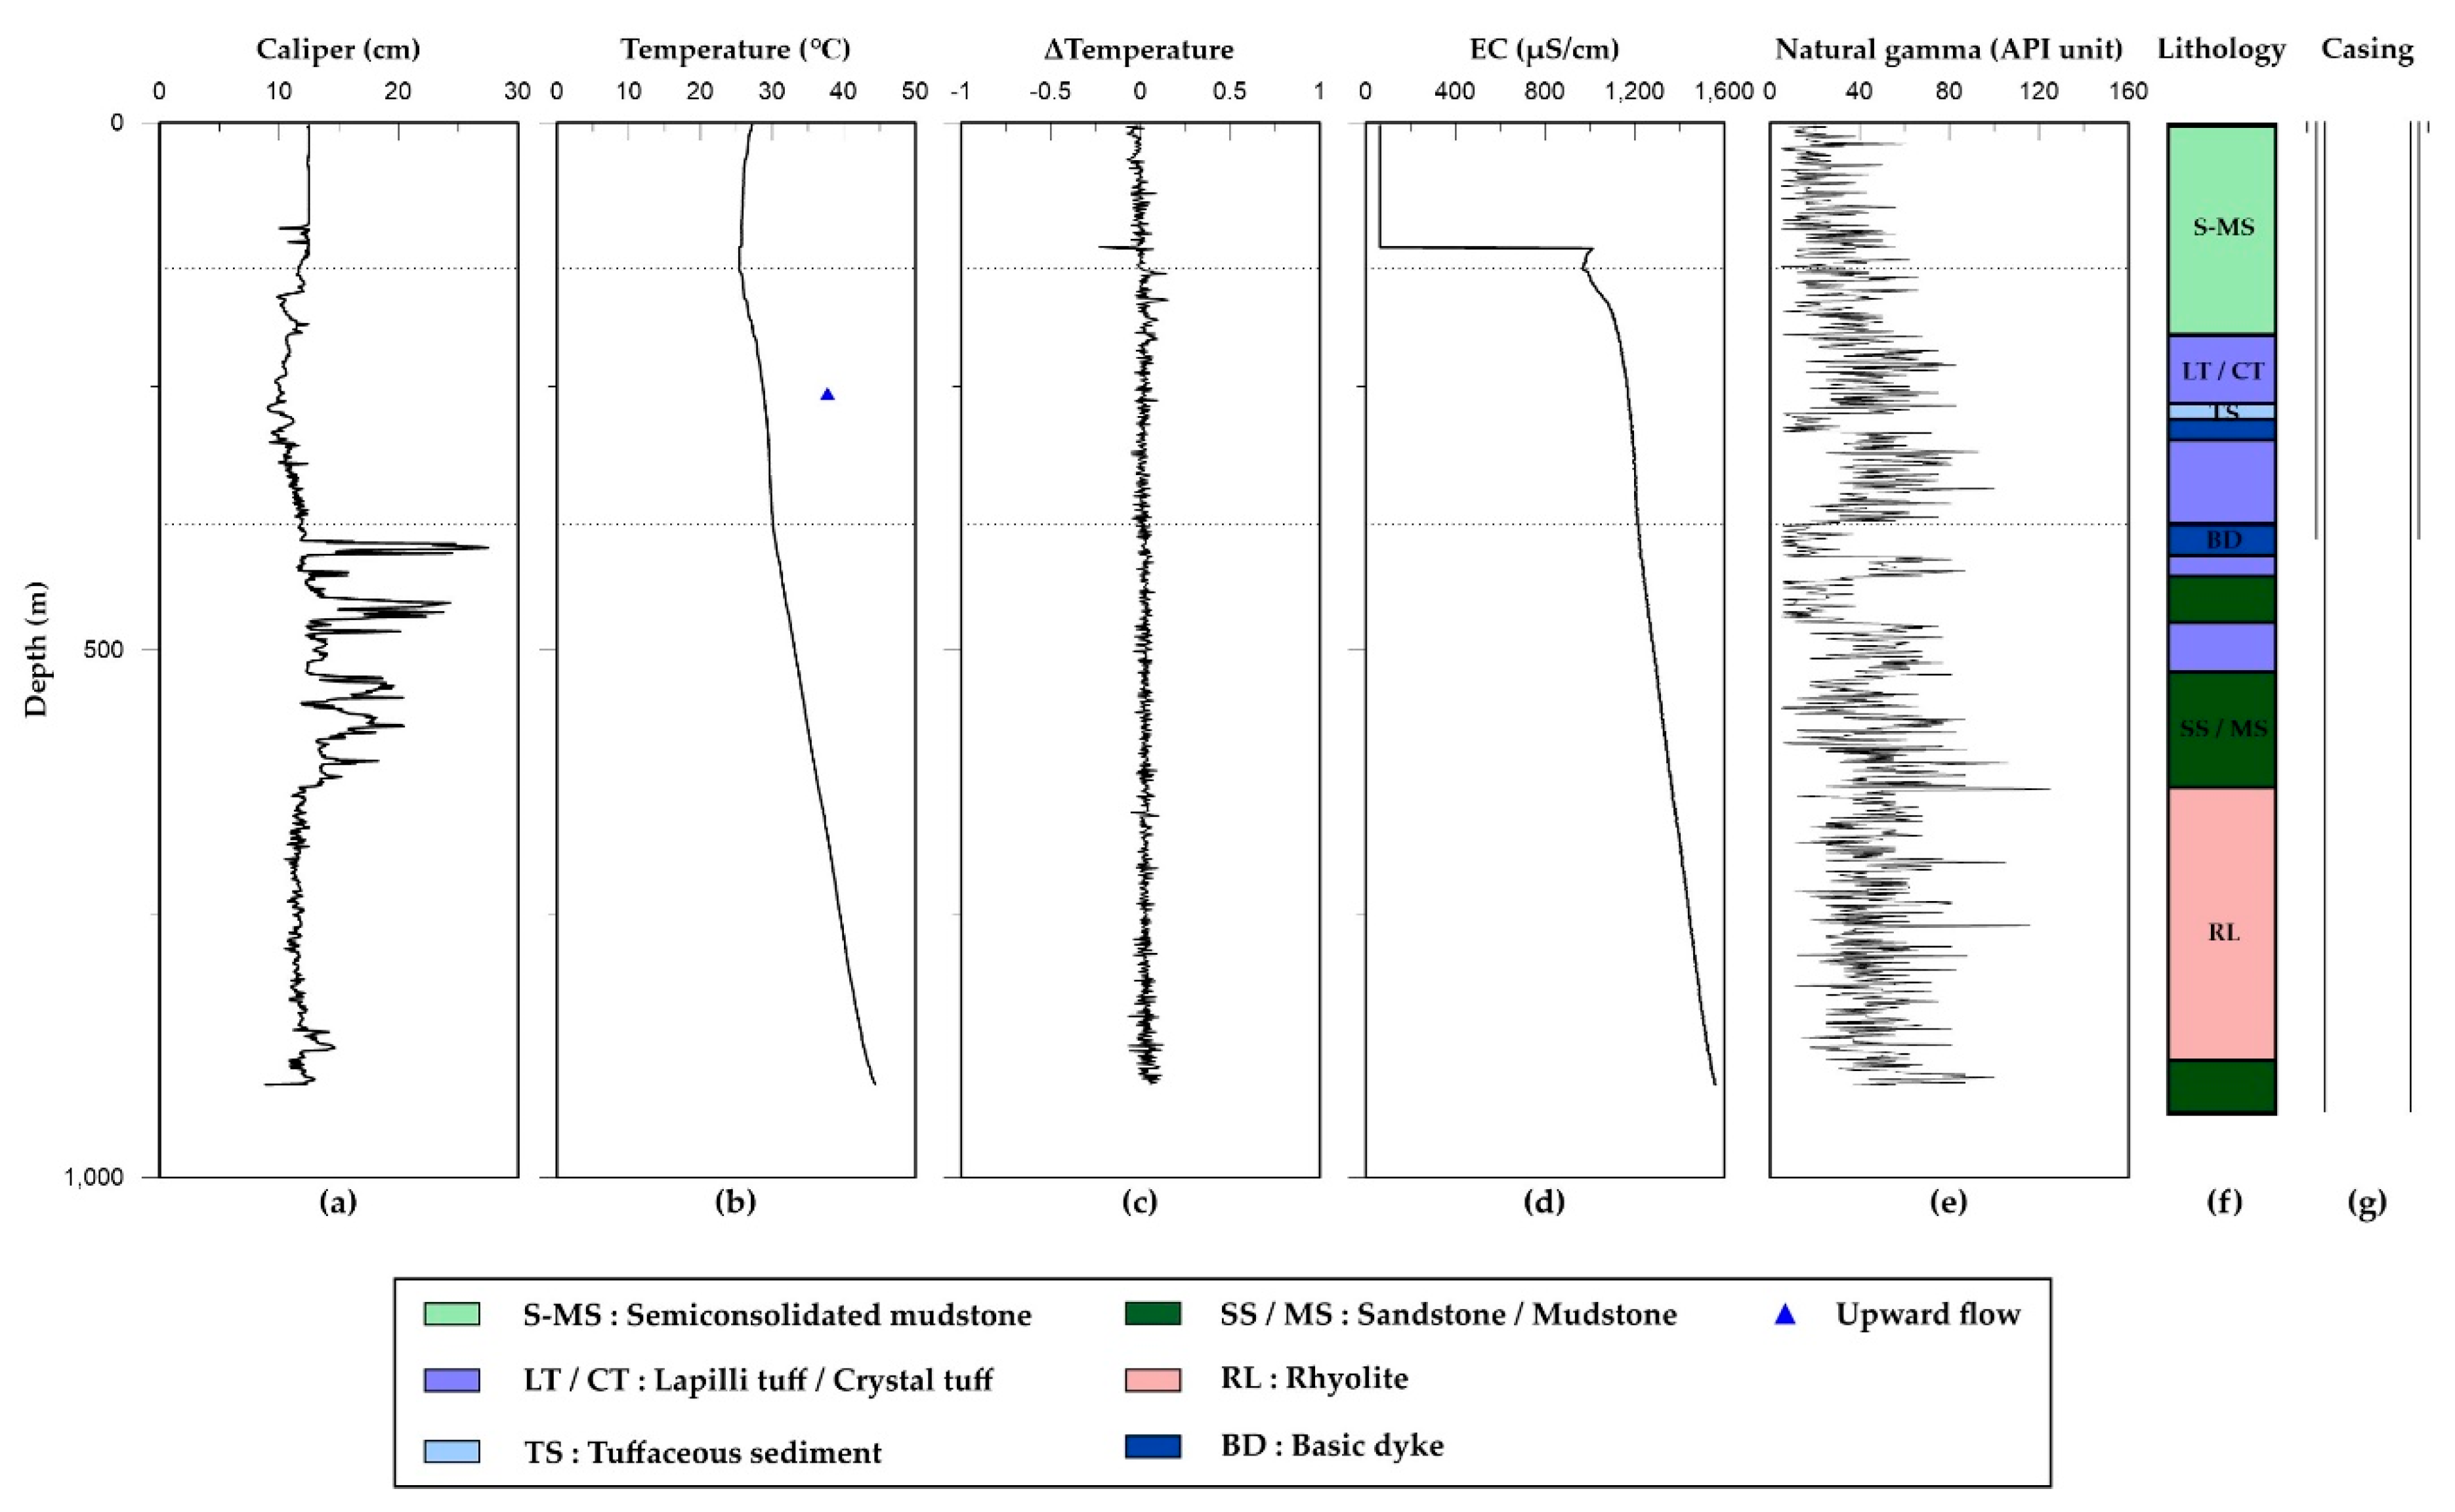
4.2.3. BH-3
Anomalous zones of the caliper log appeared at depths of 399–408 and 455–468 m for the basic dyke; 531–545, 564–578, and 605–607 m for sandstone/mudstone; and 862–877 m for rhyolite (
Figure 7a).
The temperature log zones were identified at a depth of 138–381 m in the semiconsolidated mudstone, tuffs (lapilli tuff, crystal tuff, and tuffaceous sediment), and basic dyke sections (
Figure 7b,c). The highest temperature of BH-3 was 44.33 °C at a depth of 912.27 m. The thermal gradient of BH-3 was 51.51 °C/km at a depth of 138–381 m and 40.85 °C/km at a depth of 381–900 m. The temperature log data for BH-3 had low accuracy due to the effect of the drilling mud, as they were obtained during drilling.
The EC values at a depth of 118–911 m ranged from 969 to 1561 μS/cm. The most distinctive anomalous zones of the EC can be observed at depths of 134–140 and 381–400 m (
Figure 7d).
The semiconsolidated mudstone had an average natural gamma radioactivity of 64 API units at a depth of 0–206.1 m; crystal tuff had 104 API units at a depth of 206.1–257.0 m, 127 API units at a depth of 292.6–376.1 m, and 133 API units at a depth of 409.3–428.3 m; tuffaceous sediment had 119 API units at a depth of 257.0–273.2 m; basic dyke had 33 API units at a depth of 273.2–292.6 m and 30 API units at a depth of 428.3–474.7 m; lapilli tuff had 100 API units at a depth of 474.7–524.1 m; sandstone/mudstone had 77 API units at a depth of 524.1–628.7 m and 140 API units at a depth of 901.1–911.2 m; and, finally, rhyolite had 90 API units at a depth of 632.1–901.1 m (
Figure 7e). According to the natural gamma-ray log data, BH-2 and BH-3 had similar lithologies.
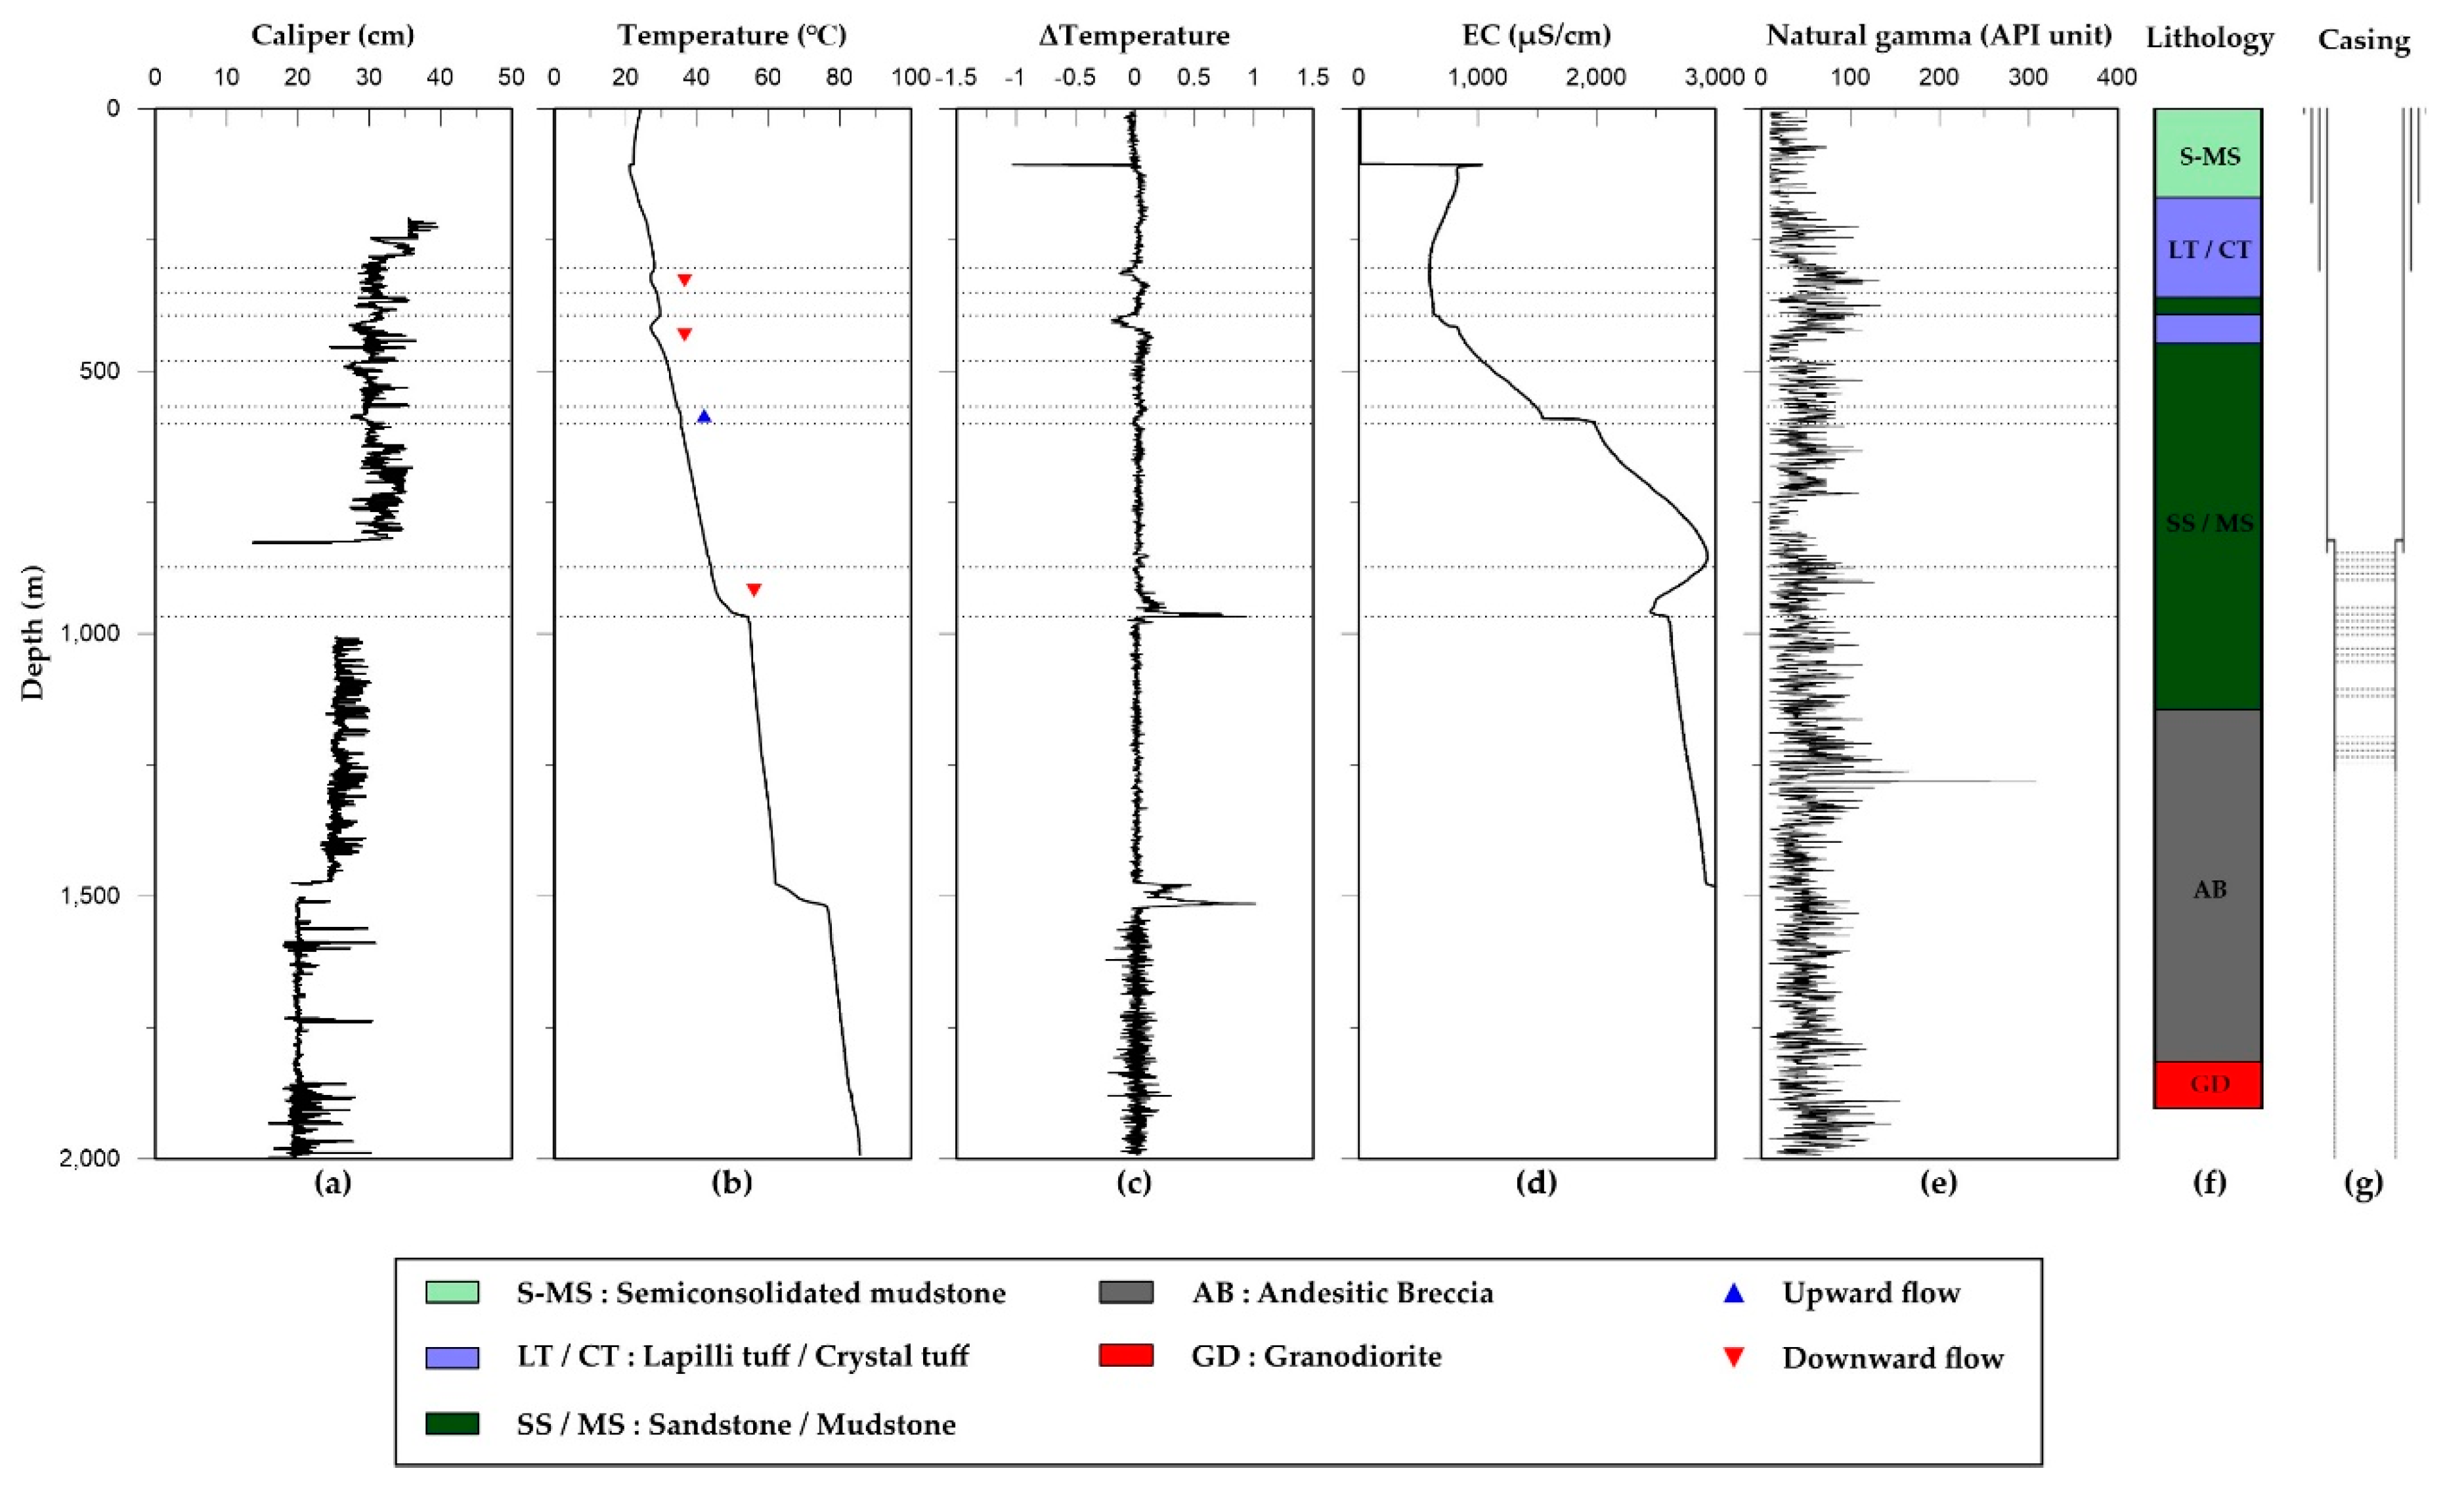
4.2.4. BH-4
Anomalies of the caliper log occurred in the lower zones at depths of 1548, 1562, 1588–1599, 1733–1738, 1967, and 1988.7 m for the andesitic breccia (
Figure 8a). At 828–1000 m, the caliper measurement was not executed, owing to the conditions of the borehole.
Abrupt zones of temperature changes were identified at depths of 303–350 m in the crystal tuff section, 394–480 m in the lapilli tuff section, and 567–600 and 873–967 m in the sandstone/mudstone section (
Figure 8b,c). The thermal gradient of BH-4 was 20.92 °C/km at a depth of 115–225 m, 48.78 °C/km at a depth of 225–490 m, and 35.71 °C/km at a depth of 490–1475 m.
The EC values ranged from 513 to 2999 μS/cm between 106 and 1482 m. The most distinctive anomalous zones of the EC were found at depths of 301, 367, 394–397, 416, 585–598, 850, 967–970, 1383, and 1468 m (
Figure 8d).
The semiconsolidated mudstone had an average natural gamma radioactivity of 24 API units at a depth of 0–217.4 m; crystal tuff had 133 API units at a depth of 217.4–252.4 m and 137 API units at a depth of 297.3–359.5 m; sandstone/mudstone had 37 API units at a depth of 443.3–480.1 m and 78 API units at a depth of 547.7–1361 m; lapilli tuff had 102 API units at a depth of 270.3–279.3 m, 120 API units at a depth of 368.6–443.3 m, and 95 API units at a depth of 480.1–547.7 m; and, finally, andesitic breccia had 48 API units at a depth of 1361–1.996 m (
Figure 8e). The low natural gamma-ray intensity at a depth of 740–810 m indicated the occurrence of sandstone, whereas the higher values at 1285 m indicated shale and andesitic breccia, which do not exist in the other boreholes; a high intensity was observed at a depth of 1360 m for BH-4.
4.3. Groundwater Flow Characteristics
The groundwater flow based on the temperature log data was interpreted using the 1D steady-state heat transfer solution [
11,
27] and by matching the observed temperature data with appropriate types of curves, considering the lithology log and anomalies of the caliper and EC logs in the process. By matching to the most appropriate type of curve, the corresponding
β value, groundwater flow velocity, and upward/downward flow directions were determined with the residual sum of squares (RSS), 0.008–2.013 (
Table 1). The thermal conductivity values of 2.16–3.95 W/mK (
Table 1) and thermal diffusivity values of 0.71–1.60 mm
2/s were determined from 42 samples. One sample was taken from the basic dyke, seven samples were taken from rhyolite, and thirty-four samples were taken from sandstone/mudstone layers. The unmeasured thermal conductivity values of the dacite and crystal tuff were based on representative values in South Korea (
Table 1) [
52]. The determined thermal diffusivity and thermal conductivity values seem reasonable by the comparison between the reference values [
53,
54,
55] (
Table 2).
Williams [
56] reported that a harmonic mean of measured thermal conductivities could appropriately consider the anisotropy of stratified formations. In this study, the harmonic means of the thermal conductivity values were applied for three or more samples of the rocks. A specific heat of water in the range of 4.18–4.19 kJ/kgK and a density in the range of 980–998 kg/m
3 at 22–65 °C were applied for the 1D steady-state heat transfer.
In BH-1, upward flows occurred along the fractures with dip angles of −60° to 70° in four sections: 358–410 m along a fracture zone of 410.3–410.7 m in the dacite and tuffaceous sediment section with a flow velocity of −2.27 × 10⁻⁵ m/s; 488–514 m along a fracture zone of 511–514.8 m in the sandstone/mudstone with a flow velocity of −5.93 × 10⁻⁵ m/s; 540–566 m along a fracture zone of 523.8–569.5 m in the rhyolite, with a flow velocity of −7.51 × 10⁻⁵ m/s; and 890–998 m along a fracture zone of 977.2–979.2 m in the sandstone/mudstone, with a flow velocity of −7.86 × 10⁻⁶ m/s. Alternatively, a downward flow occurred at 586–646 m along a fault zone of 572.6–572.9 m in the rhyolite, with a dip angle of −50° and flow velocity of 1.09 × 10⁻⁴ m/s.
In BH-2, upward flows with dip angles of −10°–60° occurred in four sections: 618–652 m along a highly fractured zone of 525–900 m in the rhyolite with a flow velocity of −5.16 × 10
−4 m/s, corresponding to the EC anomaly at 655 m; 736–757 m along a highly fractured zone of 525–900 m in the basic dyke with a flow velocity of −1.41 × 10
−4 m/s, corresponding to the EC anomaly at 762 m; 1178–1189 m along a highly fractured zone of 1155–1165 m in the sandstone/mudstone with a flow velocity of −5.90 × 10
−4 m/s, corresponding to the EC anomaly at 1181 m; and 1287–1356 m along the fault of 1310 m in the sandstone/mudstone with a flow velocity of −1.97 × 10
−5 m/s, corresponding to the EC anomaly at 1360 m. Downward flows with dip angles of −17° to 28° occurred in three sections: 580–610 m along the highly fractured zone of 525–900 m in the rhyolite with a flow velocity of 3.16 × 10
−4 m/s, corresponding to the EC anomaly at 578–581 m; 955–976 m along the bedding plane in the sandstone/mudstone with a flow velocity of 2.39 × 10
−4 m/s, corresponding to the EC anomaly at 943–955 m in the sandstone/mudstone; and 1257–1273 m along a fault of 1240 m in the sandstone/mudstone with a flow velocity of 4.69 × 10
−4 m/s, corresponding to the EC anomaly at 1251 m.
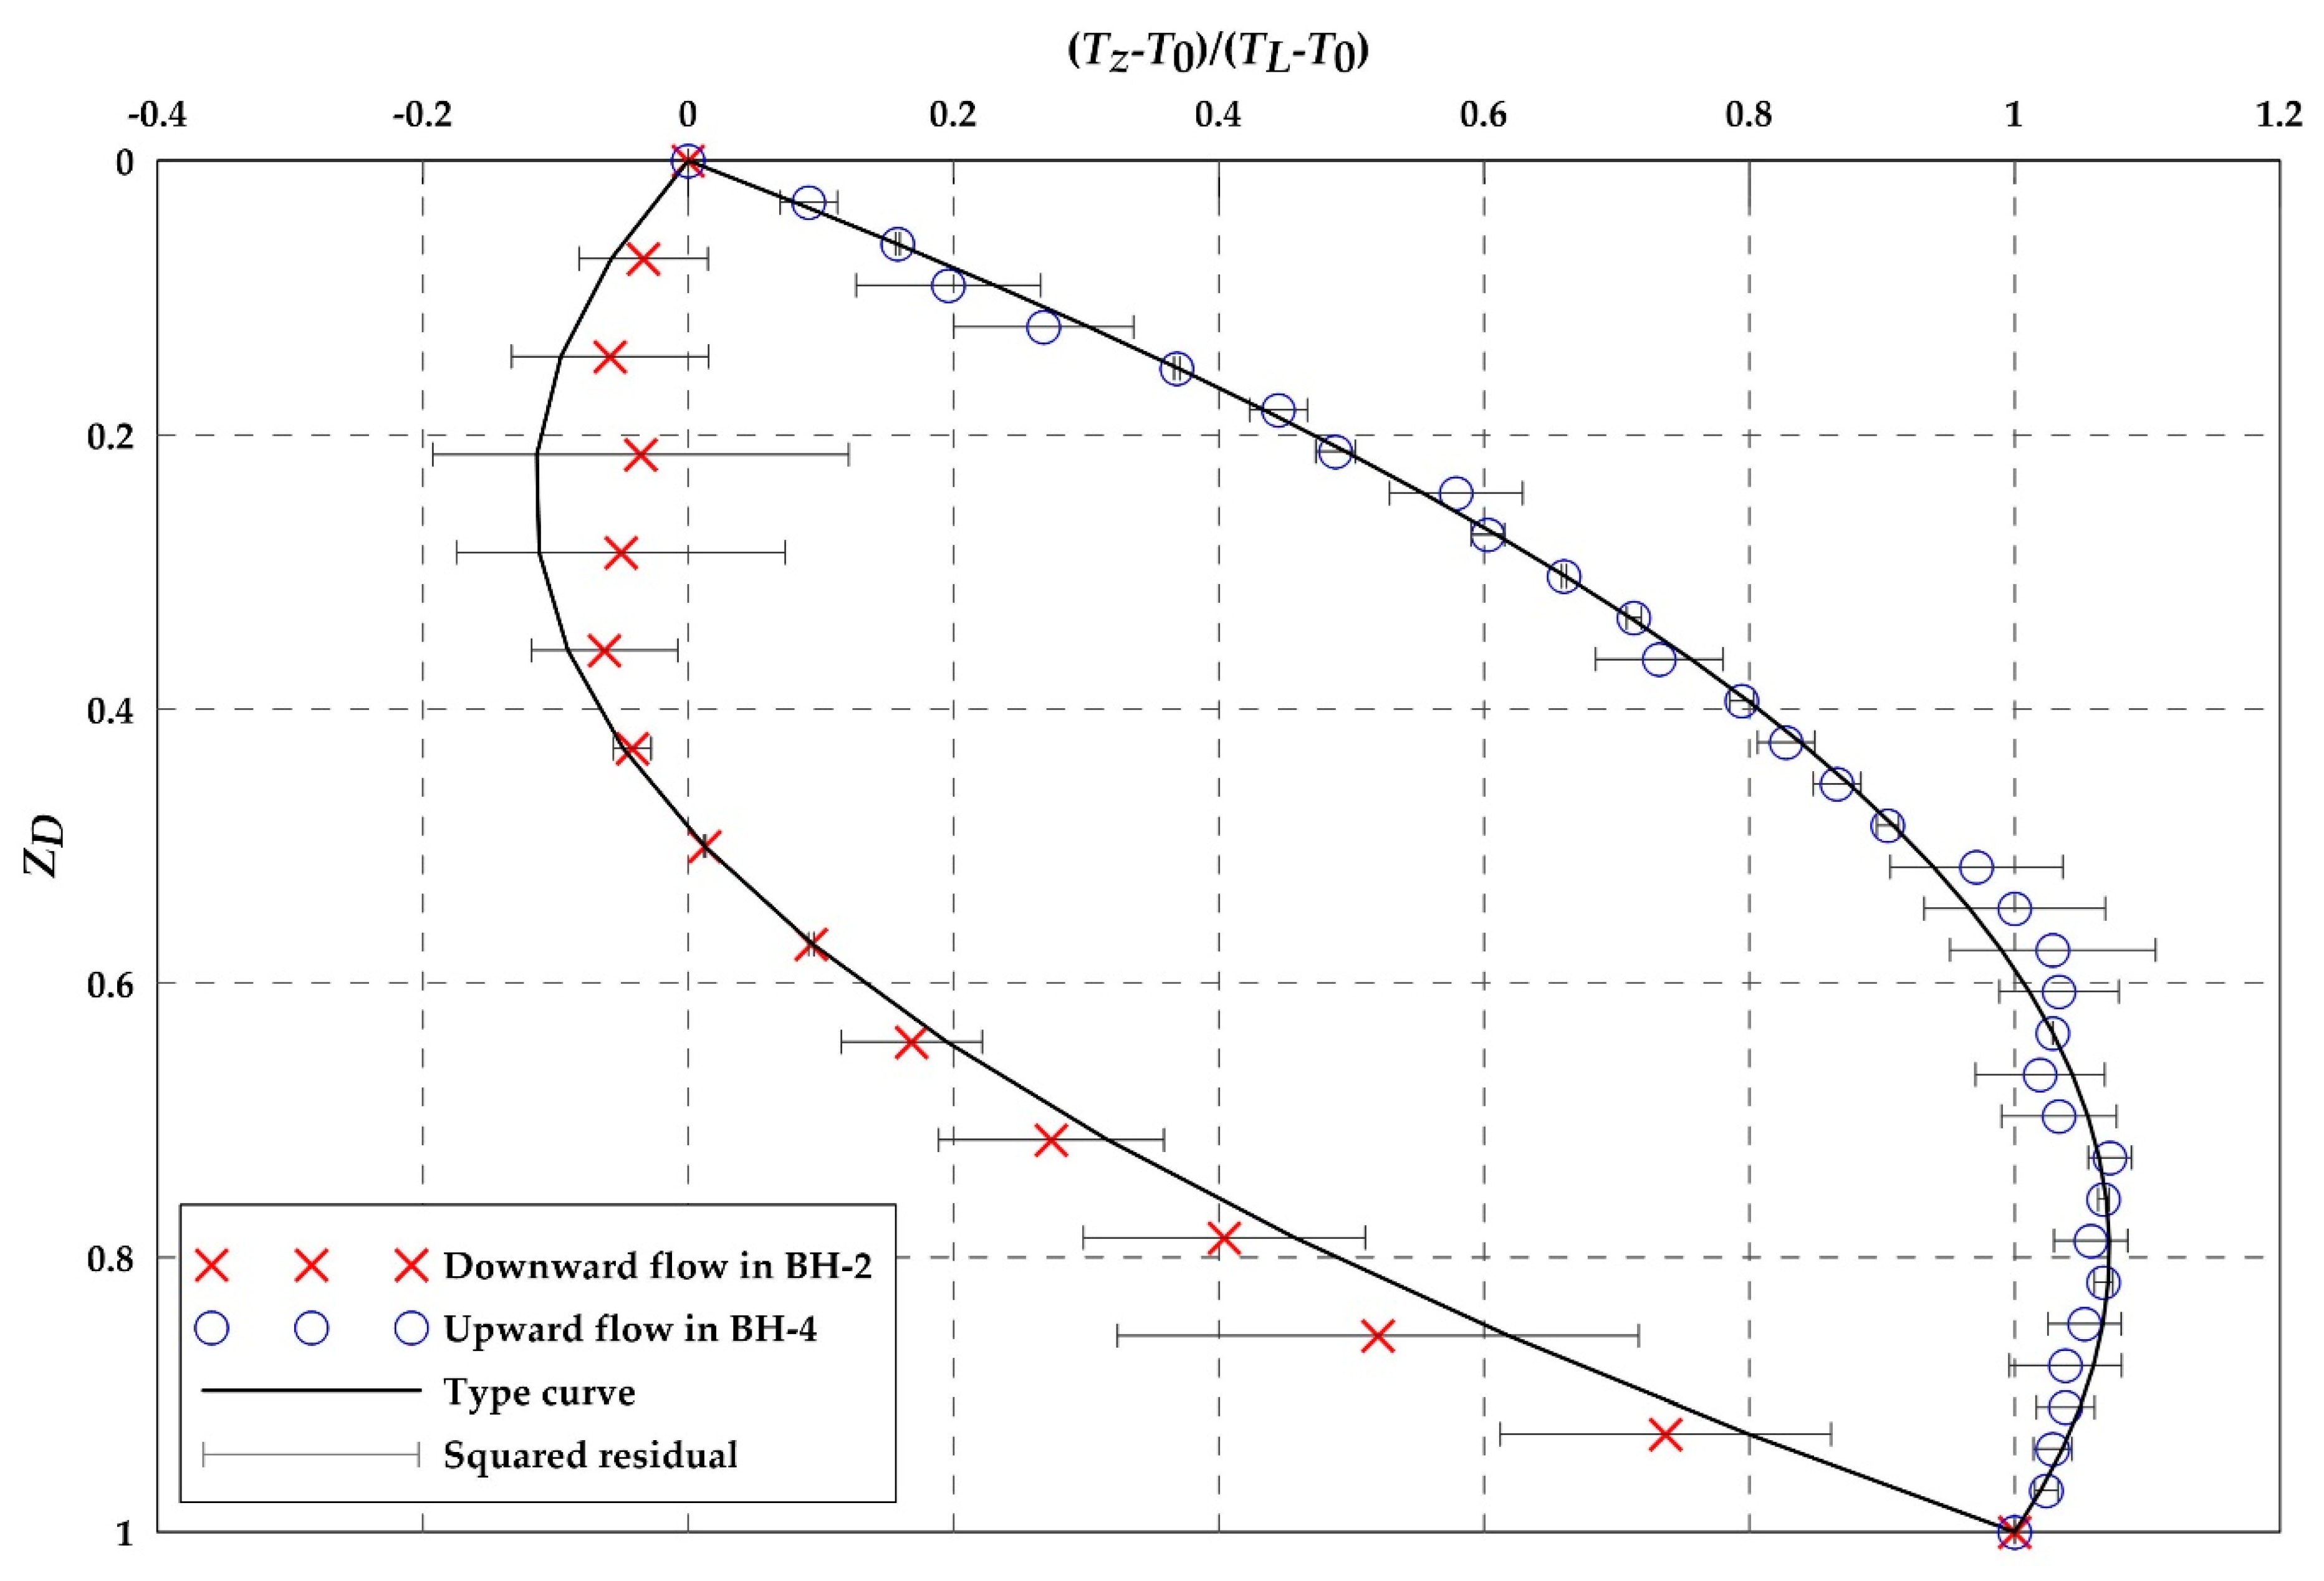
Figure 9 shows downward flow in the zone of 1257–1273 m with
β = 3.90 (RSS = 0.031). The deviations between the type of curve and measured temperature values, especially in the section of 0.2 <
zD < 0.4 in
Figure 9 can be explained by the deviations of the centering of the loggers [
57] or change of fracture direction or interconnection with other facture sets [
27]. The deviation can also be noticed on the EC profile in
Figure 6.
In BH-3, an upward flow with a dip angle of −90° occurred at 138–381 m along a fault of 400–403 m in the basic dyke with a flow velocity of −5.27 × 10⁻⁶ m/s, corresponding to the EC anomaly at 381–400 m.
In BH-4, an upward flow with a dip angle of approximately 65° occurred 567–600 m along a fault of 501–502 m in the sandstone/mudstone with a flow velocity of −8.07 × 10
−5 m/s, corresponding to the EC anomaly at 585–598 m. Alternatively, downward flows with dip angles of 30°–90° occurred in three sections: 303–350 m along the fault of 281.9–282 m in the crystal tuff with a flow velocity of 2.17 × 10
−4 m/s, corresponding to the EC anomaly at 301 m; 394–480 m along the fault of 402–402.1 m in the crystal tuff with a flow velocity of 7.96 × 10
−5 m/s, corresponding to the EC anomaly at 394–397 m; and 873–967 m along the fracture zone of 1000–1127 m in the sandstone/mudstone with a flow velocity of 4.28 × 10
−5 m/s, corresponding to the EC anomaly at 850 m.
Figure 9 shows the upward flow in the zone of 567–600 m, with
β = −3.39 (RSS = 0.010).
5. Discussion
Conventional geophysical logs can qualitatively indicate the fractures and alteration zones intersecting the boreholes [
58,
59]. In this study, we characterized deep groundwater flow and thermal properties by using geophysical logs and lithological logs of boreholes. The fracture zones and thermal properties were identified based on the geophysical logs, following the research of Paillet [
60,
61] and Katsube and Hume [
62].
The geophysical logs and lithology profiles indicated that groundwater flows into, and out of, the boreholes in the basic dyke, rhyolite, and sandstone/mudstone that contain highly fractured zones. The caliper log identified the anomaly zones associated with highly fractured zones in the basic dyke, rhyolite, sandstone/mudstone, and andesitic breccia. The results of the strata analysis using natural gamma-ray log and lithology log suggest that the geological strata from the upper Mesozoic sedimentary rocks to the upper part included semiconsolidated mudstone, tuffs (lapilli tuff, crystal tuff, and tuffaceous sediment), rhyolite, and sandstone/mudstone; moreover, the strata possessed good horizontal connectivity, with possible fracture connections in the rock around the boreholes. The depth of the Cretaceous semiconsolidated mudstone layer increased in depth from north (BH-3 and BH-4) to south (BH-1 and BH-2). The distribution of the tuffaceous sediment decreased and that of the crystal tuff increased from south to north.
By comparing the caliper log and lithology data, anomalies appeared for BH-2 at the following depths: 424, 461, and 504 m for the rhyolite; 704, 731, and 760 m for the basic dyke; and 1087, 1125, and 1245 m for the sandstone/mudstone. This is similar to the anomalous zone of 1200–1440 m obtained based on the natural gamma-ray log. The anomalies in BH-3 appeared at a depth of 403 m for the basic dyke, 620 m for the sandstone/mudstone, and 862 and 877 m for the rhyolite. In contrast, the anomalies in BH-4 occurred at greater depths, specifically, at 1589, 1738, and 1989 m for the andesitic breccia. In BH-2, the three basic dykes (intruding into the rhyolite) were distinguished easily from the rhyolite, owing to their low natural gamma-ray intensities.
By means of the lithological log and geophysical logs, several aquifer zones were identified, at depths of 350–410, 510–590, 600–650, 730–760, 870–890, 950–1000, and 1150–1360 m, as well as hydraulically active fractures intersecting the deep boreholes. An anomaly in the EC values can represent an inflow or outflow point of fresh and/or saline water in the borehole [
45].
Uncertainty can be induced in the upward or downward flows of the 1D steady-state heat transfer model from the deviations in the centering of the loggers [
57] or change of fracture direction or interconnection with other facture sets [
27] in the boreholes, e.g., BH-2 in
Figure 9. The average angle of the fracture zone,
, representing the average direction of groundwater flow along the fracture, is not known a priori [
27]. Uncertainty also exists in the groundwater flow owing to indistinct nonlinear temperature zones; these can be more clearly identified through a detailed investigation of the fractures and faults in deep boreholes.
6. Conclusions
The lithological and geophysical logs of the four deep boreholes could identify the deep groundwater flows in the Pohang area that experienced the youngest tectonic movements in the Korean peninsula. The groundwater flow directions and β values of the boreholes were estimated by using a 1D steady-state heat transfer model. The geological stratigraphy of the four boreholes primarily contained Tertiary semiconsolidated mudstone, dacite, tuffs (crystal tuff, lapilli tuff, and tuffaceous sediment), basic dyke, sandstone/mudstone, andesitic breccia, and granodiorite. BH-1, BH-2, and BH-3 had similar stratigraphy overall, and no rhyolite was found in BH-4 at depths greater than 600 m. The semiconsolidated mudstone was located at a greater depth in BH-1 and BH-2 than in BH-3 and BH-4.
In the interpretation of the groundwater flow, the fractures and faults induced nonlinear temperature changes and upward and downward flows. Moreover, several aquifer zones were identified at depths of 350–410, 510–590, 600–650, 730–760, 870–890, 950–1000, and 1150–1360 m, as well as hydraulically active fractures intersecting the deep boreholes. In BH-1, upward flows occurred at four depths, at 358–410, 488–514, 540–566, and 890–998 m, whereas a downward flow occurred at 586–646 m. Similarly, in BH-2, upward flows occurred at four depths, at 618–652, 736–757, 1178–1189, and 1287–1356 m, whereas a downward flow occurred at 580–610 and 955–976 m. In BH-3, an upward flow occurred at 138–381 m, with a linear temperature change. In BH-4, an upward flow occurred at 567–600 m, whereas downward flows occurred at 303–350, 394–480, and 873–967 m.
In conclusion, the upward and downward flows were identified by solving the 1D steady-state heat transfer equation, in combination with the lithological log and geophysical logs. However, owing to the loss of the core recovery, slight discrepancies were observed between the geophysical logs and lithology log. The groundwater flow occurred mostly along the fault and fracture zones in the rhyolite, basic dyke, and sandstone/mudstone. In addition, by using the lithological log and geophysical logs, several aquifer zones and hydraulically active fractures intersecting the deep boreholes were identified.
Upward or downward flows based on the 1D steady-state heat transfer model can be imprecisely identified, owing to the deviations in the centering of the loggers in the boreholes. There also exists uncertainty regarding groundwater flow along depth, since more complex groundwater flow patterns can be detected through detailed investigations of fractures and faults, and these could not be considered in the deep boreholes. Despite the uncertainty, analyses combining geophysical logs and a lithological log, as well as a 1D steady-state heat transfer model, can contribute in understanding the deep fractures/fault distributions/thermal and flow characteristics of boreholes in relation to hydrogeological activities, through the analysis of the deep fractures/faults and geothermal potential around the study area.
Author Contributions
Conceptualization, W.-R.L. and S.-Y.H.; methodology, S.-Y.H. and W.-R.L.; validation, W.-R.L., S.-Y.H., C.L., S.H., I.-H.P., and H.-C.K.; investigation, W.-R.L., C.L., S.H., I.-H.P., and H.-C.K.; data curation, W.-R.L., C.L., S.H., I.-H.P., and H.-C.K.; writing—original draft preparation, W.-R.L. and S.-Y.H.; writing—review and editing, S.-Y.H., W.-R.L., C.L., S.H., I.-H.P., and H.-C.K.; visualization, W.-R.L.; supervision, S.-Y.H.; project administration, S.-Y.H.; and funding acquisition, S.-Y.H. and C.L. All authors have read and agreed to the published version of the manuscript.
Funding
This research was funded by grants from the Principal Research Fund of the Korea Institute of Geoscience and Mineral Resources (KIGAM), grant number 16-3411, and Basic Science Research Program through the National Research Foundation of Korea (NRF) funded by the Ministry of Science and ICT, grant number NRF-2020R1A2B5B02002198.
Acknowledgments
We would like to express our appreciation toward KIGAM for providing us with the deep groundwater data.
Conflicts of Interest
The authors declare no conflict of interest.
Appendix A
Table A1.
Lithology of the boreholes.
Table A1.
Lithology of the boreholes.
| Borehole | Depth (m) | Lithology |
|---|
| BH-1 | –359.1 | Semi-consolidated mudstone (sandstone intercalated) |
| 359.1–402.3 | Dacite |
| 402.3–418.4 | Tuffaceous sediment |
| 418.4–457.1 | Lapilli tuff |
| 457.1–461.2 | Tuffaceous sediment |
| 461.2–469.7 | Tuff |
| 469.7–472.1 | Tuffaceous sediment |
| 472.1–538.9 | Sandstone/mudstone intercalated |
| 538.9–738.4 | Rhyolite |
| 738.5–739.8 | Basic dyke |
| 739.8–821.3 | Rhyolite |
| 821.3–828.5 | Basic dyke |
| 828.5–831.8 | Rhyolite |
| 831.8–865.2 | Basic dyke |
| 865.1–875.1 | Rhyolite |
| 875.1–1091.4 | Sandstone/mudstone alternation (conglomerate & black shale intercalated) |
| BH-2 | –357.7 | Semi-consolidated mudstone (sandstone intercalated) |
| 356.7–423.7 | Lapillli tuff |
| 423.7–426.4 | Tuffaceous sediment |
| 426.4–450.6 | Tuff |
| 450.6–461.8 | Tuffaceous sediment |
| 461.8–521.6 | Sandstone/mudstone (Tuffaceous sediment intercalated) |
| 521.6–701.1 | Rhyolite |
| 701.1–708.0 | Basic dyke |
| 708.0–744.5 | Rhyolite |
| 744.5–775.7 | Basic dyke |
| 775.7–827.9 | Rhyolite |
| 827.9–830.6 | Basic dyke |
| 830.6–876.4 | Rhyolite |
| 876.4–1501.3 | Sandstone/mudstone alternation (conglomerate & black shale intercalated) |
| BH-3 | –200.6 | Semi-consolidated mudstone (sandstone intercalated) |
| 206.1–257.0 | Crystal tuff |
| 257.0–273.2 | Tuffaceous sediment |
| 273.4–292.6 | Basic dyke |
| 292.6–376.1 | Crystal tuff |
| 376.1–409.3 | Basic dyke |
| 409.3–428.3 | Crystal tuff |
| 428.3–474.7 | Basic dyke |
| 474.7–524.1 | Lapilli tuff |
| 524.1–628.7 | Sandstone/mudstone (tuffaceous sediment intercalated) |
| 632.1–770.4 | Rhyolite |
| 770.4–774.3 | Basic dyke |
| 774.3–901.1 | Rhyolite |
| 901.1 | Sandstone/mudstone (conglomerate & black shale intercalated) |
| BH-4 | –217.4 | Semi-consolidated mudstone (sandstone intercalated) |
| 217.4–252.7 | Crystal tuff |
| 252.7–258.0 | Basic dyke |
| 258.0–265.7 | Crystal tuff |
| 265.7–270.3 | Basic dyke |
| 270.3–359.5 | Crystal tuff |
| 359.5–368.6 | Basic dyke |
| 368.6–443.3 | Crystal tuff |
| 443.3–480.1 | Sandstone |
| 480.1–547.7 | Lapilli tuff |
| 547.7–1361.0 | Sandstone/mudstone |
| 1361.0–1996.0 | Andesic breccia |
Table A2.
Depths and dips of the fractures/faults at the boreholes.
Table A2.
Depths and dips of the fractures/faults at the boreholes.
| Borehole | Depth of Fractures/Faults (m) | Dips |
|---|
| BH-1 | 70, 214–215, 259–265, 335.6–337, 342.3–342.6, 359.1–368, 372–374, 375–375.3, 378.4–378.9, 380.5–397.9, 399.8–400.4, 400.7–401.8, 410.3–410.7, 414.4–411.8, 417.5–417.6, 418.3–418.4, 427.7–428.7, 438.7–438.8, 441.3–442.3, 448.7–449.6, 451.7–452.2, 453.5–455, 458.4–461.6, 468–470.2, 491.9–492.3, 493.9–498.2, 511–514.8, 517–521.8, 523.8–569.5, 572.6–572.9, 619.4–620.0, 839.7–839.9, 844.8, 845, 846.3–847.8, 877.2–879.3, 892.2–894.2, 900.3, 909, 934.8–936.5, 977.2–979.2, 1058.8–1059.2 | 5°, 15°, 20°, 35°, 60–85° |
| BH-2 | 352–425, 425–430, 430–460, 460–470, 470–505, 505–525, 525–704, 705–745, 780–830, 835–900, 1155–1165, 1240, 1310 | 5°, 15°, 20°, 35°, 60–85° |
| BH-3 | 200, 205.5, 400–403 | 5°, 70°, 80–85° |
| BH-4 | 281.9–282, 402–402.1, 501–502, 1000–1127, 1284, 1135.9–1136, 1756.1, 1758.3–1758.5, 1758.9–1759 | 60°, 75°, 80°, 85° |
Table A3.
Installation of casing and screens at the boreholes.
Table A3.
Installation of casing and screens at the boreholes.
| Borehole | Depth (m) | Casing (mm) | Depth of Screening (m) |
|---|
| BH-1 | 58 | 152.4 | 472–964 |
| 360 | 101.6 |
| 608 | 88.9 |
| 964 | 50.8 |
| 1100 | open hole |
| BH-2 | 28 | 304.8 | 1278–1500 |
| 148 | 254 |
| 420 | 203.2 |
| 970 | 165.1 |
| 1278 | 127 |
| 1500 | 8.38 |
| BH-3 | 10 | 355.6 | - |
| 400 | 604.8 |
| BH-4 | 15 | 406.4 | 1005–1485 |
| 217.5 | 355.6 |
| 371 | 304.8 |
| 1000 | 254 |
References
- Turcotte, D.L.; Schubert, G. Geodynamics Application of Continuum Physics to Geological Problems; John Wiley and Sons: New York, NY, USA, 1982. [Google Scholar]
- Kim, H.C.; Song, M.Y. A study on the effective utilization of temperature logging data for calculating thermal gradient. Econ. Environ. Geol. 1999, 32, 503–517. [Google Scholar]
- Lee, C.W.; Moon, S.H. The analysis of thermal gradient at Icheon hot spa area. J. Eng. Geol. 2008, 18, 185–190. [Google Scholar]
- Lim, J.U. Geothermal potential in the Republic of Korea. In Terrestrial H.E.A.T. Flow and Geothermal Energy in Asia; Oxford & IBH Publishing Co. Pvt. Ltd: New Delhi, Delhi, India, 1995; pp. 435–467. [Google Scholar]
- Kim, H.C.; Lee, Y. Heat flow in the Republic of Korea. J. Geophys. Res. 2007, 112, B5. [Google Scholar] [CrossRef]
- Sohn, Y.K.; Son, M. Synrift stratigraphic geometry in a transfer zone coarse-grained delta complex, Miocene Pohang Basin, SE Korea. Sedimentology 2004, 51, 1387–1408. [Google Scholar] [CrossRef]
- Son, M.; Song, C.W.; Kim, M.C.; Cheon, Y.; Jung, S.H.; Cho, H.; Kim, H.G.; Kim, J.S.; Sohn, Y.K. Miocene crustal deformation, basin development, and tectonic implication in the southeastern Korean Peninsula. J. Geol. Soc. Korea 2013, 49, 93–118. [Google Scholar]
- Song, C.W.; Son, M.; Sohn, Y.K.; Han, R.; Shinn, Y.J.; Kim, J.-C. A study on potential geologic facility sites for carbon dioxide storage in the Miocene Pohang Basin, SE Korea. J. Geol. Soc. Korea 2015, 51, 53–66. [Google Scholar] [CrossRef]
- Song, Y.H. Development of Deep, Low-Enthalpy Geothermal Energy Technical Report OAA2003001-2006 4; Korea Institute of Geoscience and Mineral Resources (KIGAM): Daejeon, Korea, 2006. [Google Scholar]
- Lee, C.; Kim, T.K.; Park, D.W. Geology and geochemistry of volcanic and sedimentary rocks from deep borehole in the Heunghae area, North Kyungsang province. KSEG 2009, 19, 459–474. [Google Scholar]
- Bredehoeft, J.D.; Papaopulos, I.S. Rates of vertical groundwater movement estimated from the Earth’s thermal profile. Water Resour. Res. 1965, 1, 325–328. [Google Scholar] [CrossRef]
- Ferguson, S.; Woodbury, A.D.; Matile, G.L. Estimating deep recharge rates beneath an interlobate moraine using temperature logs. Groundwater 2003, 41, 640–646. [Google Scholar] [CrossRef]
- Taniguchi, M.; Turner, J.V.; Smith, A.J. Evaluations of groundwater discharge rates from subsurface temperature in Cockburn sound, Western Australia. Biogeochemistry 2003, 66, 111–124. [Google Scholar] [CrossRef]
- Le Borgne, T.; Bour, O.; Riley, M.S.; Gouze, P.; Pezard, P.A.; Belghoul, A.; Lods, G.; Le Provost, R.; Gresswell, R.B.; Ellis, P.A.; et al. Comparison of alternative methodologies for identifying and characterizing preferential flow paths in heterogeneous aquifers. J. Hydrol. 2007, 345, 134–148. [Google Scholar] [CrossRef]
- Kurylyk, B.L.; Irvine, D.J.; Carey, S.K.; Briggs, M.A.; Werkema, D.D.; Bonham, M. Heat as a groundwater tracer in shallow and deep heterogeneous media: Analytical solution, spreadsheet tool, and field applications. Hydrol. Process 2017, 31, 2648–2661. [Google Scholar] [CrossRef]
- Davison, C.C. Use of Borehole-Geophysical Logs and Hydrologic Tests to Characterize Crystalline Rock for Nuclear-Waste Storage, Whiteshell Nuclear Research Establishment, Manitoba, and Chalk River Nuclear Laboratory, on, Canada: Technical Report; Office of Nuclear Waste Isolation, Battelle Project Management Division: Columbus, OH, USA, 1983; Volume 418, p. 103.
- Keys, W.S.; Sullivan, J.K. Role of borehole geophysics in defining the physical characteristics of the Raft River geothermal reservoir, Idaho. Geophysics 1979, 44, 1116–1141. [Google Scholar] [CrossRef]
- Lee, D.S. Chemical composition of petrographic assemblages of igneous and relate rocks in South Korea. Econ. Environ. Geol. 1977, 10, 75–92. [Google Scholar]
- Lee, T.J.; Song, Y.; Uchida, T. Three-dimensional magnetotelluric surveys for geothermal development in Pohang, Korea. Explor. Geophys. 2007, 38, 89–97. [Google Scholar] [CrossRef]
- Shibata, K.; Uchiumi, S.; Nakagawa, T. K-Ar age result 1. Bull. Geol. Surv. Jpn. 1979, 30, 675–686. [Google Scholar]
- Um, S.H.; Lee, D.W.; Bak, B.S. Explanatory Text of the Geological Map of Pohang Sheet; Geological Survey of Korea: Seoul, Korea, 1964; p. 17.
- Hwang, I.G. Fan-Delta Systems in the Pohang Basin (Miocene), SE Korea. Ph.D. Thesis, Seoul Nat’l University, Seoul, Korea, 1993; p. 973. [Google Scholar]
- Sohn, Y.K.; Rhee, C.W.; Shon, H. Revised stratigraphy and reinterpretation of the Miocene Pohang basinfills, SE Korea: Sequence development in response to tectonic and eustassy in a back-arc basin margin. Sediment. Geol. 2001, 143, 265–285. [Google Scholar] [CrossRef]
- Hwang, S.; Park, I.W.; Song, Y. Interpretation of geophysical well logs from deep geothermal borehole in Pohang. J. Korean Geophys. Soc. 2007, 10, 332–344. [Google Scholar]
- Van Orstrand, C.E. Temperature gradients. In Problems of Petroleum Geology; American Association of Petroleum Geologists: Tulsa, OK, USA, 1934; pp. 989–1021. [Google Scholar]
- Stallman, R.W. Steady one-dimensional fluid flow in a semi-infinite porous medium with sinusoidal surface temperature. J. Geophys. 1965, 70, 2821–2827. [Google Scholar] [CrossRef]
- Ge, S. Estimation of groundwater velocity in localized fracture zones from well temperature profiles. J. Volcanol. Geotherm. Res. 1998, 84, 93–101. [Google Scholar] [CrossRef]
- Herrin, J.M.; Deming, D. Thermal conductivity of US coals. J. Geophys. Res. 1996, 101, 25381–25386. [Google Scholar] [CrossRef]
- Parker, W.J.; Jenkins, R.J.; Butler, C.P.; Abbott, G.L. Flash method of determining thermal diffusivity, heat capacity, and thermal conductivity. J. Appl. Phys. 1961, 32, 1679–1684. [Google Scholar] [CrossRef]
- Woodside, W.M.J.H.; Messmer, J.H. Thermal conductivity of porous media. I. Unconsolidated sands. J. Appl. Phys. 1961, 32, 1688–1699. [Google Scholar] [CrossRef]
- Yalcin, H.T.; Dumlu, O. The estimation of vertical velocity of thermal water by use of temperature profile. In Proceedings of the 20th New Zealand Geothermal Workshop, Auckland, New Zealand, 11–13 November 1998; pp. 393–395. [Google Scholar]
- Prensky, S. Temperature measurements in boreholes-an overview of engineering and scientific applications. Log Anal. 1992, 33, 313–333. [Google Scholar]
- Pehme, P.E.; Parker, B.L.; Cherry, J.A.; Greenhouse, J.P. Improved resolution of ambient flow through fractured rock with temperature logs. Groundwater 2010, 48, 191–205. [Google Scholar] [CrossRef] [PubMed]
- Maldaner, C.H.; Munn, J.D.; Coleman, T.I.; Molson, J.W.; Parker, B.L. Groundwater flow quantification in fractured rock boreholes using active distributed temperature sensing under natural gradient conditions. Water Resour. Res. 2019, 55, 3285–3306. [Google Scholar] [CrossRef]
- Beck, A.E.; Balling, N. Determination of Virgin Rock Temperatures Handbook of Terrestrial Heat-Flow Density Determination; Springer: Dordrecht, The Netherlands, 1988; pp. 59–85. [Google Scholar]
- Paillet, F.L. Using borehole flow logging to optimize hydraulic-test procedures in heterogeneous fractured aquifers. Hydrogeol. J. 1995, 3, 4–20. [Google Scholar] [CrossRef]
- Özkaya, S.I. Fracture modeling from borehole image logs and water invasion in carbonate reservoirs with layer-bound fractures and fracture corridors. J. Pet. Sci. Eng. 2019, 179, 199–209. [Google Scholar] [CrossRef]
- Bodvarsson, G.S.; Bjornsson, S.; Gunnarsson, A.; Gunnlaugsson, E.; Sigurdsson, O.; Stefansson, V.; Steingrimsson, B. The Nesjavellir geothermal field, Iceland; 1. Field characteristics and development of a three-dimensional numerical model. Jnl. Geothermal Sci. and Techn. 1990, 2, 189–228. [Google Scholar]
- Mostaghel, B. Processing and Interpretation of Geophysical Well Logs from Well KJ-32, Krafla Geothermal Field; United Nations University Press: Tokyo, Japan, 1999; pp. 193–220. [Google Scholar]
- Patten, E.P.; Bennett, G.D. Application of Electrical and Radioactive Well Logging to Ground-Water Hydrology; US Government Printing Office: Washington, DC, USA, 1963; Volume 19, p. 60.
- Medici, G.; West, L.J.; Banwart, S.A. Groundwater flow velocities in a fractured carbonate aquifer-type: Implications for contaminant transport. J. Contam. Hydrol. 2019, 222, 1–16. [Google Scholar] [CrossRef]
- Tarvainen, A.M. Identification of Water-Bearing Structures in the Outokumpu Deep Drill Hole by Geophysical Well Logging. Master’s Thesis, Helsinki University of Technology, Espoo, Finland, 2006; p. 93. [Google Scholar]
- Shedlovsky, T.; Shedlovsky, L. Conductometry. In Physical Methods of Chemistry, Part IIA, Electrochemical Methods; Weissberger, A., Rossiter, B.W., Eds.; Wiley Interscience: New York, NY, USA, 1971; pp. 164–171. [Google Scholar]
- Hale, F.V.; Tsang, C.-F. A Code to Compute Borehole Fluid Conductivity Profiles with Multiple Feed Points No. LBL-24928; Lawrence Berkeley Laboratory: Berkeley, CA, USA, 1988.
- Ahonen, L.; Kietäväinen, R.; Kortelainen, N.; Kukkonen, I.T.; Pullinen, A.; Toppi, T.; Bomberg, M.; Itävaara, M.; Nousiainen, A.; Nyyssönen, M.; et al. Hydrogeological characteristics of the Outokumpu deep drill hole. Geol. Surv. Finl. Spec. Pap. 2011, 51, 151–168. [Google Scholar]
- De Keyser, T.; Saeid, E.; Kendall, C.G.S.C.; Kellogg, J. Normalized and color-filled logarithmic gamma-ray logs to enhance subsurface stratigraphic interpretation of carbonates and siliciclastics. Interpretation 2020, 8, B1–B11. [Google Scholar] [CrossRef]
- Fukai, I.; Keister, L.; Ganesh, P.R.; Cumming, L.; Fortin, W.; Gupta, N. Carbon dioxide storage resource assessment of Cretaceous-and Jurassic-age sandstones in the Atlantic offshore region of the northeastern United States. Environ. Geosci. 2020, 27, 25–47. [Google Scholar] [CrossRef]
- Pandey, A.K.; Chatterjee, R.; Choudhury, B. Application of neural network modelling for classifying hydrocarbon bearing zone, water bearing zone and shale with estimation of petrophysical parameters in Cauvery basin, India. J. Earth Syst. Sci. 2020, 129, 33. [Google Scholar] [CrossRef]
- Chapman, D.S.; Chisholm, T.J.; Harris, R.N. Combining borehole temperature and meteorologic data to constrain past climate change. Glob. Planet Change 1992, 6, 269–281. [Google Scholar] [CrossRef]
- Deming, D.; Borel, R.A. Evidence for climatic warming in northcentral Oklahoma from analysis of borehole temperatures. J. Geophys. Res. 1995, 100, 22017–22032. [Google Scholar] [CrossRef]
- Beltrami, H.; Ferguson, G.; Harris, R.N. Long-term tracking of climate change by underground temperatures. Geophys. Res. Lett. 2005, 32, 1029. [Google Scholar] [CrossRef]
- Kim, H.C. Development of Technology of CO2 Geological Storage and Securing Green Energy Resources in Deep Geo-Environment (Part III); Korea Institute of Geoscience and Mineral Resources (KIGAM): Daejeon, Korea, 2014. [Google Scholar]
- Zoth, G.; Haenel, R. Thermal Conductivity, Handbook of Terrestrial Heat-Flow Density Determination with Guideline and Recommendations of the International Heat Flow Commission; KLUWER Academic Pub: Dordrecht, The Netherlands, 1988; pp. 449–466. [Google Scholar]
- Robertson, E.C. The Thermal Properties of Rocks; USGS Open-File Report 88-441; U.S. Geological Survey: Reston, VA, USA, 1988; p. 106.
- Park, J.M.; Kim, H.C.; Lee, Y.M.; Shim, B.O.; Song, M.Y. Thermal properties of rocks in the Republic of Korea. Econ. Environ. Geol. 2009, 42, 591–598. [Google Scholar]
- Williams, C.F. The Thermal Regime of Santa Maria Province, California; No. 1995; US Government Printing Office: Washington, DC, USA, 1994; p. 36.
- Klepikova, M.V.; Le Borgne, T.; Bour, O.; Davy, P. A methodology for using borehole temperature-depth profiles under ambient, single and cross-borehole pumping conditions to estimate fracture hydraulic properties. J. Hydrol. 2011, 407, 145–152. [Google Scholar] [CrossRef]
- Keys, W.S. Borehole Geophysics Applied to Ground-Water Investigations: US Geological Survey Techniques of Water-Resources Investigations; US Government Printing Office: Washington, DC, USA, 1990; p. 150.
- Nelson, J.W. Geologic Disturbances in Illinois Coal Seams; Illinois State Geological Survey: Champaign, IL, USA, 1983; Circular 530; p. 47. [Google Scholar]
- Paillet, F.L. Use of geophysical well-logs in evaluating crystalline rocks for siting of radioactive waste repositories. Log Anal. 1991, 32, 85. [Google Scholar]
- Paillet, F.L. Using borehole geophysics and cross-borehole flow testing to define hydraulic connections between fracture zones in bedrock aquifers. J. Appl. Geophys. 1993, 30, 261–279. [Google Scholar] [CrossRef]
- Katsube, T.J.; Hume, J.P. Permeability determination in crystalline rocks by standard geophysical logs. Geophysics 1987, 52, 342–352. [Google Scholar] [CrossRef]
© 2020 by the authors. Licensee MDPI, Basel, Switzerland. This article is an open access article distributed under the terms and conditions of the Creative Commons Attribution (CC BY) license (http://creativecommons.org/licenses/by/4.0/).


 ,
, 


