1. Introduction
Materials weathering behavior and prevention have become one important field in automobile performance research. To systematically study the weathering performance and thermal stability of engineering materials, many weathering test standards have been established according to indoor and outdoor conditions, mainly including atmospheric exposure standard [
1], exposure standard under glass [
2], black-box exposure standard [
3] and artificial accelerated weathering standards under fluorescent ultraviolet lamp [
4] and xenon lamp [
5]. Hereby, scientific researchers have designed many test methods to characterize and discuss the material weathering behavior in detail from multiple perspectives of appearance, mechanical and electrical properties. The yellowing index and color difference of various engineering plastics have been investigated [
6,
7,
8]. The experimental results indicate that the weathering of PC and poly(butylene terephthalate) increased linearly with the enhancement of irradiance, while the degradations of both SAN and ABS presented tendencies to grow non-linearly. The materials also tend to become hard and brittle in the weathering process, which deteriorates the mechanical properties [
9,
10,
11]. The tensile strength, bending strength and breaking elongation of polyamide 6 (PA6) exposed to nature were characterized in detail [
12]. The long-term results prove that the retention rate of mechanical properties decreased significantly with seasonal fluctuations. In terms of electrical performance, weathering induces the decrease in insulation efficiency of epoxy resin, which increases electrical energy loss in automotive instrumentation [
13]. The dielectric properties of polypropylene film and polyimide nanocomposite film before and after weathering were evaluated by surface discharge method [
14,
15]. The results reveal that the residual breakdown strength decreased significantly after weathering, while the partial discharge resistance and breakdown strength of the composite film could be improved by adding nano-fillers.
Weathering is a very complex physicochemical reaction process, which is essentially the breaking and branching of macromolecular chains, as well as the formation of carbonyl groups, hydrogen peroxide groups and low molecular weight substances [
16,
17,
18]. For the sake of further investigating and verifying the internal mechanism of material weathering behavior, researchers have established and developed a variety of detection techniques and experimental methods in recent years. The degradation products and their contents among six types of automotive coatings were quantitatively analyzed by infrared spectroscopy. The alterations of the position and intensity of the characteristic absorption peaks in the spectra suggested that the carbonyl group and hydrogen peroxide products increased gradually. The transformations of molecular structure and functional groups changed the absorption and reflection of the material to the spectrum, which led to the discoloration and cracking of the coating [
19]. The variation on microscopic morphology and molecular weight of HDPE samples were studied and compared by differential scanning calorimetry (DSC) and crystallization fractionation [
20]. The results indicate that molecular chain breakage and molecular weight reduction appeared in samples with exposure time. The above research results reveal the internal factors and mechanisms of material weathering from the perspective of microscopic variations and verify the impacts of alterations in molecular structure, morphology and composition on the weathering performances of materials.
The characterization of weathering behavior and the application of advanced non-destructive experimental methods have rapidly promoted the development of weathering-resistant material screening technology based on weathering internal factors. However, the research on the weathering mechanism and material screening technology in uniform thermal environment is still not sufficient to fully grasp and clearly regulate the inhomogeneous distribution characteristics of external factors of auto-parts weathering in non-uniform thermal environment, as well as the resulting non-equilibrium weathering problem. The weathering of parts results from the combined effects of internal and external factors, among which solar radiation and temperature are the main external factors [
21,
22]. The interior trim parts of the car are usually not directly affected by rainwater, and the fluctuation of humidity in the closed cabin is relatively small, thus water is a comparatively secondary external factor. There is the particular case of convertible sports automobiles which can be greatly affected by rainwater. The influence of radiation on the degradation of various plastics, such as the dashboard, was investigated. The experimental results conclude that the color difference and gloss loss rate of plastics increased significantly with the increment of cumulative radiation [
6,
23]. Jiří Tocháček et al. [
24,
25] verified that the weathering reaction rate of polypropylene and some other materials increased exponentially with temperature through experiments and weathering kinetics studies. Massive experiments and research results prove that the weathering processes of the materials conform to the Arrhenius formulas or the deformed Arrhenius formulas and increase exponentially with the intensity of weathering external factors [
6,
22,
26]. Thus, it can be seen that the non-uniform distribution of solar radiation and temperature can result in the problem of inconsistent weathering process among parts. Therefore, it is urgent to study the distribution characteristics of external factors of automobile weathering in non-uniform thermal environment.
IP/DP box (abbreviated from Instrument Panel/Door Panel) [
27] and several artificial weathering standards [
4,
5,
28] have been specially developed for the weathering research of auto-parts, among which SAEJ2412-2015 is the most important weathering standard for interior trim currently referenced to. SAEJ2412-2015 specifies the test method in detail and is able to simulate the extreme values of weathering external factors in the cabin. However, there is less attention paid to some important experimental design parameters, such as the discrepancy of weathering external factors among different parts, the temperature in dark reaction period and the duration of light and dark reaction. The natural weathering test results of the whole vehicle are closest to the actual application, which is propitious to present comprehensive test design parameters for various artificial weathering tests. However, there are still some serious deficiencies, such as long test cycle, high cost, poor repeatability and limited measuring points, which not only lengthen the development cycle of new car models, but also are not conducive to the rapid and in-depth analysis on the external factors distribution of automotive weathering, as well as the mechanism of disequilibrium weathering. To remedy these inadequacies, a numerical analysis method of all-weather weathering external factors based on automobile heat transfer model is proposed. The method can be used to quickly predict the laws of automotive physical parameters, orientations and locations, as well as their influences on the external factors’ distribution of automobile weathering at any time, in any area and in any direction. Furthermore, it can also be applied to the formulation of various artificial accelerated weathering test schemes, as well as the disequilibrium regulation on external factors distribution and auto-parts weathering.
2. Experimental Study on Non-Uniform External Factors Distribution and Weathering Inconsistency of Auto-Parts
The thermal environment inside and outside an automotive is very complicated. To study the relevance between weathering external factors distribution and auto-parts weathering discrepancies, as well as their mechanisms, the natural exposure test and weathering defect inconsistency test of the whole vehicle were carried out throughout the year.
2.1. Automotive Natural Exposure Test
The experiment was performed at the hygrothermal natural environment test station in Qionghai City, Hainan Province, China. The test site is located at 19°14′ N, 110°28′ E and 10 m above sea level. The perfect ground drainage facilities eliminate the interference of local climate formed by rainwater accumulation on the measurement of test environmental parameters. The test object was an independent brand car, which was parked on a wide and flat lawn and maintained distances of more than three times the vehicle height from other test vehicles. To keep most of the interior trim parts under heavy heat load, the front windshield of the car was oriented towards the equator, and the engine, doors and windows were all closed.
The natural environment parameters outside the car were monitored in real-time by a small weather station; the surface temperature of the parts and the microenvironment parameters inside the automobile were measured by the temperature and humidity sensors as well as the radiometers. Meanwhile, the test parameters were gathered by the PC-2WC data collector at a frequency of 5 min. The main test equipment and measurement parameters are shown in
Table 1. Twenty-five sensor measuring points were arranged on different types of auto-parts, as shown in
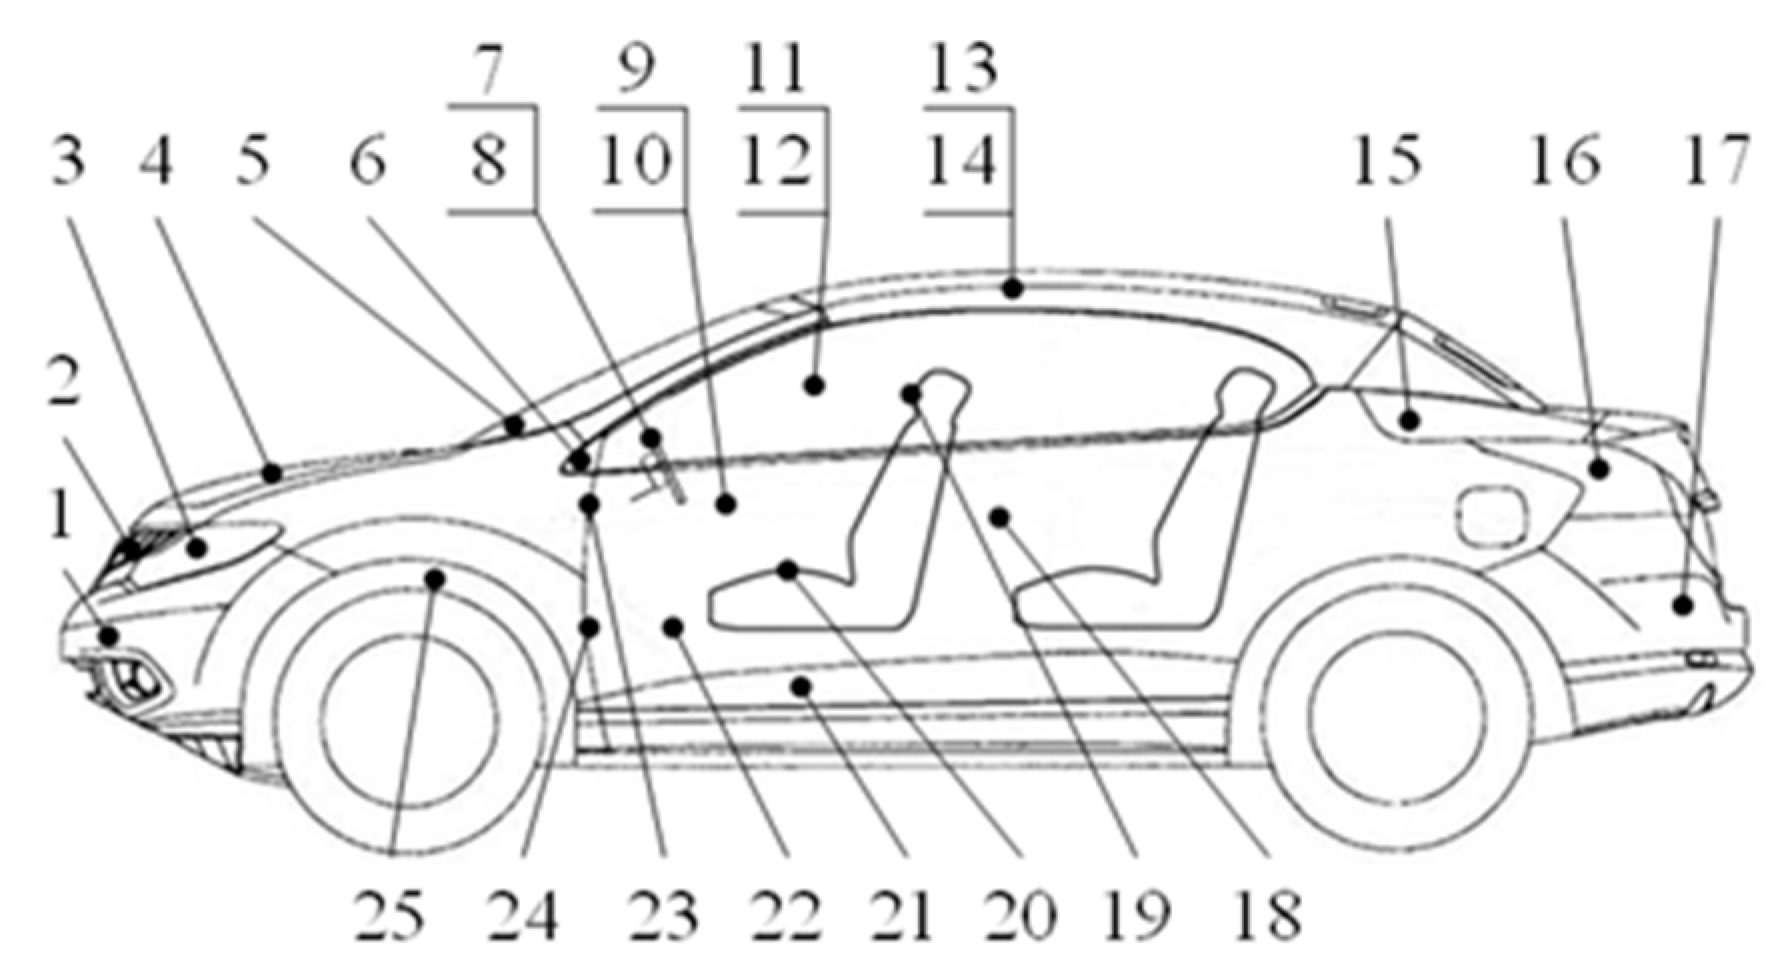
Figure 1, among which there were 10 temperature measuring points on the exterior surface of the car, including (numbers refer to
Figure 1): (1) front bumper; (2) radiator grille; (3) right headlights; (4) engine cover; (5) triangular plate of right rearview mirror support; (9) exterior door; (13) the center of exterior roof; (16) rear right lights; (17) rear bumper; and (25) right front wheel shield. There were 13 measuring points on the interior surface of the car: (6) dashboard; (7) steering wheel; (8) airbag cover; (10) interior door; (14) interior roof; (15) rear windowsill; (18) interior trim panel on B-pillar; (19) headrest; (20) seat; (21) carpet; (22) central console; (23) cigar lighter cover; and (24) lower dashboard decoration panel. The air temperature and humidity parameters in the micro-environment of the cabin were collected by measuring Points 11 and 12, respectively. Sensors on typical measuring points were installed as shown in
Figure 2.
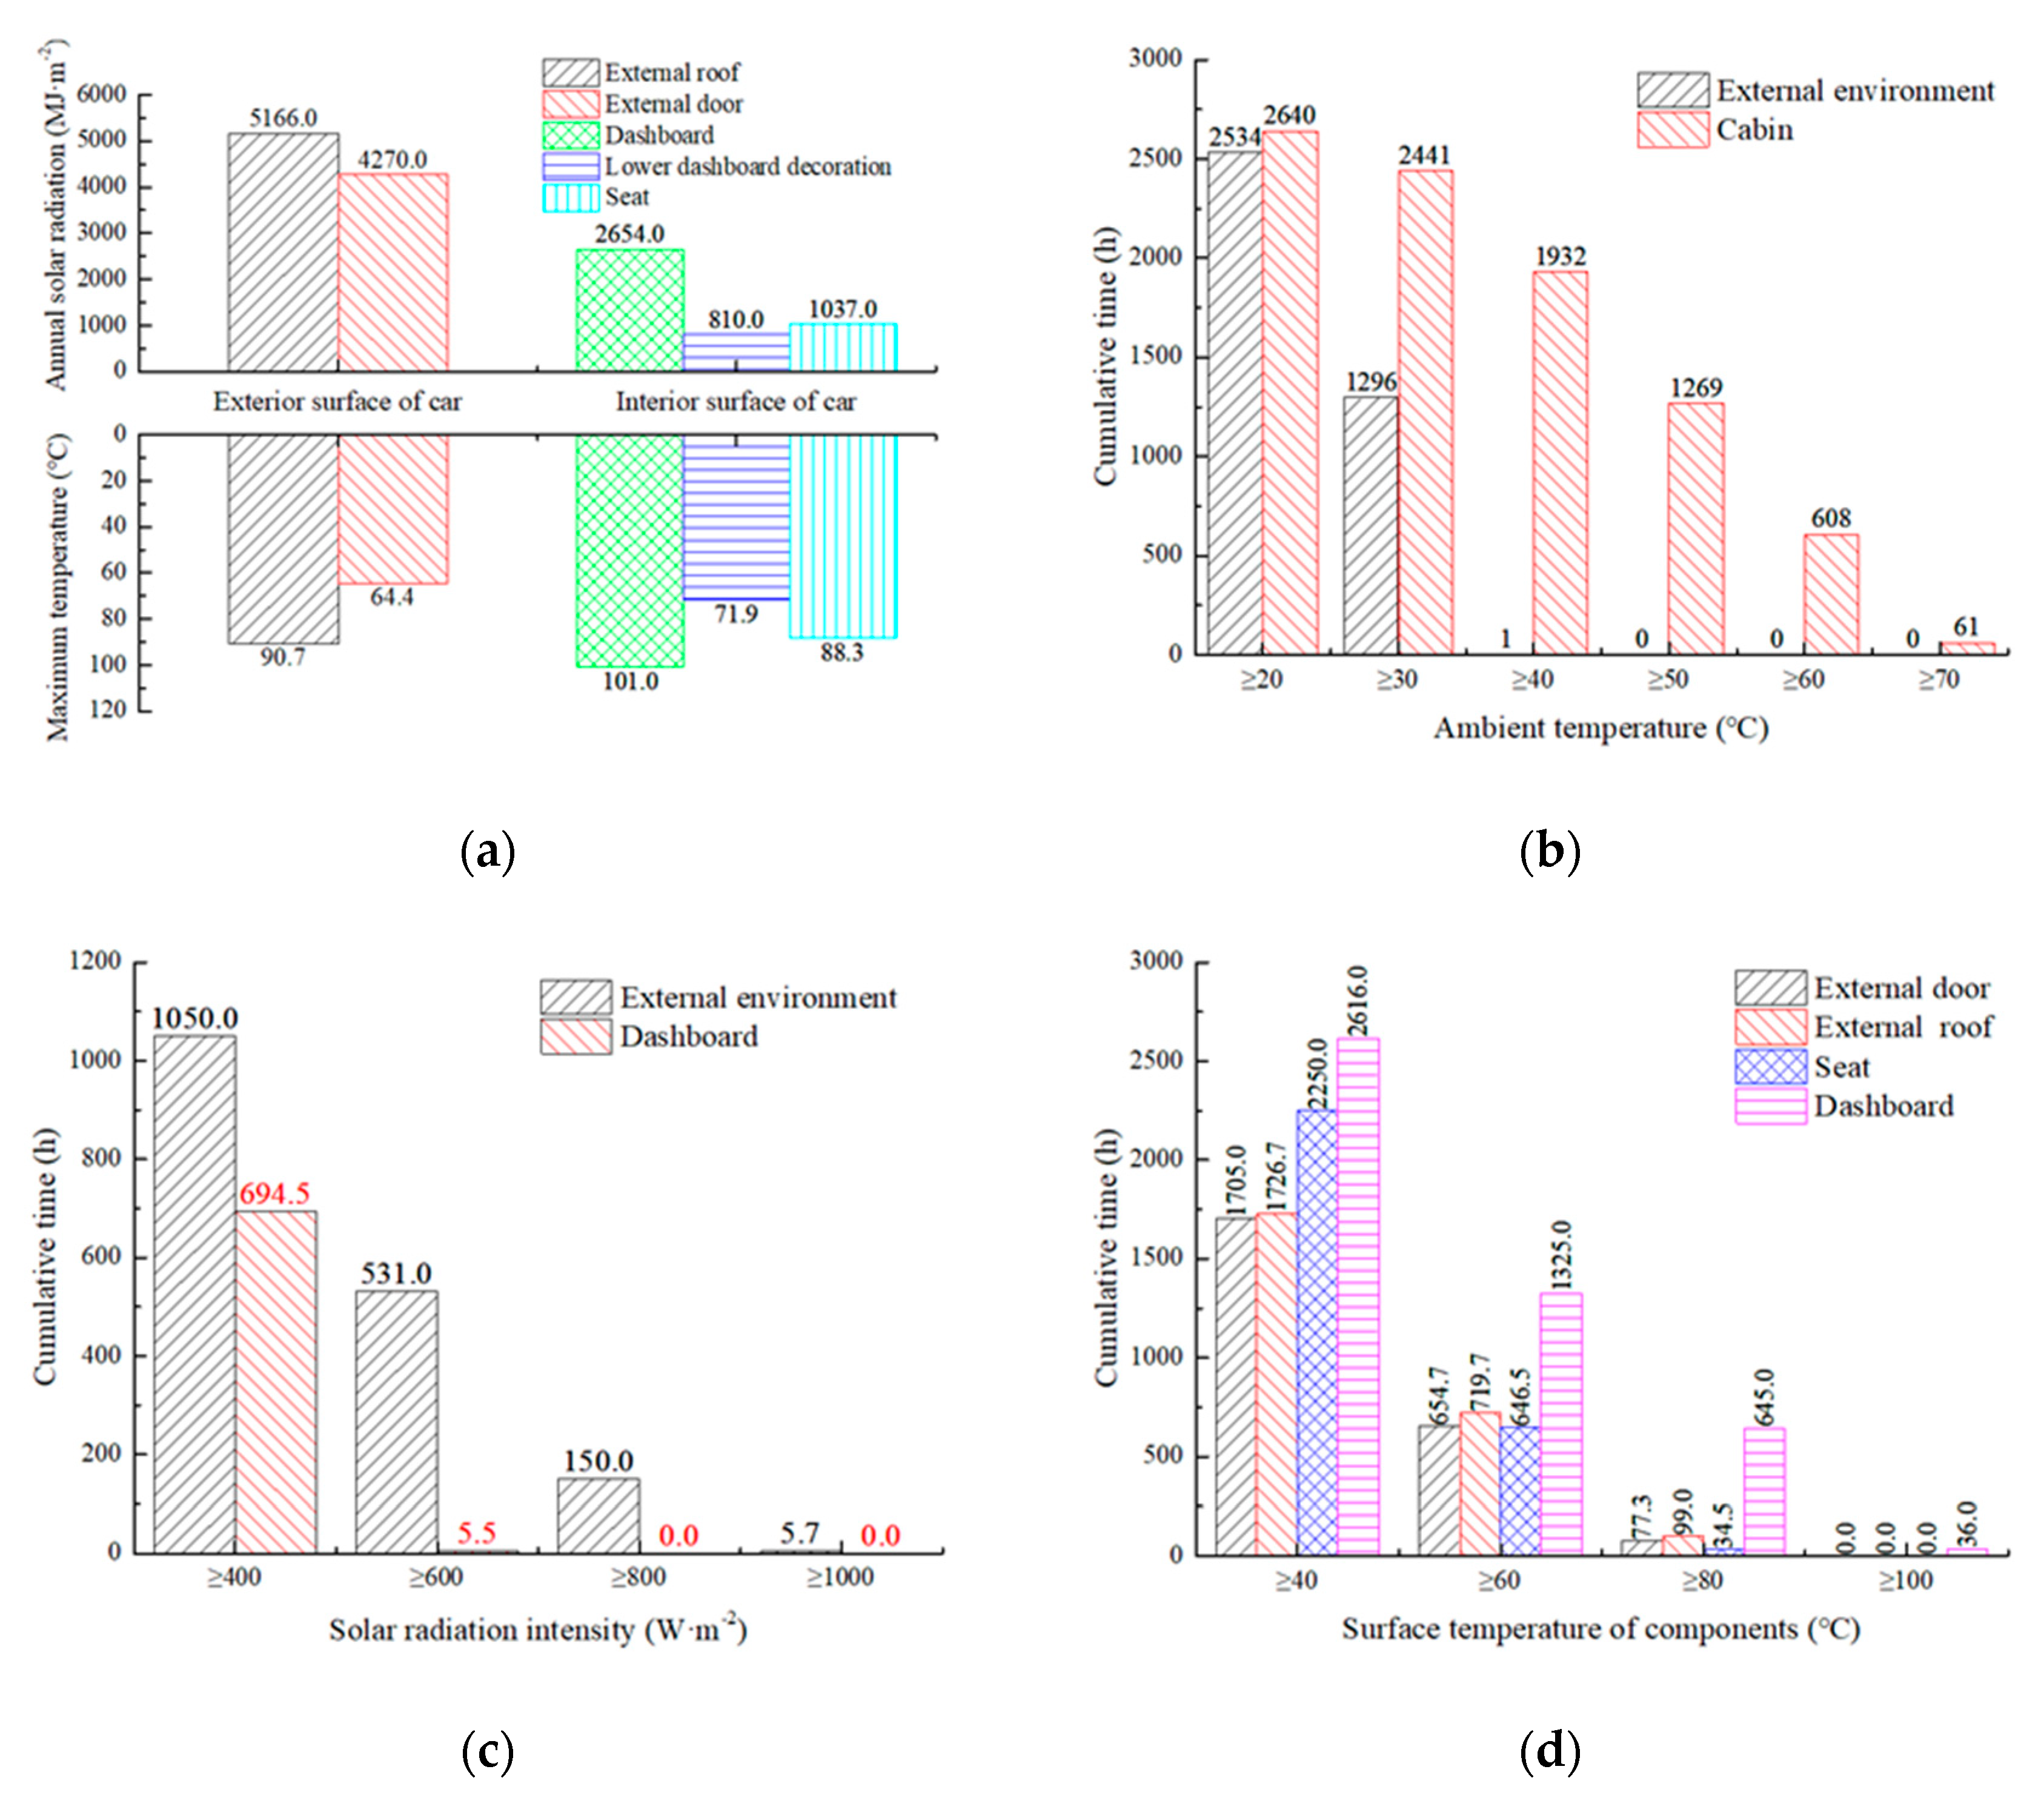
The weathering external factors and their cumulative values throughout the year vary greatly among different parts, as shown in
Figure 3. The daily maximum and annual solar radiation outside the car are 1155.0 W·m
−2 and 5166.0 MJ·m
−2, respectively, which are much higher than those of interior trim parts in the cabin. Due to the heat storage and greenhouse effect in the enclosed cabin, the air temperature in the cabin is obviously higher than that outside the car; therefore, the temperature and high temperature accumulation time of the dashboard are significantly higher than those of the exterior parts. In the cabin, the annual radiation, daily maximum temperature and high temperature accumulation time of the parts near the window are much higher than those of interior trim parts shielded by the car body.
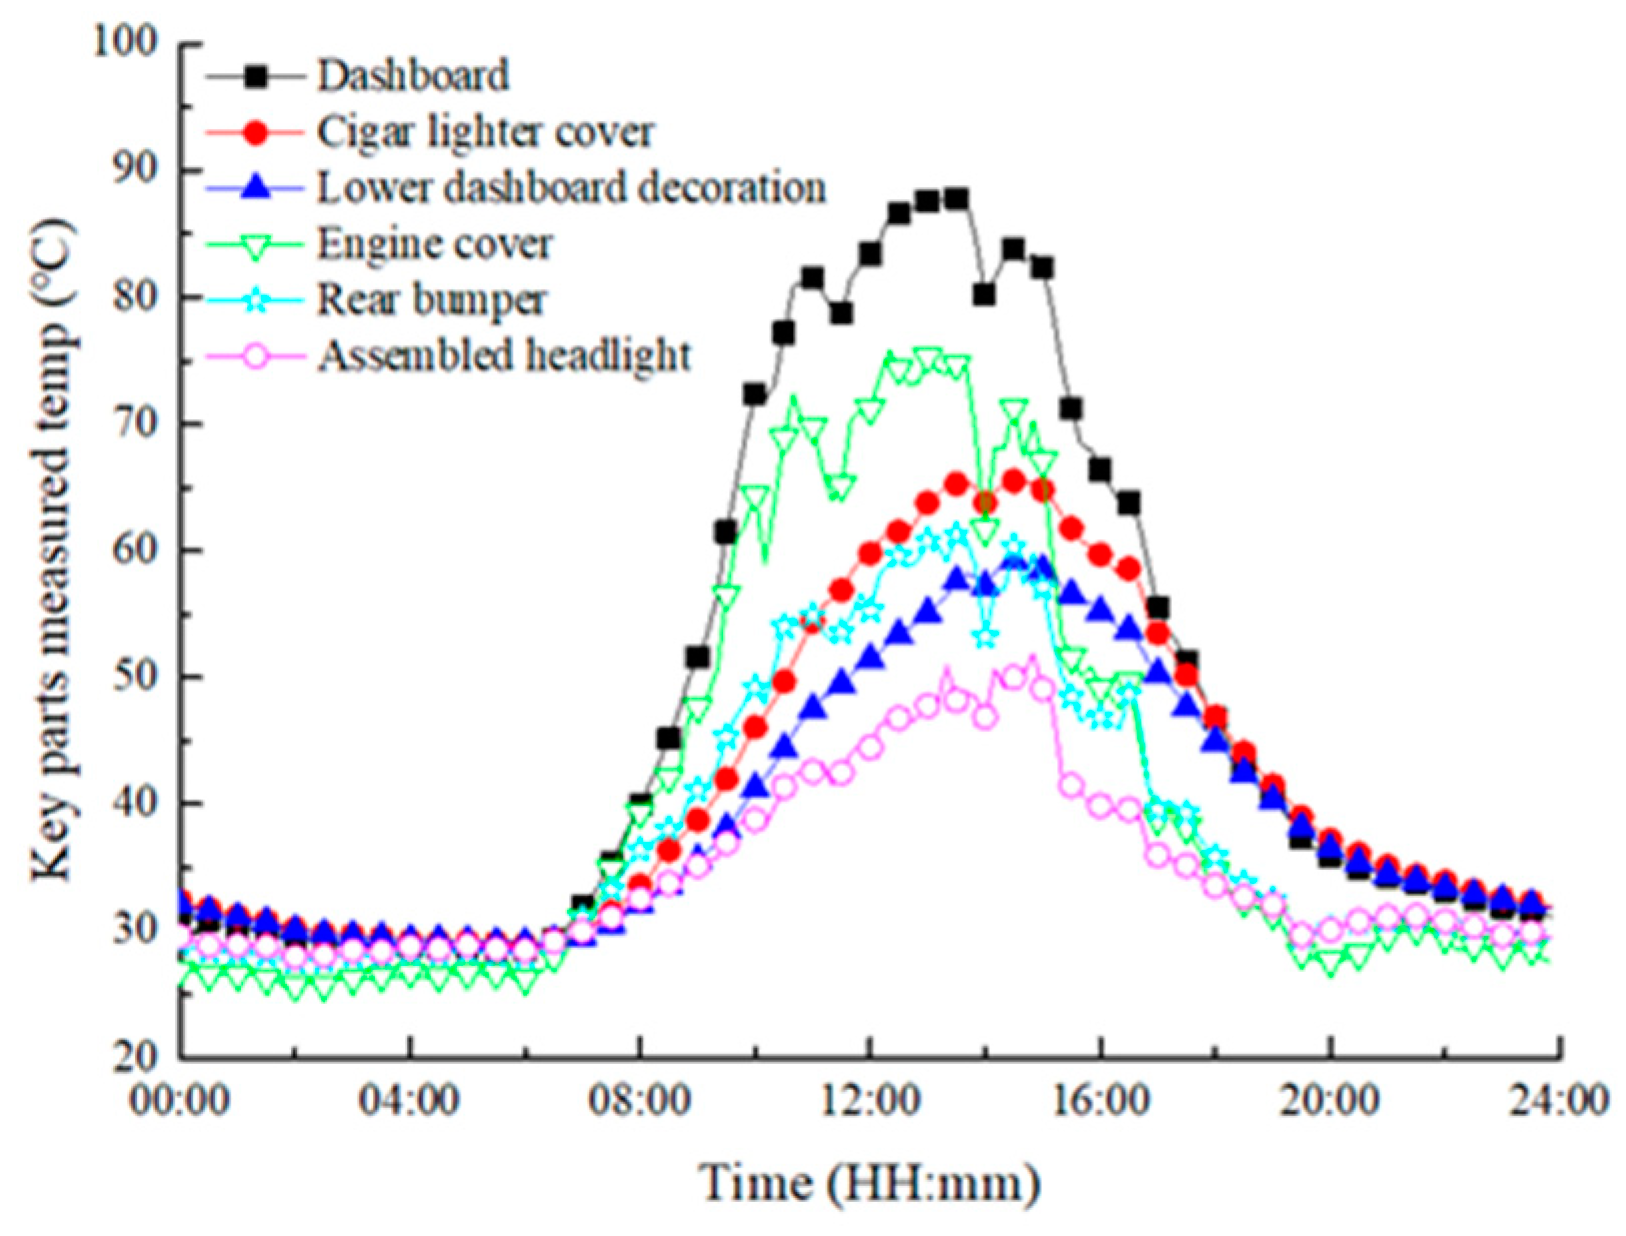
The test data of a typical sweltering summer day were selected from the whole year. As shown in
Table 2 and
Figure 4, the surface temperature of automobile presents a highly non-uniform distribution phenomenon. On the one hand, there are great differences in the surface temperature of different parts, among which the dashboard temperature is as high as 87.8 °C, while the maximum temperatures of the shielded cigar lighter cover and lower dashboard decoration are merely 65.6 and 59.3 °C, respectively. On the other hand, diurnal temperature differences of the parts are very remarkable, among which those of cigar lighter cover and lower dashboard decoration are just 36.6 and 30.2 °C, respectively, while that of dashboard is up to 59.3 °C.
2.2. Detection and Annual Statistical Analysis on Weathering Appearance Defect Inconsistency
To study the relevance between weathering external factors distribution and appearance defects in non-uniform thermal environment, the weathering appearance defects of the automobile were simultaneously detected and statistically analyzed during the natural exposure test. Before the test, the existing weathering defects of the testing car were detected and recorded firstly. According to the measurement standards and methods related to appearance defects of weathering [
29,
30,
31], the appearance inspection of up to 320 important parts was implemented every two months, while color difference measurement was also performed on 65 typical parts, including bumpers, doors, dashboards, seats, interior decoration of roof, etc. The number and distribution of newly added appearance defects were recorded in detail in each test of appearance inspection. During the study, the test car was cleaned regularly, and the weathering products on the surface of the car were ensured not to be removed in the cleaning process.
As the car was directly exposed to weathering external factors (mainly solar radiation and temperature), newly-added weathering appearance defects in the surface of car were gradually increasing, including chalking, seam separation, cracking, blistering, sticking and whitening. These defects not only damaged the appearance of the car, but might also bring potential safety hazards, such as the fading of the safety warning button, the cracking of the safety belt buckle, the crackle appearing in the lampshade, etc. As shown in
Table 3, the number of new defects in the test car reached up to 80 throughout the year, and the defects distribution in time and space was highly non-uniform. In term of time distribution, the weathering processes among auto-parts were obviously inconsistent. As early as in the second month, there were eight new defects on the interior and exterior trims of the car body, all of which appeared much earlier than the shielded parts in engine case and trunk. Moreover, there were 28 newly-added defects in the whole car in the sixth month, which accounted for more than one-third of the total in the whole year. In terms of spatial distribution, the numbers of new defects in the exterior and interior parts of the car body reached up to 45 and 31, respectively, while those of new defects in engine case and trunk were only 3 and 1, respectively. As far as the cabin is concerned, new defects were concentrated in the regions of high temperature and radiation, among which there were 7 new defects in the dashboard assembly throughout the year, accounting for nearly a quarter of the total number of defects in the cabin, mainly including sticking and whitening of the dashboard, cracking and yellowing of the trim panel on the defrosting outlet, whitening of the warning light switch, seam separation between the combined instrument and the dashboard and loosening of the dashboard trim. However, there were no newly-added defects in the sheltered parts such as the lower dashboard trim and the floor.
Comparing comprehensively the distributions of weathering external factors and newly-added defects in the above two tests, it can be seen that the interior trim parts near the window and exterior trim parts were exposed to intense radiation and high temperature, while there was no solar radiation in engine case and trunk, thus the new defects on the interior and exterior trim parts were formed much earlier, and their number was greater than those in engine case and trunk. In the cabin, the radiation and temperature of the interior trim parts near the window were significantly higher than those of the obscured interior trim parts, which is highly consistent with the defect test results that the number of new defects on the dashboard assembly was obviously more than that of defects on the obscured interior trim parts. Moreover, for dashboard assemblies, all 7 newly-added defects appeared in the middle and upper sites of the assembly near the window, while there was no new defect found in the lower sites of the assembly such as lower dashboard decoration panel. Therefore, from the perspective of weathering external factors, the non-uniform distribution of radiation and temperature is the main external factor of inconsistent and unbalanced weathering process. In subsequent studies, it is possible to regulate non-equilibrium weathering by reasonably adjusting the distribution of weathering external factors.
3. Numerical Calculation Method of Automobile Dynamic Heat Transfer Model
It is not sufficient to master the detailed distribution of the weathering external factors on the basis of the limited and discrete measuring points in the above tests. More importantly, the automobile development cycle is greatly lengthened due to the test time of up to one year. To quickly predict and analyze the distribution and variation law of weathering external factors on the car, especially the law of diurnal heat transfer, which is of important influence on automobile weathering during light and dark period, it is necessary to establish a numerical calculation method of weathering external factors based on automobile heat transfer model.
Automobile heat transfer is a complex composite heat transfer process. The car heat transfer model is discretized into a series of nodes by the node network method, and the mechanism of composite heat transfer among the nodes is thoroughly analyzed, so as to realize the calculation of the dynamic temperature and heat transfer variation law of the micro-geometric area represented by the nodes. As the test car is exposed to natural environment in test station, the dynamic composite heat transfer equation of nodal element
i can be expressed as
m,
c and
T represent the mass, specific heat capacity and surface temperature of the nodal element, respectively.
Qrad,i,
Qcond,i and
Qconv,i are radiation heat rate, conduction heat rate and convection heat rate, respectively, and the positive and negative values of these heat rates represent heat absorption and dissipation, respectively.
3.1. Dynamic Radiation Heat Transfer Inside and Outside the Car
The radiation on the exterior surface of the car mainly includes direct solar radiation, diffuse solar radiation, ground radiation, sky radiation and the radiation from the exterior car body to the external environment. Therefore, the net radiative heat rate of node element
i on the exterior surface
Qrad,i can be written as
A,
α and
ε represent the area, absorptivity and emissivity of the node element, respectively;
ID and
Id are the direct and scattered solar radiation intensity, respectively, which are measured and recorded by the experimental instrument in real time;
θ is the solar incident angle;
Eb is the blackbody radiation force,
Eb =
δT4;
σ represents the Stefan–Boltzmann constant, 5.67 × 10
−8 W·m
−2·K
−4; and
Tg and
Ts represent ground environmental temperature and sky effective temperature respectively, which is given by Swinbank as the Formula (3) [
32].
Tex is the air temperature at an altitude of about 1.5 m from the ground outside the vehicle, which was measured in real time by a small climate station.
Fg,i and
Fs,i represent the angular coefficients of the ground environment and the sky to node
i respectively, which can be calculated by Formulas (4) and (5) [
32,
33,
34].
ψ is the angle between the node element and the horizontal plane.
The window glass exhibits highly selective transmittances to the radiation of different wavelengths, in which the solar short-wave radiation can pass through the window glass and enters the cabin with a certain transmittance [
35]; however, the transmittance of the window glass to the long-wave radiation is very low [
36,
37,
38]. Therefore, it can be considered that the long-wave radiation in the cabin can′t pass through the window glass [
39,
40].
The incident solar radiation in the cabin mainly consists of direct solar radiation that reaches node element
i in the cabin through the window glass, diffuse solar radiation and solar radiation that falls on node element
i after being reflected by other element
j in the cabin. According to the interchangeability of the angle coefficients, the solar radiation heat rate absorbed by element
i in the cabin
Qs,i and the incident solar radiation intensity
Is,i on element
i can be, respectively, represented as
u represents the number of nodes on the interior trims;
τ and
ρ are the transmittance and reflectivity, respectively;
fij is the area projection factor of element
i on element
j [
41]; and
Fij is the angle coefficient of element
i to element
j.
There are phenomena of multiple reflection and absorption of long wave radiation emitted by the elements in the cabin, which enhances the calculation complexity of radiative heat transfer in the cabin. However, by means of calculating the surface effective radiation and net radiation, the complex radiant energy transfer process in cabin can be analyzed concisely and intuitively.
The effective radiation
Ji of node element
i can be denoted as
According to the principle of dynamic radiation balance on the surface of the diffuse-gray body, the net long-wave radiation heat rate obtained by element
i of the interior trims in the enclosed cabin
QL,i can be expressed as
By combining Equations (6) and (9), the net radiant heat rate of element
i in the cabin
Qrad,i can be obtained as follows
3.2. Conduction Heat Transfer
The conduction heat rate of element
i on the automotive internal surface
Qcond,i includes the transverse conduction heat exchange between the element
i and the connected elements
j on the internal surface and the longitudinal heat exchange between the element
i and the connected elements
n on the automotive external surface.
λ and
δ represent the thermal conductivity and thickness of the element, respectively.
A and
l are the contact area and centroid distance between the two connected elements, respectively.
3.3. Convection Heat Transfer
The convection heat rate between element
n and air outside the cabin, as well as the convection heat rate between element
i and air in the cabin can be, respectively, denoted as
h represents the convective heat transfer coefficient and
Tin is the air temperature in the cabin.
The convective heat transfer coefficients of elements outside and in the cabin can be approximately calculated by the empirical formula summarized in the scientific literature [
42,
43]:
Vex is the relative velocity between car and air outside the cabin.
C1 and
C2 refer to the values in McAdam′s plate model, which are 3.8 and 5.7 W·m
−2·K
−1, respectively [
44].
4. Diurnal Dynamic Numerical Calculation and Verification
Previously, the research team carried out massive analysis and verification on the maximum temperature of the auto-parts during midday period on several working days; however, to further predict and master the diurnal dynamic variation regularity of heat transfer and temperature of automobile exposed to natural environment, the following dynamic numerical calculation and analysis of the automobile heat transfer model are conducted.
The size of the model corresponding to the test car is 3.9 m × 2.1 m × 1.5 m, and the material physical parameters of each part are given according to the references and databases [
45,
46,
47,
48]. The discrete model and physical property parameters are shown in
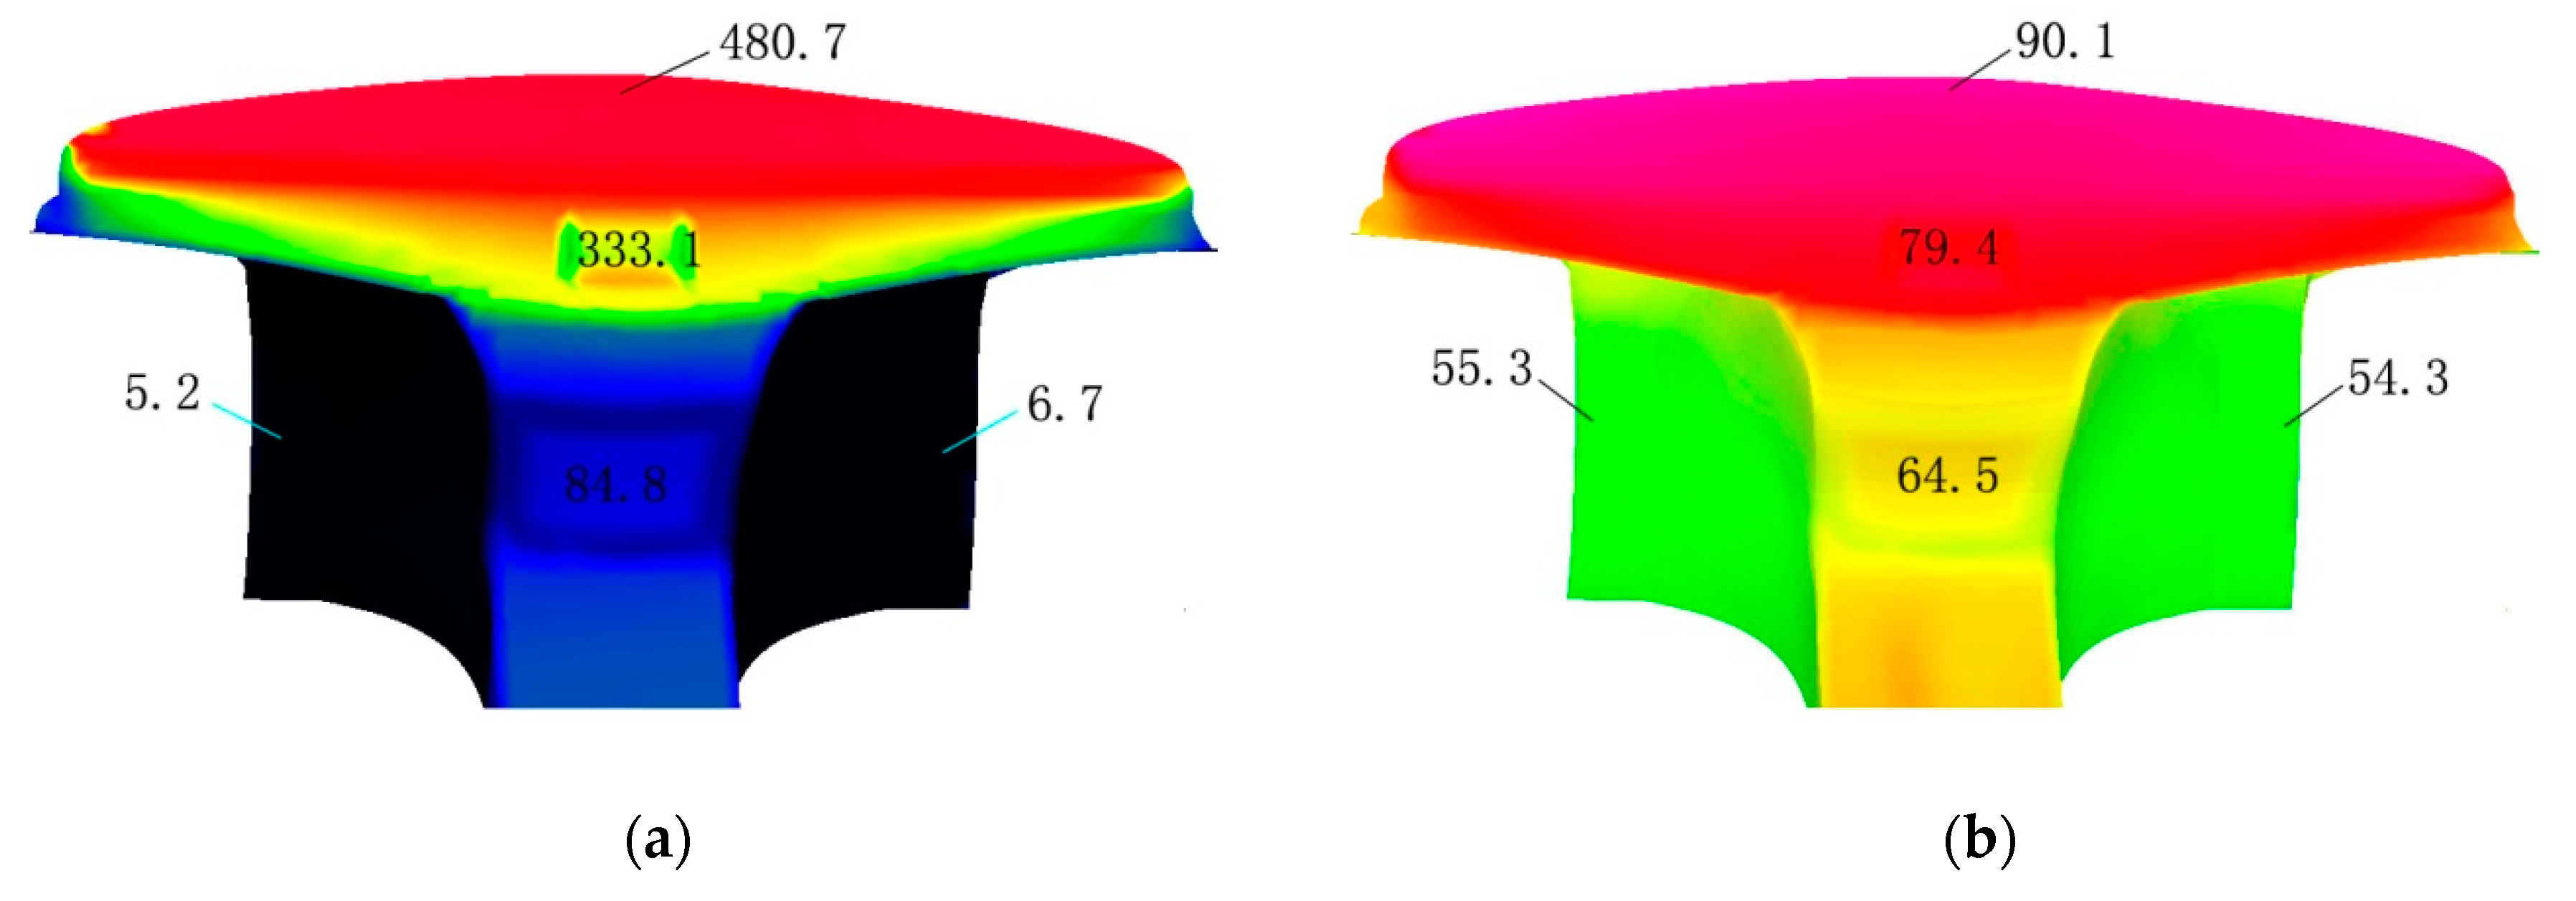
Figure 5 and
Table 4, respectively. The environmental weather parameters such as solar radiation, air temperature, wind speed, wind direction and atmospheric pressure continuously monitored in the natural exposure test, as well as the geographical parameters such as longitude, latitude, time zone and altitude where the test site is located, are taken as the definite solution conditions of the heat transfer model. Combined with the dynamic heat transfer Equations (1) and (10)–(13) in the above composite heat transfer model calculation method, the compound heat transfer process of the model is analyzed in detail, including the radiation, conduction and convective heat transfer, and then the dynamic simulation temperature of the complete car during day and night is calculated in real time. In the process of calculation, the discrete model and dynamic environment parameters are corrected in real time until the dynamic simulation results are consistent with the experimental data.
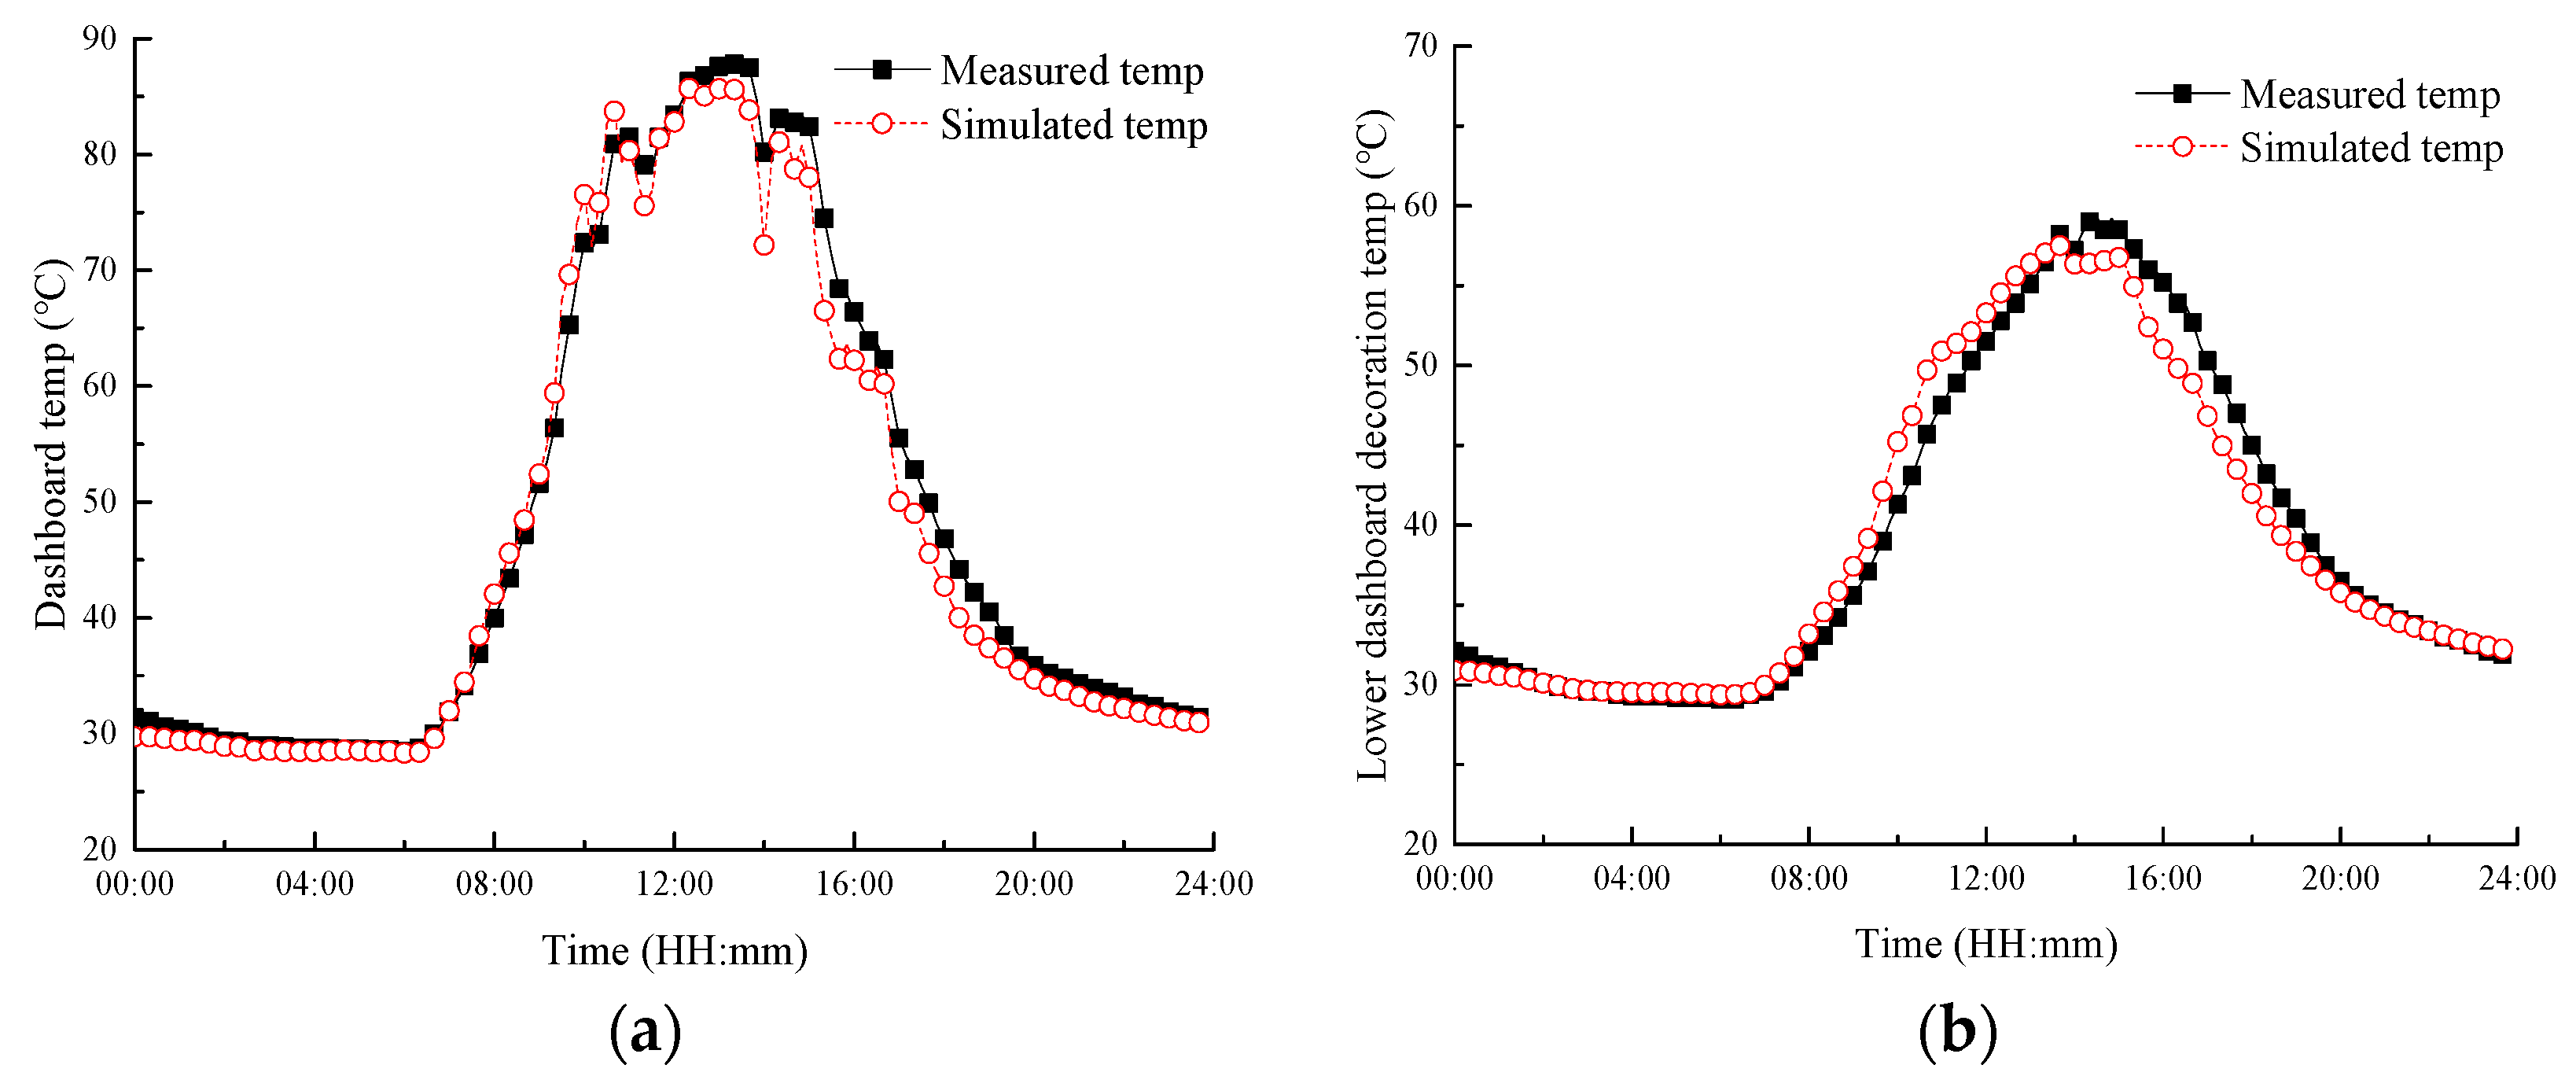
The simulation verification and relative error analysis of key parts inside and outside the car are shown in
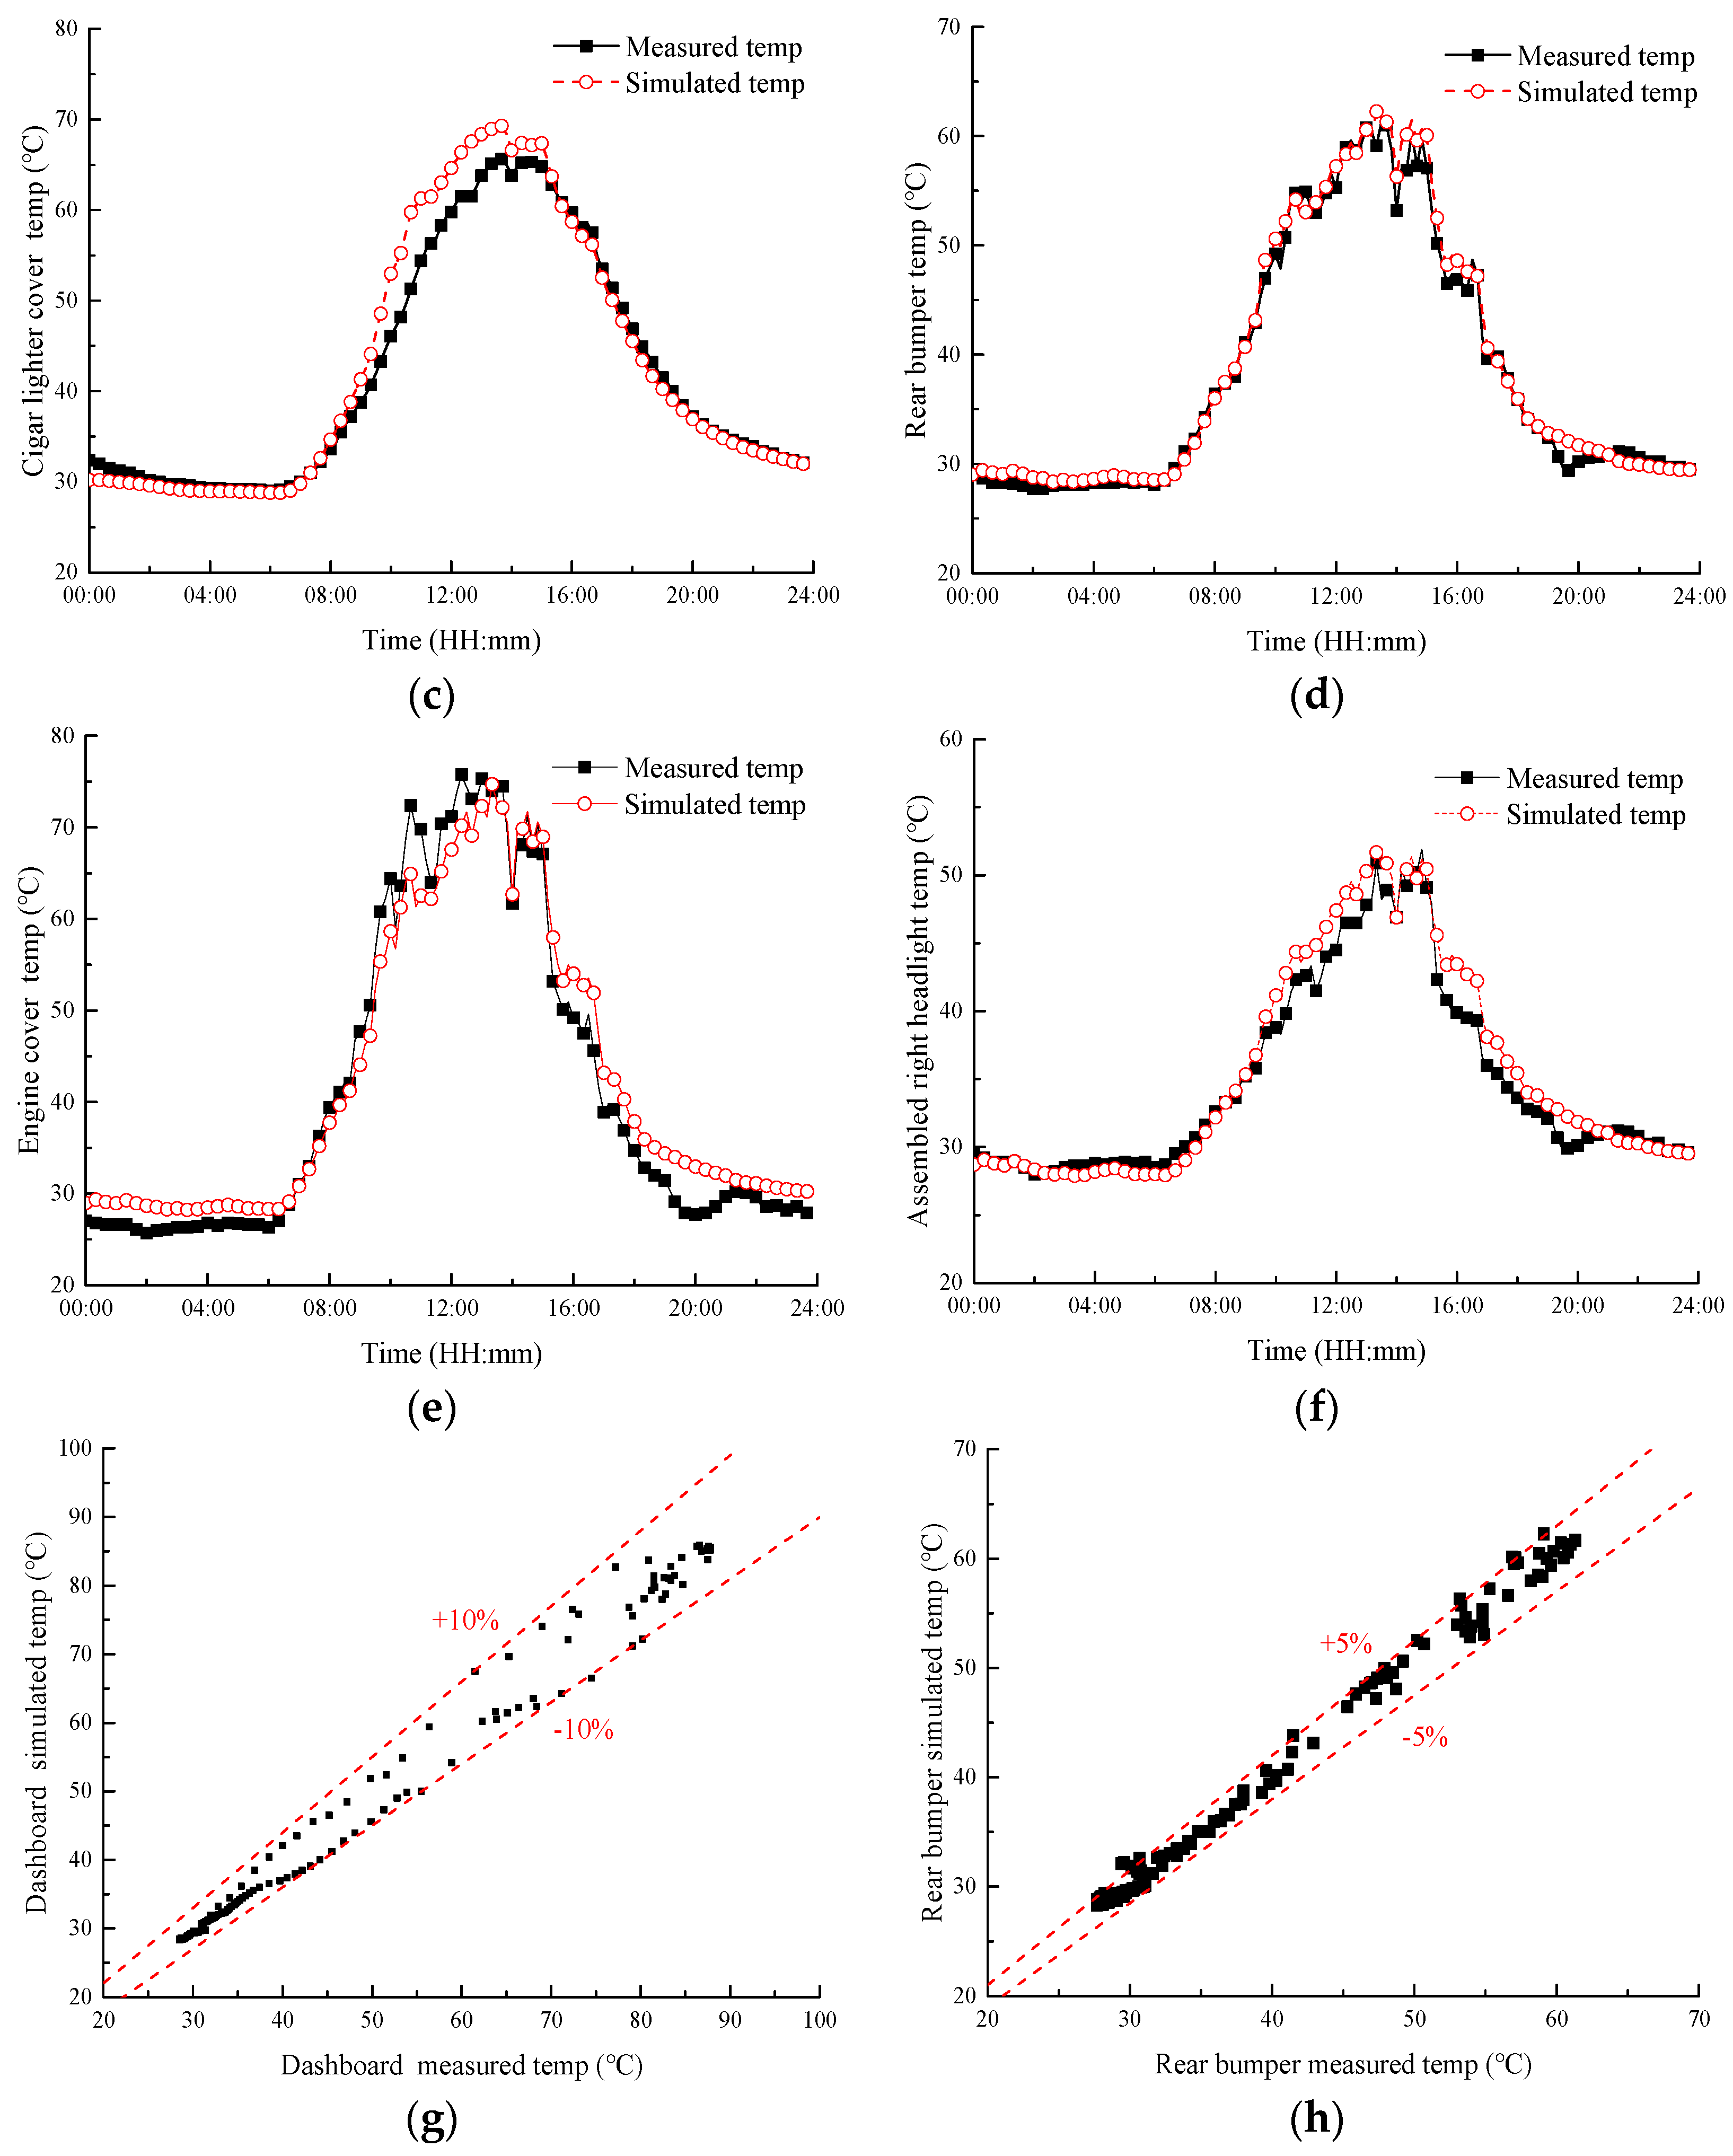
Figure 6. The numerical simulation values of key parts, such as dashboard, lower dashboard decoration, bumper, engine cover, etc., are all highly consistent with the temperature values in the diurnal dynamic test, and the relative errors of some measured points are even less than 5%.
5. Distribution Characteristics and Regulation Methods of Auto-Parts Weathering External Factors
The above experimental verification and analysis proved that the proposed numerical calculation method is reliable and highly accurate, thus it can be used to predict and analyze the external factors distribution characteristics of automotive weathering, the diurnal heat transfer variation law which is of important influence on the light-dark periodic weathering of auto-parts, the rules of orientations and locations and their effects on the distribution and cumulative values of auto-parts weathering external factors, as well as the regulation scheme to effectively reduce the distribution difference of weathering external factors. There are more than ten thousand parts in one automobile, and the related weathering research workload is very heavy. Therefore, it is necessary to partition the entire car into several regions, and then study one region after another in detail on the basis of plan and labor division. Finally, the region and grade regulation on the auto-parts weathering external factors can be gradually completed.
5.1. The External Factors Distribution Characteristics and Their Diurnal Variation Laws
According to the degree of being obscured by car body, auto-parts are divided into three categories: Type I, the parts directly facing solar radiation, such as dashboard and rear windowsill; Type II, the parts which are widely obscured, such as lower dashboard decoration and carpet; and Type III, the parts that are just partially obscured, such as front seats, rear seats and cigar lighter cover.
As shown in
Figure 7, the main external factors of weathering are highly unevenly distributed among these three types of parts, and the comparison of their intensity values is as follows: Type I > Type III > Type II. In the horizontal direction, dashboard and rear windowsill are both very close to the window; consequently, their solar radiation and temperature are significantly higher than those of the front seats and rear seats. In the vertical direction, the distributions of solar radiation and temperature on the instrument table present large gradient decreasing phenomenon from top to bottom (here, the thermal gradient refers to the difference between the average temperature or the average solar radiation intensity of the two parts). The distribution and variation of the instrument table weathering external factors at multiple moments are shown in
Figure 8,
Figure 9 and
Figure 10, respectively, where the maximum difference of solar radiation and temperature between dashboard and lower dashboard decoration at 12:00 reach up to 475.5 W·m
−2 and 35.8 °C, respectively.
The diurnal variation rules of weathering external factors and heat transfer are shown in
Figure 11. During daytime, the non-uniform distribution of solar radiation results in great differences in the main heat transfer modes of different types of parts. The solar radiations of Type I parts are obviously higher than those of the two other types of parts, thus their main ways of heat absorption and heat dissipation are solar radiation and radiation heat transfer, respectively. Type II parts only receive a very small amount of diffuse radiation, and their temperatures are remarkably lower than those of Type I parts; however, greenhouse effect in the cabin makes convection heat transfer and conduction heat transfer become their main ways of heat absorption and heat dissipation, respectively. As Type III parts are merely partially obscured, the ways of their heat transfer are between those of Type I and Type II parts. At night, the solar radiation disappears, and the surface of the parts dissipates heat by means of radiation and convection. Then, the parts also get heat from their inner layer through heat conduction after cooling down. Meanwhile, the weathering processes of the parts begin to proceed in accordance with the mechanism of dark reaction. As shown in
Table 5, in term of temperature difference between day and night, the diurnal temperature difference of Type I parts is the largest, followed by Type III parts, and that of Type II parts is the smallest.
5.2. Influence of Windows in Different Positions on Intensity and Differential Distribution of Weathering External Factors
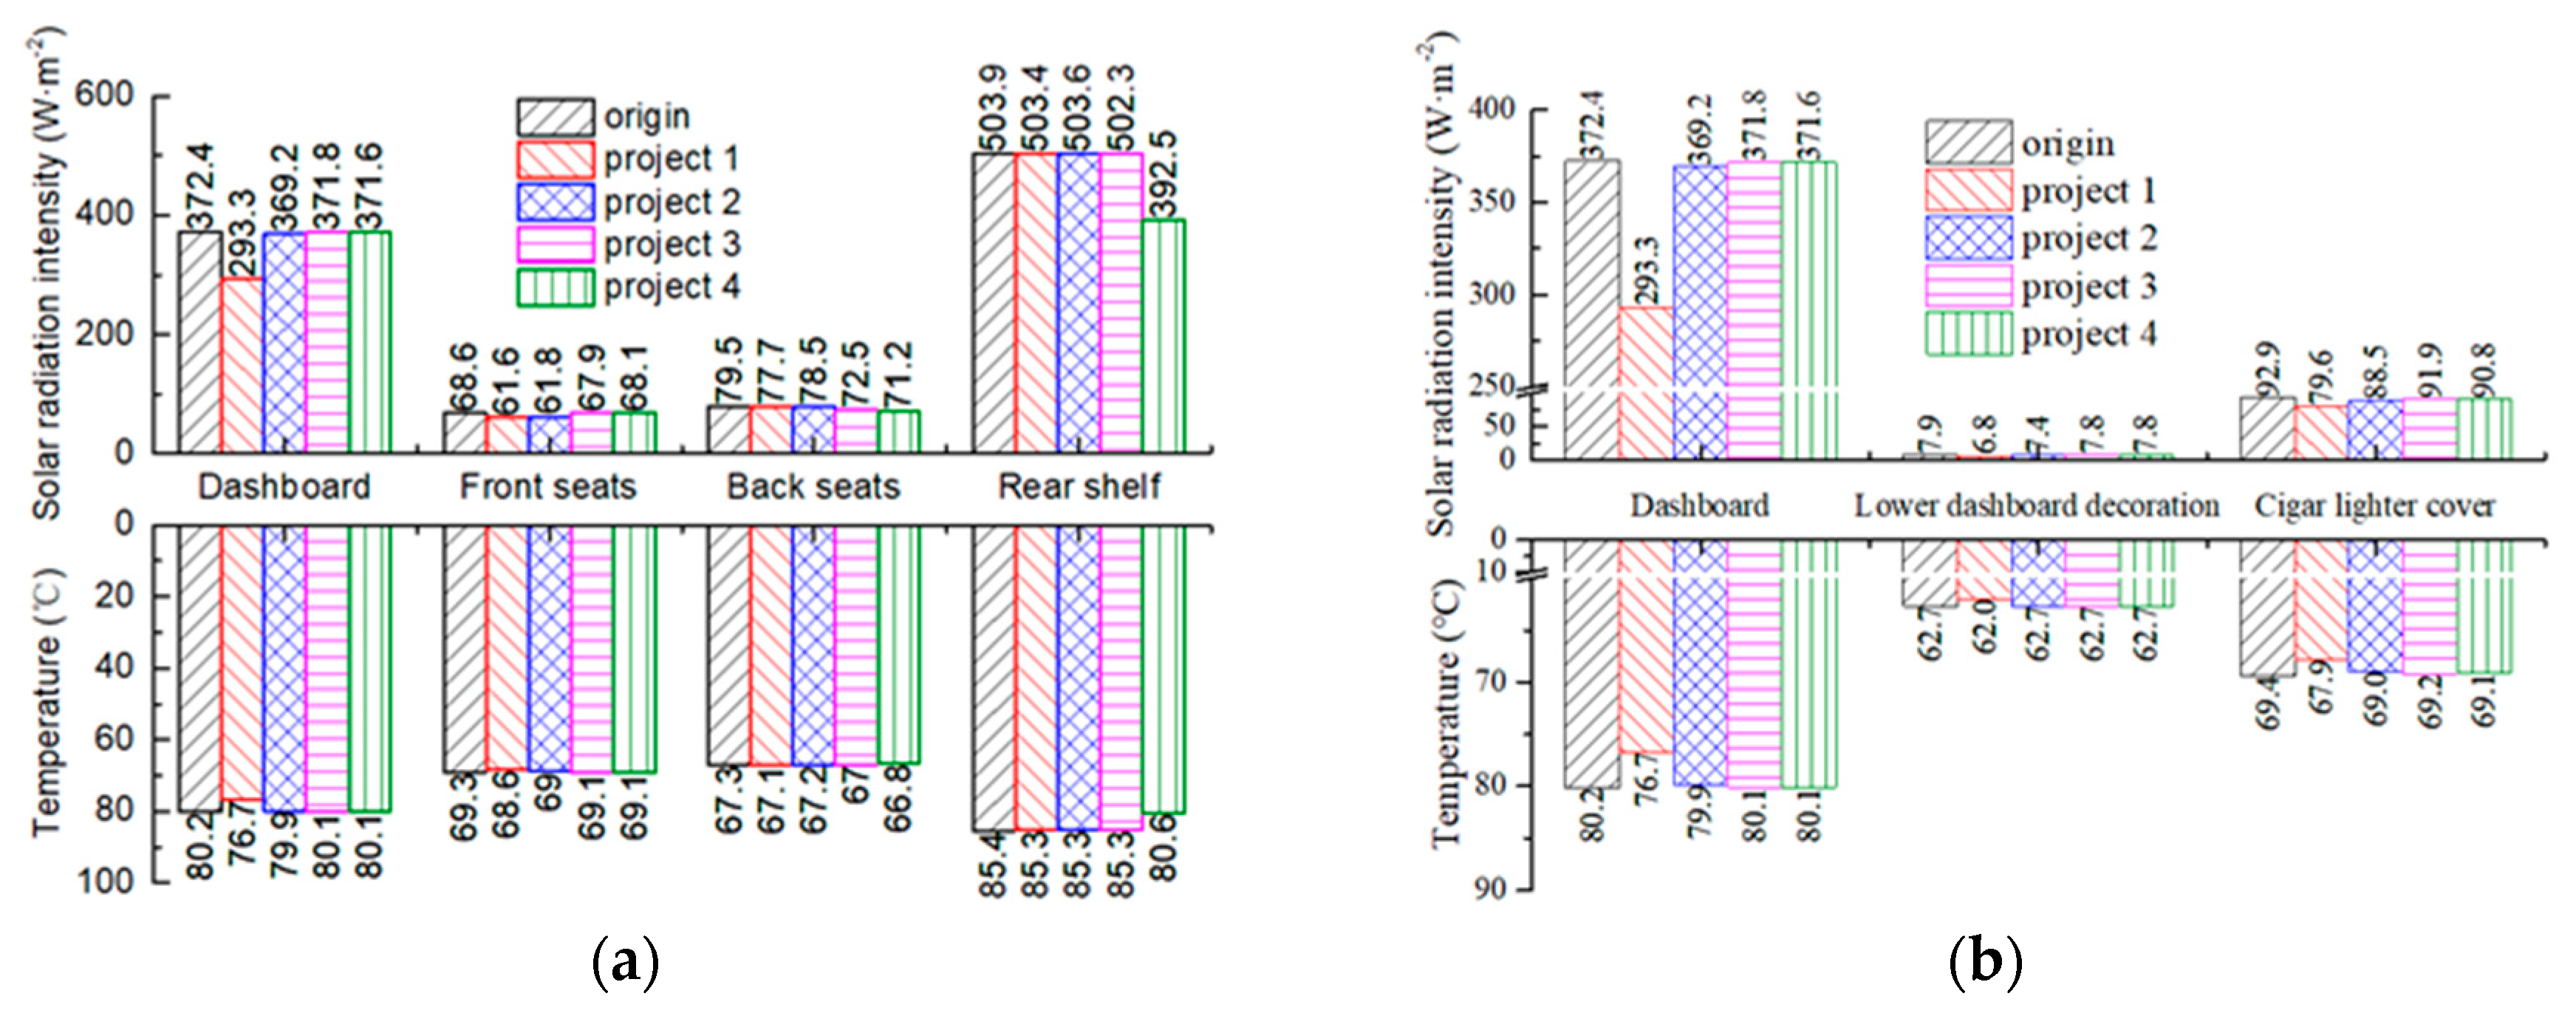
To study the methods of reducing intensity of the local weathering external factor, the glass transmittances of front windshield, side front window, side rear window and rear window were decreased, respectively. As shown in
Table 6 and
Figure 12, the transmittance of the front windshield in Project 1 is reduced by 0.2. Viewed from the horizontal direction in the cabin, the amplitude reduction on both solar radiation and temperature of the main auto-parts from large to small are arranged as dashboard, front seats, rear seats and rear windowsill, respectively. In the vertical direction, it is found that amplitude reduction on weathering external factors from high to low are dashboard, cigar lighter cover and lower dashboard decoration, respectively. At the same time, the thermal gradient between different types of parts decreases correspondingly, among which the solar radiation gradient and temperature gradient between dashboard of Type I part and lower dashboard decoration of Type II part are reduced from 364.5 W·m
−2 and 17.5 °C to 286.5 W·m
−2 and 14.7 °C, respectively. Thus, it can be seen that the influence of reducing windshield transmittance on the weathering external factor intensity of parts decreases with the increment of distance between windshield and parts, and similar rules can also be obtained for the remaining three projects through reducing transmittance of other window glasses. Therefore, for the parts with high intensity of weathering external factors in the local regions of cabin, the transmittance of the window glass close to these parts can be reduced pertinently, so as to realize the regulation and control on the local external factors of weathering.
5.3. Effect of Physical Property Parameters on Weathering External Factors Gradient Distribution and Diurnal Temperature Difference
To further balance and regulate the non-uniform distribution of weathering external factors on different types of parts, the following methods on increasing radiation heat dissipation and reducing the solar radiation of Type I parts are discussed, respectively, from the two aspects of surface emissivity and absorption.
As shown in
Table 7 and
Figure 13, for each 0.2 increase in surface radiation, the radiative heat dissipation of the dashboard increases by 14.2–19.4 W; thus, the daily maximum temperature and the diurnal temperature difference are correspondingly reduced by 3.5–5.4 °C. In terms of temperature gradient between Type I parts and Type II parts, as the surface emissivity of dashboard rises from 0.50 to 0.7 and 0.9, respectively, the temperature gradient between dashboard and lower dashboard decoration decreases from 26.4 to 21.0 and 17.5 °C, respectively.
As shown in
Table 7 and
Figure 14, for each 0.2 decrease in surface absorption, the solar radiation heat rate absorbed by the dashboard reduces by up to 79.1–80.7 W, whereas the radiation heat dissipation rate reduces by only 42.0–42.1 W. Since the amplitude reduction of solar radiation heat absorption is greater than that of radiation heat dissipation, the dashboard temperature drops by 5.2–5.3 °C. In terms of diurnal temperature difference, as the absorptivity reduces from 0.85 to 0.65 and 0.45, respectively, the diurnal temperature difference of the dashboard decreases from 51.6 to 46.4 and 41.1 °C, respectively. Meanwhile, the temperature gradient between dashboard and lower dashboard decoration decreased from 17.5 to 12.8 and 8.0 °C, respectively.
The laws of automotive physical parameters and their effects on weathering external factors distribution are contributed to provide some pertinence guidance for the accurate regulation of automobile disequilibrium weathering on regions at different levels. Type III parts only need to decrease the external factor intensity of weathering, while, for Type I parts, the comprehensive measure is suggested, combining the selection of weathering-resistant materials as well as the intensity reduction of weathering external factors.
5.4. The Rules of Orientations and Locations as Well as Their Influences on the Distribution and Cumulative Values of Auto-Parts Weathering External Factors
In the section, the differential effects of four automotive orientations and two positions on auto-parts weathering external factors are compared and analyzed in detail.
First, in relation to the impact of automotive orientations, the automobile is assumed to be oriented south, north, east and west, respectively, and is exposed to the cloudless natural environment. The all-day solar heat rate on the exterior right door is shown in
Figure 15. When the automotive windshield is oriented north, the right door faces the sun directly in the morning. The solar heat rate reaches its peak value much earlier than those in the other three orientations and then decreases rapidly. When the automobile faces south, its exterior right door faces away from the sun in the morning; however, the solar heat rate increases rapidly after noon and reaches its peak value at around 16:30. While the automobile is oriented east and west, the exterior right door is barely directly exposed to the sun, thus their solar heat rates are relatively low. Therefore, when the automobile is facing south, north, east and west, the accumulated solar radiation energies of the door throughout the day can be calculated as 6806.8, 6806.6, 2632.6 and 5384.5 kJ, respectively, by integrating solar heat rate with time.
According to the same method, the all-day solar radiation energy of the main parts inside and outside the automobile in four orientations can be calculated, as shown in
Figure 15. When the automobile windshield is oriented south, the solar radiation thermal loads of the main interior trims, such as the instrument table, console and rear windowsill, are higher than those in the other three orientations. As a result, important devices installed in these areas, including instrumentations, electrical apparatuses, air conditioning and automotive audio, are more likely to be weathered. Meanwhile, the solar thermal loads of the main exterior parts on the body-side, such as the left and right doors, as well as bumpers, are also the highest of all four orientations. For exterior parts with small angles to the ground plane, there are little differences in solar radiation energies corresponding to the four orientations.
Therefore, the above calculation results of the model indicate that there are more destructive stimuli for most of the main parts inside and outside the cabin while automobile is oriented south in the northern hemisphere, compared with the other three orientations. This is consistent with the experimental operation method in the profession, according to experience to turn the automobile towards the equator [
29].
The external factors of automobile weathering not only vary with the direction but also with the locations. According to statistics, in the city, 85% of the business vehicles travel within 18 km, and the driving time is about 15–30 min [
49], in which the ratio of dynamic time to static time of family cars is 1:20–1:15. Therefore, the automobiles are static during most of their service lives. Automobiles are often parked in the carport in daily life. Membrane structure roof is widely used in communities, hospitals, schools, factory gymnasiums and government agencies due to its advantages of light weight, high strength, low cost, high visible light transmittance, high thermal reflectivity and long service life. Assuming that the automobile is placed under the 10-m-long membrane structure roof, the main material of its ceiling is polyvinyl chloride, whose physical property parameters are shown in
Table 8. Automobile weathering external factors under the conditions of membrane structure roof and outdoor location are analyzed and compared in
Figure 16.
In the membrane structure roof, the solar heat rates of exterior roof, trunk cover, dashboard and console are reduced by 666, 373.6, 246.6 and 56.1 W, respectively, compared with those in natural exposure environment; consequently, their temperatures are correspondingly decreased by 18.7, 11, 18.7 and 8.5 °C, respectively, with maximum temperature reduction rate up to 25.2%. Therefore, in daily life, parking the automobile in the carport contributes to delay and reduce the auto-parts weathering.
6. Conclusions
Experiments and numerical calculations on the non-uniform distribution characteristics and the day–night variation laws of automobile weathering external factors were conducted in detail. The laws of automotive physical parameters, orientations and locations, as well as their effects on the weathering external factors, are further analyzed and discussed. Thereby, the region and grade regulation schemes on reducing the intensity and gradient distribution of weathering external factors are proposed and studied specifically. The main conclusions are as follows:
(1) A numerical calculation method which can quickly predict the external factors of automobile weathering during day and night is presented. The method can effectively solve the existing knobby problems of time consuming, high cost, poor repeatability and limited number of measuring points in natural weathering test, in which it is difficult to quickly and comprehensively master the external factors distribution of automobile weathering. The differentiated environmental spectrums of various auto-parts can be obtained from the calculation results, while designing artificial weathering test methods and standards. Moreover, a scientific guidance can be given out for the rational allocation of different weathering-resistant level parts in different regions of the automobile.
(2) It is proved that the weathering external factors distribution is closely related to timing sequence of generation and quantity of newly-added appearance defects in corresponding regions, by automotive natural exposure test and auto-parts appearance defects inconsistent test for whole year. These experimental results, as well as the numerical calculation study on the gradient distribution of solar radiation and temperature, present an important supplementary basis for revealing the weathering inconsistency mechanism among auto-parts within different regions, from the perspective of external factors. The Type I parts near the window are in the regions where the weathering external factors are highly concentrated, thus they become the key objects which should be regulated.
(3) There are significant differences in heat transfer mode and heat transfer composition of parts between the day and night, which result in diurnal temperature differences as high as 51.6, 40.6 and 33.8 °C for dashboard, cigar lighter cover and lower dashboard decoration, respectively. The study on the heat transfer variation law between day and night is helpful to quickly predict the extreme value, mean value and diurnal difference of solar radiation and temperature on the surface of the automobile, which give out the experimental design parameters in light–dark cycle for the artificial weathering tests of auto-parts.
(4) The regulation of non-uniform weathering can be carried out precisely on regions at different levels. With the targeted adjustment in the physical properties of automobile, the intensity of weathering external factors and diurnal temperature difference on the locally regional auto-parts are markedly decreased. Furthermore, the thermal gradient between three groups of parts are effectively reduced.
(5) The model and numerical calculation method can be used to quickly predict the rules of orientations and locations as well as their influences on auto-parts weathering external factors, so as to provide some assessments and comparisons on the external factors destructiveness in various conditions, for outdoor and artificial weathering tests. There are more destructive stimuli while automobile is oriented south in the northern hemisphere. As the automobile is facing south, the solar radiation thermal loads of the main interior and exterior parts are mostly higher than those in the other three directions; thus, the majority of key auto-parts are more likely to be weathered in this situation. Parking the automobile under a membrane structure roof is also conducive to delaying and reducing the auto-parts weathering. The solar heat rate and temperature of automobile parked in the position of membrane structure roof are significantly decreased, compared with those in natural exposure environment.
Author Contributions
All authors contributed to this work. Proposed the idea; performed theoretical and experimental analysis; carried out several numerical simulation calculations, and validation; and conceived the region and grade regulation strategy on auto-parts weathering external factors, Z.D. Guided the heat transfer model and related theory; executed article examination; presented revisions and suggestions; and made important contributions in project administration, funding, and experimental support, F.L. and J.C. All authors have read and agreed to the published version of the manuscript.
Funding
This work was Supported by the National Natural Science Foundation of China (Grant No. 51775193); funded by Science and Technology Planning Program of Guangdong Province (Grant No. 2015B010137002); and funded by Natural Science Foundation of Guangdong Province (Grant No. 2018A030313727).
Acknowledgments
In term of utilizing the test equipment and test site as well as experiment throughout the year, it was greatly supported by Xiaodong Zhang, Ganxin Jie, et al. in State Key Laboratory of Environmental Adaptability for Industrial Products, China National Electric Apparatus Research Institute Co., Ltd.
Conflicts of Interest
The authors declare no conflict of interest.
References
- GB/T 3681-2011. Plastics-Methods of Exposure to Direct Weathering, to Weathering Using Glass-Filtered Daylight, and to Intensify Weathering by Daylight Using Fresnel Mirrors; General Administration of Quality Supervision, Inspection and Quarantine of the People’s Republic of China & Standardization Administration of China: Beijing, China, 2011. [Google Scholar]
- ISO 877-2-2009. Plastics-Methods of Exposure to Solar Radiation-Part 2: Direct Weathering and Exposure behind Window Glass; The International Organization for Standardization: Geneva, Switzerland, 2009. [Google Scholar]
- ASTM G7-2013. Standard Practice for Atmospheric Environmental Exposure Testing of Nonmetallic Materials; American Society for Testing and Materials: West Conshohocken, PA, USA, 2013. [Google Scholar]
- ISO 4892-3-2016. Plastics-Methods of Exposure to Laboratory Light Sources-Part 3: Fluorescent UV Lamps; The International Organization for Standardization: Geneva, Switzerland, 2016. [Google Scholar]
- ISO 4892-2-2013. Plastics-Methods of Exposure to Laboratory Light Sources-Part 2: Xenon-Arc Lamps; The International Organization for Standardization: Geneva, Switzerland, 2013. [Google Scholar]
- Pickett, J.E.; Gibson, D.A.; Gardner, M.M. Effects of irradiation conditions on the weathering of engineering thermoplastics. Polym. Degrad. Stab. 2008, 93, 1597–1606. [Google Scholar] [CrossRef]
- Oberhofnerová, E.; Hýsek, Š.; Pánek, M.; Böhm, M. Effect of artificial weathering and temperature cycling on the performance of coating systems used for wooden windows. J. Coat. Technol. Res. 2018, 15, 851–865. [Google Scholar] [CrossRef]
- Jie, G.X.; Guo, Y.F.; Tao, Y.J.; Zhang, X.D.; He, G.; Hu, L.-F.; Liu, Z.; Wang, J.; Ma, J. Impacts of Moisture in Hot-humid and Dry-humid Climate Natural Weathering Environments on Degradation Behaviors of Polycarbonate. Plastics 2014, 43, 71–74. [Google Scholar]
- Liao, J.; Brosse, N.; Pizzi, A.; Hoppe, S. Dynamically Cross-Linked Tannin as a Reinforcement of Polypropylene and UV Protection Properties. Polymers 2019, 11, 102. [Google Scholar] [CrossRef] [PubMed]
- Li, J.Y.; Wen, Q.Z. Kinetic parameters on aging of the neoprene. China Elastom. 2018, 28, 36–38. [Google Scholar]
- Li, Z.M. Study on the thermal oxidative aging of butyl rubber. World Rubber Ind. 2010, 37, 1–4. [Google Scholar]
- Shi, K.; Gao, L.; Tao, Y.; Ye, L. Outdoor weathering behavior of polyamide 6 under various climates in China. J. Appl. Polym. Sci. 2016, 134, 44231. [Google Scholar] [CrossRef]
- Zhu, M.Z.; Wang, J. Study on hot-wet property of epoxy resin cured by anhydride. Thermosetting Resin 2004, 19, 1. [Google Scholar]
- Poda, A.B.; Dhara, R.; Rab, M.A.; Basappa, P. Evaluation of aging in nanofilled polypropylene by surface discharges. IEEE Trans. Dielectr. Electr. Insul. 2016, 23, 275–287. [Google Scholar] [CrossRef]
- Zha, J.W.; Fan, B.H.; Dang, Z.M.; Li, S.T.; Chen, G. Microstructure and electrical properties in three-component (Al2O3-TiO2)/ polyimide nanocomposite films. J. Mater. Res. 2010, 25, 2384–2391. [Google Scholar] [CrossRef]
- Badji, C.; Beigbeder, J.; Garry, H.; Bergeret, A.; Bénézet, J.C.; Desauziers, V. Natural weathering of hemp fibers reinforced polypropylene biocomposites: Relationships between visual and surface aspects, mechanical properties and microstructure based on statistical approach. Compos. Sci. Technol. 2018, 167, 440–447. [Google Scholar] [CrossRef]
- Ariawan, D.; Salim, M.S.; Taib, R.; Ahmad Thirmizir, M.Z.; Mohammad Ishak, Z.A. Durability of alkali and heat-treated kenaf fiber/unsaturated polyester composite fabricated by resin transfer molding under natural weathering exposure. Adv. Polym. Technol. 2018, 37, 1420–1434. [Google Scholar] [CrossRef]
- Yu, L.; Yan, X.; Fortin, G. Effects of weathering aging on mechanical and thermal properties of injection molded glass fiber reinforced polypropylene composites. J. Polym. Res. 2018, 25, 247–248. [Google Scholar] [CrossRef]
- Jost, C.; Muehlethaler, C.; Massonnet, G. Forensic aspects of the weathering and ageing of spray paints. Forensic Sci. Int. 2016, 258, 32–40. [Google Scholar] [CrossRef]
- Shehzad, F.; Ahmad, M.I.; Al-Harthi, M.A. Photooxidative degradation of graphene reinforced high-density polyethylene nanocomposites. J. Appl. Polym. Sci. 2018, 136, 47030. [Google Scholar] [CrossRef]
- de Oliveira, A.G.G.; Wiercigroch, E.; de Andrade Gomes, J.; Malek, K. Infrared and Raman spectroscopy of automotive paints for forensic identification of natural weathering. Anal. Methods 2018, 10, 1203–1212. [Google Scholar] [CrossRef]
- Rajput, P.; Sastry, O.S.; Tiwari, G.N. Effect of irradiance, temperature exposure and an Arrhenius approach to estimating weathering acceleration factor of Glass, EVA and Tedlar in a composite climate of India. Sol. Energy 2017, 144, 267–277. [Google Scholar] [CrossRef]
- Li, H.L.; Wang, W.T.; Li, L.; Liu, Q.; Gu, P.Y.; Feng, Q.F.; Wang, J.; Jie, G.X.; Zhang, X.D. Study on Correlation between Xenon Lamp Aging and Natural Exposure Methods of Automobile Instrument Panel Materials. Equip. Environ. Eng. 2014, 11, 30–33. [Google Scholar]
- Tochacek, J.; Vratnickova, Z. Polymer life-time prediction: The role of temperature in UV accelerated ageing of polypropylene and its copolymers. Polym. Test. 2014, 36, 82–87. [Google Scholar] [CrossRef]
- François-Heude, A.; Richaud, E.; Desnoux, E.; Colin, X. Influence of temperature, UV-light wavelength and intensity on polypropylene photothermal oxidation. Polym. Degrad. Stab. 2014, 100, 10–20. [Google Scholar] [CrossRef]
- Lv, Y.; Huang, Y.; Yang, J.; Kong, M.; Yang, H.; Zhao, J.; Li, G. Outdoor and accelerated laboratory weathering of polypropylene: A comparison and correlation study. Polym. Degrad. Stab. 2015, 112, 145–159. [Google Scholar] [CrossRef]
- GM 9538P. Weathering Exposure Tests for Interior Trims; IHS Standard Store: Detroit, MI, USA, 2001. [Google Scholar]
- SAE J2412-2015. Accelerated Exposure of Automotive Interior Trim Components Using a Controlled Irradiance Xenon-Arc Apparatus; American Society of Automotive Engineers: Warrendale, PA, USA, 2015. [Google Scholar]
- QC/T 728-2005. Road Vehicle-Test Method of Exposure to Weathering; National Development and Reform Commission: Beijing, China, 2005.
- GB/T 3979-2008. Methods for the Measurement of Object Color; General Administration of Quality Supervision, Inspection and Quarantine of the People’s Republic of China & Standardization Administration of China: Beijing, China, 2008. [Google Scholar]
- GB/T 7921-2008. Uniform Color Space and Color Difference Formula; General Administration of Quality Supervision, Inspection and Quarantine of the People’s Republic of China & Standardization Administration of China: Beijing, China, 2008. [Google Scholar]
- Swinbank, W.C. Long-wave radiation from clear skies. Q. J. R. Meteorol. Soc. 2010, 89, 339–348. [Google Scholar] [CrossRef]
- Duffie, J.A.; Beckman, W.A. Solar Engineering of Thermal Process, 4th ed.; Wiley: New York, NY, USA, 2013; pp. 1–20. [Google Scholar]
- Prata, A.J. A new long-wave formula for estimating downward clear-sky radiation at the surface. Q. J. R. Meteorol. Soc. 2010, 122, 1127–1151. [Google Scholar] [CrossRef]
- Zhang, X.H. Research on the Characteristics of Non-Steady State Heat Transfer in the Room with Concrete Ceiling Radiant Cooling Panels. Ph.D. Thesis, Hunan University, Changsha, China, 2016; pp. 22–32. [Google Scholar]
- Liu, Z.W.; Ma, Y.R. Application of Architectural Glass in Modern Architecture; China Building Materials Press: Beijing, China, 2000; pp. 21–22. [Google Scholar]
- Wang, T.P. Study on Heat Transfer Mechanism of Building Transparent Skin between Indoor and Outdoor Thermal Environments under Entire Wave Length Heat Radiation. Ph.D. Thesis, Lan Zhou Jiao Tong University, Lanzhou, China, 2014; p. 30. [Google Scholar]
- Zhao, T. Research on the Heat Treatable Low-E Coatings Used for Vehicle Windshield. Master′s Thesis, Hefei University of Technology, Hefei, China, 2013; pp. 5–6. [Google Scholar]
- Zhu, Y.X. Built Environment, 4th ed.; Architecture and Building Press: Beijing, China, 2016; pp. 13–19. [Google Scholar]
- Yang, S.M.; Tao, W.Q. Heat Transfer, 4th ed.; Higher Education Press: Beijing, China, 2006; pp. 1–30. [Google Scholar]
- Mezrhab, A.; Bouzidi, M. Computation of thermal comfort inside a passenger car compartment. Appl. Therm. Eng. 2006, 26, 1697–1704. [Google Scholar] [CrossRef]
- Wang, Y.; Gao, Q.; Zhang, T.; Wang, G.; Jiang, Z.; Li, Y. Advances in Integrated Vehicle Thermal Management and Numerical Simulation. Energies 2017, 10, 1636. [Google Scholar] [CrossRef]
- ASHRAE. Handbook of Fundamentals; American Society of Heating, Refrigerating and Air-Conditioning Engineers Inc.: Atlanta, GA, USA, 2005. [Google Scholar]
- Mcadams, W.H. Heat Transmission, 3rd ed.; McGraw-Hill: New York, NY, USA, 1994. [Google Scholar]
- Ražnjević, K. Handbook of Thermo Dynamic Tables and Charts; McGraw Hill: New York, NY, USA, 1976. [Google Scholar]
- Touloukian, Y.S. Thermophysical Properties of Matter: V.1.; Thermal Conductivity; Metallic Elements and Alloys; IFI/Plenum: New York, NY, USA, 1970. [Google Scholar]
- Zhang, J.R.; Zhao, T.Y. Handbook of Thermophysical Properties of Commonly Used Materials in Engineering; New Times Press: Beijing, China, 1987. [Google Scholar]
- Ma, Q.F.; Fang, R.S.; Xiang, L.C.; Guo, S. Handbook of Practical Thermophysical Properties; China Agricultural Machinery Press: Beijing, China, 1986. [Google Scholar]
- Alahmer, A.; Mayyas, A.; Mayyas, A.A.; Omar, M.A.; Shan, D. Vehicular thermal comfort models; a comprehensive review. Appl. Therm. Eng. 2011, 31, 995–1002. [Google Scholar] [CrossRef]
Figure 1.
Schematic diagram for arrangement of temperature and humidity measuring points in automobiles.
Figure 1.
Schematic diagram for arrangement of temperature and humidity measuring points in automobiles.
Figure 2.
Radiation and temperature sensors: (a) solar radiation in the cabin; and (b) dashboard temperature.
Figure 2.
Radiation and temperature sensors: (a) solar radiation in the cabin; and (b) dashboard temperature.
Figure 3.
Annual statistical overview of the weathering external factors distribution inside and outside the automobile in non-uniform thermal environment: (a) annual radiation and maximum temperature of parts; (b) ambient air temperature and cumulative time; (c) solar radiation intensity and cumulative time; and (d) surface temperature and accumulated time of parts.
Figure 4.
Dynamic variation on non-uniform measured temperature of key parts during day and night.
Figure 4.
Dynamic variation on non-uniform measured temperature of key parts during day and night.
Figure 5.
Discrete model of sedan with three compartments.
Figure 5.
Discrete model of sedan with three compartments.
Figure 6.
Comparison and verification between dynamic simulated and measured temperature of key parts: (a) dashboard temperature; (b) lower dashboard decoration temperature; (c) cigar lighter cover temperature; (d) bumper temperature; (e) engine cover temperature; (f) headlight temperature; (g) relative error of dashboard temperature; and (h) relative error of rear bumper temperature.
Figure 7.
Overall external factors distribution of weathering: (a) horizontal distribution of external factors; and (b) vertical distribution of external factors.
Figure 7.
Overall external factors distribution of weathering: (a) horizontal distribution of external factors; and (b) vertical distribution of external factors.
Figure 8.
Distribution and variation of solar radiation intensity on instrument table system at multiple moments (W/m2).
Figure 8.
Distribution and variation of solar radiation intensity on instrument table system at multiple moments (W/m2).
Figure 9.
Distribution and variation of the temperature on instrument table system at multiple times (°C).
Figure 9.
Distribution and variation of the temperature on instrument table system at multiple times (°C).
Figure 10.
Non-uniform distribution of weathering external factors on instrument table at 12:00 a.m. on 25 June: (a) non-uniform distribution of solar radiation intensity (W/m2); and (b) non-uniform distribution of temperature (°C).
Figure 10.
Non-uniform distribution of weathering external factors on instrument table at 12:00 a.m. on 25 June: (a) non-uniform distribution of solar radiation intensity (W/m2); and (b) non-uniform distribution of temperature (°C).
Figure 11.
Diurnal variation rules on weathering external factors and heat transfer of different types of parts: (a) Type I part (dashboard); and (b) Type II part (lower dashboard decoration).
Figure 11.
Diurnal variation rules on weathering external factors and heat transfer of different types of parts: (a) Type I part (dashboard); and (b) Type II part (lower dashboard decoration).
Figure 12.
Influence of windows in different positions on the intensity and distribution of weathering external factors of different types of parts: (a) horizontal distribution of external factors; and (b) vertical distribution of external factors.
Figure 12.
Influence of windows in different positions on the intensity and distribution of weathering external factors of different types of parts: (a) horizontal distribution of external factors; and (b) vertical distribution of external factors.
Figure 13.
Influence of emissivity on regulation of heat transfer and temperature gradient: (a) radiant heat dissipation of dashboard; and (b) maximum temperature and temperature gradient.
Figure 13.
Influence of emissivity on regulation of heat transfer and temperature gradient: (a) radiant heat dissipation of dashboard; and (b) maximum temperature and temperature gradient.
Figure 14.
Influence of absorptivity on regulation of heat transfer and temperature gradient: (a) solar radiation and radiant heat dissipation; and (b) maximum temperature and temperature gradient.
Figure 14.
Influence of absorptivity on regulation of heat transfer and temperature gradient: (a) solar radiation and radiant heat dissipation; and (b) maximum temperature and temperature gradient.
Figure 15.
Influence of orientations on the distribution and cumulative values of auto-parts weathering external factors: (a) the all-day solar heat rate on the exterior right door; and (b) distribution and cumulative values of solar radiation energy on exterior and interior parts.
Figure 15.
Influence of orientations on the distribution and cumulative values of auto-parts weathering external factors: (a) the all-day solar heat rate on the exterior right door; and (b) distribution and cumulative values of solar radiation energy on exterior and interior parts.
Figure 16.
The comparison of automobile weathering external factors on the conditions of carport and outdoor location: (a) the all-day solar heat rate on the exterior and interior parts; (b) the all-day temperature on the exterior and interior parts; and (c) the difference of weathering external factors under the conditions of carport and outdoor.
Table 1.
Test equipment and measurement parameters.
Table 1.
Test equipment and measurement parameters.
| Measured Parameters | Equipment Type | Measurement Range | Precision |
|---|
| Solar radiation intensity | TBQ-2C | 0~2000 W·m−2 | <5% |
| Environmental temperature | PTS-3 | −40~120 °C | ±0.1 °C |
| Humidity | PTS-3 | 0~100% | ±2% |
| Temperature in the cabin | T-type | −200~150 °C | 0.4% |
| Surface temperature | T-type | −200~150 °C | 0.4% |
Table 2.
Environmental parameters at partial time.
Table 2.
Environmental parameters at partial time.
| Time/h | Air Temp/°C | Relative Humidity/% | Wind Speed/(m·s−1) | Solar Radiation/(W·m−2) |
|---|
| 00:00 | 29.3 | 69.12 | 0.48 | 0 |
| 06:00 | 28.2 | 78.5 | 1.5 | 0 |
| 09:00 | 31.1 | 69.2 | 1.9 | 317 |
| 12:00 | 36.6 | 56.3 | 1.5 | 659 |
| 15:00 | 38.6 | 51.8 | 0.3 | 461 |
| 18:00 | 31.6 | 74.5 | 1.9 | 26 |
| 24:00 | 28.8 | 81.4 | 0.5 | 0 |
Table 3.
Time and spatial distribution of newly-added appearance defects throughout the year.
Table 3.
Time and spatial distribution of newly-added appearance defects throughout the year.
| Detection Region | Parts Number | Time/Month |
|---|
| 2 | 4 | 6 | 8 | 10 | 12 |
|---|
| Engine case | 26 | | 2 | | | | 1 |
| Exterior body | 69 | 4 | 6 | 24 | 8 | 2 | 1 |
| Cabin | 204 | 4 | 9 | 3 | 4 | 7 | 4 |
| Trunk | 21 | | | 1 | | | |
| Total number | 320 | 8 | 17 | 28 | 12 | 9 | 6 |
Table 4.
Physical property parameters of some key parts.
Table 4.
Physical property parameters of some key parts.
| Components | Material | Density/kg·m−3 | Thermal Conductivity/W/(m·K) | Specific Heat/J/(Kg·K) |
|---|
| Dashboard | PP | 908.3 | 0.26 | 1882.8 |
| Lower dashboard decoration | ABS | 1120.0 | 0.21 | 1591.0 |
| Cigar lighter cover | ABS | 1120.0 | 0.21 | 1591.0 |
| Body frame | Steel | 7768.9 | 52.02 | 460.9 |
| Window | Glass | 2529.6 | 1.17 | 754.0 |
| Bumper | PC | 1200.0 | 0.24 | 1170.0 |
| Headlight | PMMA | 1190.0 | 0.18 | 1464.6 |
| Exterior A-pillar triangle board | PA | 930.0 | 0.30 | 1502.2 |
Table 5.
Diurnal temperature difference for different types of parts.
Table 5.
Diurnal temperature difference for different types of parts.
| Auto-Parts | Temp at 00:00 a.m./°C | Min Temp/°C | Max Temp/°C | Max Temp Difference/°C |
|---|
| Dashboard | 29.9 | 28.6 | 80.2 | 51.6 |
| Cigar lighter cover | 30.2 | 28.8 | 69.4 | 40.6 |
| Lower dashboard decoration | 30.5 | 28.9 | 62.7 | 33.8 |
Table 6.
Setting glazing transmissivity in different windows.
Table 6.
Setting glazing transmissivity in different windows.
| Window Configuration | Windshield | Side Front Window | Side Rear Window | Rear Window |
|---|
| origin | 0.88 | 0.88 | 0.88 | 0.88 |
| Project 1 | 0.68 | 0.88 | 0.88 | 0.88 |
| Project 2 | 0.88 | 0.68 | 0.88 | 0.88 |
| Project 3 | 0.88 | 0.88 | 0.68 | 0.88 |
| Project 4 | 0.88 | 0.88 | 0.88 | 0.68 |
Table 7.
Setting glazing transmissivity in different windows.
Table 7.
Setting glazing transmissivity in different windows.
| Surface Type | Emissivity/ε | Absorptivity/α | Reflectivity/ρ |
|---|
| I | 0.50 | 0.85 | 0.15 |
| II | 0.70 | 0.85 | 0.15 |
| origin | 0.90 | 0.85 | 0.15 |
| III | 0.90 | 0.65 | 0.35 |
| IV | 0.90 | 0.45 | 0.55 |
Table 8.
Setting Physical property parameters of membrane structure roof.
Table 8.
Setting Physical property parameters of membrane structure roof.
| Density/kg·m−3 | Thermal Conductivity/W/(m·K) | Specific Heat/J/(kg·K) | Reflectance | Transmittance | Thickness/mm |
|---|
| 1380 | 0.15 | 949.6 | 0.73 | 0.13 | 1.5 |
© 2020 by the authors. Licensee MDPI, Basel, Switzerland. This article is an open access article distributed under the terms and conditions of the Creative Commons Attribution (CC BY) license (http://creativecommons.org/licenses/by/4.0/).


