Article

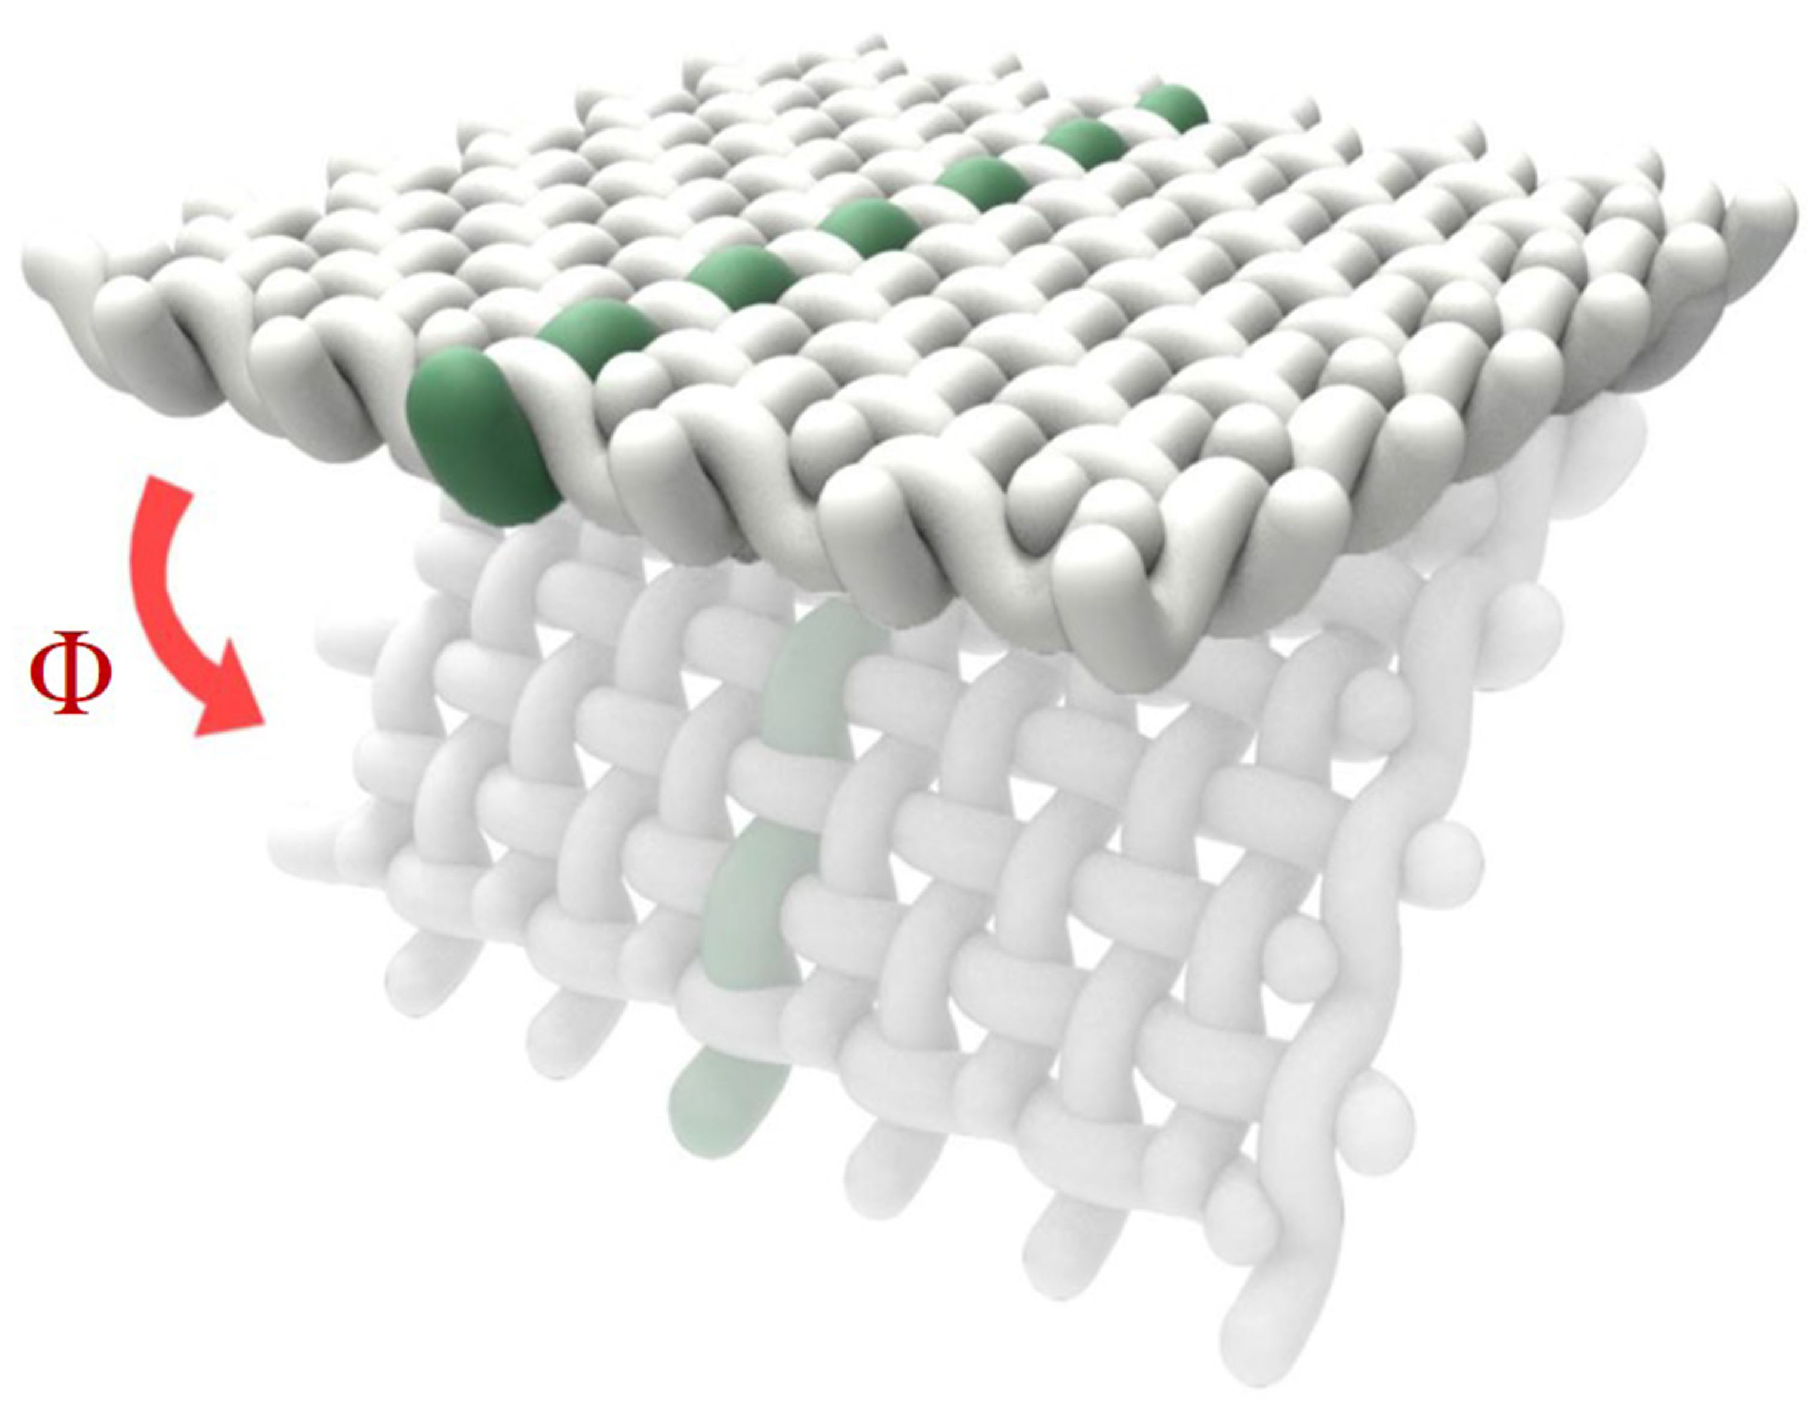
Piezoelectric Sensor with a Helical Structure on the Thread Core

1
Center for Intelligent and Interactive Robotics, Korea Institute of Science and Technology, Seoul 02792, Korea
2
Department of Electrical Engineering, Korea University, Seoul 02841, Korea
*
Author to whom correspondence should be addressed.
These authors contributed equally: Cheoleon Park and Hojoon Kim.
Appl. Sci. 2020, 10(15), 5073; https://doi.org/10.3390/app10155073
Submission received: 12 June 2020 / Revised: 15 July 2020 / Accepted: 21 July 2020 / Published: 23 July 2020
(This article belongs to the Special Issue 10th Anniversary of Applied Sciences: Invited Papers in Materials)

Abstract

:
In this paper, we introduce a piezoelectric sensor curled on a thread core in a helical structure. In particular, a polyvinylidene fluoride film was curled and fixed on a thread core. A series of experiments were designed to deliver flexural loading to the piezoelectric sensor, to study its sensing characteristics. The experimental results show that the sensing output of the sensor is in phase with the applied flexural loading. In addition, the output voltage of the textile-based piezoelectric sensor was measured according to various flexural loadings. The flexural bending angle applied to the piezoelectric sensor is expected to be a power function of the voltage output. In addition, we demonstrate a smart textile by weaving the piezoelectric sensor.

1. Introduction

Traditionally, clothing has played a major role in civilization because it helps people adapt to changing environments comfortably [1,2]. Clothing has been designed to assist the daily activities of humans with various features such as warming up the body in cold weather, protecting the body from external threats, and providing surplus room to carry necessary items [3,4,5,6].
Recent advances in electronics, wearable devices, and the Internet of things have led to the emergence of smart clothing [7,8,9,10,11]. Various types of smart clothing have been reported with the advantages of detecting the surrounding environment and protecting the human body simultaneously [12,13]. Early smart fibers for smart clothing mostly comprised bulky and complex electronic devices [14,15]. The recent ones have thread-type conductive fibers with good sensitivity and flexibility [16,17,18,19,20,21]. Smart fiber technology can be adapted to various applications such as human motion detection, real-time fitness monitoring, and human mobility pattern research [22,23,24,25,26,27,28,29,30].
Herein, we fabricate a textile-based piezoelectric sensor using polyvinylidene fluoride (PVDF), which is flexible, lightweight, and sensitive [31,32]. Specifically, the textile structure is implemented by curling PVDF with threads in a helical form. Through the helicoidal geometry, the combined sensing structure shows high stability and durability under repetitive mechanical deformation [33,34]. In addition, by using piezoelectric properties coupled with the interaction between the electrical charge and mechanical strain [35], the mechanical deformation of the sensor can be measured using the electrical response of the sensor while maintaining flexibility. Figure 1 illustrates the schematic of the textile-based piezoelectric sensor. Previous methods of fabricating textile-based piezoelectric sensors have been reported by utilizing heat-spun piezoelectric yarns [36,37]. Unlike from the previous studies, we focus on the helical combination of a film-type piezoelectric material and thread core that enables implementing fibrous characteristics with good sensing stability and durability [33]. Energy harvesters [34,38] and sensors [34] have been reported by using piezoelectric materials combined with threads in a helical structure. Unlike the previous studies, we focus on the sensing characteristic of the helical piezoelectric sensor. Specifically, we compare the repeatability and sensing characteristics of the sensor and its expanded textile form to suggest the feasibility of the proposed sensor for biometric applications.
The main contributions of this paper are as follows: (i) we present the detailed manufacturing process of the textile-based piezoelectric sensor with a helical structure, (ii) analyze the electrical properties of the sensor, and (iii) demonstrate the smart textile by weaving the piezoelectric sensor.
The remainder of this paper is organized as follows. Section 2 presents the manufacturing process of the sensor. Section 3 describes the experimental setup used to measure the electrical response of the piezoelectric sensor according to the applied flexural loading. Section 4 analyzes the sensing results of the piezoelectric sensor and smart textile. Section 5 discusses the possible applications of the proposed sensor. The conclusions are summarized in Section 6.

2. Fabrication

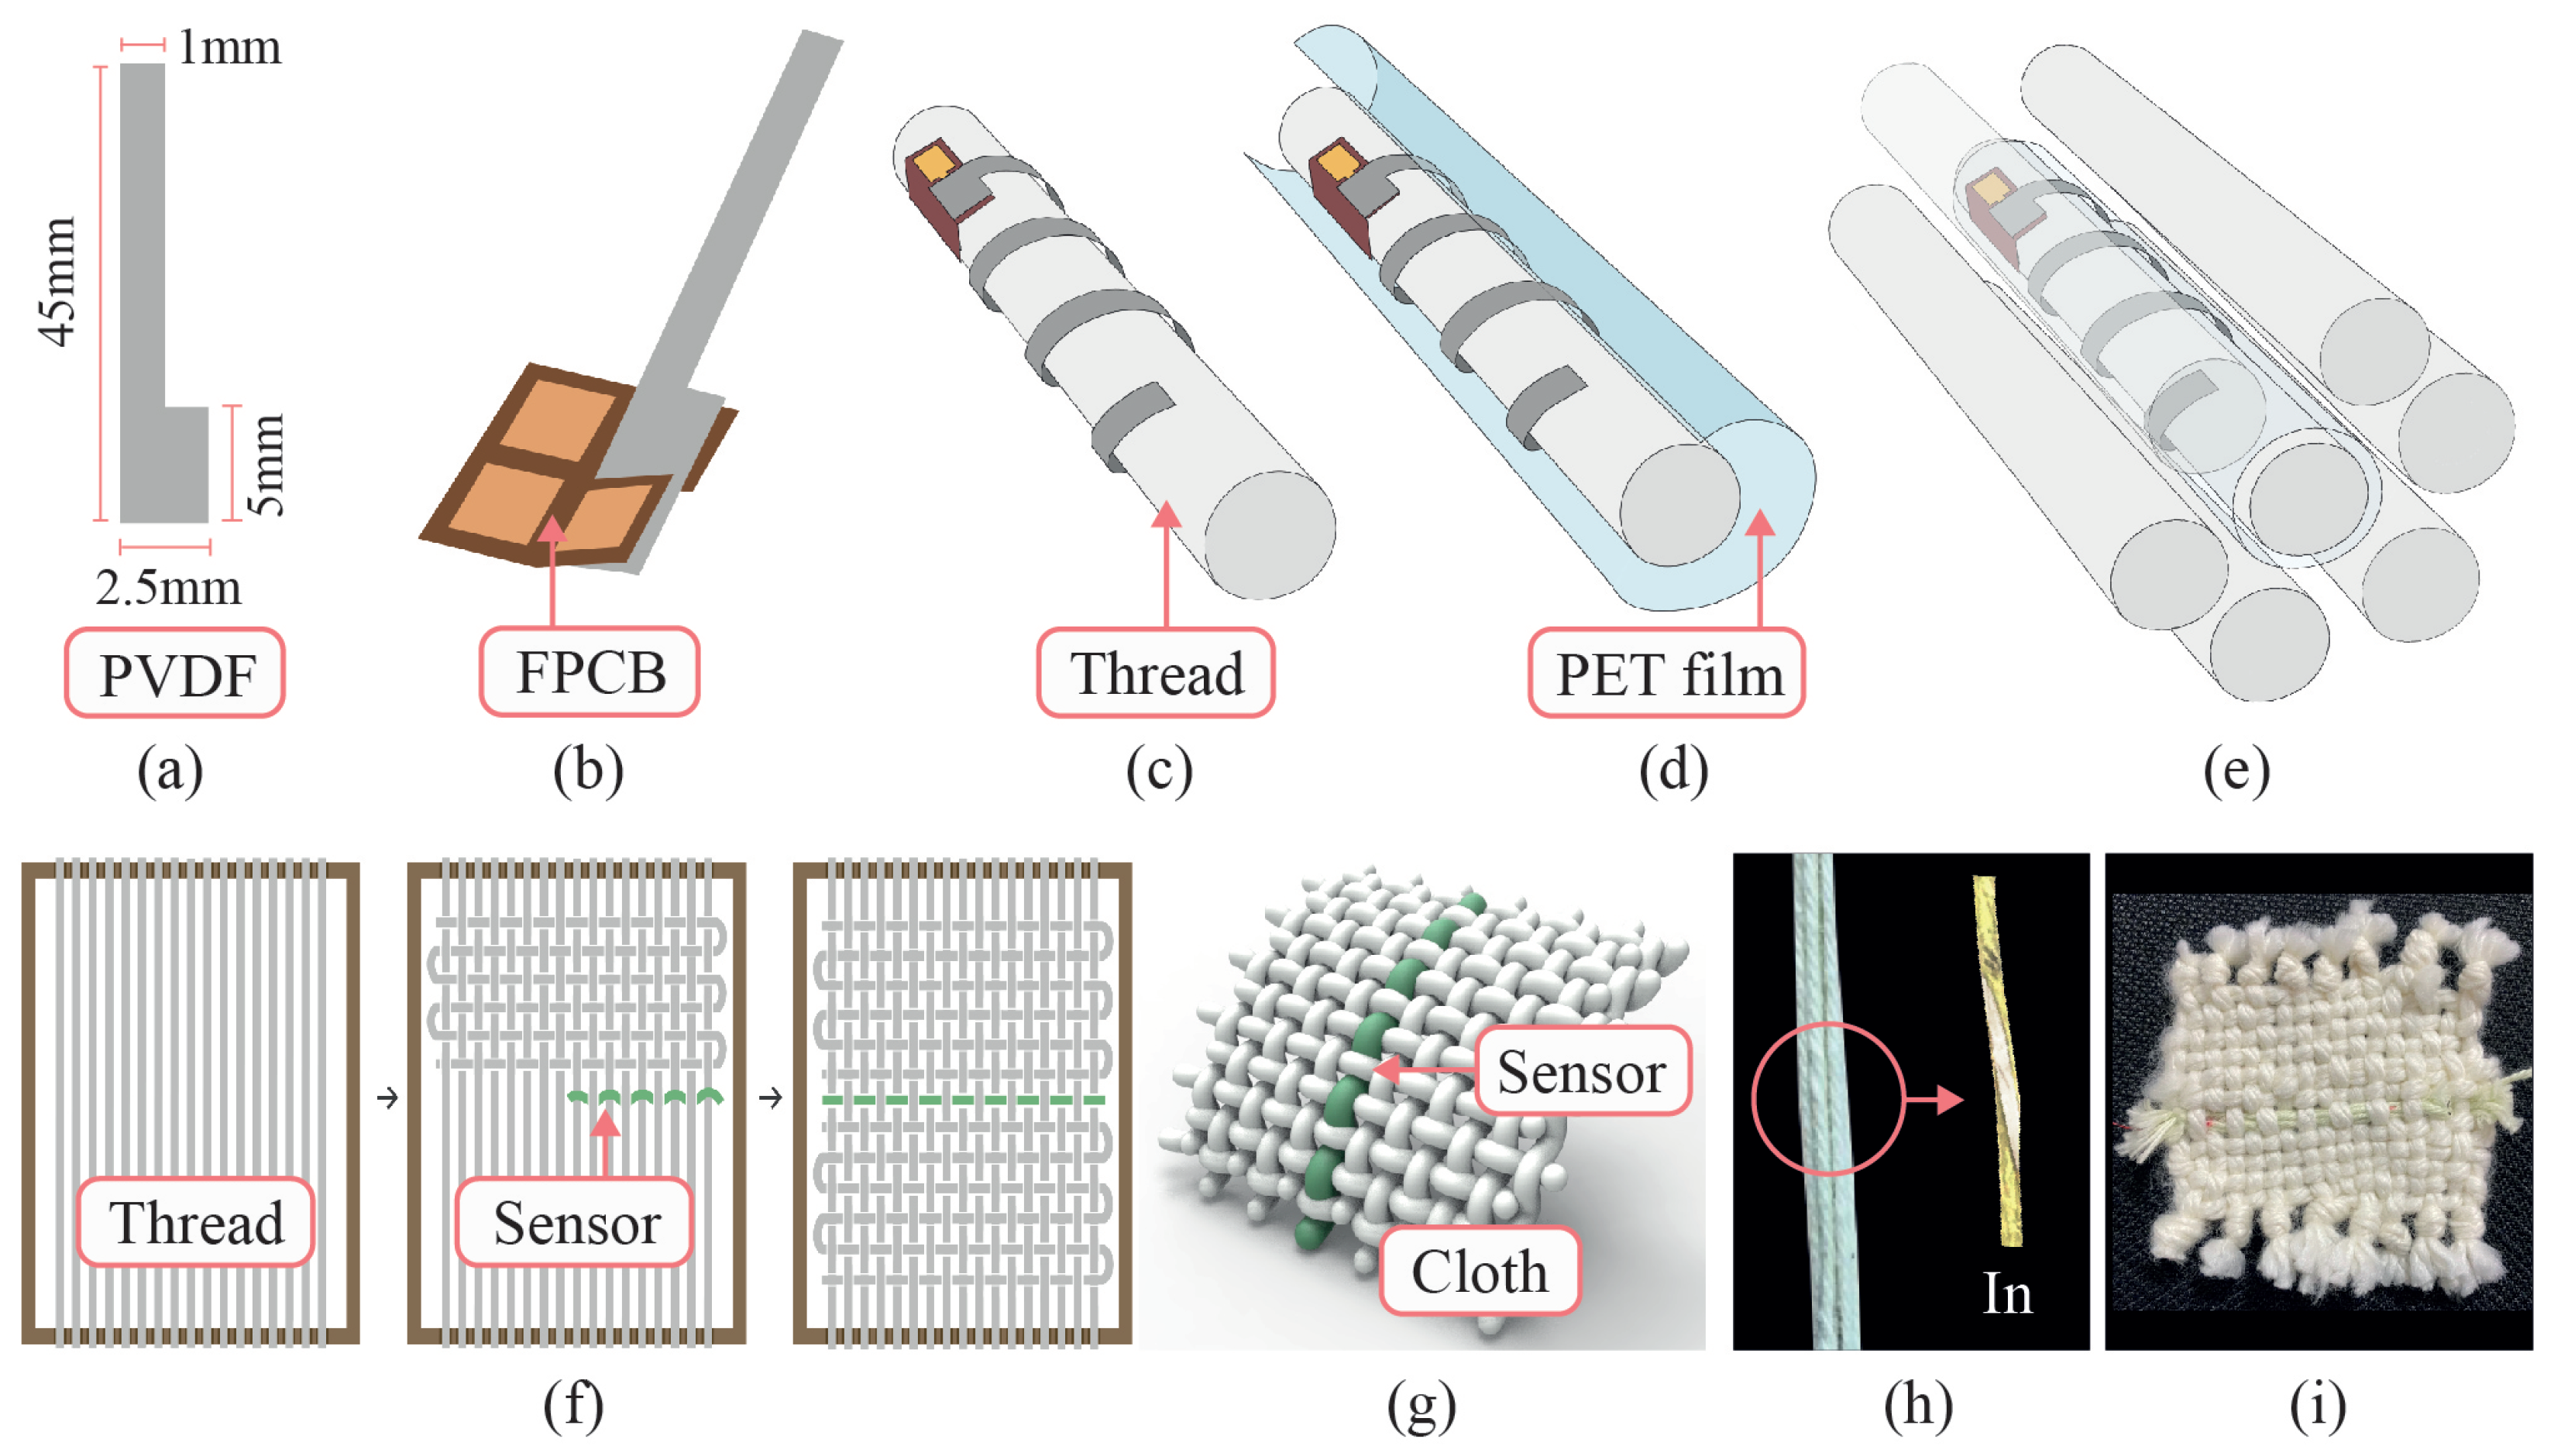
2.1. Fabrication of a Piezoelectric Sensor with a Helical Structure

We fabricated a piezoelectric sensor by attaching a PVDF film with a helical structure on a thread. Figure 2a–e show the manufacturing process of the piezoelectric sensor. A PVDF film (Measurement Specialties Inc., Hampton, VA, USA) was cut with a thickness of 28   μ m in an ax shape, as illustrated in Figure 2a. Then, a customized flexible printed circuit board (FPCB) electrode was attached to the PVDF film using a carbon conductive adhesive tape (Nisshin EM Co., Ltd., Tokyo, Japan). Specifically, the FPCB electrode was connected to a wider part of the PVDF film, as shown in Figure 2b. Then, the PVDF film was curled on a thread (length: 85   m m ; diameter: 3   m m ; cotton: 100%) as a helical structure, as depicted in Figure 2c. Then, the combined structure of the thread and the PVDF film was coated with a polyethylene terephthalate (PET) film tape (thickness: 20   μ m ; Saehan Co., Ltd., Ansan, Korea), as shown in Figure 2d. Finally, the wrapped surface was surrounded with six threads (see Figure 2e). The fabricated sensor had a thickness of 4   m m and a capacitance of 212 p F , measured by a 7 1 2 -digit graphic sampling multimeter, Keithley DMM7510 (Keithley Instruments, Cleveland, OH, USA).

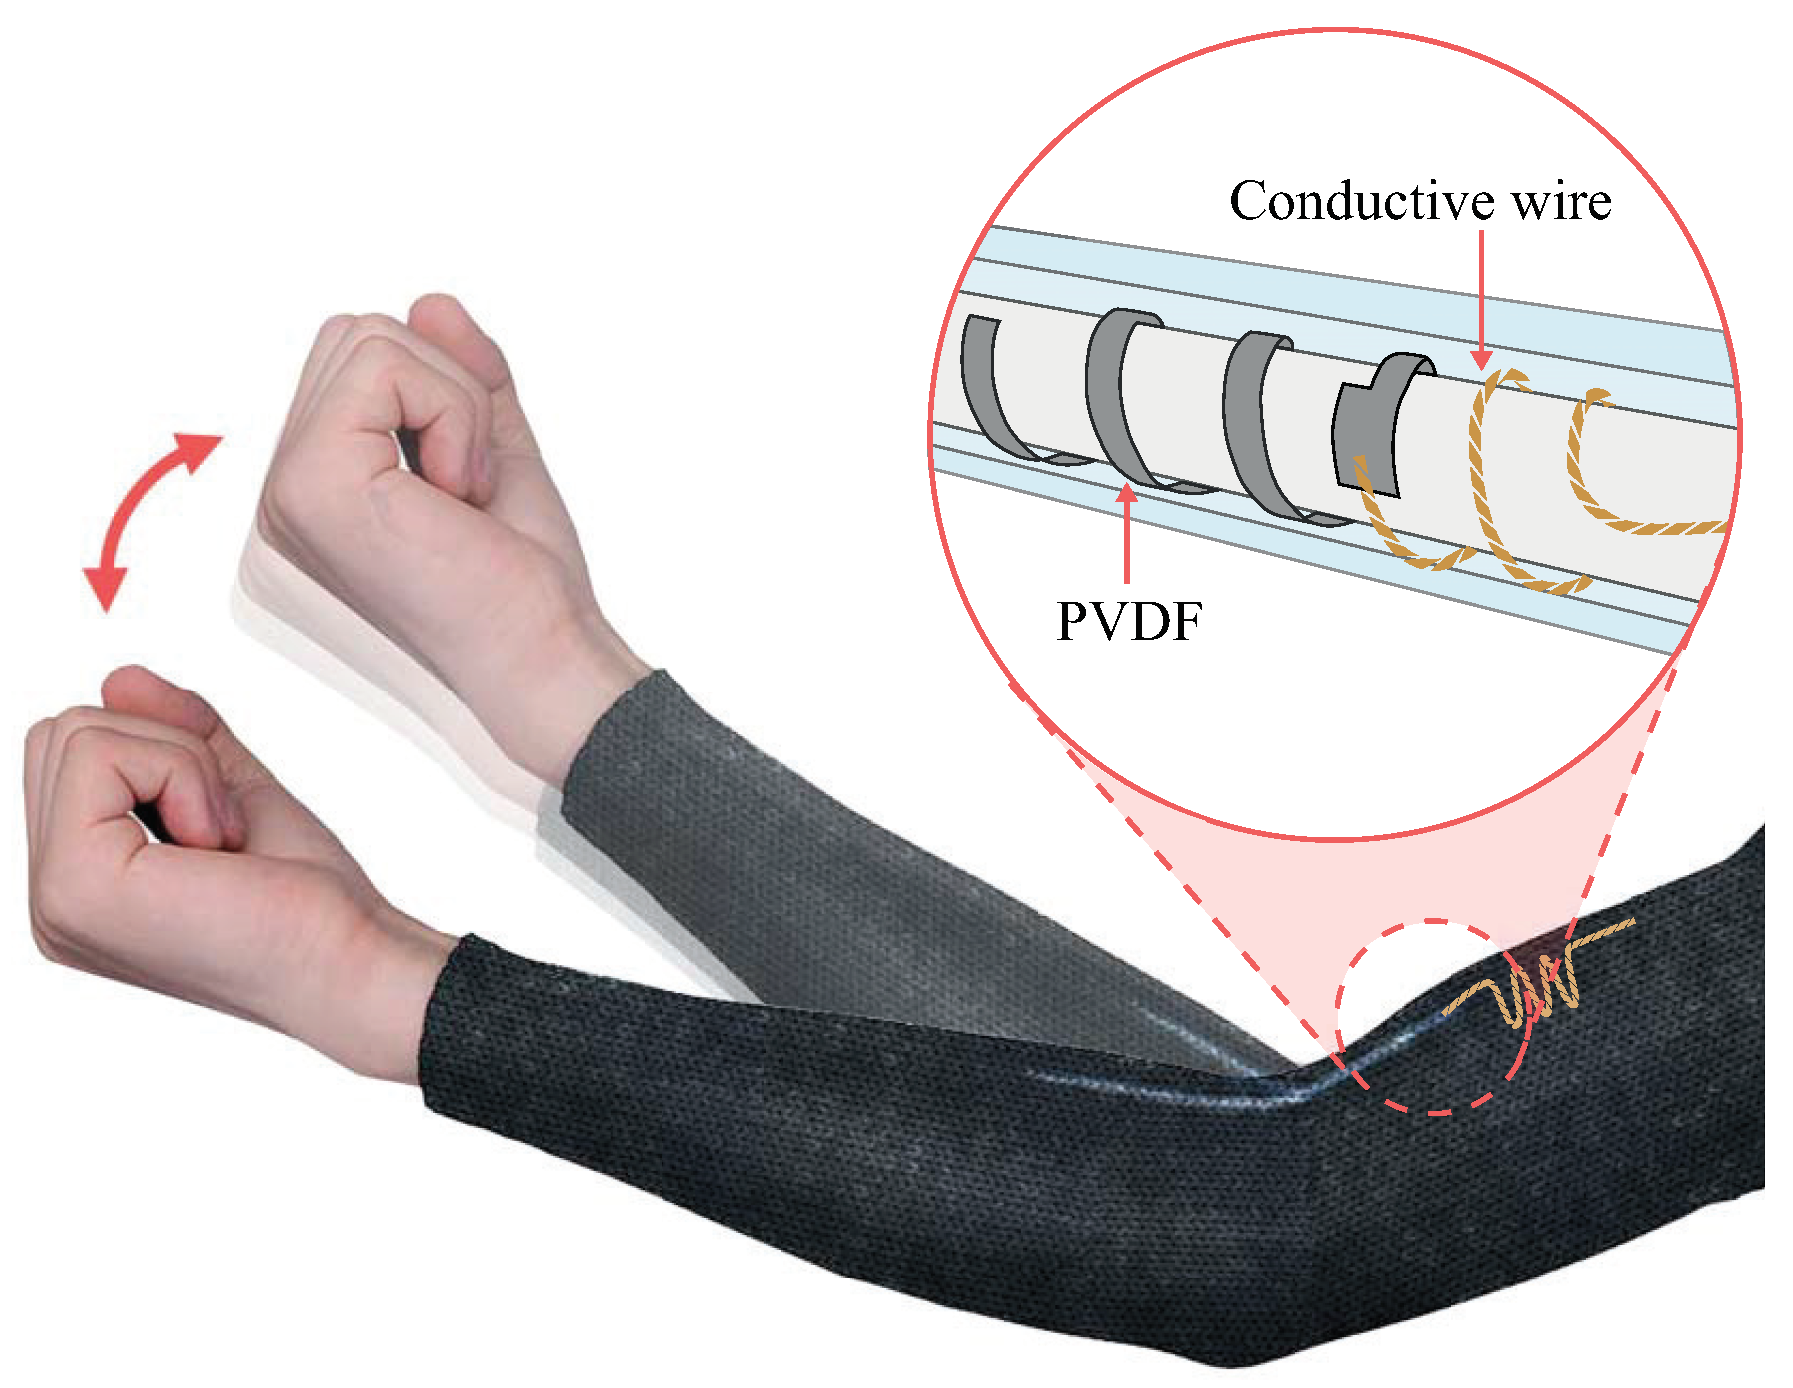
2.2. Fabrication of Smart Textiles

To demonstrate the feasibility of the sensor for use in textiles, the piezoelectric sensor was woven with other threads (length: 85 m m ; diameter: 4 m m ; wool: 90%, dry acrylic: 10%) having identical diameters and lengths as the sensor, as shown in Figure 2f. First, the white threads were hung vertically using a weaving kit, Loomini (Ziium weaving and culture co., Ltd., Gwangju, Korea). Second, the top and bottom parts of the white threads were woven horizontally. Finally, the piezoelectric sensor was woven horizontally in the middle of the textile. Figure 2g–i illustrate the schematic of the smart textile, the picture of the fabricated piezoelectric sensor, and the picture of the smart textile, respectively.

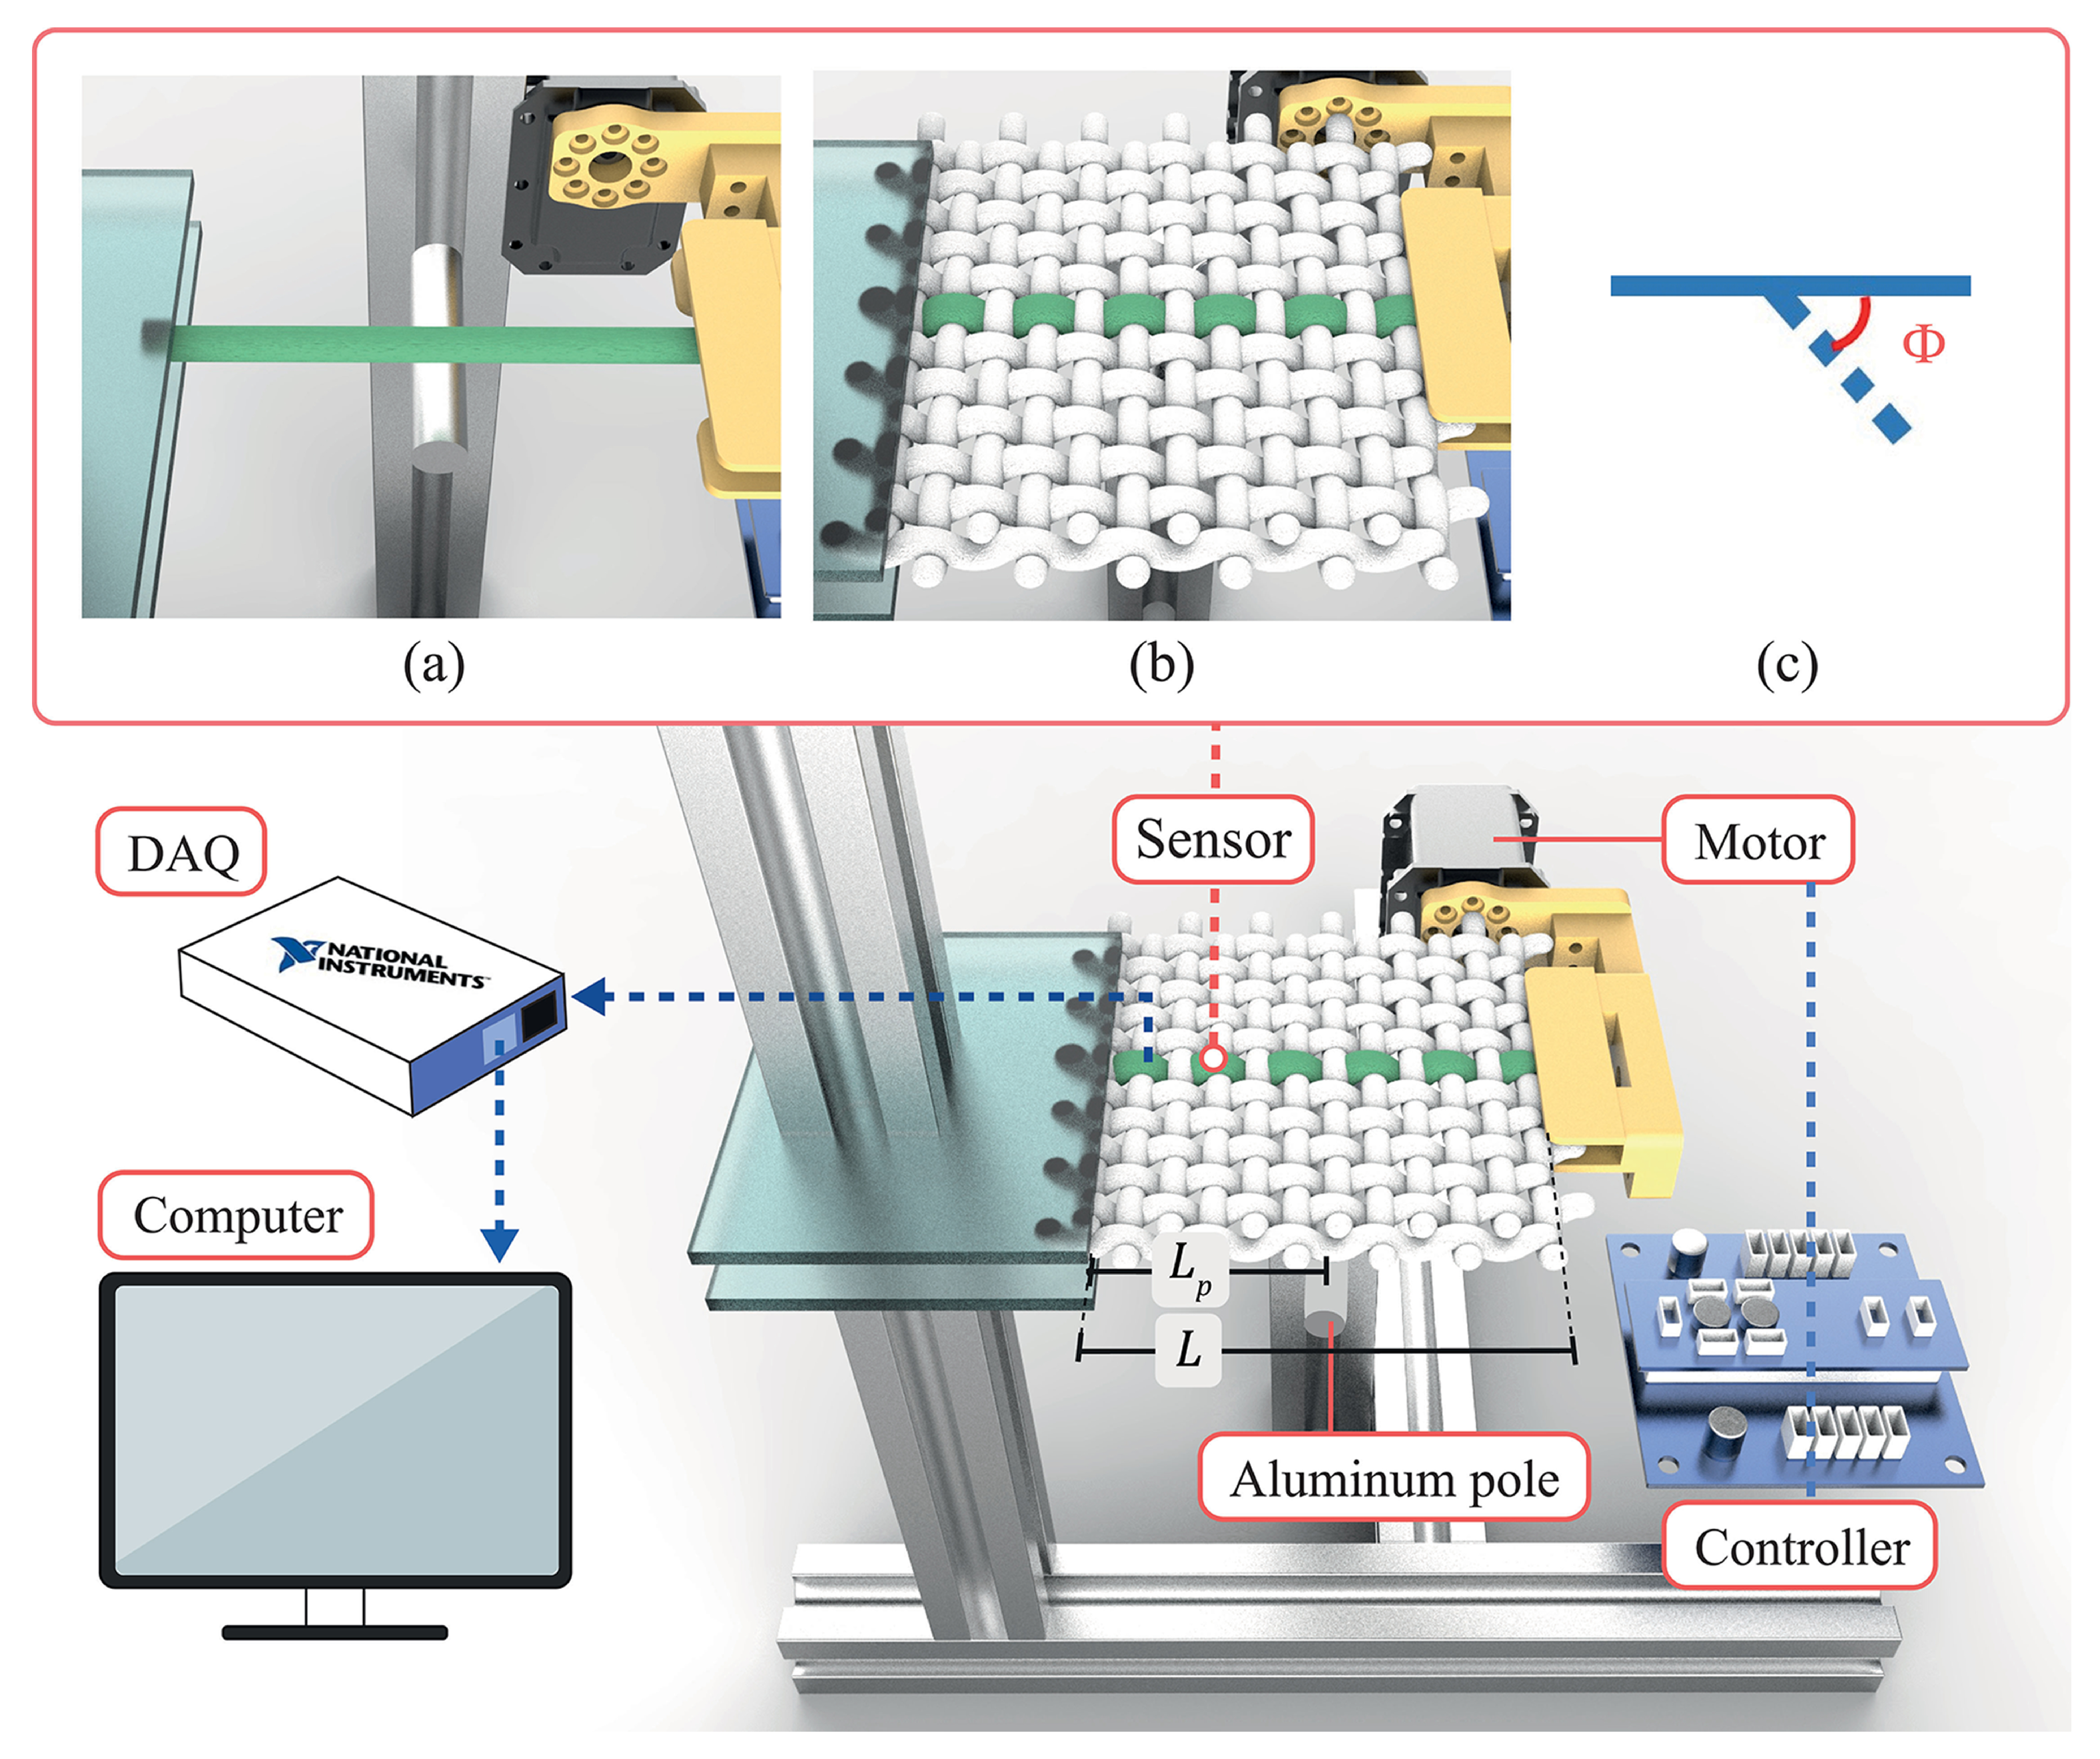
3. Experimental Setup

Figure 3 shows an experimental setup for applying flexural loadings to the piezoelectric sensor. One end of the piezoelectric sensor was fixed with acrylic brackets, and the opposite end was clamped to a 3D-printed bracket connected to a motor (Dynamixel MX-28, Robotis Co., Ltd., Seoul, Korea), as illustrated in Figure 3a. The free length L was 50   m m , excluding the clamped parts. In the test for the smart textile, the same setup was utilized, as shown in Figure 3b. Additionally, an aluminum pole (diameter: 12   m m ) was laid underneath the sensor to perform bending of the objects by the operation of the motor. The position of the aluminum pole was selected as L p = 35   m m . To operate the motor, a controller board (OpenCM 9.04-C, Robotis Co., Ltd., Korea) was utilized. Specifically, the flexural loading had one-sided movement with a bending angle Φ , as shown in Figure 3c. Herein, we utilized sinusoidal flexural loadings with the peak-to-peak bending angle, Φ 0 , ranging from 1.5° to 30°, and the operating frequency, f, ranging from 0.8 Hz to 3.0 Hz. Specifically, the experimental scope of the operating frequency was determined by considering the frequency range of human motion [39], to show the feasibility of the sensor for biometric applications. A few thousands sinusoidal flexural loadings under the experimental scope were applied to the sensor to test the durability and repeatability of the sensor. We measured the movement and performed tracking to confirm the exact loading angle from the motor. In particular, the movement was recorded at 60 fps using a digital camcorder (XC10, Canon, Japan) and processed to the bending angle using a post-processing tracking program (ProAnalyst, Xcitex). Simultaneously, the sensing outputs were measured using a data acquisition board (DAQ, NI-6211, National Instruments Corp., Austin, TX, USA) and LabVIEW 2017. A low-pass filter having a cutoff frequency of 60 Hz and band-stop filters between 40 Hz and 80 Hz and between 170 Hz and 190 Hz were implemented to remove 60 Hz noise, the coupling effect from the power supply, and the third-order harmonic noise term, respectively [40]. The input impedance of the DAQ board was 10 GΩ, which was 10 to 40 times larger than the internal impedance of the sensor in our test range. Therefore, we assumed that the measuring condition was close to the open-circuit condition.

4. Results

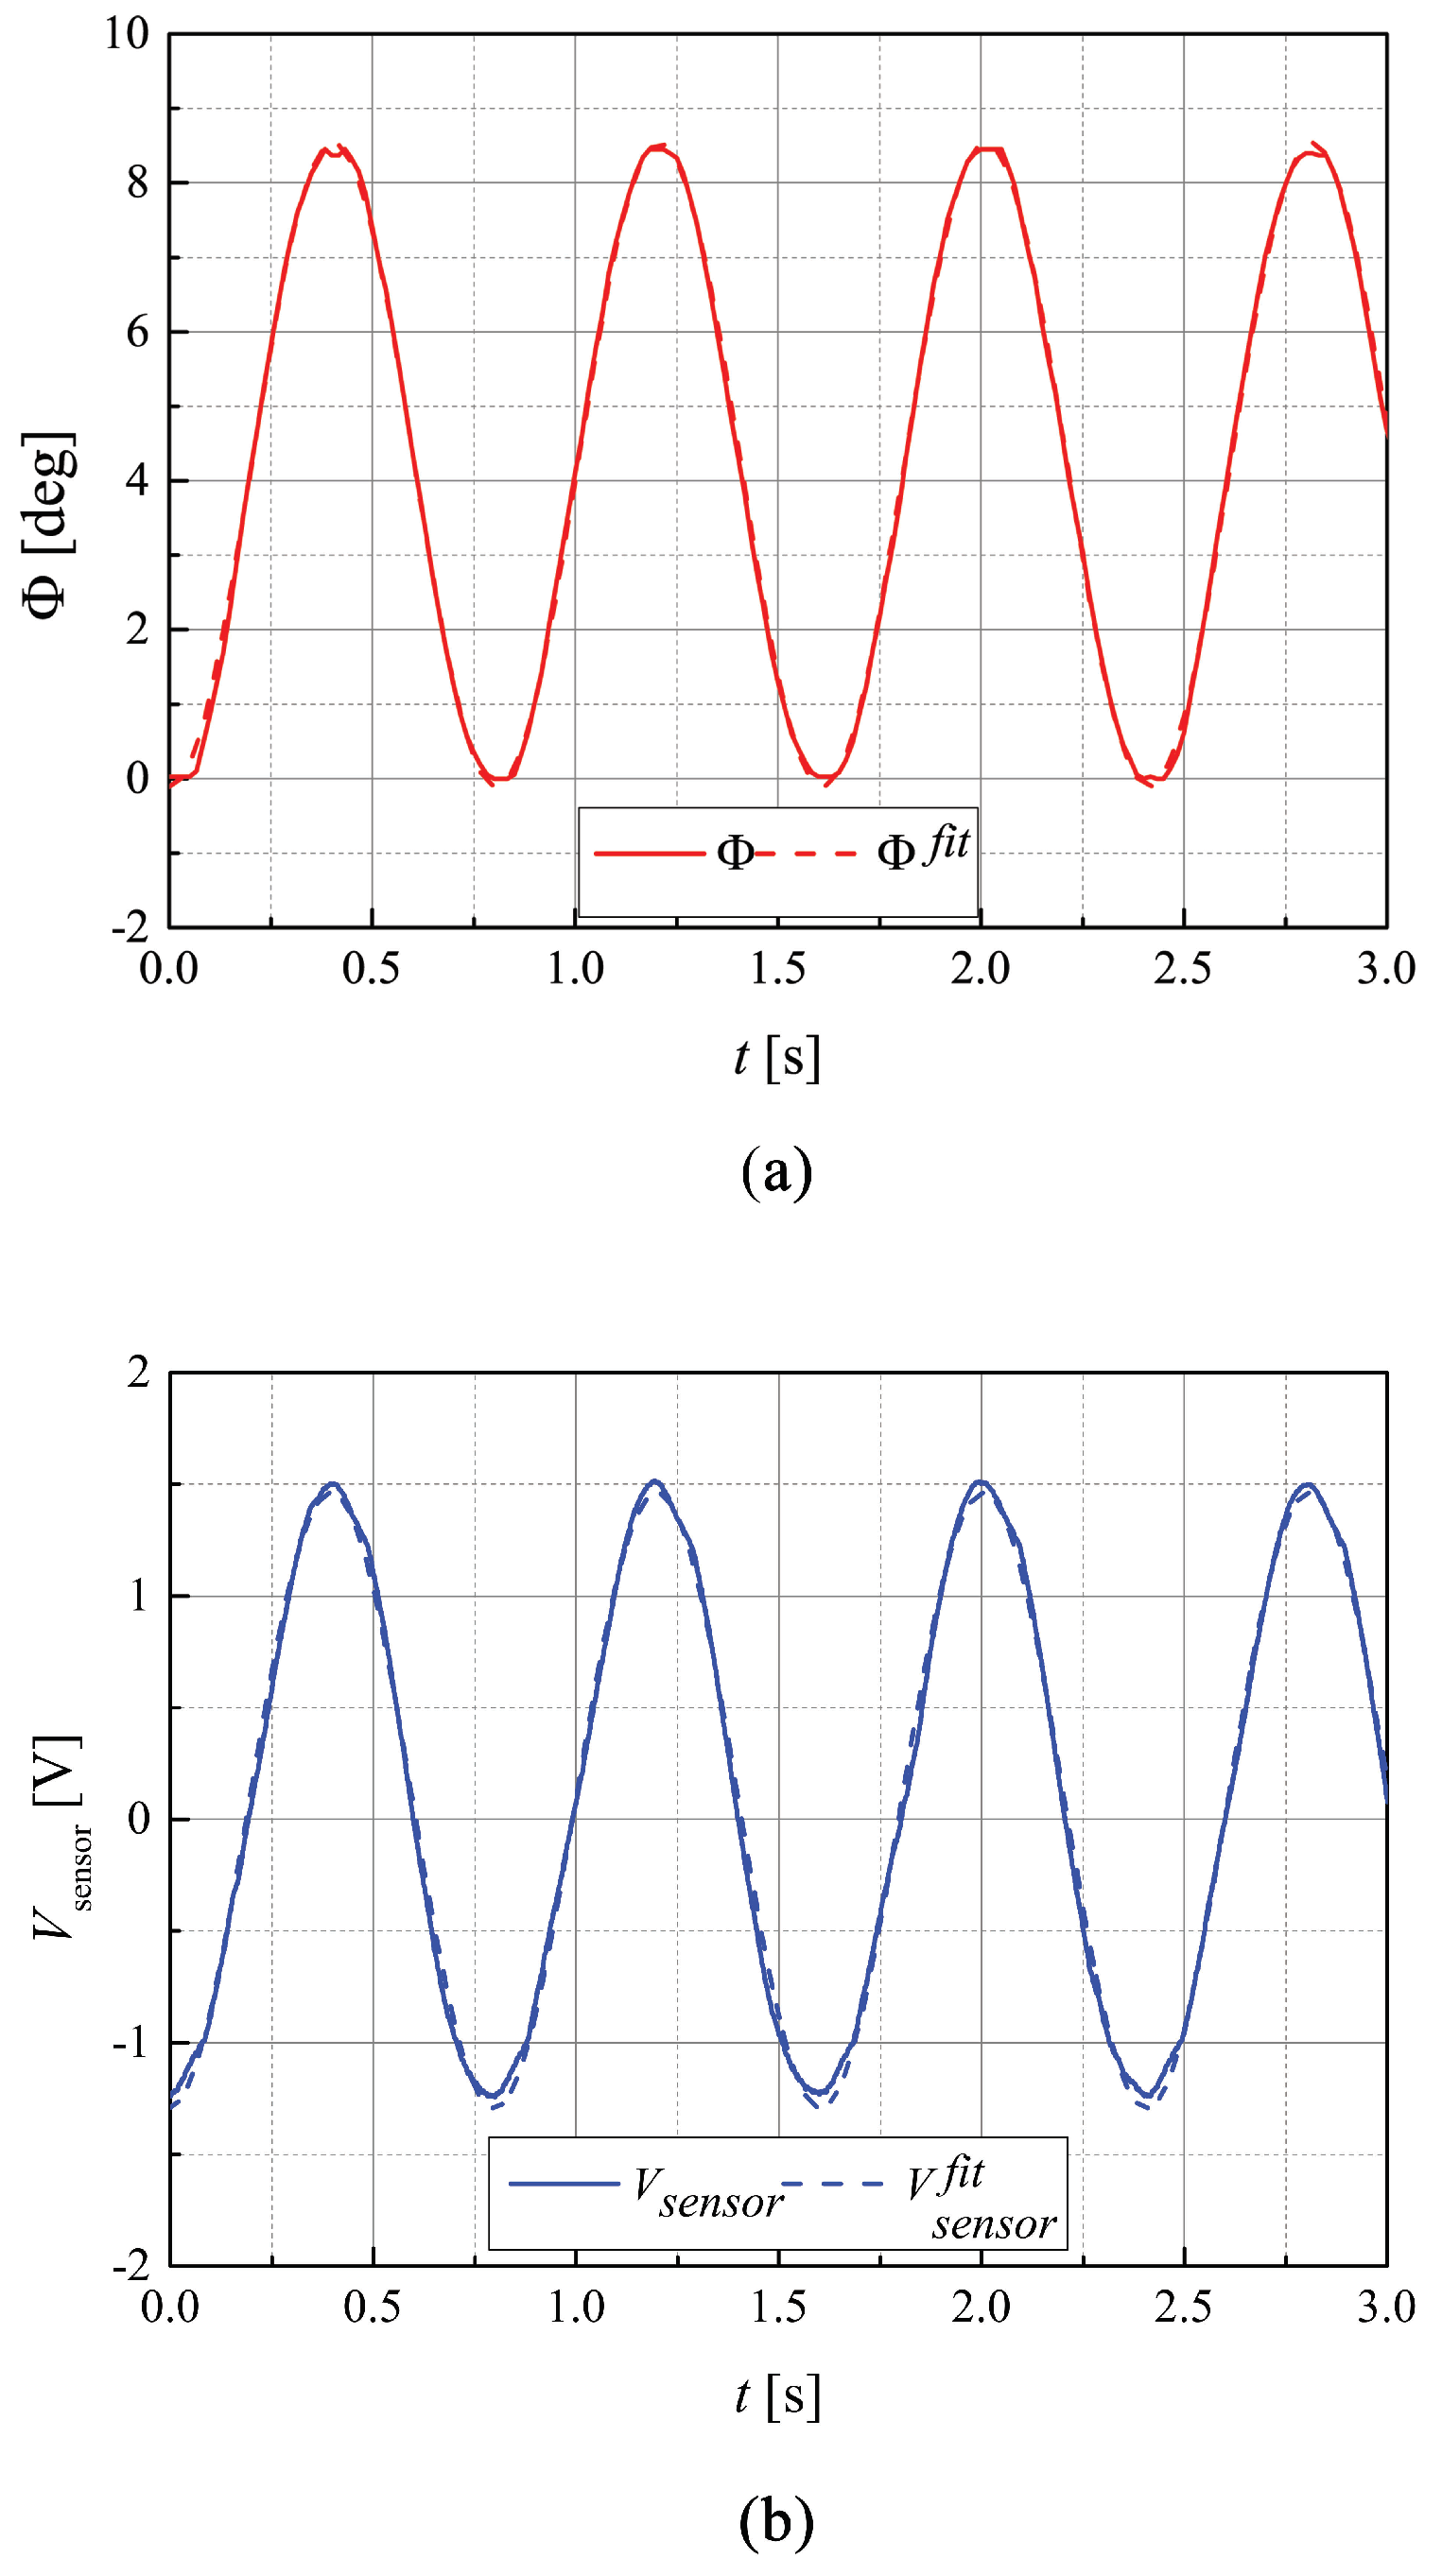
4.1. Time Trace of Sensor Output

Figure 4 shows the time trace of the flexural loading, Φ , and voltage output, V s e n s o r , at f = 1.2 Hz, simultaneously. We observed that the voltage output had the same phase as the applied flexural loading without the hysteresis. We conducted the sine fitting of the electrical response of the sensor and the bending angle, to investigate the above finding. In particular, we used the MATLAB function “fit”. The sine-fitted results of V s e n s o r and Φ were in good match with the R-squared values of 0.9967 and 0.9978, respectively. Thus, they were represented through the sine-fitted results. The obtained peak-to-peak voltage of the sensing output was 2.7 V when a peak-to-peak bending angle of Φ 0 = 8.6° was applied. Additionally, Φ and V s e n s o r were approximately in phase with a phase difference of 4°. We comment that the phase difference may have resulted from the limitation of the camera recording rate. In addition, we observed the same trend under other conditions. Therefore, the voltage output of the piezoelectric sensor had an identical phase to the applied flexural loading.

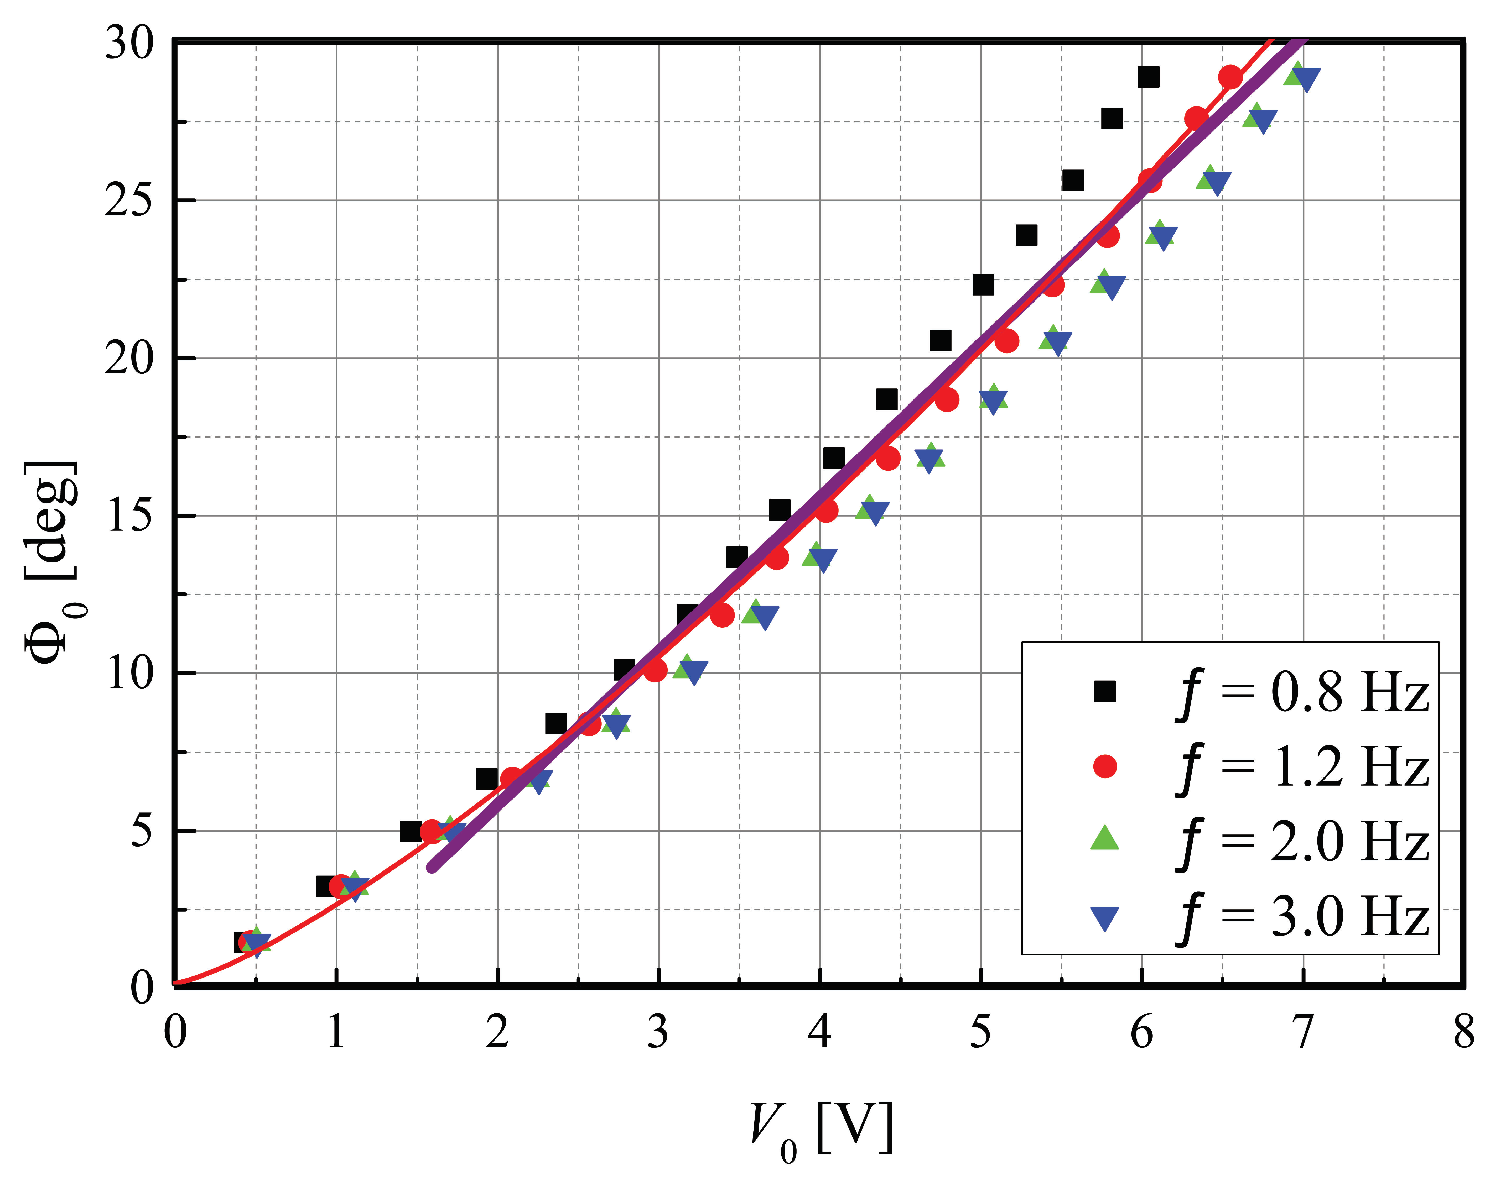
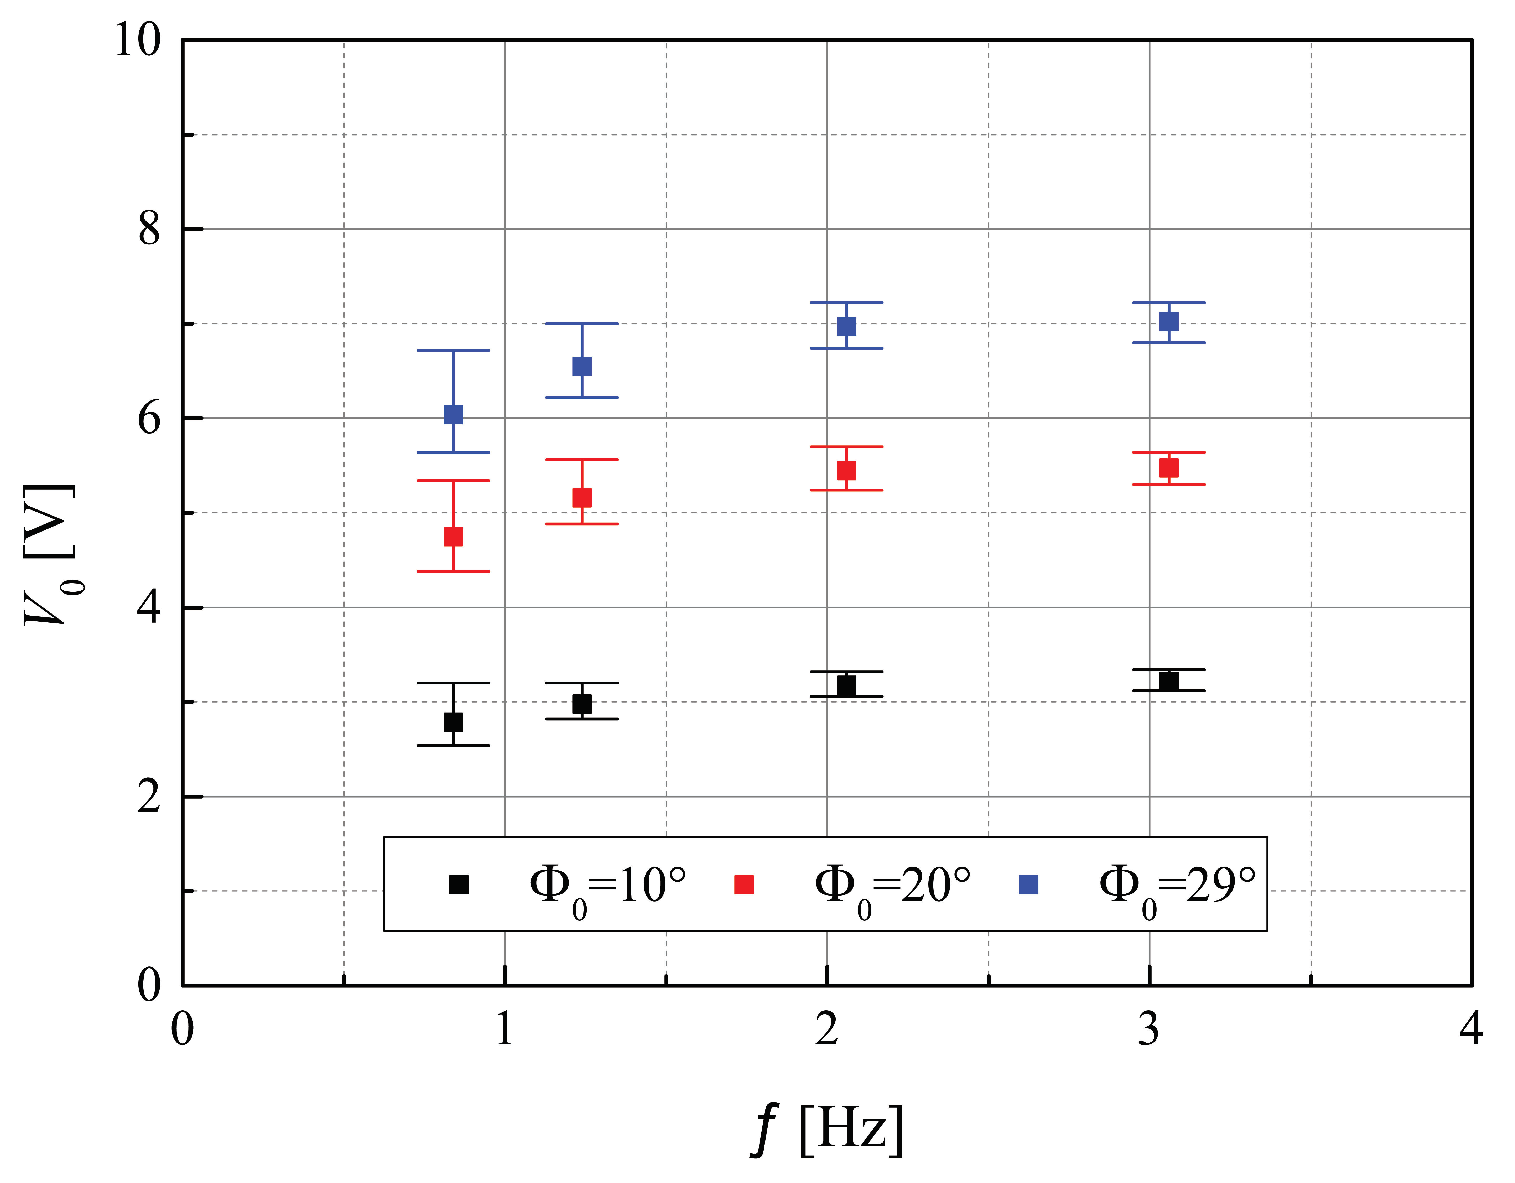
4.2. Output Voltage of the Sensor According to Bending Input Variation

We investigated the sensing response of the piezoelectric sensor with variations in Φ 0 . Flexural loadings with varying Φ 0 at the nominal frequencies of 0.8, 1.2, 2, and 3 Hz were applied to the piezoelectric sensor. Specifically, Φ 0 was increased from 1.5° to 30°, and each experiment was repeated five times. We utilized the average value of the peak-to-peak voltages, V 0 , from the repetitive experiments. Figure 5 shows Φ 0 with respect to V 0 . Therein, the plotted values are not nominal, but measured. We conducted the power fitting of Φ 0 according to V 0 , at f = 1.2 Hz, to study the Φ 0 V 0 relation of the piezoelectric sensor; that is,
Φ 0 = ψ V 0 η
where ψ and η indicate the gain and exponent of the Φ 0 V 0 relation, respectively. The fitted Φ 0 V 0 relation for the sensor had ψ of 2.47 and η of 1.29 and was consistent with the experimental result with an R-squared value of 0.998. Based on the fitted result, the bending angle applied to the sensor could be predicted by observing the peak-to-peak voltage of the piezoelectric sensor with good precision. To study the sensitivity and resolution of the proposed sensor, we linearly fitted Φ 0 having a range from 5° to 29° according to V 0 . The fitted result showed high resemblance to the experimental result with an R-squared value of 0.9931. Herein, the piezoelectric sensor had a sensitivity of 4.874°/V. Additionally, considering the ADC (analog-to-digital converter) of the DAQ board (± 10 V range and 16 bit channel), the sensor had a resolution of 1.5 × 10 3 °.
We additionally investigated the sensing response of the sensor according to various operating frequencies. Flexural loadings were applied with the operating frequencies ranging from 0.8 Hz to 3 Hz at Φ 0 of 10°, 20°, and 29°. Figure 6 shows the peak-to-peak output voltage according to the operating frequency. The peak-to-peak voltage outputs remained approximately constant with a maximum difference of 14% according to the frequency shift. Specifically, when flexural loadings having a frequency of 0.8 Hz were applied to the sensor, the peak-to-peak voltage output of the sensor had a smaller amplitude than when flexural loadings having higher frequencies were applied. We note that the difference of peak-to-peak voltage was due to the larger internal impedance of the sensor at a lower frequency, which resulted in a more imperfect open-circuit condition.

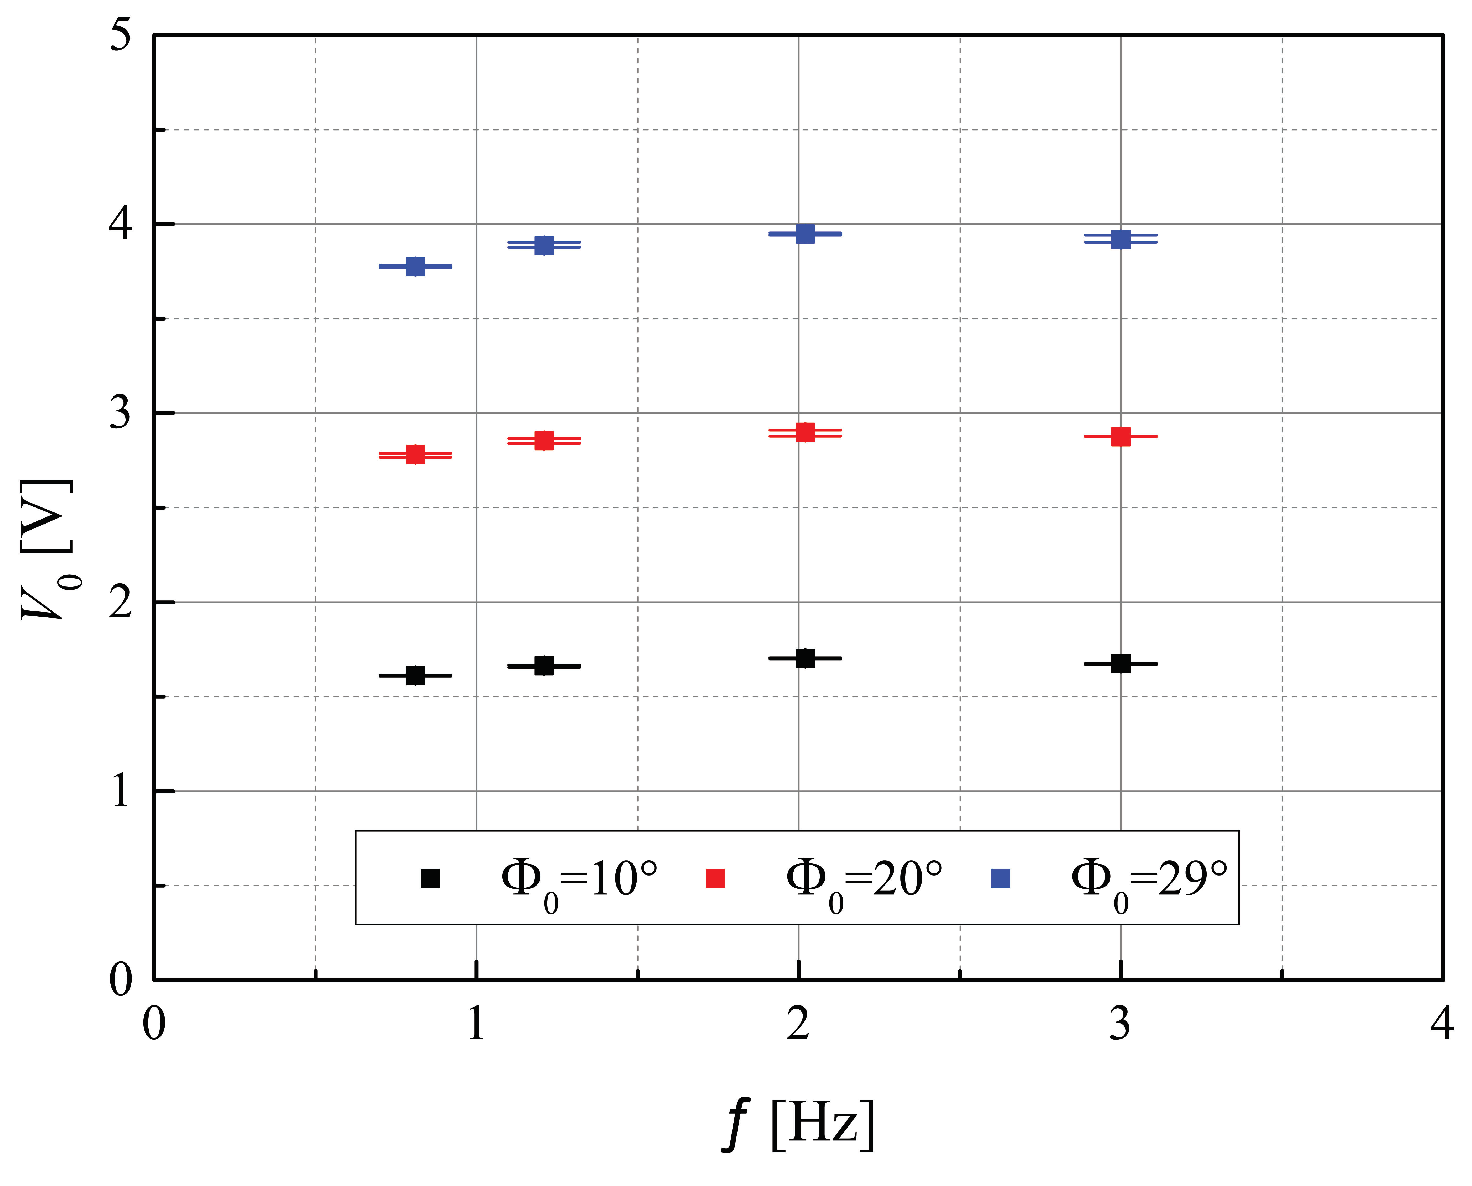
4.3. Output Voltage of the Smart Textile According to Bending Input Variation

First, the electrical response of the smart textile was investigated with a change in Φ . Flexural loadings were applied to the smart textile under identical conditions of the piezoelectric sensor. Figure 7 shows the relationship between the sensor output voltage and the bending angle. The Φ 0 V 0 relation of the smart textile was also modeled with the power function using Equation (1) and had ψ of 5.354 and η of 1.263. The modeled result showed high resemblance to the experimental result, with an R-squared value of 0.9981. Thus, the flexural loading applied to the smart textile can also be predicted by the power function. The results indicated that the sensing output of the piezoelectric sensor had a higher voltage level compared with the sensing output of the smart textile under the same flexural loading. This can be attributed to the fact that the surrounding threads of the smart textiles might undermine the strain applied to the sensor. The sensitivity and resolution of the smart textile were also studied under an identical dynamic range with the textile-based piezoelectric sensor, that is when flexural loadings having a range of 5° Φ 0 29 ° were applied to the smart textile. The experimental result of the smart textile under the dynamic range showed a good match with the linearly fitted result with an R-squared value of 0.9971. Additionally, the sensitivity and resolution of smart textile were 8.501°/V and 2.6 × 10 3 °, respectively.
In addition, we observed the electrical response of the smart textile according to the variation in the operating frequency. Figure 8 shows the peak-to-peak voltage of the smart textile according to the operating frequency. Therein, the variation in frequency also had no effect. The maximum difference with the variation in the frequency was 3%. We believe that the woven structure surrounding the sensor acted as a damping system [41], resulting in stabilizing the sensing output of the smart textile.

5. Discussion

To suggest the possible applications of the proposed sensor, a concept schematic of the sensor woven to clothing measuring the joint angle of the elbow is introduced in Figure 9. Through the output voltage of the woven sensor, elbow flexion and extension can be measured. In addition, the proposed sensor can be better adapted to clothing in textile form by utilizing electric connections such as conductive wires [42] or printed electrodes [43]. Piezoelectric materials have been widely adapted to measure biometric signals from humans’ daily activity of living. For example, biometric signals such as walking motion [44] and hand motion [45] are measured through piezoelectric materials. Unlike the previous studies, the proposed sensor is capable of measuring biometric signals such as joint angles of humans with better comfortability and repeatability without external pockets. Additionally, by utilizing an interface board reported in the previous study [46], the proposed sensor can be developed for a real-time joint angle measuring system without an extra measuring system. In future work, we will focus on the electrical response of the textile-based piezoelectric sensor according to coupled flexural–torsional loading. We hope that the sensor structure can be adapted to a variety of fields that require smart clothing such as biometrics [23,25] and health monitoring [44,47,48,49].

6. Conclusions

In this paper, we proposed a textile-based piezoelectric sensor with a helical structure as a platform for smart clothing. The piezoelectric sensor was fabricated by curling a thin PVDF film on a cotton thread in a helical structure. Then, by weaving the piezoelectric sensor with another thread, the structure was adapted to the smart textile.
An experimental setup to apply sinusoidal flexural loading was constructed to study the electrical characteristics of the sensor and smart textile. The sensor was in phase with the applied flexural loading. We conducted power fitting of the bending angles with respect to the voltages to model the Φ 0 V 0 relation. The fitting results were consistent with the experimental results. Additionally, the output voltages of the sensors were not dependent on the operating frequency. The electrical properties of the sensor and smart textile were compared according to various flexural loadings. Under an identical flexural loading, the sensor had a larger voltage output than the smart textile.

Author Contributions

C.P. performed the experiment. C.P. and H.K. contributed to the setup of the experiment. C.P., H.K., and Y.C. analyzed the data and wrote the paper. All authors read and agreed to the published version of the manuscript.

Funding

This work was supported by the Korea Institute of Science and Technology flagship program (Project No. 2E30280).

Acknowledgments

The authors gratefully thank Chaewon Oh for supporting us with drawing the schematics.

Conflicts of Interest

The authors declare no conflict of interest.

Abbreviations

The following abbreviations are used in this manuscript:
ADCAnalog-to-digital converter
DAQData acquisition
FPCBFlexible printed circuit board
PETPolyethylene terephthalate
PVDFPolyvinylidene fluoride

References

  1. Evans, A.M. Fashionable Females: Women, Clothes, and Culture in New York. Comp. Am. Stud. Int. J. 2013, 11, 361–373. [Google Scholar] [CrossRef]
  2. Hurlock, E.B. The Psychology of Dress: An Analysis of Fashion and Its Motive; The Ronald Press Company: New York, NY, USA, 1929. [Google Scholar]
  3. Liu, K.; Wang, J.; Zhu, C.; Hong, Y. Development of upper cycling clothes using 3D-to-2D flattening technology and evaluation of dynamic wear comfort from the aspect of clothing pressure. Int. J. Cloth. Sci. Technol. 2016, 28, 736–749. [Google Scholar] [CrossRef]
  4. Pugh, L. Clothing insulation and accidental hypothermia in youth. Nature 1966, 209, 1281–1286. [Google Scholar] [CrossRef] [PubMed]
  5. Zhong, Y.; Zhang, F.; Wang, M.; Gardner, C.J.; Kim, G.; Liu, Y.; Leng, J.; Jin, S.; Chen, R. Reversible humidity sensitive clothing for personal thermoregulation. Sci. Rep. 2017, 7, 44208. [Google Scholar] [CrossRef] [Green Version]
  6. Morley, J.; Beauchamp, G.; Suyama, J.; Guyette, F.X.; Reis, S.E.; Callaway, C.W.; Hostler, D. Cognitive function following treadmill exercise in thermal protective clothing. Eur. J. Appl. Physiol. 2012, 112, 1733–1740. [Google Scholar] [CrossRef] [PubMed]
  7. McCann, J.; Bryson, D. Smart Clothes and Wearable Technology; Elsevier: Amsterdam, The Netherlands, 2009. [Google Scholar]
  8. Axisa, F.; Schmitt, P.M.; Gehin, C.; Delhomme, G.; McAdams, E.; Dittmar, A. Flexible technologies and smart clothing for citizen medicine, home healthcare, and disease prevention. IEEE Trans. Inf. Technol. Biomed. 2005, 9, 325–336. [Google Scholar] [CrossRef] [PubMed]
  9. Cho, G.; Lee, S.; Cho, J. Review and reappraisal of smart clothing. Int. J. Hum. Comput. Interact. 2009, 25, 582–617. [Google Scholar] [CrossRef]
  10. Mohammed, A.; Seeam, A.; Bellekens, X.; Nieradzinska, K.; Ramsurrun, V. Gesture based IOT light control for smart clothing. In Proceedings of the 2016 IEEE International Conference on Emerging Technologies and Innovative Business Practices for the Transformation of Societies (EmergiTech), Balaclava, Mauritius, 3–6 August 2016; pp. 139–142. [Google Scholar]
  11. Yang, J.; Zhou, J.; Tao, G.; Alrashoud, M.; Al Mutib, K.N.; Al-Hammadi, M. Wearable 3.0: From Smart Clothing to Wearable Affective Robot. IEEE Netw. 2019, 33, 8–14. [Google Scholar] [CrossRef]
  12. Rantanen, J.; ImpioĘ, J.; Karinsalo, T.; Malmivaara, M.; Reho, A.; Tasanen, M.; Vanhala, J. Smart clothing prototype for the arctic environment. Pers. Ubiquitous Comput. 2002, 6, 3–16. [Google Scholar] [CrossRef]
  13. Chen, M.; Ma, Y.; Song, J.; Lai, C.F.; Hu, B. Smart clothing: Connecting human with clouds and big data for sustainable health monitoring. Mob. Netw. Appl. 2016, 21, 825–845. [Google Scholar] [CrossRef]
  14. Yama, Y.; Ueno, A.; Uchikawa, Y. Development of a wireless capacitive sensor for ambulatory ECG monitoring over clothes. In Proceedings of the 2007 29th Annual International Conference of the IEEE Engineering in Medicine and Biology Society, Lyon, France, 22–26 August 2007. [Google Scholar]
  15. Hertleer, C.; Rogier, H.; Van L, L. Design of textile antennas for smart clothing. In Proceedings of the 7th UGent PhD Symposium, Lodz, Poland, 29 November 2006. [Google Scholar]
  16. Wang, J.; Li, X.; Zi, Y.; Wang, S.; Li, Z.; Zheng, L.; Yi, F.; Li, S.; Wang, Z.L. A Flexible Fiber-Based Supercapacitor–Triboelectric-Nanogenerator Power System for Wearable Electronics. Adv. Mater. 2015, 27, 4830–4836. [Google Scholar] [CrossRef] [PubMed]
  17. Chen, X.; Song, Y.; Su, Z.; Chen, H.; Cheng, X.; Zhang, J.; Han, M.; Zhang, H. Flexible fiber-based hybrid nanogenerator for biomechanical energy harvesting and physiological monitoring. Nano Energy 2017, 38, 43–50. [Google Scholar] [CrossRef]
  18. Weng, W.; Chen, P.; He, S.; Sun, X.; Peng, H. Smart electronic textiles. Angew. Chem. Int. Ed. 2016, 55, 6140–6169. [Google Scholar] [CrossRef] [PubMed]
  19. Cherenack, K.; van Pieterson, L. Smart textiles: Challenges and opportunities. J. Appl. Phys. 2012, 112, 091301. [Google Scholar] [CrossRef] [Green Version]
  20. Ruppert-Stroescu, M.; Balasubramanian, M. Effects of stitch classes on the electrical properties of conductive threads. Text. Res. J. 2018, 88, 2454–2463. [Google Scholar] [CrossRef]
  21. Harnett, C.K.; Zhao, H.; Shepherd, R.F. Stretchable Optical Fibers: Threads for Strain-Sensitive Textiles. Adv. Mater. Technol. 2017, 2, 1700087. [Google Scholar] [CrossRef]
  22. Ryu, S.; Lee, P.; Chou, J.B.; Xu, R.; Zhao, R.; Hart, A.J.; Kim, S. Extremely elastic wearable carbon nanotube fiber strain sensor for monitoring of human motion. ACS Nano 2015, 9, 5929–5936. [Google Scholar] [CrossRef] [PubMed]
  23. Deng, Z.; Hu, T.; Lei, Q.; He, J.; Ma, P.X.; Guo, B. Stimuli-responsive conductive Nanocomposite hydrogels with high Stretchability, self-healing, adhesiveness, and 3D printability for human motion sensing. ACS Appl. Mater. Interfaces 2019, 11, 6796–6808. [Google Scholar] [CrossRef]
  24. Imani, S.; Bandodkar, A.J.; Mohan, A.V.; Kumar, R.; Yu, S.; Wang, J.; Mercier, P.P. A wearable chemical–electrophysiological hybrid biosensing system for real-time health and fitness monitoring. Nat. Commun. 2016, 7, 1–7. [Google Scholar] [CrossRef]
  25. Cha, Y.; Chung, J.; Hur, S. Torsion sensing on a cylinder using a flexible piezoelectric wrist band. IEEE/ASME Trans. Mechatron. 2019, 25, 460–467. [Google Scholar] [CrossRef]
  26. Zhong, J.; Zhong, Q.; Hu, Q.; Wu, N.; Li, W.; Wang, B.; Hu, B.; Zhou, J. Stretchable self-powered fiber-based strain sensor. Adv. Funct. Mater. 2015, 25, 1798–1803. [Google Scholar] [CrossRef]
  27. Dziuda, L.; Skibniewski, F.W.; Krej, M.; Lewandowski, J. Monitoring respiration and cardiac activity using fiber Bragg grating-based sensor. IEEE Trans. Biomed. Eng. 2012, 59, 1934–1942. [Google Scholar] [CrossRef] [PubMed]
  28. Du, B.; Yang, D.; She, X.; Yuan, Y.; Mao, D.; Jiang, Y.; Lu, F. MoS2-based all-fiber humidity sensor for monitoring human breath with fast response and recovery. Sens. Actuators B Chem. 2017, 251, 180–184. [Google Scholar] [CrossRef]
  29. Tajitsu, Y. Smart piezoelectric fabric and its application to control of humanoid robot. Ferroelectrics 2016, 499, 36–46. [Google Scholar] [CrossRef]
  30. Yan, M.; Yuan, X.; Zhang, Y.; Zhang, S.; Wang, X.; Gao, F.; Zhou, K.; Zhang, D. Investigation of shear piezoelectric fiber composite for flexible sensor application. Smart Mater. Struct. 2019, 28, 125015. [Google Scholar] [CrossRef]
  31. Choi, S.; Jiang, Z. A novel wearable sensor device with conductive fabric and PVDF film for monitoring cardiorespiratory signals. Sensors Actuators A Phys. 2006, 128, 317–326. [Google Scholar] [CrossRef]
  32. Lee, M.; Chen, C.; Wang, S.; Cha, S.; Park, Y.; Kim, J.; Chou, L.; Wang, Z. A hybrid piezoelectric structure for wearable nanogenerators. Adv. Mater. 2012, 24, 1759–1764. [Google Scholar] [CrossRef]
  33. Sadeqi, A.; Nejad, H.R.; Alaimo, F.; Yun, H.; Punjiya, M.; Sonkusale, S.R. Washable Smart Threads for Strain Sensing Fabrics. IEEE Sens. J. 2018, 18, 9137–9144. [Google Scholar] [CrossRef]
  34. Yun, D.; Park, J.; Yun, K. Highly stretchable energy harvester using piezoelectric helical structure for wearable applications. Electron. Lett. 2015, 51, 284–285. [Google Scholar] [CrossRef]
  35. Lu, X.; Qu, H.; Skorobogatiy, M. Piezoelectric microstructured fibers via drawing of multimaterial preforms. Sci. Rep. 2017, 7, 1–12. [Google Scholar] [CrossRef] [Green Version]
  36. Soin, N.; Shah, T.H.; Anand, S.C.; Geng, J.; Pornwannachai, W.; Mandal, P.; Reid, D.; Sharma, S.; Hadimani, R.L.; Bayramol, D.V.; et al. Novel “3-D spacer” all fibre piezoelectric textiles for energy harvesting applications. Energy Environ. Sci. 2014, 7, 1670–1679. [Google Scholar] [CrossRef]
  37. Lund, A.; Rundqvist, K.; Nilsson, E.; Yu, L.; Hagström, B.; Müller, C. Energy harvesting textiles for a rainy day: Woven piezoelectrics based on melt-spun PVDF microfibres with a conducting core. Npj Flex. Electron. 2018, 2, 1–9. [Google Scholar] [CrossRef] [Green Version]
  38. Kim, M.; Yun, K. Helical piezoelectric energy harvester and its application to energy harvesting garments. Micromachines 2017, 8, 115. [Google Scholar] [CrossRef]
  39. Godfrey, A.; Conway, R.; Meagher, D.; ÓLaighin, G. Direct measurement of human movement by accelerometry. Med Eng. Phys. 2008, 30, 1364–1386. [Google Scholar] [CrossRef] [PubMed]
  40. Cha, Y.; Verotti, M.; Walcott, H.; Peterson, S.D.; Porfiri, M. Energy harvesting from the tail beating of a carangiform swimmer using ionic polymer–metal composites. Bioinspir. Biomim. 2013, 8, 036003. [Google Scholar] [CrossRef] [PubMed]
  41. Ryan, S.M.; Szyniszewski, S.; Ha, S.; Xiao, R.; Nguyen, T.D.; Sharp, K.W.; Weihs, T.P.; Guest, J.K.; Hemker, K.J. Damping behavior of 3D woven metallic lattice materials. Scr. Mater. 2015, 106, 1–4. [Google Scholar] [CrossRef] [Green Version]
  42. Sun, H.; You, X.; Deng, J.; Chen, X.; Yang, Z.; Chen, P.; Fang, X.; Peng, H. A twisted wire-shaped dual-function energy device for photoelectric conversion and electrochemical storage. Angew. Chem. 2014, 126, 6782–6786. [Google Scholar] [CrossRef]
  43. Åkerfeldt, M.; Lund, A.; Walkenström, P. Textile sensing glove with piezoelectric PVDF fibers and printed electrodes of PEDOT: PSS. Text. Res. J. 2015, 85, 1789–1799. [Google Scholar] [CrossRef]
  44. Cha, Y.; Kim, H.; Kim, D. Flexible piezoelectric sensor-based gait recognition. Sensors 2018, 18, 468. [Google Scholar] [CrossRef] [Green Version]
  45. Kim, S.H.; Kwon, Y.; Kim, K.; Cha, Y. Estimation of Hand Motion from Piezoelectric Soft Sensor Using Deep Recurrent Network. Appl. Sci. 2020, 10, 2194. [Google Scholar] [CrossRef] [Green Version]
  46. Song, K.; Kim, S.H.; Jin, S.; Kim, S.; Lee, S.; Kim, J.S.; Park, J.M.; Cha, Y. Pneumatic actuator and flexible piezoelectric sensor for soft virtual reality glove system. Sci. Rep. 2019, 9, 1–8. [Google Scholar] [CrossRef] [PubMed] [Green Version]
  47. Tajitsu, Y. Piezoelectric Poly-L-lactic acid fabric and its application to control of humanoid robot. Ferroelectrics 2017, 515, 44–58. [Google Scholar] [CrossRef]
  48. Lanitis, A. A survey of the effects of aging on biometric identity verification. Int. J. Biom. 2010, 2, 34. [Google Scholar] [CrossRef]
  49. Vancea, M.; Solé, J. Population aging in the European Information Societies: Towards a comprehensive research Agenda in eHealth innovations for elderly. Aging Dis. 2016, 7, 526. [Google Scholar] [CrossRef] [PubMed] [Green Version]
Figure 1. Schematic of the textile-based piezoelectric sensor (green) in the smart textile under flexural loading.
Applsci 10 05073 g001
Figure 2. Fabrication process of the sensor. (a) PVDF film cut in an ax shape, (b) FPCB electrode attached to the PVDF film, (c) PVDF film curled around a thread with a helical structure, (d) sensor coated with a PET film tape, (e) sensor covered by six threads, (f) sensor woven by a weaving kit, (g) schematic of the smart textile, (h) picture of the piezoelectric sensor, and (i) picture of the smart textile.
Applsci 10 05073 g002
Figure 3. Experimental setup for applying flexural loading. The clamping conditions for the (a) piezoelectric sensor and (b) smart textile. (c) Flexural bending angle Φ.
Applsci 10 05073 g003
Figure 4. (a) Flexural loading applied to the sensor and (b) voltage output of the piezoelectric sensor. The red solid lines and dotted lines represent the bending angle and sine-fitted bending angle, respectively. The blue solid lines and dotted lines represent the voltage output and sine-fitted result of the piezoelectric sensor, respectively.
Applsci 10 05073 g004
Figure 5. Peak-to-peak bending angle according to the peak-to-peak voltage of the sensor. The black squares, red circles, green upward-pointing triangles, and blue downward-pointing triangles represent the voltage outputs of the sensor at the operating frequencies of 0.8, 1.2, 2, and 3 Hz, respectively. The red and purple solid lines represent the power-fitted bending angle and linear fitted bending angle within the bending angle range from 5° to 29° according to the output voltage at f = 1.2 Hz, respectively.
Applsci 10 05073 g005
Figure 6. Peak-to-peak voltage of the sensor according to the operating frequency. The maximum, minimum, and averaged peak-to-peak voltages of the repetitive experiments are represented as error bars. The black, red, and blue squares represent the peak-to-peak voltages according to the operating frequency at Φ of 10°, 20°, and 29°, respectively.
Applsci 10 05073 g006
Figure 7. Peak-to-peak bending angle according to the peak-to-peak voltage of the smart textile. Black squares, red circles, green upward-pointing triangles, and blue downward-pointing triangles represent the voltage output of the sensor at the operating frequency of 0.8, 1.2, 2, and 3 Hz, respectively. The red and purple solid lines represent the power-fitted bending angle and linear fitted bending angle within the bending angle range from 5° to 29° according to the output voltage at f = 1.2 Hz, respectively.
Applsci 10 05073 g007
Figure 8. Peak-to-peak voltage of the smart textile according to the operating frequency. The maximum, minimum, and averaged peak-to-peak voltages of the repetitive experiments are represented as error bars. The black, red, and blue squares represent the peak-to-peak voltages according to the operating frequency at Φ of 10°, 20°, and 29°, respectively.
Applsci 10 05073 g008
Figure 9. Concept schematic of the sensor woven into clothing measuring the joint angle of the elbow.
Applsci 10 05073 g009

