1. Introduction
Micro-gas turbines coupled with concentrated-solar power systems (CSP) can provide a viable solution for renewable energy generation. They have been shown to be ideally suited for small-scale standalone and off-grid applications [
1]. However, micro-gas turbines experience larger losses in the system components, and hence achieve lower thermal efficiencies, compared to large-scale gas turbines. Thus, for a high thermal efficiency, in the range of 40 to 50%, the system needs to operate at high heat-source temperatures, above 600
. In comparison, cycles operating with supercritical carbon dioxide (sCO
) can achieve similar thermal efficiencies at more moderate temperatures. Therefore, sCO
can be considered as a potential candidate for concentrated-solar power applications, particularly for stand-alone solar dish units; offering a simple layout, high-power density and compact structures [
2].
Despite the promising potential of sCO
, sCO
turbomachine design is still a developing field. However, turbine performance is one of the main factors that affects the cycle performance; for example, a 2% increase in turbine efficiency has been shown to result in a 1% enhancement in the thermodynamic cycle efficiency [
3]. This would have a significant impact on cost reduction of the solar power system through reduction in the size and the cost of the concentrator which typically represents over 60% of the total system cost.Therefore, several researchers have investigated advancing the state-of-the-art with regards to turbine design.
Moroz et al. [
4] discussed some design aspects for a 100 MW axial sCO
turbine for a direct sCO
recompression cycle. Aerodynamic and structural analyses were performed to determine the best design configuration as a function of the number of stages, radial tip clearance androtational speed. Holaind et al. [
5] addressed the design of small radial turbomachinery with an output power ranging from 50–85 kW and an efficiency of 70%. Subsequent to that, Qi et al. [
6] presented a new insight for a sCO
radial turbine design for a power rating ranging between 100 and 200 kW through the integration of mean-line design with a loss model where an efficiency of 78–82% has been achieved. Saeed et al. [
3] developed an algorithm that allows for the design of a sCO
radial turbine for CSP application rated at 10 MW. During the design process, a mean-line design tool that uses an enthalpy loss model, geometry optimisation and 3D RANS simulation were performed. As a result of the geometry optimisation, an enhancement in both the efficiency and power output of 5.34% and 5.30 % was achieved respectively [
3]. In the same context, Zhou et al. [
7] and Zhang et al. [
8] proposed 300 kW and 1.5 MW radial sCO
turbine designs respectively. Zhang et al. [
8] added a design of a 15 MW sCO
axial turbine to their study. They implemented CFD simulations to analyse the flow characteristics of sCO
turbine components. In the same year, Lv et al. [
9] developed an optimisation design approach for a radial-inflow turbine using sCO
. This was done through combining a one-dimensional design method with an optimisation algorithm for both nominal and off design performance conditions for the stage inlet temperature, rotational speed and expansion ratio. Likewise, Shi et al. [
10] presented an optimal 10 MW three-stage sCO
axial turbine design using 3D model, optimisation methods and off design analysis. Considering the potential of sCO
fluid for small-scale systems, White et al. [
11] presented a comparative study between various turbine architectures for a small-scale 100 kW sCO
Rankine cycle. Single-stage radial-inflow, single-stage axial, and two-stage axial turbines were analysed to identify the most feasible turbine designs based on the limitations of the blade height. It was found that the feasible blade height is in the range of 1.74 to 2.47 mm for a given turbine diameter of 30 mm. Furthermore, it was concluded that a low degree of reaction is preferred for single-stage turbines resulting in supersonic conditions at the rotor inlet. However, a higher degree of reaction is suitable for two-axial stage turbine leading to subsonic rotor inlet conditions.
Besides the aforementioned research work in the field of sCO
turbo-machines designs, a large amount of work has been conducted for micro-scale organic Rankine cycle (ORC) turbine design, using the same design methodology for novel working fluids, including refrigerants such as R134a, R1234yf and R152a. Fiaschi et al. [
12] developed a design tool that included a loss model to examine the performance of a 50 kW radial turbine operating with various working fluids. The results of the study demonstrated that an efficiency ranging from 78–85 % can be achieved with a highest value (85%) for R134a and lowest value (78%) for R1234yf. Casati et al. [
13] developed two preliminary designs for a five-stage transonic and eight stage supersonic radial-outflow 10 kW ORC turbine. It was found that the transonic turbines outperform the supersonic turbine during the partial-load operations thus resulting in enhanced efficiency. Rahbar et al. [
14] proposed a mean-line model integrated with both an optimisation algorithm and a real-gas formulation for a 15 kW radial turbine. The design model resulted in a turbine efficiency ranging from 82.4–84% with a maximum value found for R152a. Lio et al. [
15] integrated both mean-line design with loss correlations, developed previously for radial gas turbines, for examining turbine size, working conditions and predicting the efficiency of radial-inflow turbine operating with R245fa. The study revealed that the turbine size has a noticeable effect on the efficiency, and thus an efficiency of 85 to 90% at high expansion ratio has been attained at an output power greater than 50 kW.
Radial turbines are known to be an effective and compact machine for small-scale applications with a power ranging from 50 kW to 5 MW, allowing for the expansion of the working fluid in one single stage [
12]. Thus, the radial-inflow turbine configuration has been the main candidate for small-size turbomachinery design in most of the aforementioned researches. Alternatively, a feasible single-stage axial turbine design could be achieved for micro-scale applications allowing for better heat transfer control, as the hot blades are far from the shaft, and subsequently prolongs the life of the bearing. In the current study, a mean-line approach is used to address the design of a single-stage 100 kW sCO
axial turbine design through identifying optimal turbine design parameters from both mechanical perspectives, owing to the significant axial thrust loads, high rotational speeds and high operating pressures, and aerodynamic performance perspectives. Additionally, the design tool implemented in the current study is refined by introducing Soderberg’s and Ainley and Mathieson’s loss correlations, which allows the loss within the rotor and stator to be estimated based on loading coefficient, tip clearance and blade geometry. The designs were evaluated at three different speeds of 150k, 200k, 250k RPM respectively, to achieve an overall turbine efficiency greater than 80% and keep low centrifugal stresses on the rotor blades, for turbine inlet conditions of 923 K, 170 bar, expansion ratio of 3. For the given inlet conditions, a single-stage design is proposed due to the low power rating and low volume ratio of the machine. The novelty in this current work lies in presenting a design of sCO
micro-scale single-stage axial turbine, alongside with defining the optimal turbine design parameters from both mechanical and aerodynamic performance perspectives.
This paper is structured as follows: an overview of turbine design methodology and assumptions are presented in
Section 2. Axial turbine design and loss modelling is discussed in
Section 3. The results and discussion are presented in
Section 4, before the final conclusions are presented.
2. Turbine Design Methodology
sCO
condensation (transcritical) power cycles were firstly proposed by Angelino and Feher in 1968 where efficiencies up to 50 % can be achieved [
16,
17].However, to achieve condensation within the cycle it is necessary to lower the temperature of the CO
below its critical temperature (31.1
C). Unfortunately, achieving this within CSP plants, which are typically in dry arid regions with high solar irradiation, requires water-cooling which is usually not feasible in these sites. To overcome this issue, it has been proposed to raise the critical point of the working fluid by doping CO
with another fluid. For example, mixing CO
with various additives, such as C
H
, C
H
, C
H
, C
H
, C
H
and C
H
, has been shown to increase the critical temperature to up to 60
C [
18]. Moreover, the application of sCO
blends in CSP plants have been previously studied [
18] and have been shown to enhance efficiency of a Brayton power cycle by 3–4% compared to pure sCO
. Therefore, sCO
blends have been proposed instead of pure sCO
to increase the critical temperature of the working fluid [
19,
20]. The presented design methodology has been developed as part of a preliminary study related to the Horizon 2020 SCARABEUS project [
21], and thus the methodology is capable of designing turbines intended for sCO
blends. However, for simplicity at this stage, pure sCO
will be considered as the working fluid. Considering a blend merely changes the inputs into the equation of state used to predict thermodynamic properties and thus the method can be readily extended to blends without any change to the analysis. It should be noted that the turbine design is likely to be sensitive to the chosen blend, but such investigations are left for a future work.
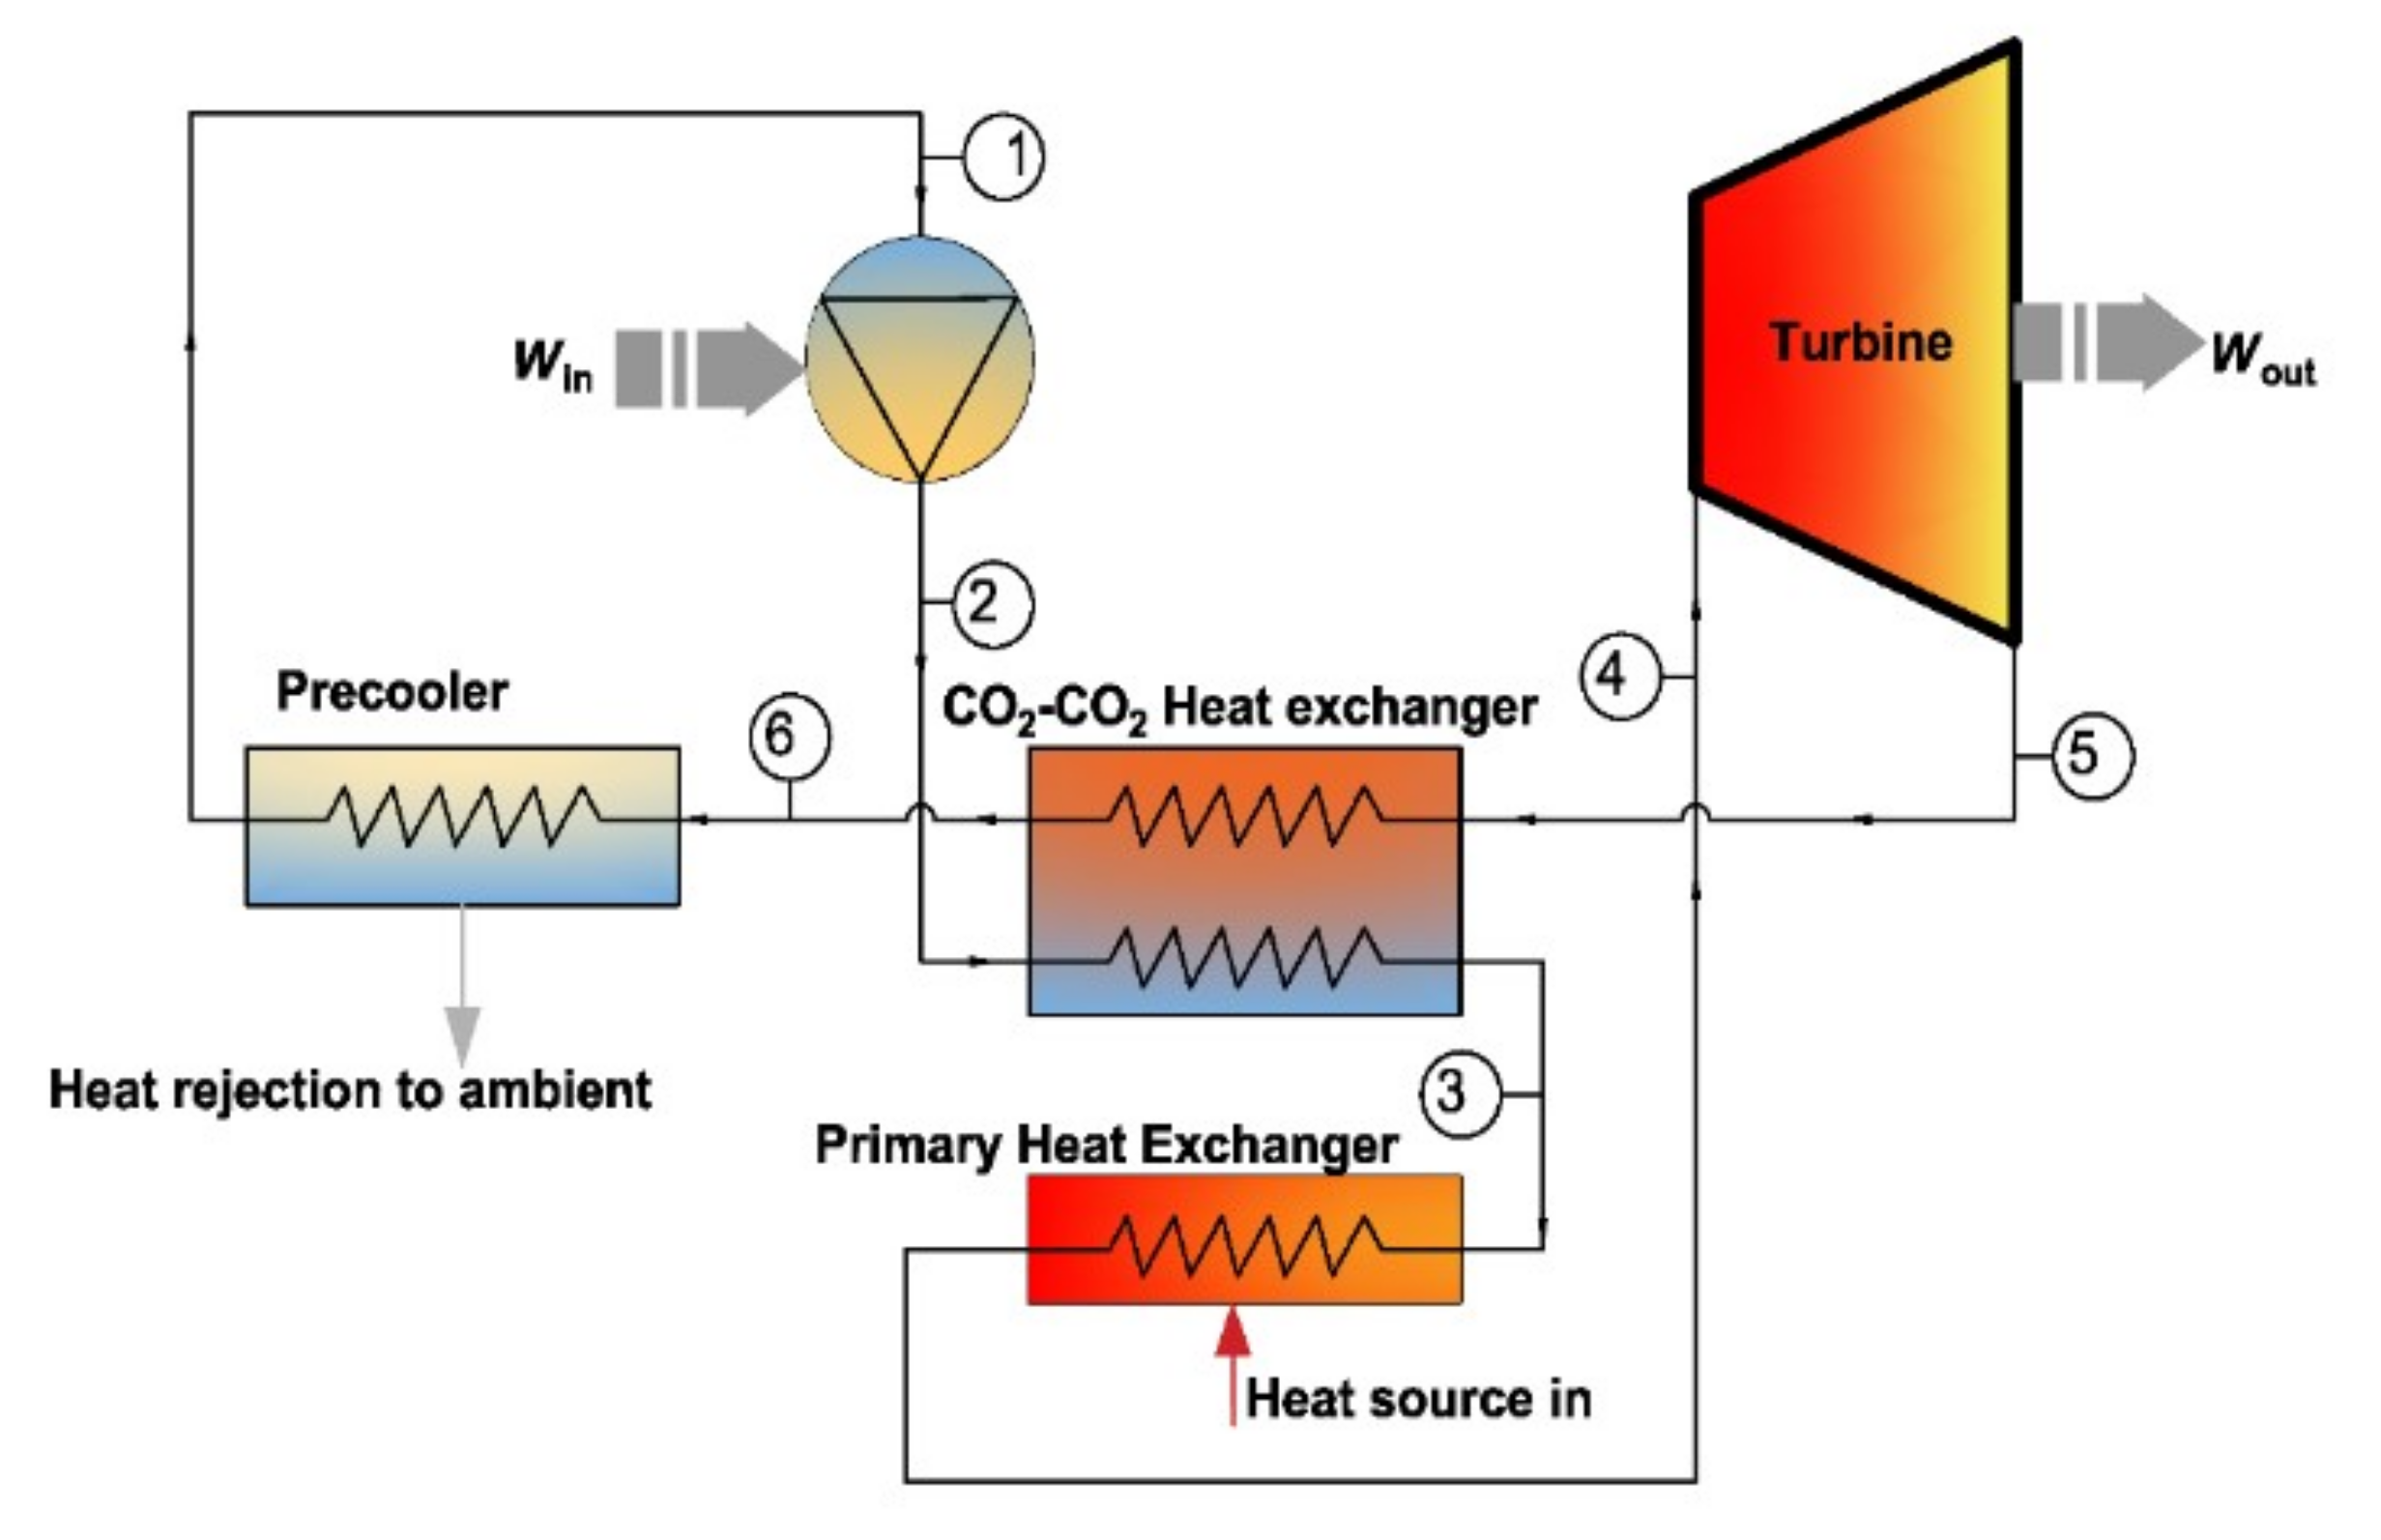
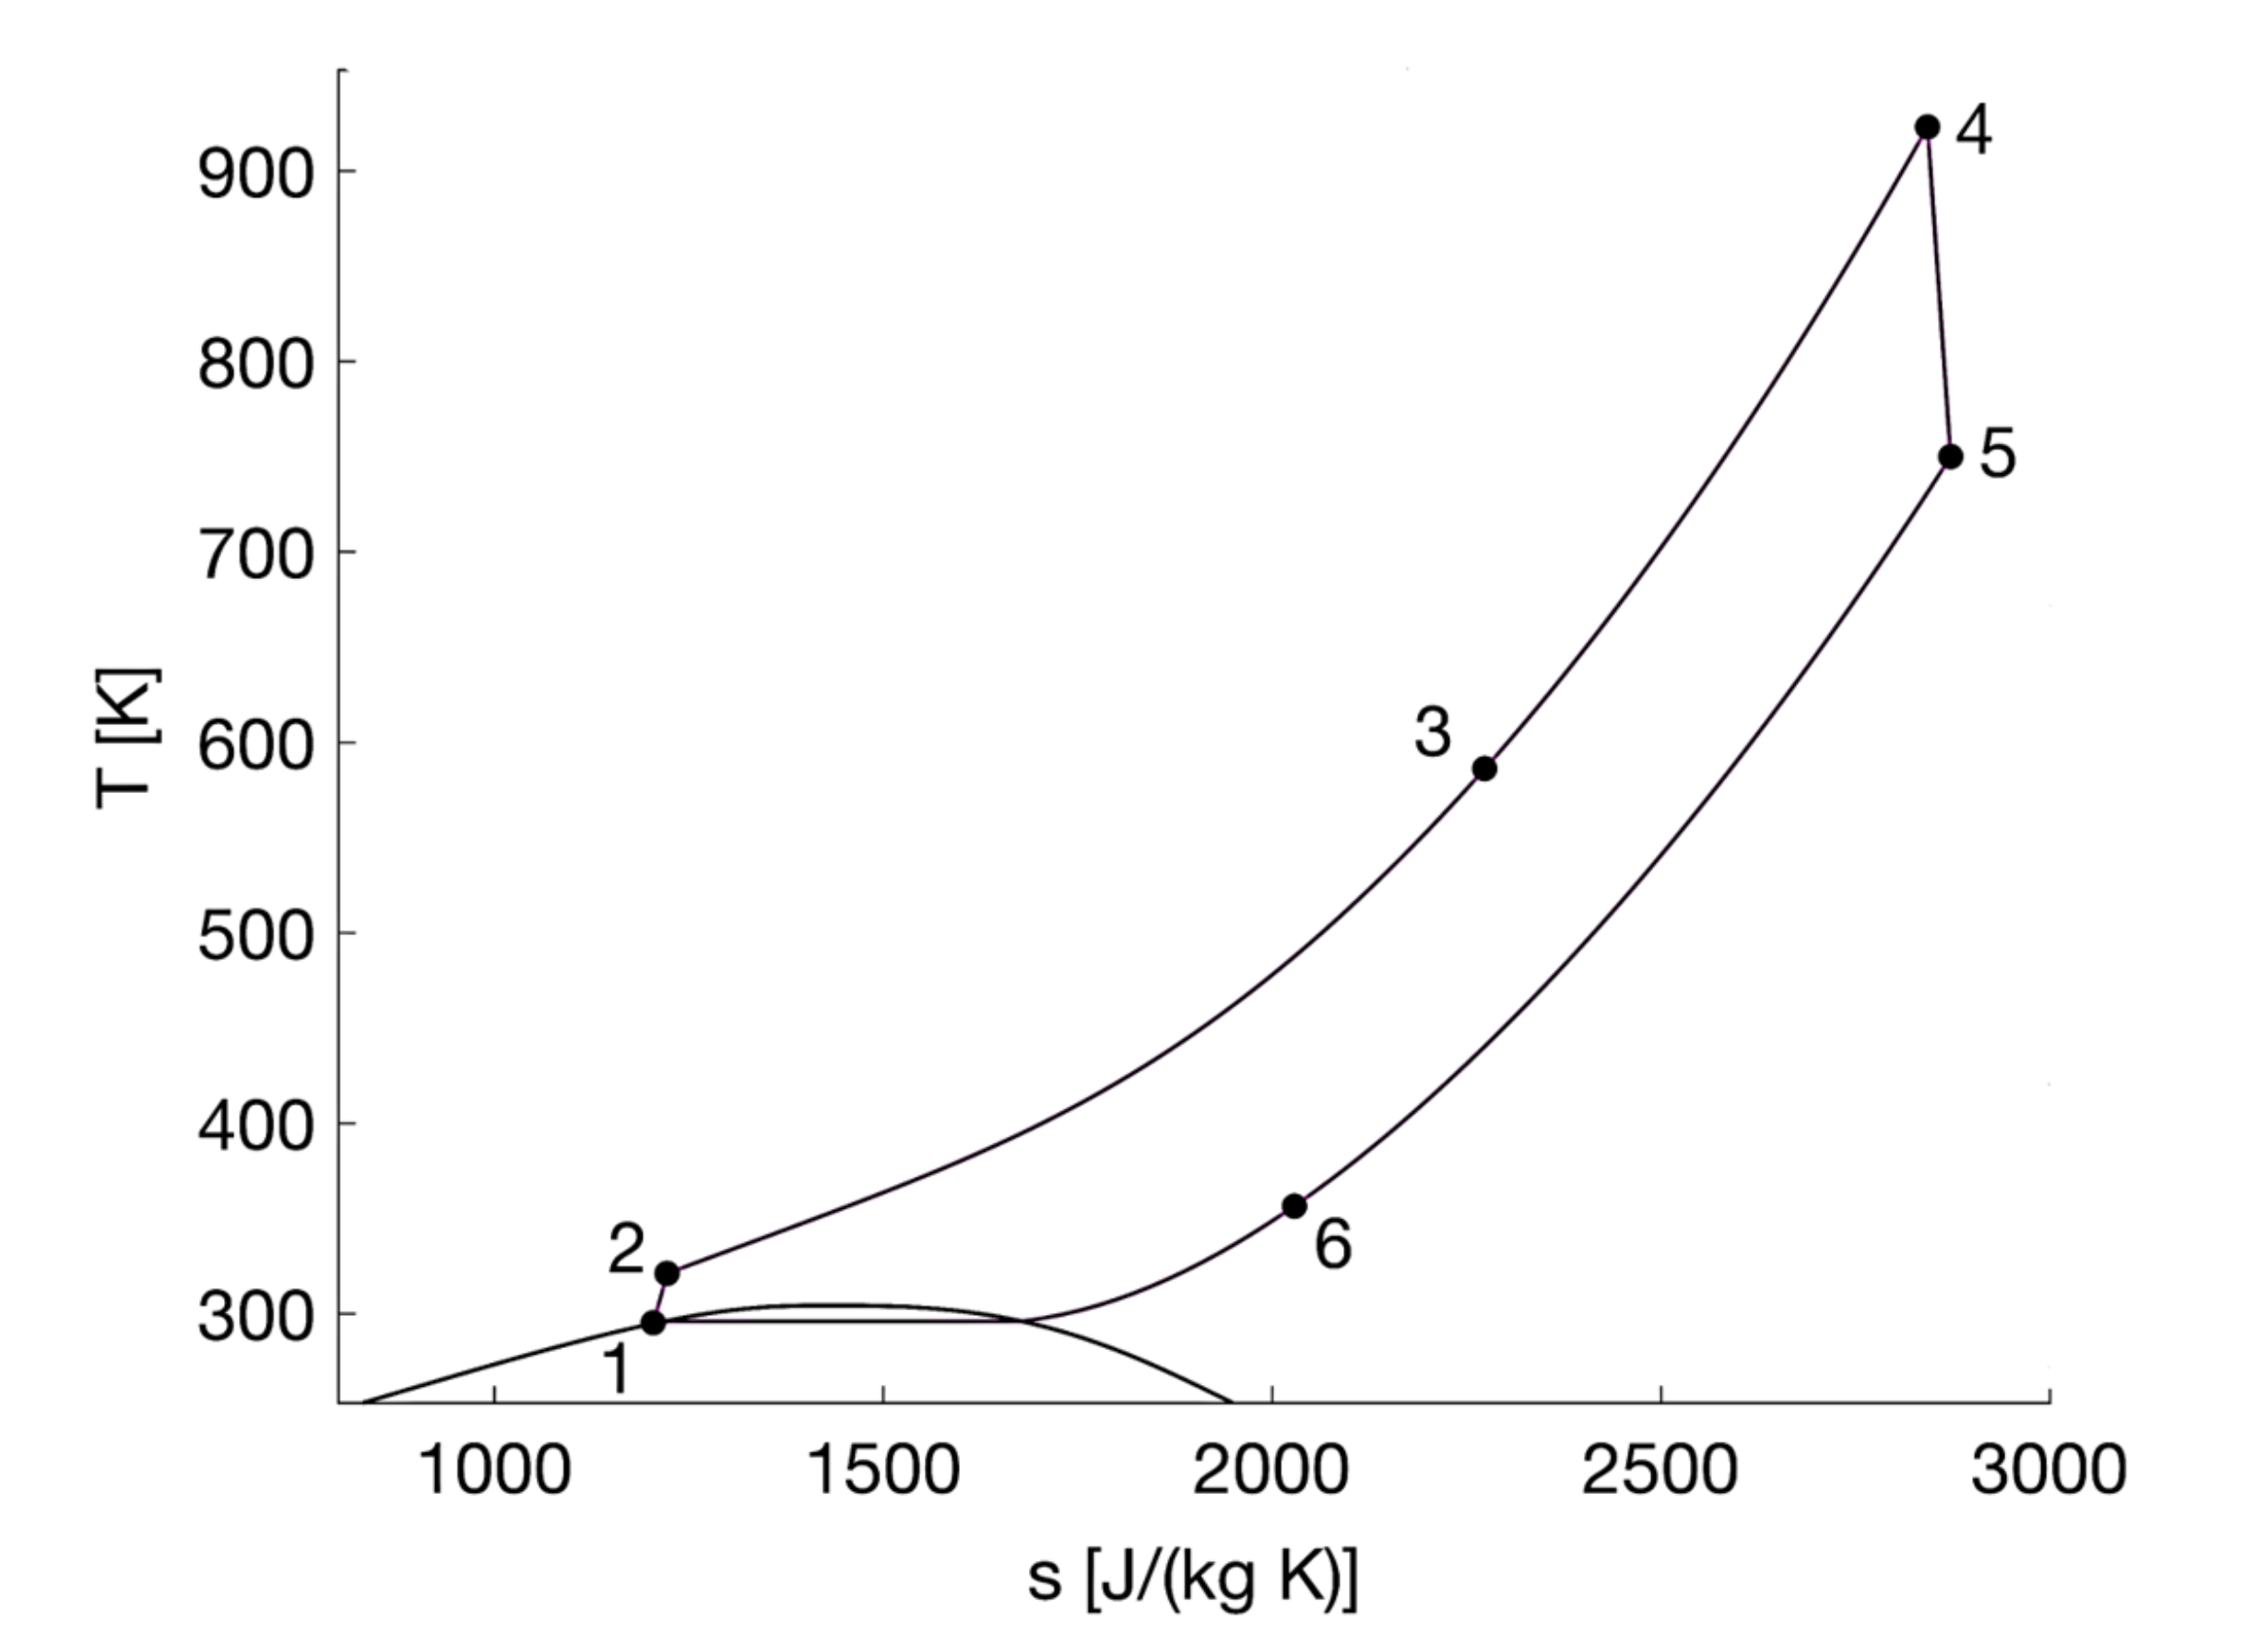
The turbine design is part of a condensation sCO
cycle, as shown in
Figure 1 and
Figure 2, with a net power output of 100 kW. The turbine inlet parameters are obtained from a thermodynamic cycle analysis and are selected as a compromise between cycle efficiency, component life, complexity and feasibility [
11]. Accordingly, the turbine inlet temperature is limited to 650
C. The turbine inlet pressure is limited to 17 MPa with an expansion ratio of 3 to reduce the power block weight, size and price [
22]. The cycle is designed assuming a pump inlet temperature of 20
C, pressure of 6 MPa, compressor isentropic efficiency of 70%, turbine isentropic efficiency of 80% and recuperator effectiveness of 90%. For the selected parameters, the cycle has a thermal efficiency of 32.8% with a mass-flow rate of 0.65 kg/s.
To design the turbine, a mean-line turbine design approach is adopted to provide a fast and accurate estimation of the turbine geometry and the expected isentropic efficiency. This has been developed in MATLAB and coupled with NIST REFPROP [
23] to account for the sCO
fluid behaviour. The model is also capable of operating with Simulis, which enables novel fluid blends to be considered [
24]. Within the model the steady-state mass, energy and momentum equations are solved to obtain the geometric parameters of the turbine. In this section, the turbine mean-line design is developed along with a parametric study to examine the effect of changing various design parameters on the turbine performance, at various rotational speeds, and assess blades pressure and centrifugal loads. The designs were evaluated for turbine inlet conditions of 923 K, 170 bar, expansion ratio of 3.
For brevity, a full description of the model is not presented here, but can instead be found in
Appendix A. Instead, a brief overview of the process is provided here. The process starts with the choice of the non-dimensional parameters, namely the flow coefficient
, and loading coefficient
, which are defined as:
where
is the enthalpy drop across the stage,
U is the blade velocity and
is the axial velocity. Alongside these, the degree of reaction
and an initial estimate for the total-to-total isentropic efficiency are also specified. The values of the mass flow rate, turbine inlet temperature and pressure are taken from the cycle analysis. The selection of the dimensionless parameters is made with the aim of maximising turbine efficiency; the first two parameters,
and
, according to typical values taken from the Smith chart [
25], while the degree of reaction is assumed to be 0.5 [
26]. Then, the loss coefficients are calculated using the selected loss model; where they are chosen to obtain an accurate estimation for the profile, secondary and tip clearance losses at the design operating conditions as detailed in
Section 3. Following this, the design is re-iterated using the calculated loss coefficients and the estimate for the turbine efficiency is updated. Once the design geometry is obtained, the blade heights and mean diameter are calculated as a function of the area, mean velocity and rotational speed, and hence the feasibility of the design can be verified in comparison to the feasible manufacturing values for the inlet blade height and blade diameter [
11].
Furthermore, pressure and centrifugal loads are examined where Ni-Cr-Co alloy (Inconel 718) is assumed for the turbine blades; it has been considered as a suitable material in the past [
26]. The loads are calculated, assuming tapered blades with an average density of 8000
and a maximum equivalent stress of 303 MPa, using Equations (
A19) and (
A20) [
26,
27]. The centrifugal load is calculated at the mean blade height and mean rotor area. To calculate the bending load, the number of rotor blades are defined as function of the blade pitch (s) at the mean radius
:
The optimum pitch to chord ratio is obtained as a function of the flow angles and the chord length is obtained assuming an aspect ratio of 1 [
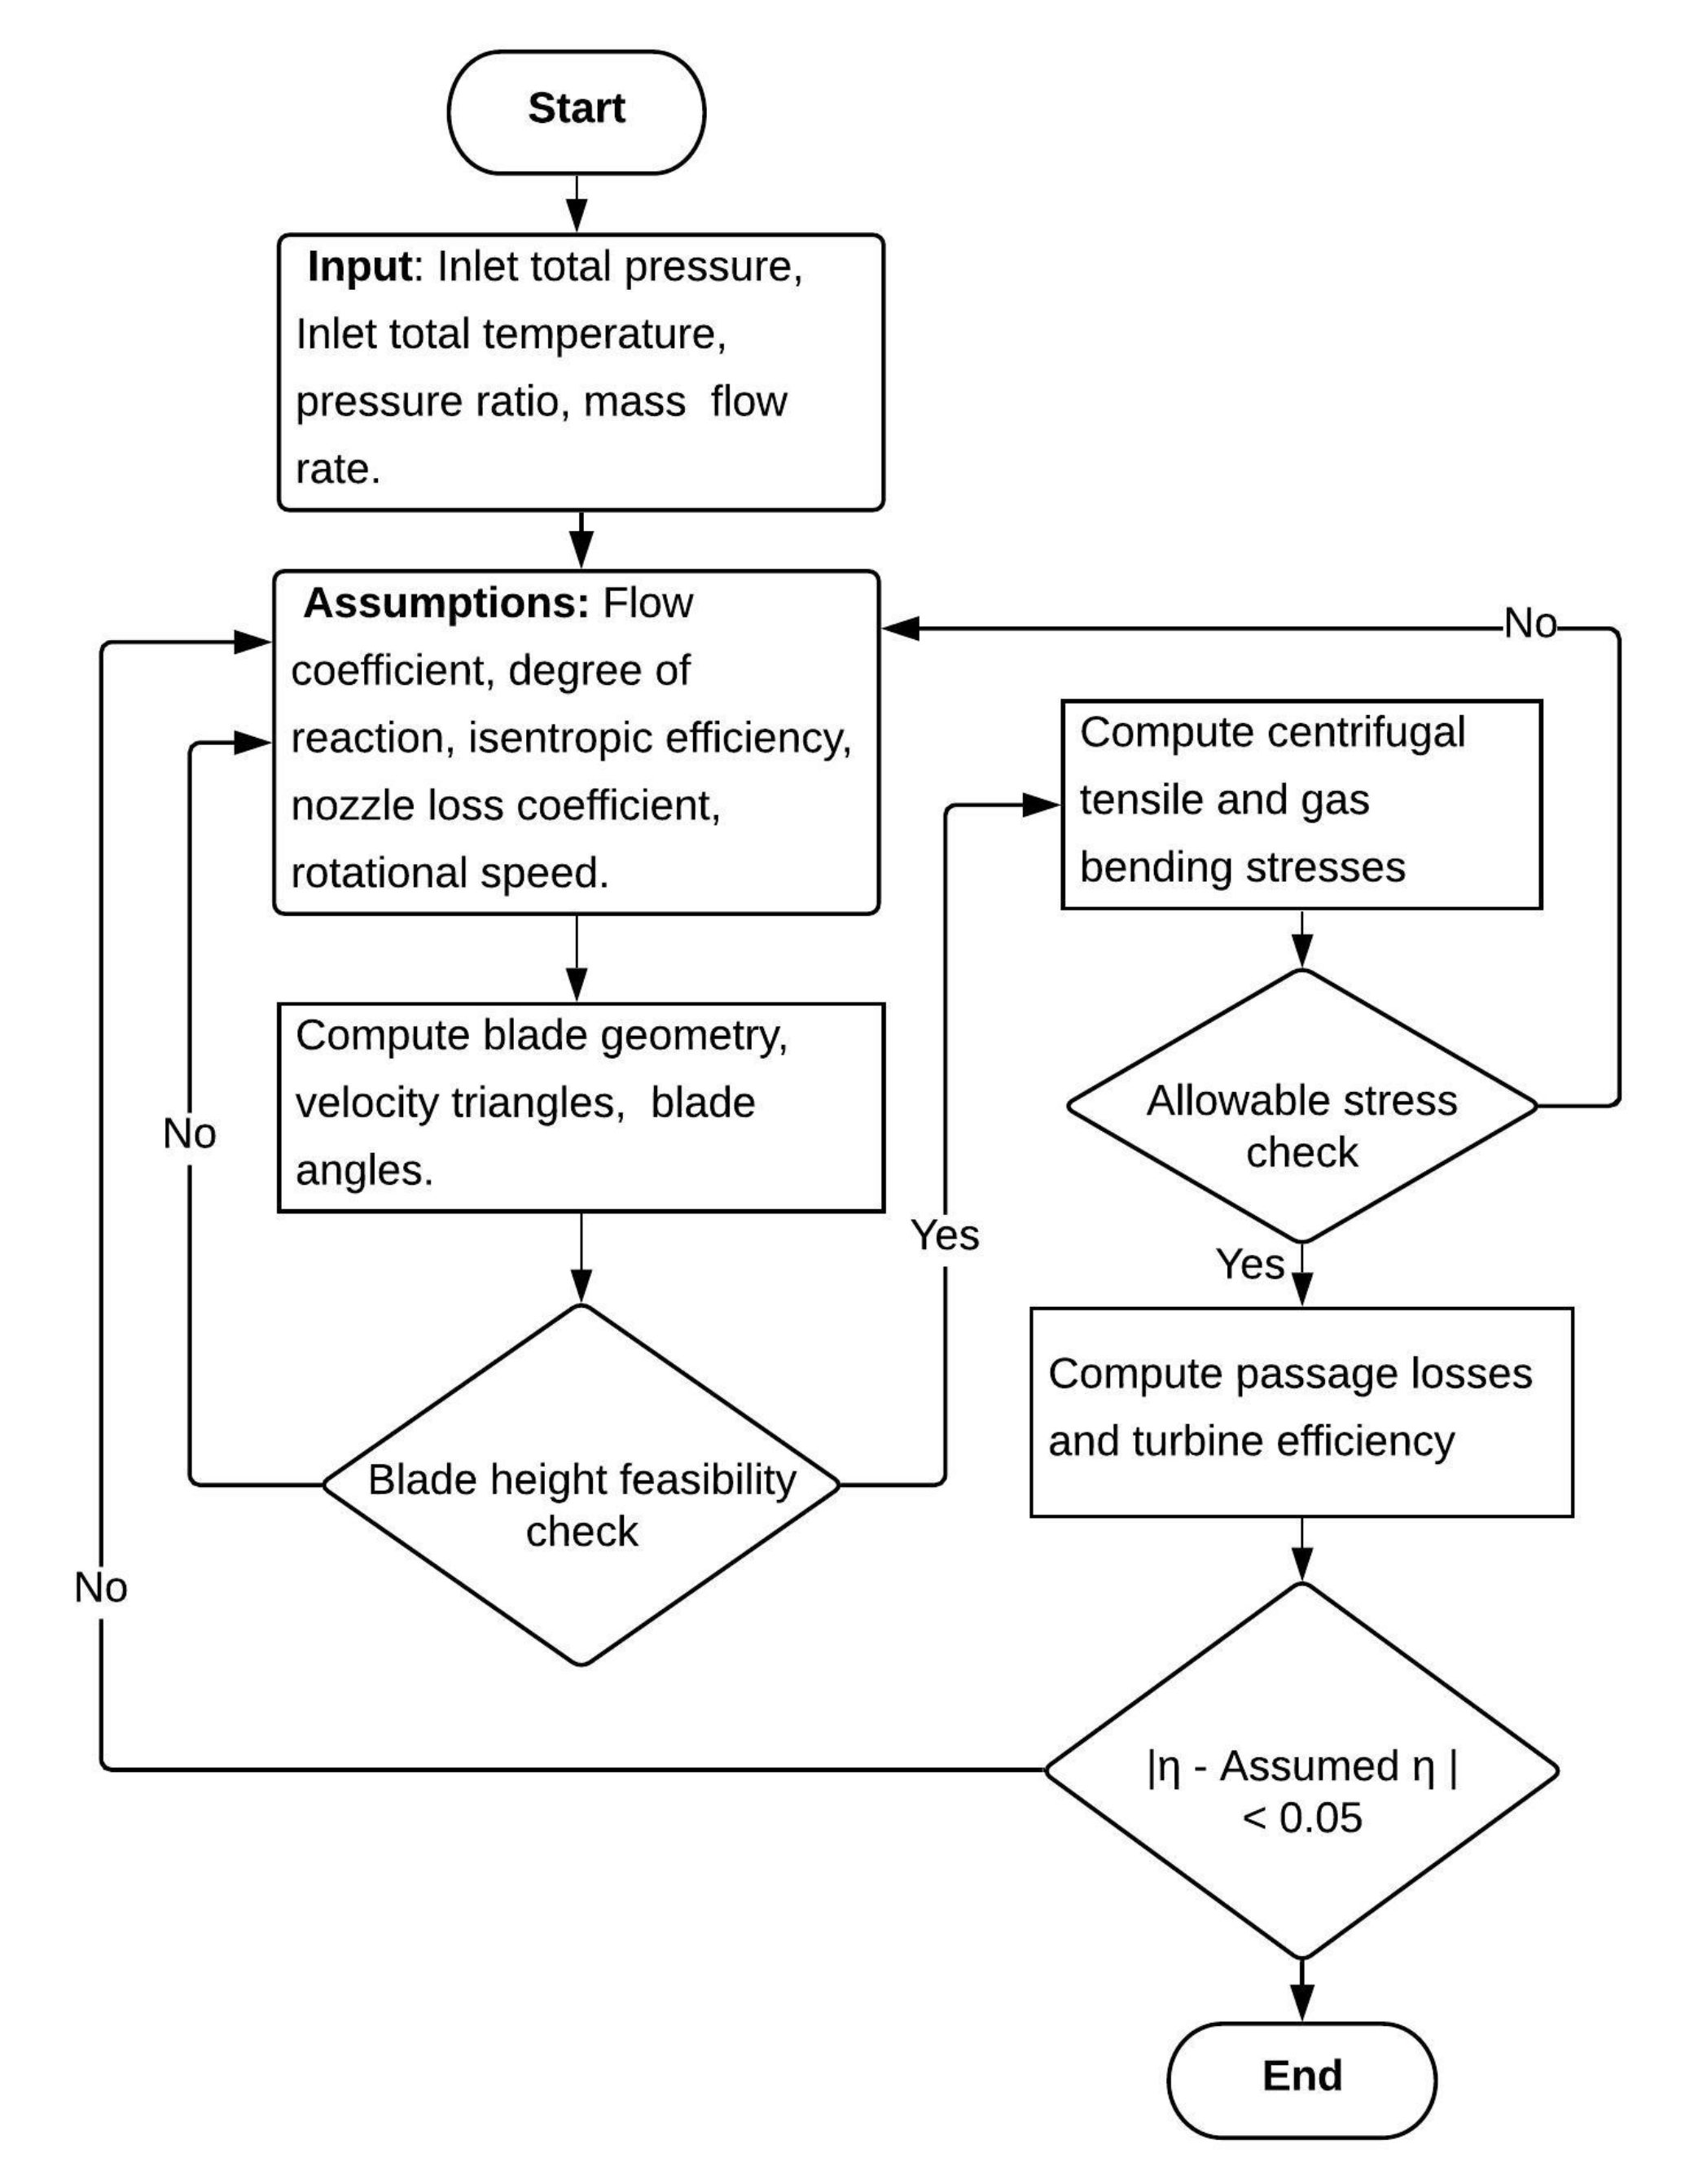
28]. The design steps and methodology are summarised in
Appendix A and in the flow chart (
Figure 3).
In principle, the optimal axial turbine efficiency occurs within a certain range of specific speed, typically
[
29]. For the specified specific speed range, the rotational speed ranges varies between 64 and 640 kRPM. Running the turbine at higher specific speed imposes high level of stresses on the rotor blades and could also result in rotordynamic instabilities. Consequently, in the present study the turbine design will be evaluated at three different shaft speeds, namely 150k, 200k and 250k RPM, corresponding to specific speed ranging from 0.23 to 0.39 rad, to achieve an overall turbine efficiency greater than 80%. The shaft speed is determined using Equation (
4), by assuming that the specific speed is within the optimal range for axial turbines:
In Equation (
4),
is the rotor rotational speed in
,
is the volumetric flow rate at the rotor outlet in
and
is the isentropic enthalpy drop across the turbine, in
.
To examine the effect of the various design parameters on the turbine performance and the feasibility of the design, the flow coefficient and loading coefficients have been varied over the range of 0.2 to 1 and 0.8 and 3 respectively [
25]. Also, the the degree of reaction is varied from from 0–0.5 [
26]. Then, the radius for root, mean, tip profiles are obtained using the free vortex design equations.
Table 1 reports the range of values selected for the various design parameters.
3. Loss Modelling
To predict axial turbine performance, various loss models have been previously introduced starting from Soderberg [
30], and then Ainely and Mathieson [
31]. This has been followed by modifications presented by Dunham and Came [
32], Craig and Cox [
33], Kacker and Okapuu [
34], and finally off-design correlations proposed by Moustapha et al. [
35]. Soderberg’s loss model accounts for the effect of profile and secondary flow losses, while tip clearance and trailing edge losses are ignored. Profile losses are calculated as a function of the flow deflection while the secondary losses are interpreted as function of the aspect ratio neglecting the effect of inlet boundary layer and blade geometry. While Soderberg’s model is considered to be an oversimplified model where the effect of Mach number (Ma) and fluid non-dimensional parameters are neglected, it is considered to be satisfactory for preliminary design phase as it allows the loss within the stator and rotor to be estimated based on the amount of expansion that occurs within each passage [
36].In the presented design framework, velocities approach the sonic speed and therefore Soderberg model is considered to be more accurate for estimating the flow losses as the correlations were derived based on high Mach number data. In the absence of a tip clearance loss correlation in this model, the Ainley and Mathieson correlation has been used. It is worth mentioning that a comparative study was made between using Ainley and Mathieson correlations only and the combination of the two classes, and the same trends were observed with a deviation in the design point efficiency of approximately 1.65%. Equations (
5)–(
7) represent the loss coefficients predicted using Soderberg model and Equations (
10)–(
11) represent the tip clearance loss coefficient estimated using the Ainely and Mathieson model.
In Soderberg’s model, the losses are modelled as a function of the aspect ratio (
), the nominal loss coefficient
and the blade deflection
. The nominal loss coefficient is obtained from the empirical correlation:
where
is the flow deflection angle, which corresponds to
for the stator and
for the rotor. The nominal loss coefficients are then obtained as follows:
In Ainely and Mathieson’s model, the tip clearance coefficient
is defined in terms of pressure drop as a function of the pitch to chord ratio
, average blade angle
, the radial tip clearance (k), the average blade height (h) and a constant (B).
where B equals to 0.5 for radial tip clearance. Considering the manufacturing tolerances and uncertainties in thermal expansion during the operation of micro-scale turbines, the radial tip clearance for the un-shrouded blades is set to 0.1 mm [
6]. The tip clearance loss coefficient is then obtained as follows:
The enthalpy loss coefficient for the rotor
is then obtained as a function the rotor blade exit actual relative and isentropic temperatures
and
respectively, the rotor exit velocity
and the specific heat capacity of the working fluid
.
5. Results and Discussion
A parametric study is presented in this section to investigate the effect of the flow coefficient
, degree of reaction
and loading coefficient
on the turbine performance
and design feasibility. Different turbine designs are generated assuming different values of the design parameters
,
,
, based on the specified ranges in
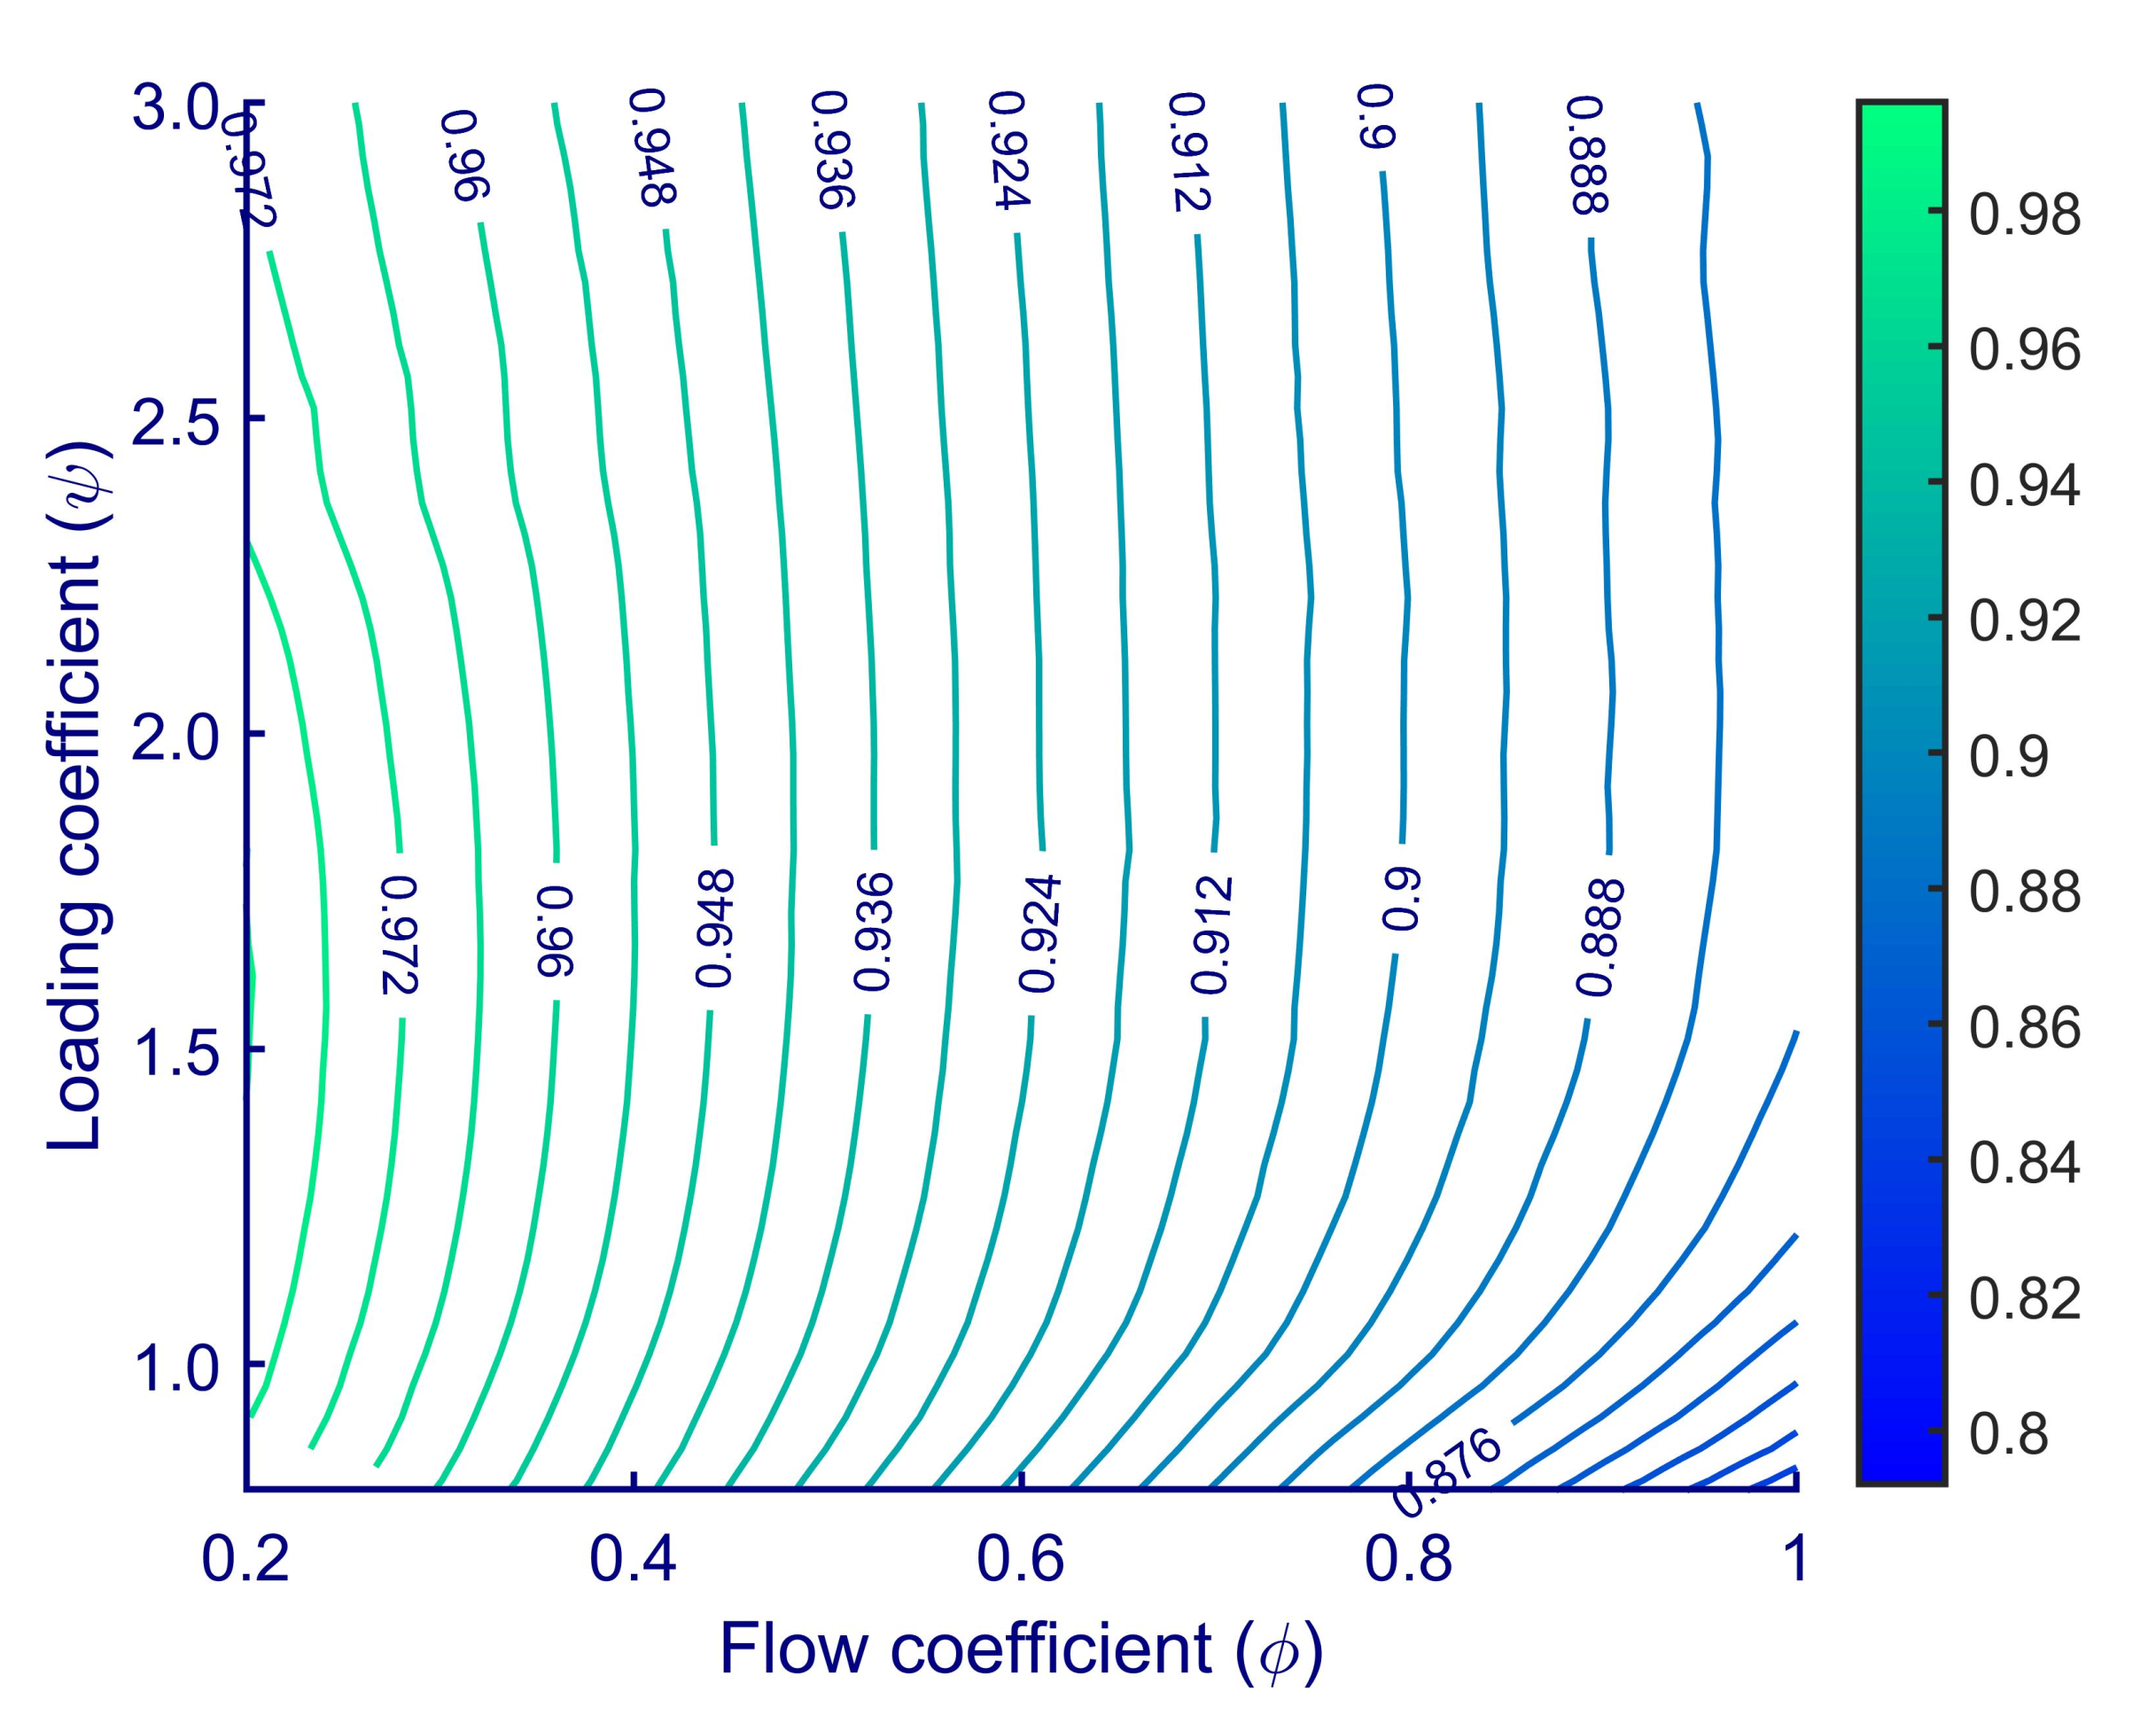
Table 1. Accordingly, a Smith chart is obtained as shown in
Figure 4, which shows the normalised efficiency achieved for the sCO
turbine with a degree of reaction and rotational speed of 0.5 and 150 kRPM respectively.
It is observed that the highest normalised efficiencies are obtained at low flow and loading coefficients, as in the original Smith chart [
25]. According to
Figure 4, a design point can be selected as a starting point for the parametric study. Though one of the benefits of using sCO
is having compact component designs, clearance losses will be proportionally larger compared to turbomachines of a comparable power rating owing to the high density of sCO
and small turbine dimensions. Additionally, windage losses could be expected to be significant on the turbomachinery wheel surfaces compared to large-scale gas turbines as reported from the tests conducted by the Naval Nuclear Laboratory and the Tokyo institute of technology’s (TIT) [
39,
40]. Therefore, whilst windage losses are not accounted for in the current study, it is important to include these in the future. Likewise, losses due to surface roughness are not considered in this analysis owing to the simplicity of the implemented loss model. Thus, the mean-line model will be extended to include both roughness and windage effects in future studies.
The effect of changing the rotor rotational speed on
at different flow and loading coefficients has also been examined. The efficiency is found to increase linearly with increasing rotational speeds over the range from 150 to 250 kRPM for the loading and flow coefficient domains specified in
Table 1. The lowest flow coefficient, over the range from 0.2 to 1.0, results in the highest efficiency level, as confirmed in
Figure 4. However, a low flow coefficient results in larger turbine annulus area and a larger deflection angle. A loading coefficient of 1.6 results in the maximum efficiency at a fixed flow coefficient and degree of reaction of 0.2 and 0.5 respectively. At a loading coefficient of 1.6, the swirl angle is kept close to the recommended value, which is recommended not to exceed 20
[
26], whilst the optimum difference in the whirl velocity components at the inlet and exit of the rotor is achieved, which enables a high efficiency to be achieve. Thus, for this design, the flow coefficient and loading coefficient are set to 0.2 and 1.6 respectively to achieve the maximum efficiency at a degree of reaction of 0.5. The corresponding turbine power output is 116 kW, with a total-to-total isentropic efficiency of 78%.
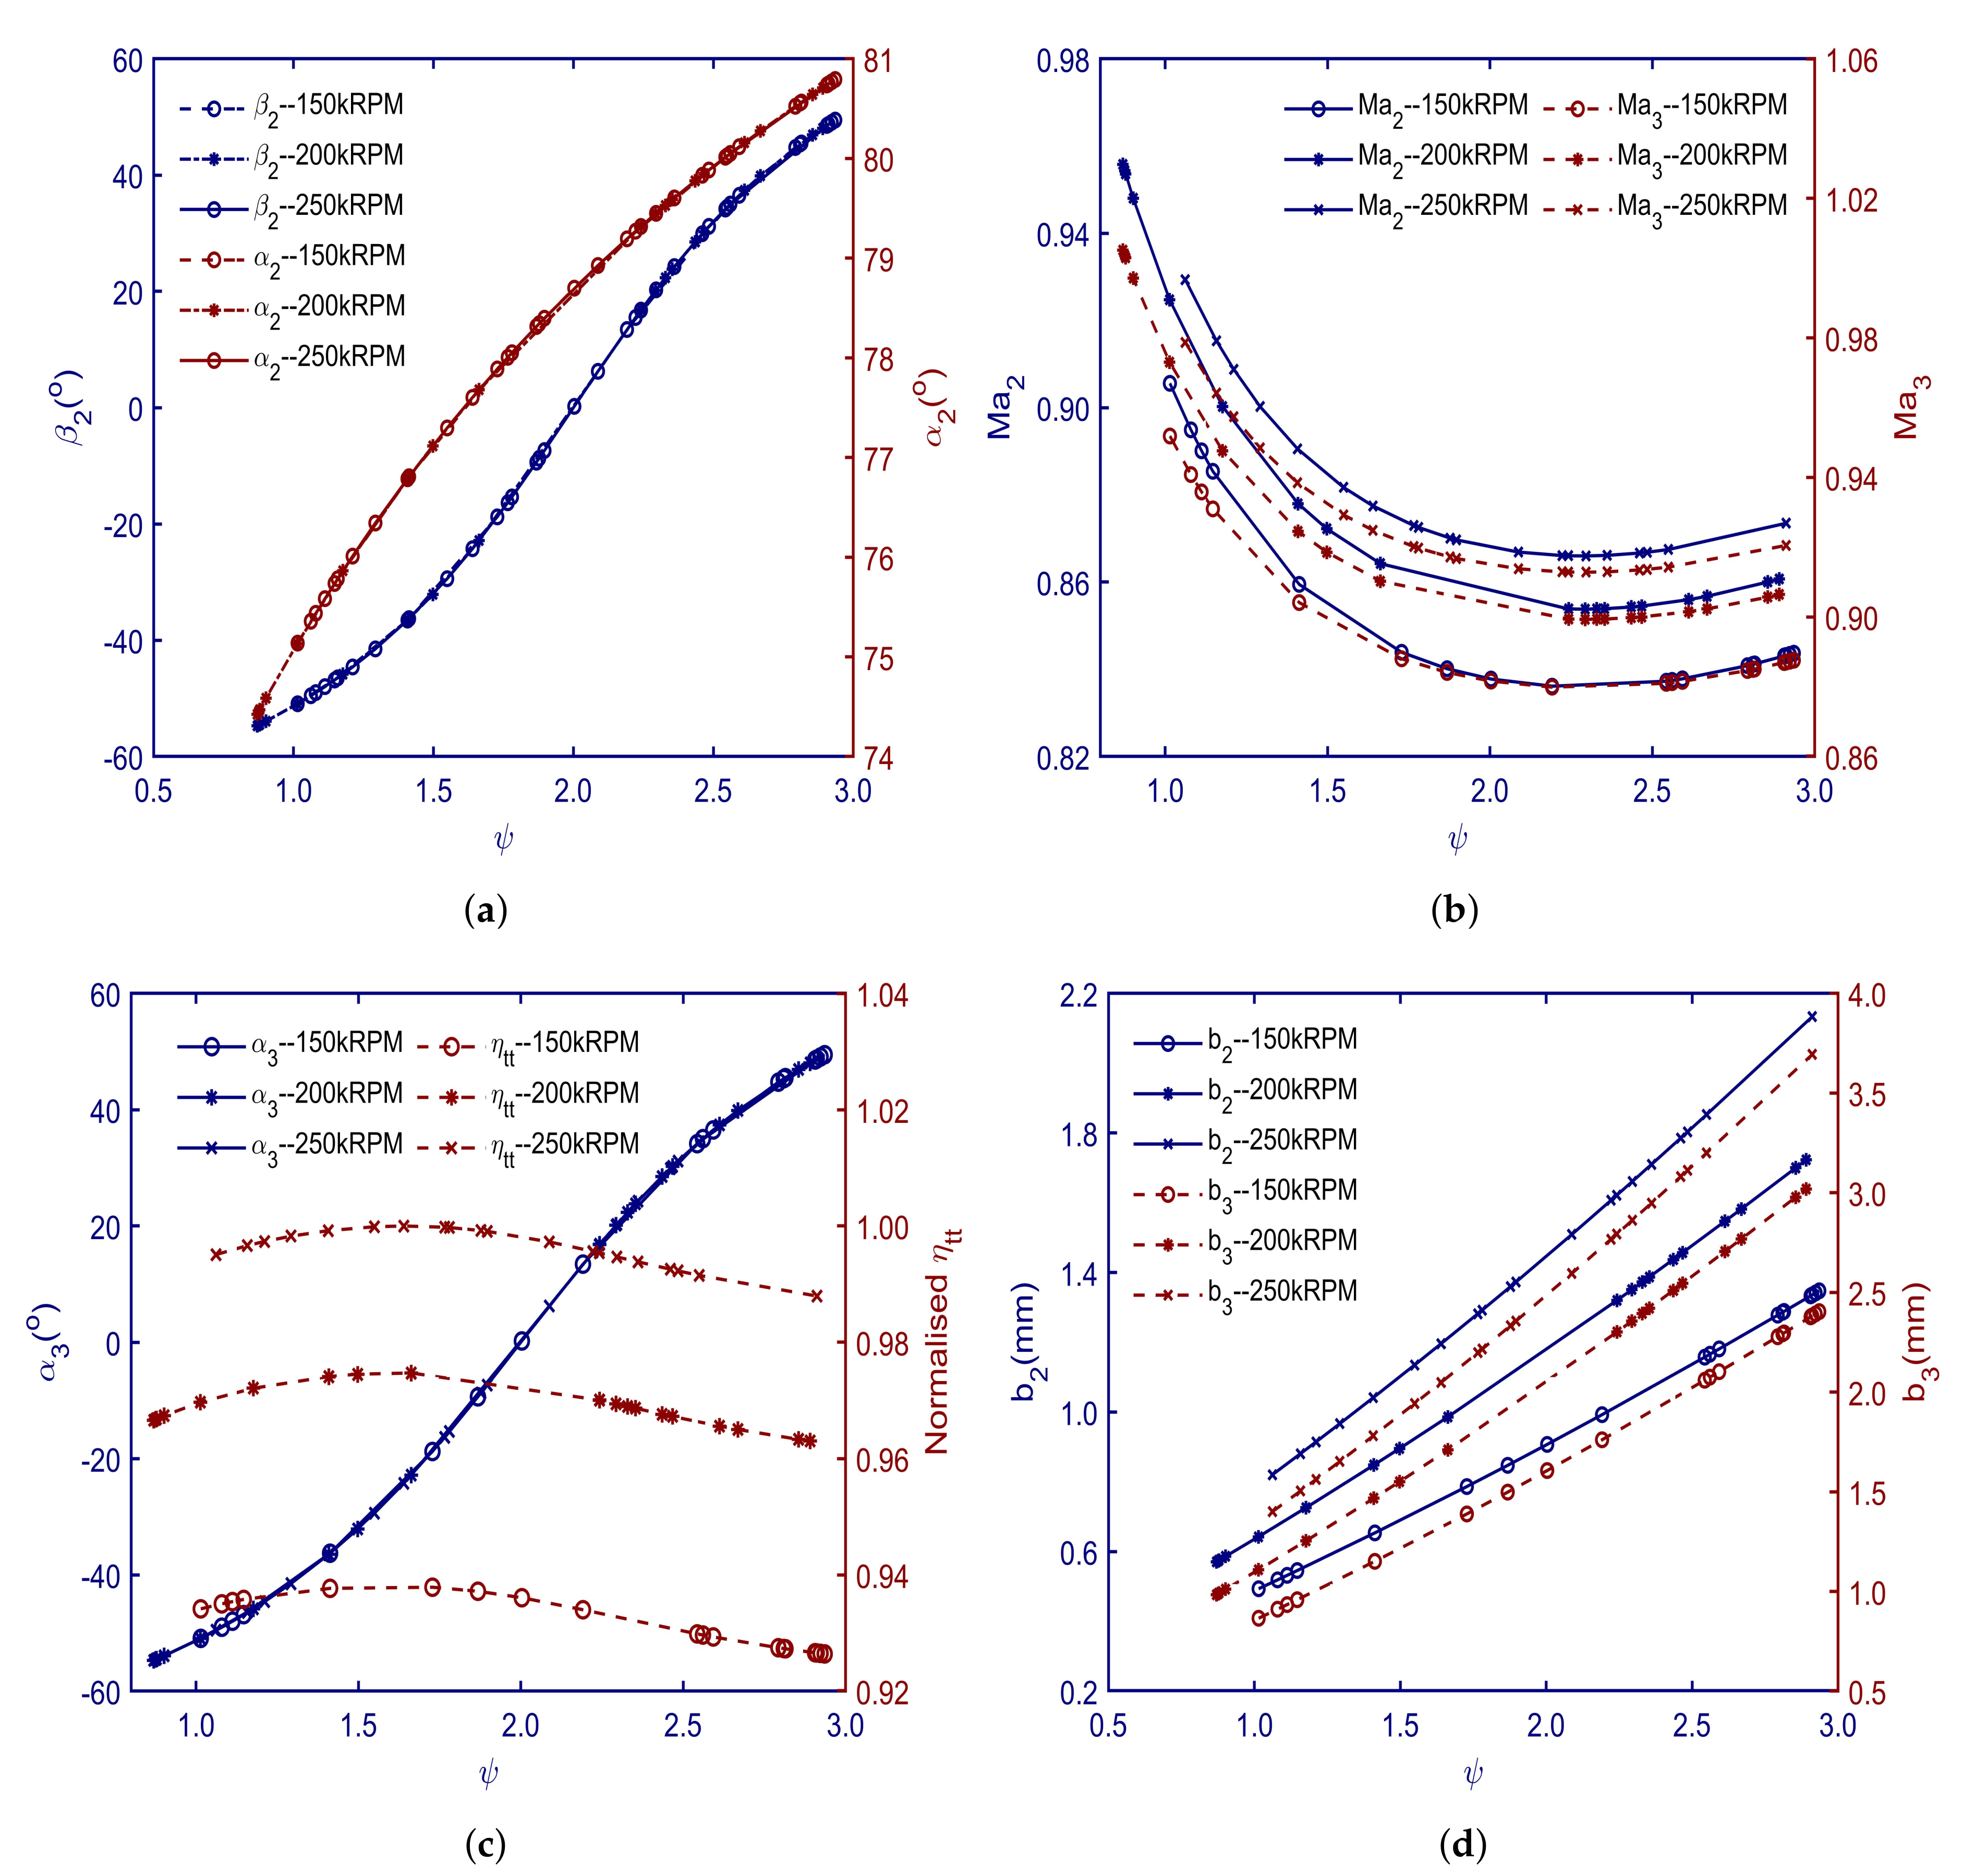
In the following set of results,
Figure 5a–d,
and
have been set to 0.2 and 0.5 respectively, whilst
is varied from 0.8 to 3.0. Increasing the loading coefficient from 0.8 to 3.0 results in an increase in both rotor absolute and relative inlet flow angles,
, from 74 to 81
and -60 to 60
respectively as shown in
Figure 5a. In principle, low loading coefficients result in higher efficiency, though it results in higher blade speed and thus high mechanical stresses; at values of 1.0 and 3.0 the mean blade speed (
) reaches approximately 522 and 306
, and results in a total blade stresses of 160 MPa and 76 MPa respectively. Meanwhile, at high loading values a smaller number of rotor blades is needed. Therefore, the design decision should be made based on the selected material, the maximum allowable stress, along with the required number of blades.
Furthermore, increasing the loading coefficient causes a slight decrease in both
and
, at the inlet and outlet of the rotor blades respectively, as shown in
Figure 5b; where
and
are the Mach numbers calculated with respect to the absolute and the relative velocity respectively. To achieve a subsonic flow at a flow coefficient of 0.2, the loading coefficient should be greater than 0.8.
Additionally, it was found that increasing the loading coefficient results in an efficiency increase until a maximum is reached at values of
ranging between 1.6 to 1.7 for the three rotational speeds. It’s worth mentioning the
has a limited effect on the efficiency at all rotational speeds for a flow coefficient of 0.2. The highest efficiency is achieved for the turbine designs that keep the swirl angle
close to the recommended value, which is recommended not to exceed 20
[
26], along with achieving the optimum difference in the whirl velocity components at the inlet and exit of the rotor. Increasing the exit circumferential velocity, owing to the increased swirl angle, results in an increase in centrifugal force which leads to an increased amount of flow reversal at the rotor outlet. Hence, higher losses and lower efficiencies are observed.
Increasing
results in an increase in the blade height at the rotor inlet and outlet blade heights reaching, up to 2.1 and 3.7 mm for
and
respectively at a speed of 250 kRPM (
Figure 5d). For feasible wheel manufacturing, it is hypothesised that inlet blade height and blade diameter should be designed to be above a minimum allowable rotor diameter of 30.00 mm and a minimum allowable blade height
of 1.25 mm [
11]. Thus, according to these criteria, for a design with a flow coefficient of 0.2 and rotational speed of 250 kRPM,
should be above 1.7. Owing to the micro-scale design dimensions, it is anticipated that micro-electrical discharge machining (EDM) milling could be used for the manufacturing of the turbine components. EDM is already in use for micro-gas turbines where high accuracy features, in the order of several micrometres, and surface finishes, with roughness values as low as 0.4
, can be achieved [
42]. Similar to this design scale, Korea institute of energy research (KIER) developed a prototype for sCO
Brayton cycle in which a 60 kW axial impulse turbine was manufactured; this demonstrates the ability to manufacture the turbine and the applicability of an axial turbine configuration for micro-scale applications [
43].
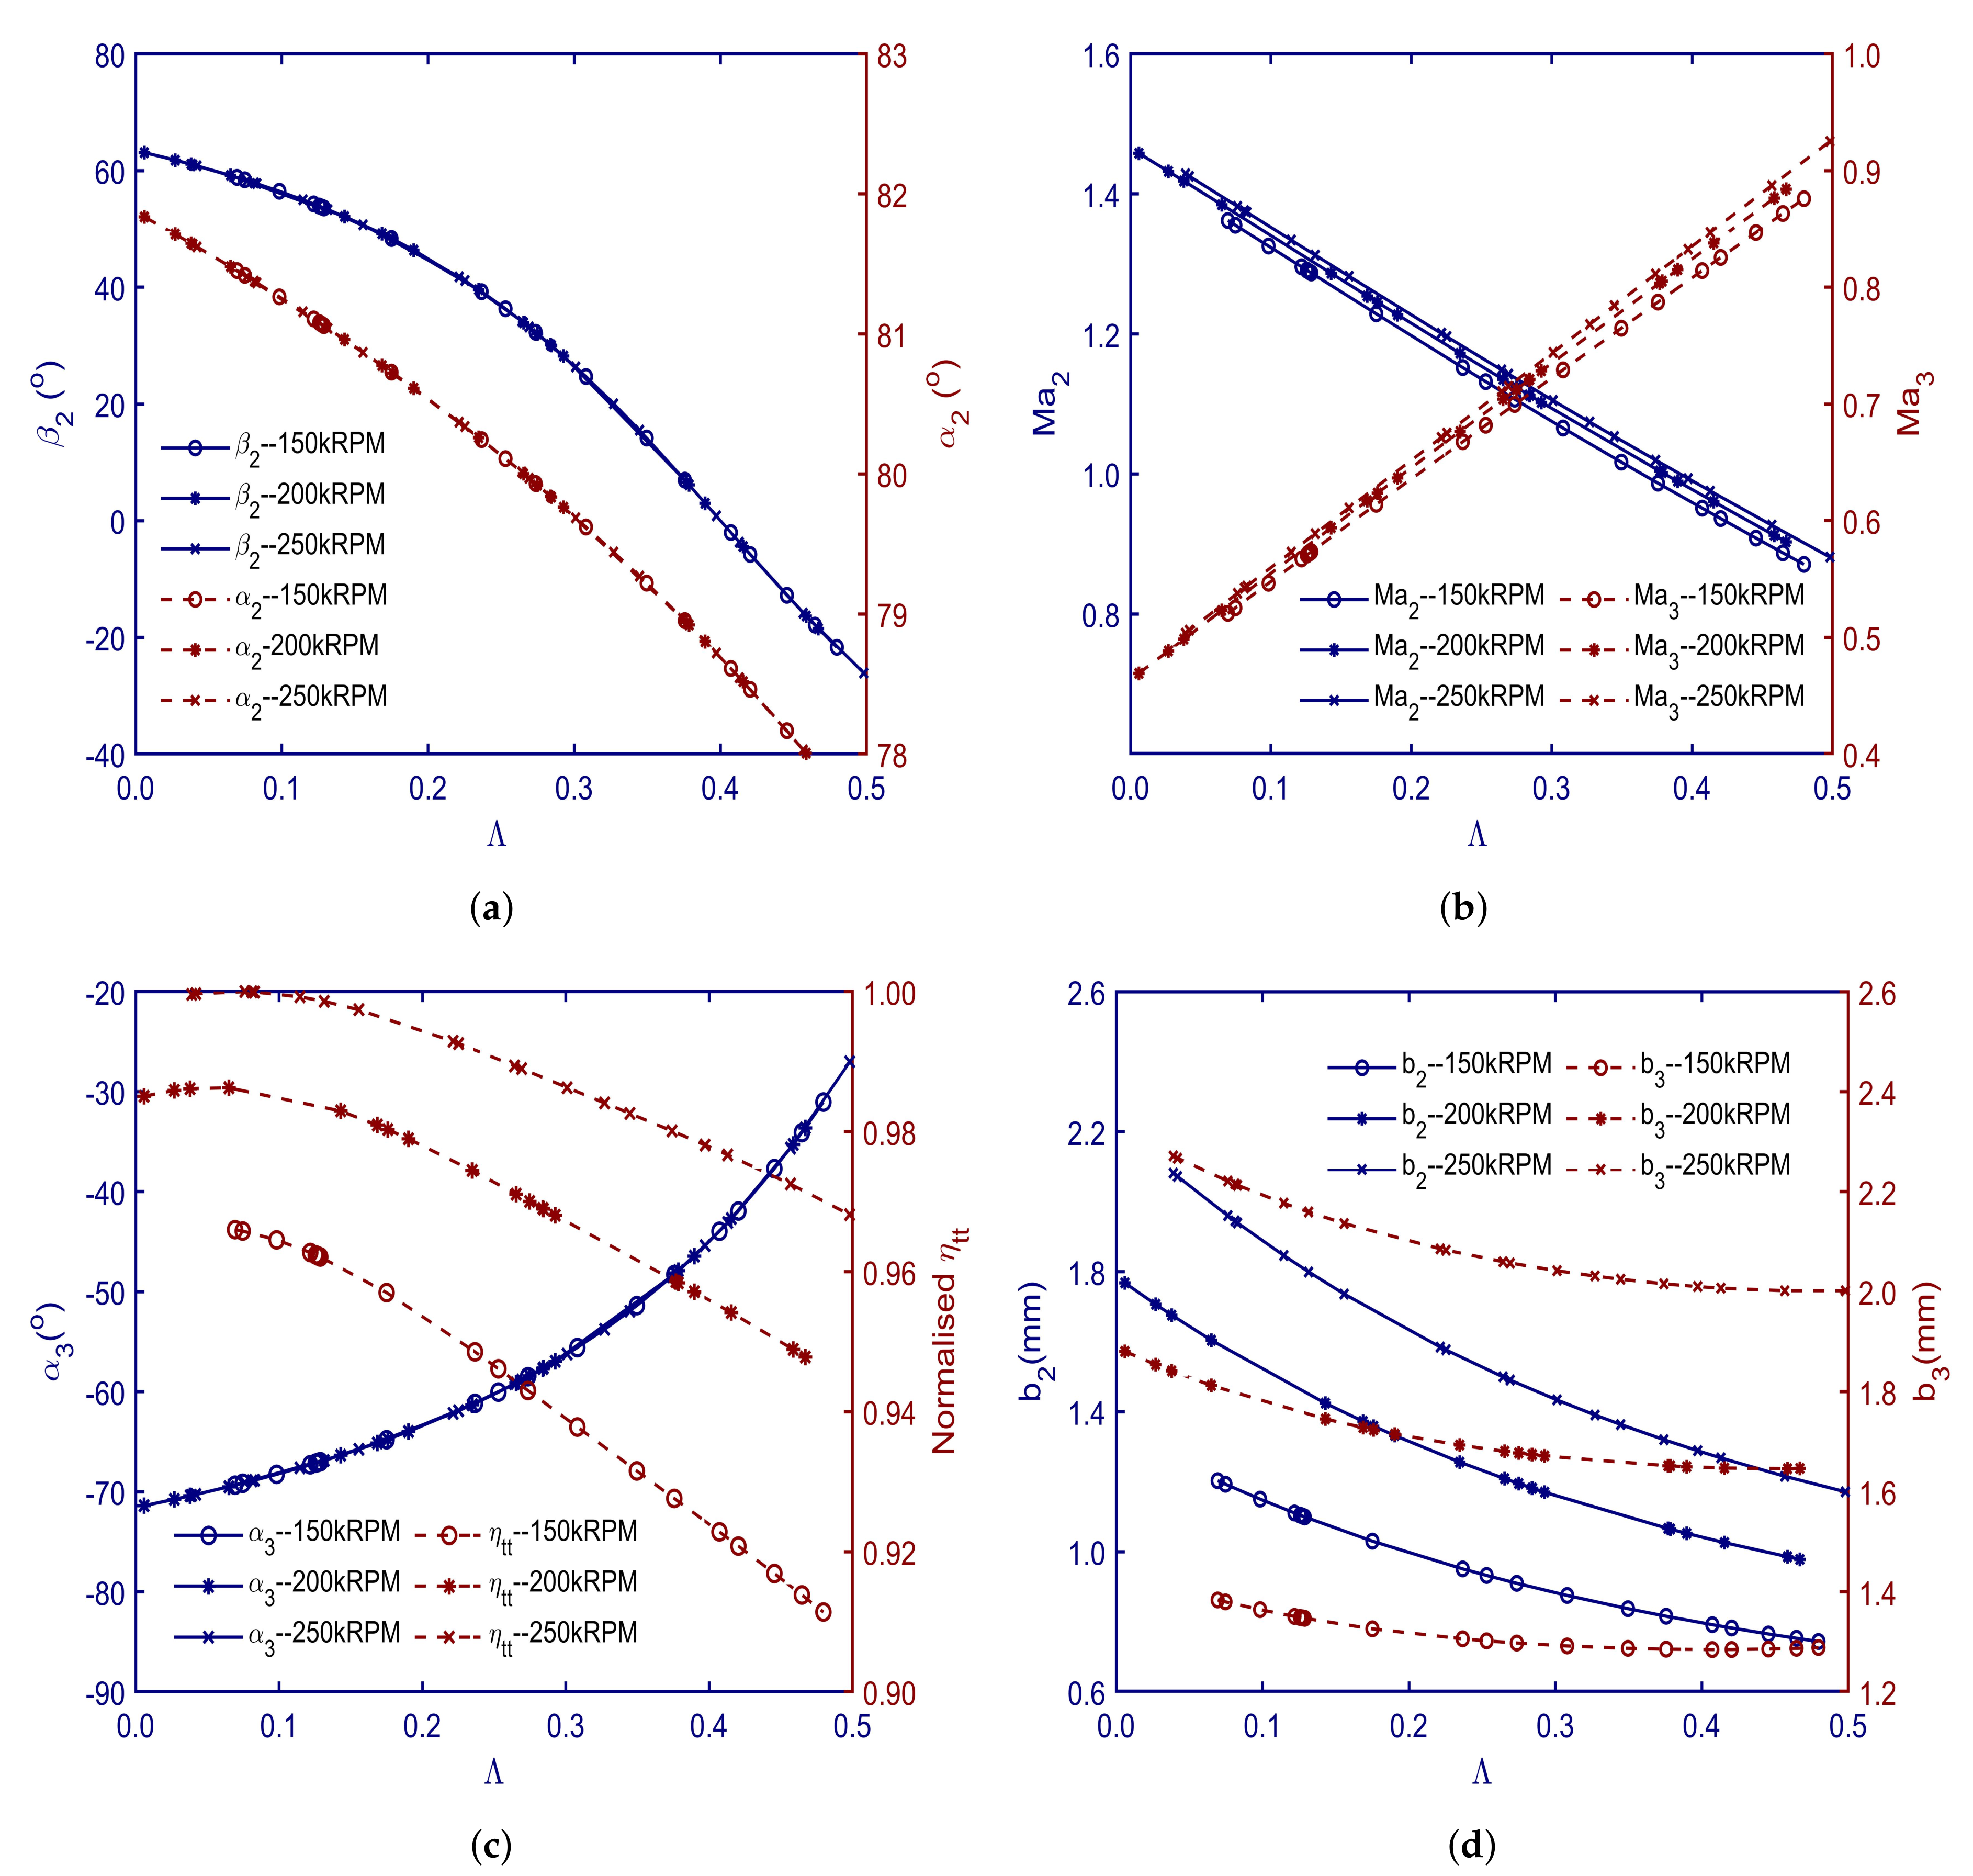
To investigate the effect of changing the degree of reaction on the performance of the axial turbine,
has been varied between 0.0 and 0.5 while fixing
to 0.2 and
to 1.6. Accordingly, the flow angle
decreased from 61 to −26
and
decreased from 82 to 78
as shown in
Figure 6a. In the same context, increasing the degree of reaction results in an increase in
from 0.50 to 0.92 and a decrease in
from 1.43 to 0.90 as shown in
Figure 6b. At low reaction values, the stator outlet velocity is high as a result of the large acceleration and thus the Mach number is expected to be high. A higher degree of reaction results in a thin boundary layer and less tendency to secondary flow as result of having a good acceleration at the stator outlet [
44].
A noticeable decrease in the efficiency has been experienced while increasing the degree of reaction from 0.0 to 0.5, and this is found for all three of the rotational speeds considered. Particularly, the normalised efficiency decreased from 0.97 to 0.91 at a rotational speed of 150 kRPM. At high degree of reaction values, the swirl angle is small which results in less rotor losses. However, high degree of reaction results in low rotor inlet blade angles (
), and hence an overall reduction in the efficiency as observed in
Figure 6c. In view of the fact that high reaction leads to higher pressure and high density at the rotor inlet, the blade heights decrease as the degree of reaction is increased, as shown in
Figure 6d. A maximum value of 2.20 mm was found at zero reaction and 250 kRPM and a minimum of 0.74 mm at 150 KRPM and reaction of 0.5.
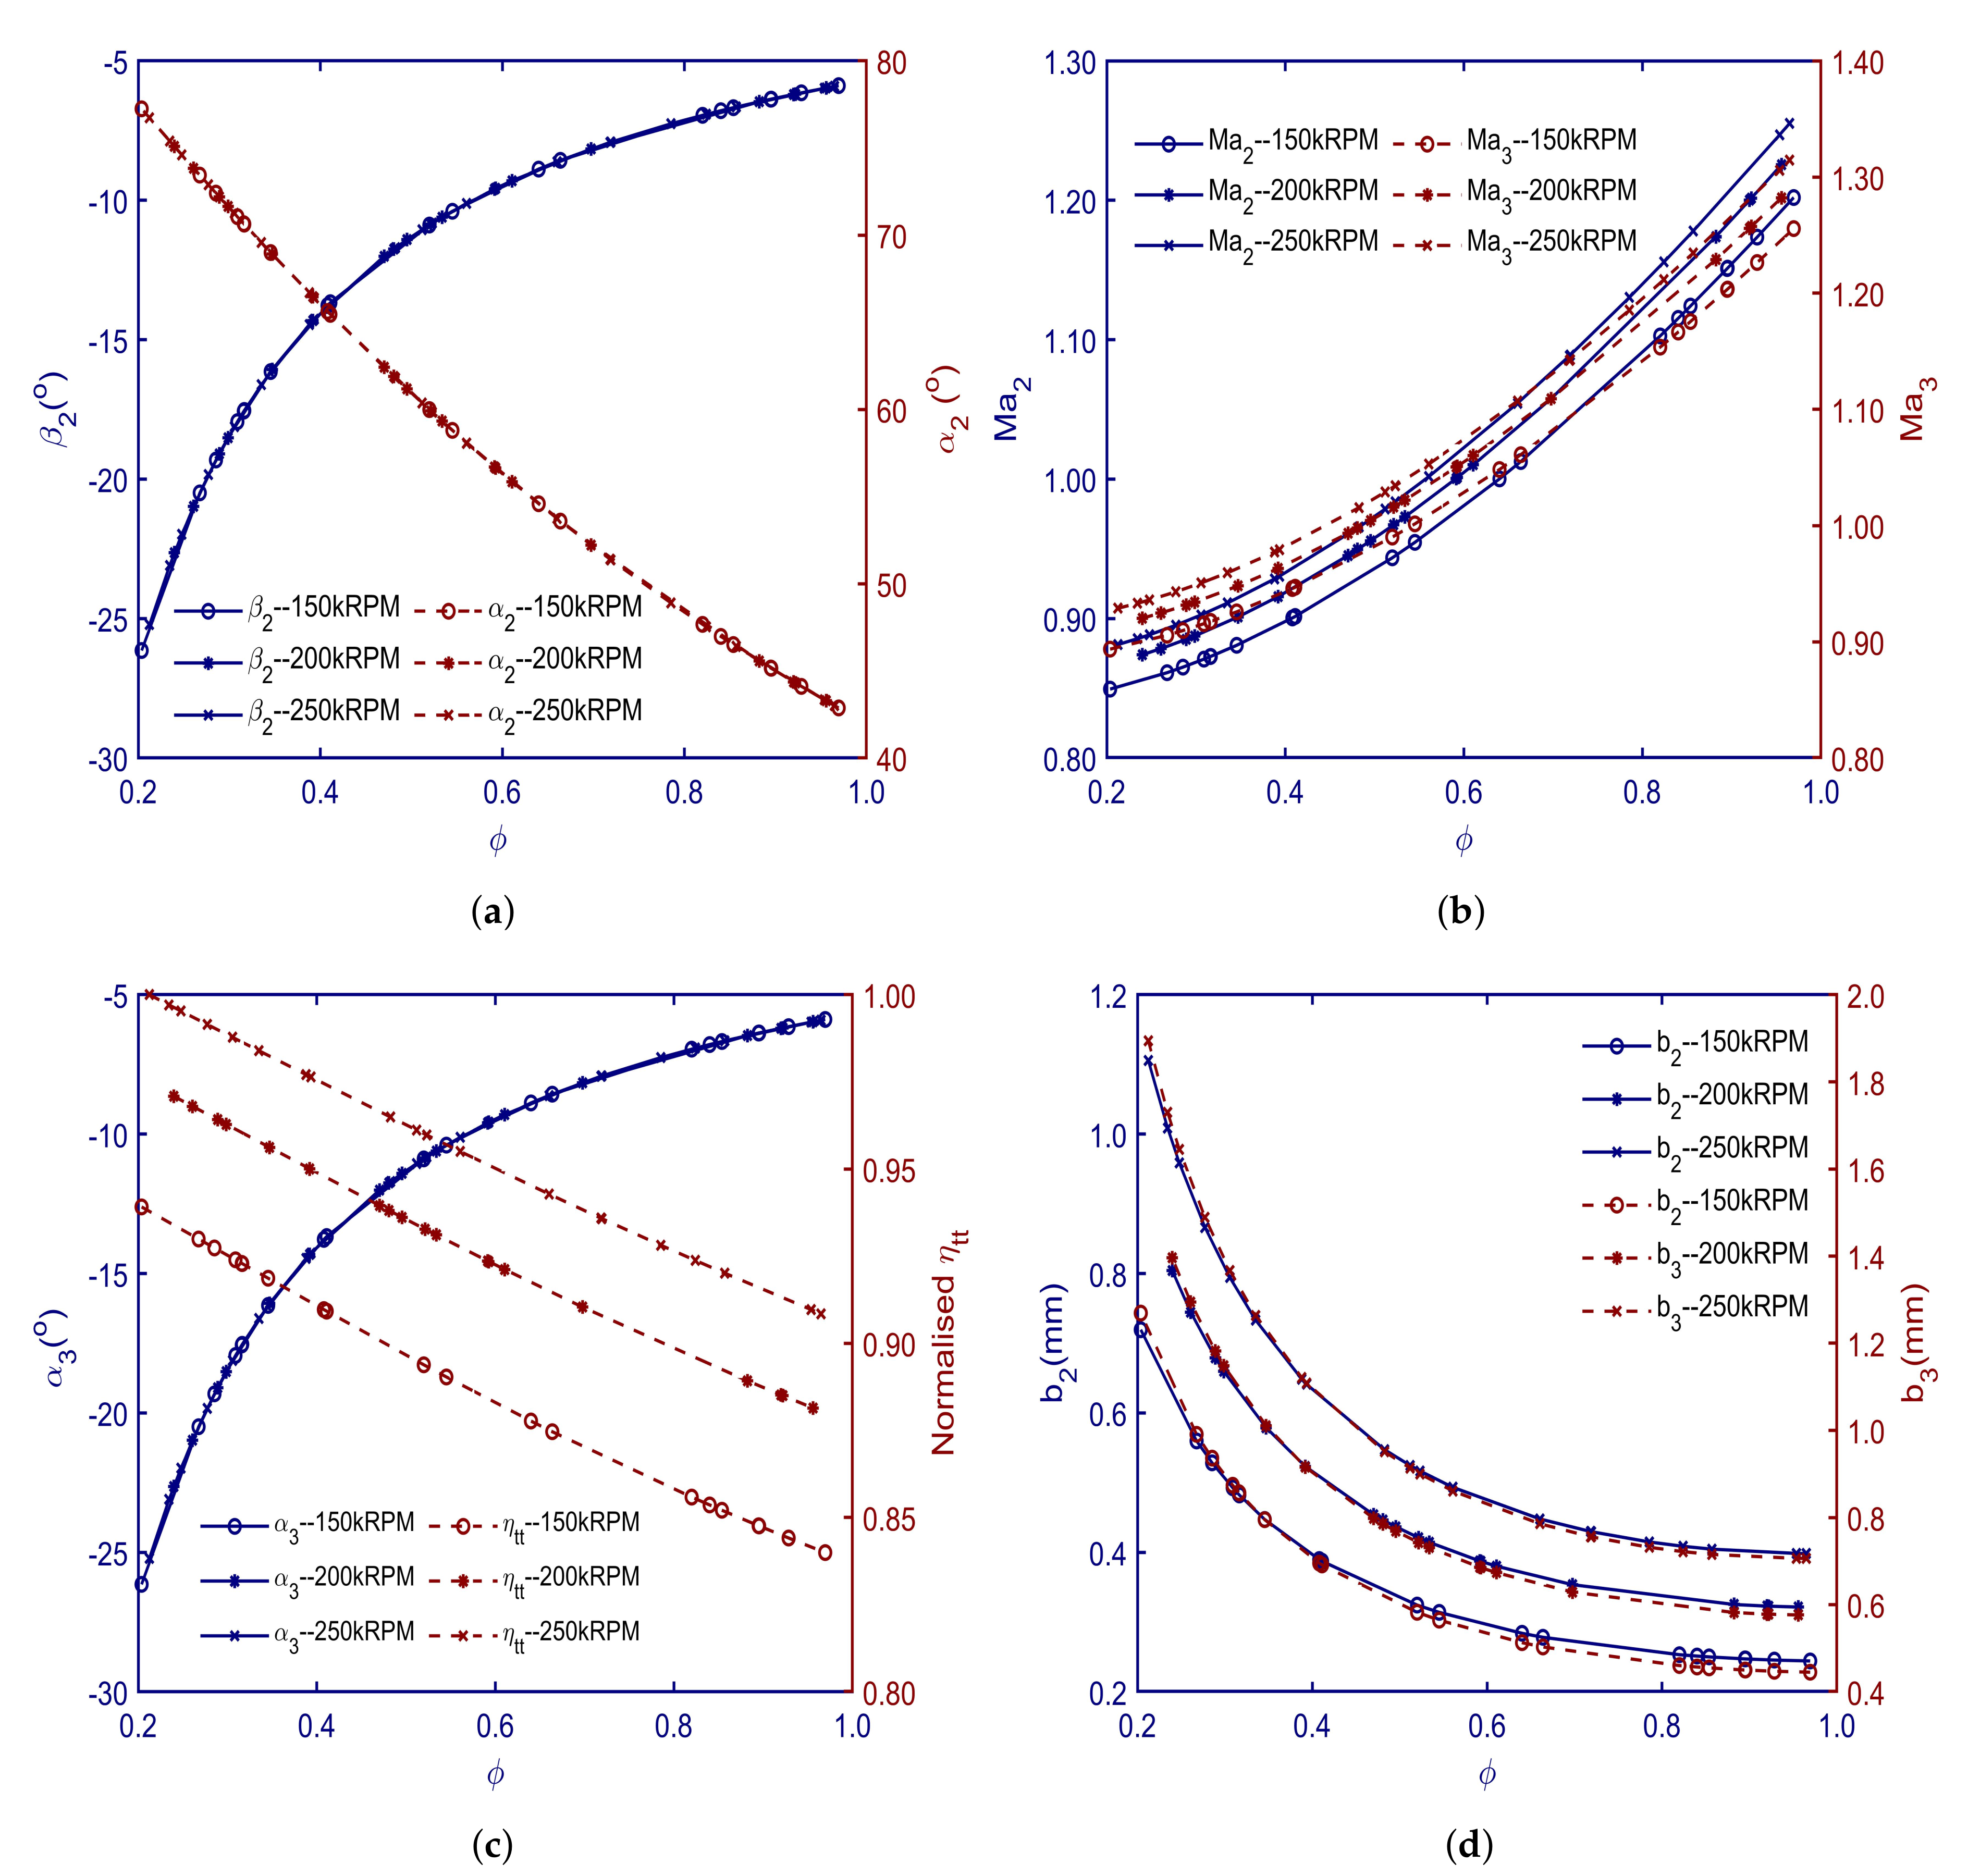
To investigate the effect of the flow coefficient on the turbine performance, the analysis has been repeated at
= 0.5 and
= 1.60 respectively. Reducing
over the range from 0.2 to 1 results in an increase in rotor outlet flow angle
from 43 to 77
as shown in
Figure 7. However, increasing the flow coefficient also resulted in an increase in both Mach numbers, as shown in
Figure 7, where
increased from 0.88 to 1.30 and
increased from 0.93 to 1.34 at 250 kRPM; thus, supersonic conditions occur in both the rotor and stator. To ensure subsonic flow at the rotor inlet, the flow coefficient should be kept below 0.45 for a loading coefficient of 1.6 and degree of reaction of 0.5.
Furthermore, increasing the flow coefficient results in an efficiency decrease at all rotational speeds, as observed in
Figure 7c. Additionally, it results in a decrease in swirl angle from 26 to 5
. However, at high flow coefficients, low swirl angles and low rotor inlet blade angles (
) are achieved. Increasing the flow coefficient results in higher Mach number at the rotor exit and hence higher losses incurred by the formation of shock waves in the rotor blade passages. Additionally, profile losses will be higher owing to the boundary layer growth, whilst friction losses at the exit are expected to be high. Consequently, a drop-in efficiency is observed at higher flow coefficients. The effect of changing the flow coefficient on the blade heights is shown in
Figure 7d. Increasing the flow coefficient resulted in a decrease in both blade heights at all speeds. A minimum inlet blade height of 0.24 mm is found at a rotational speed of 150 kRPM and flow coefficient of 1.0.
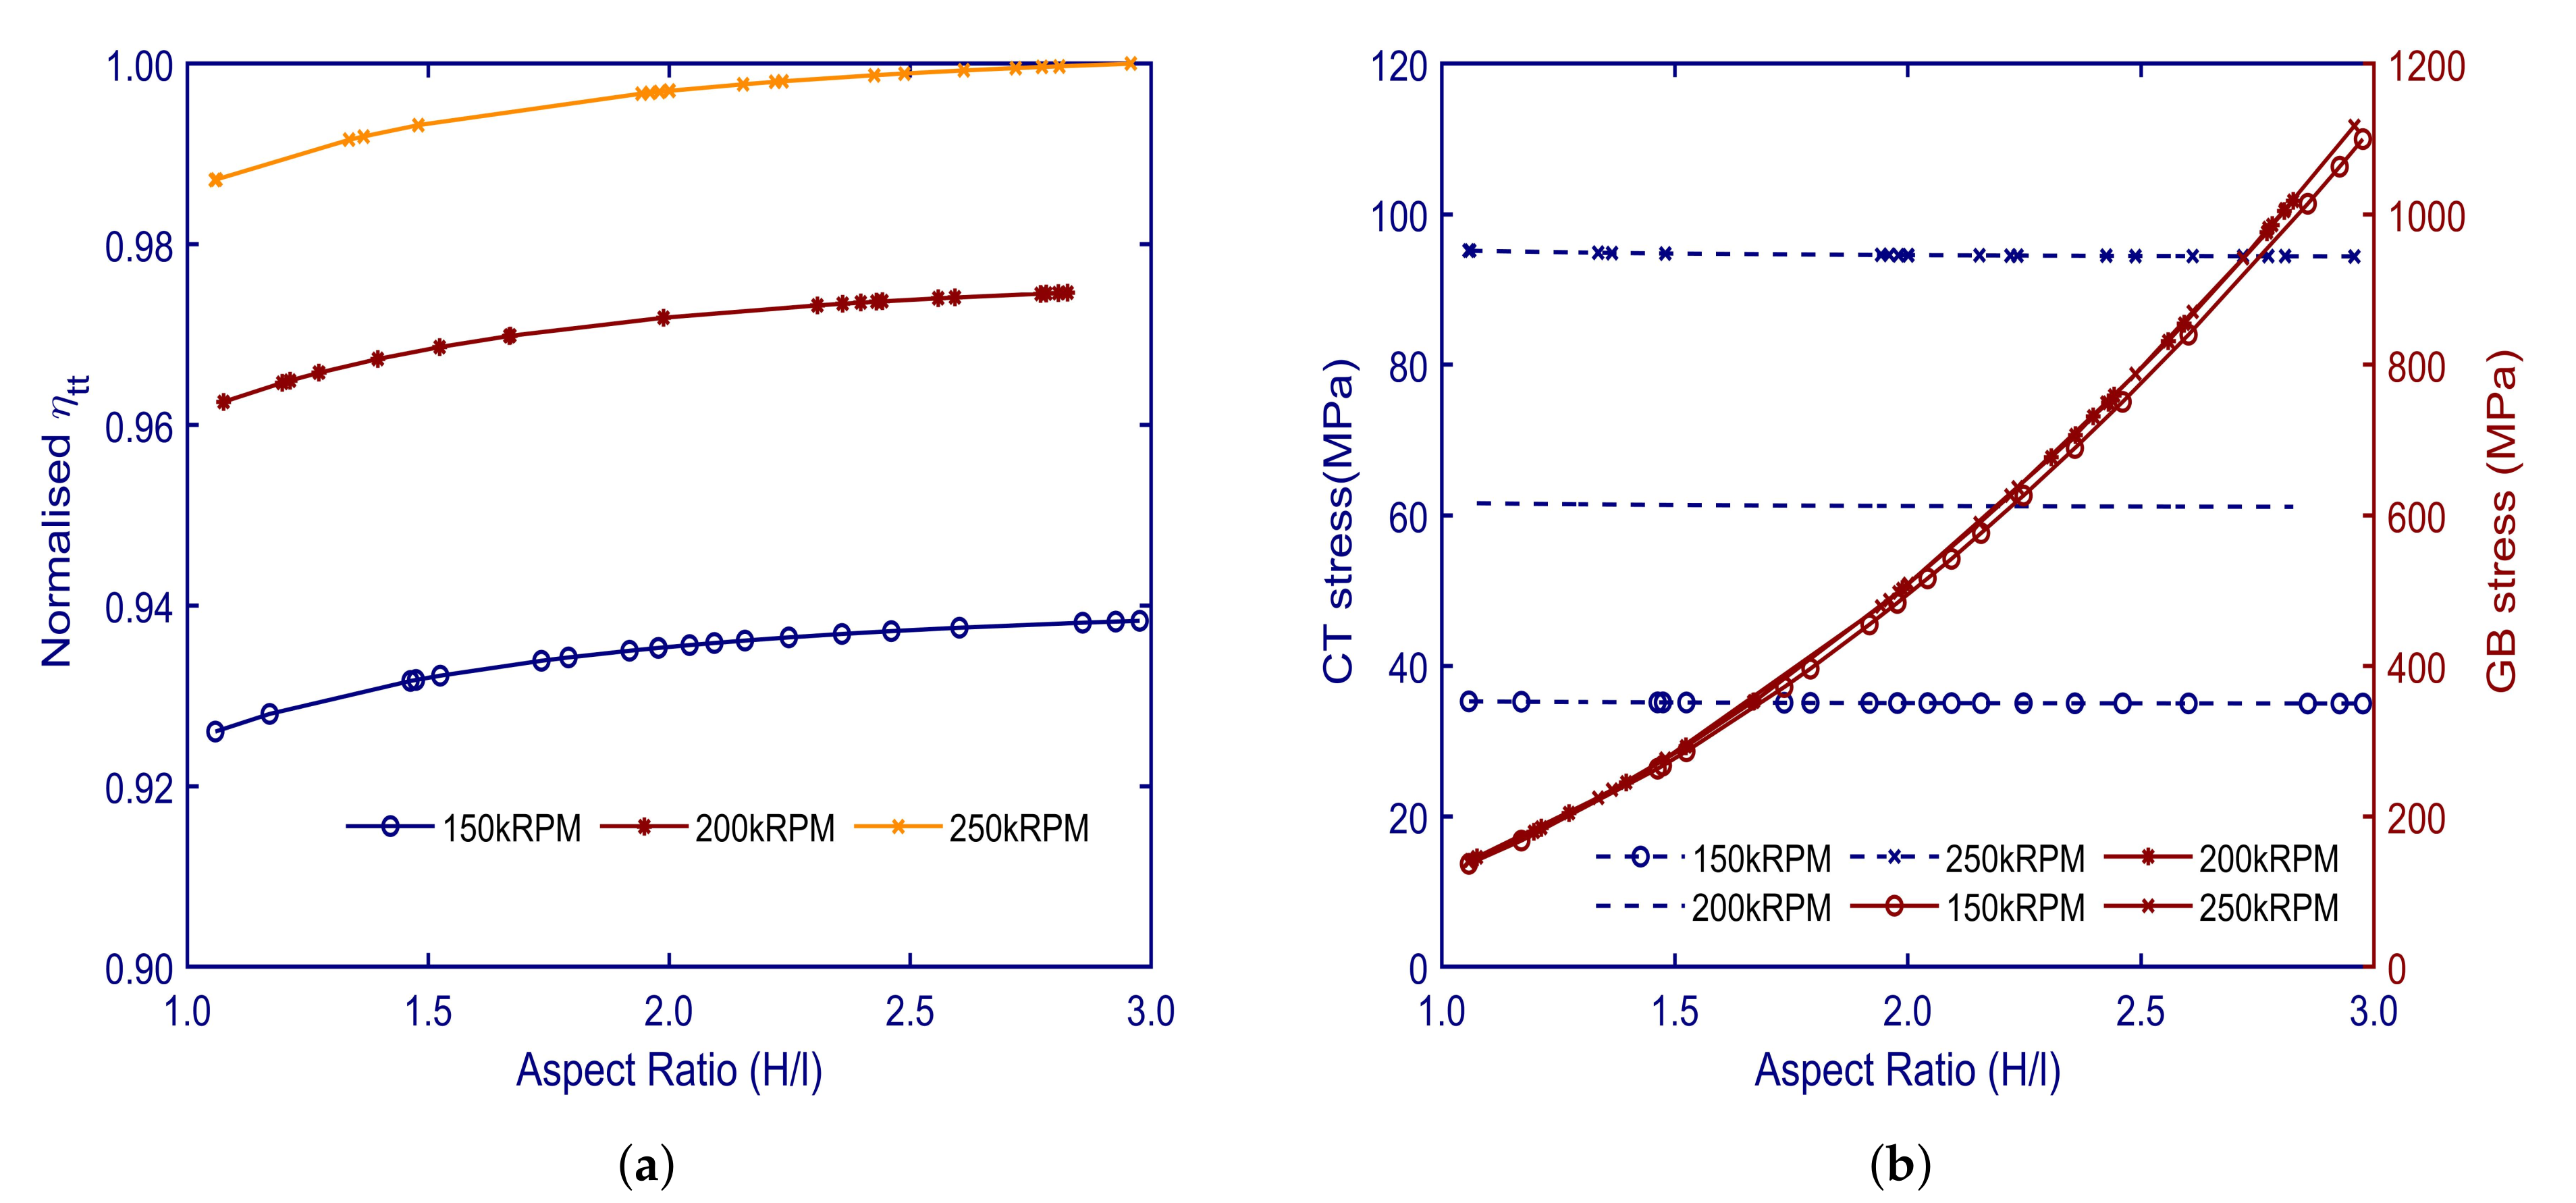
The effect of changing the aspect ratio on the turbine efficiency is shown in
Figure 8a. Increasing the aspect ratio from 1 to 3 resulted in the normalised efficiency increasing from 0.987 to 1.000 at 250 kRPM. Higher aspect ratios result in lower rotor and stator losses and higher efficiency. For high aspect ratios, secondary effects are confined to the end-wall region. However, it affects the whole passage for small aspect ratios [
44]. The gas bending and centrifugal tensile stresses have been evaluated for the selected material at a design condition of
= 0.2,
= 1.6,
= 0.5, 150 kRPM and aspect ratio of 1.At this point, the gas bending and centrifugal tensile stresses are predicted to be 122 and 35 MPa respectively; resulting into a total stress of 157 MPa, which falls within the material allowable limit (
= 303 MPa). A creep failure criterion, which shows the continuous application of a steady stress over a period of time at various temperatures required to produce 0.2 percent strain, is used to assess blade life. Based on the results from [
26], it is anticipated that a blade life of 10,000 hr can be achieved under these operating conditions. It is worth emphasising that creep failure is an important consideration, but a detailed analysis is outside the scope of this study.
A noticeable difference between the magnitude of the gas bending (GB) stress in comparison to the centrifugal tensile (CT) stress, for tapered blades, is experienced owing to the density effect of sCO
. Increasing the aspect ratio from 1 to 3 results in an increase in the gas bending stress by a factor of approximately 9. Furthermore, decreasing the degree of reaction from 0.5 to zero results in a decrease in the the gas bending stress by a factor of approximately 4. Hence, the aspect ratio and the degree of reaction should be minimised. However, decreasing the aspect ratio is associated with a drop in efficiency. Therefore, selecting the optimal aspect ratio is a trade-off between high efficiency and low stresses. Increasing the rotational speed from 150 to 250 kRPM results in centrifugal tensile stress increasing from 35 to 95 MPa as shown in
Figure 8b.
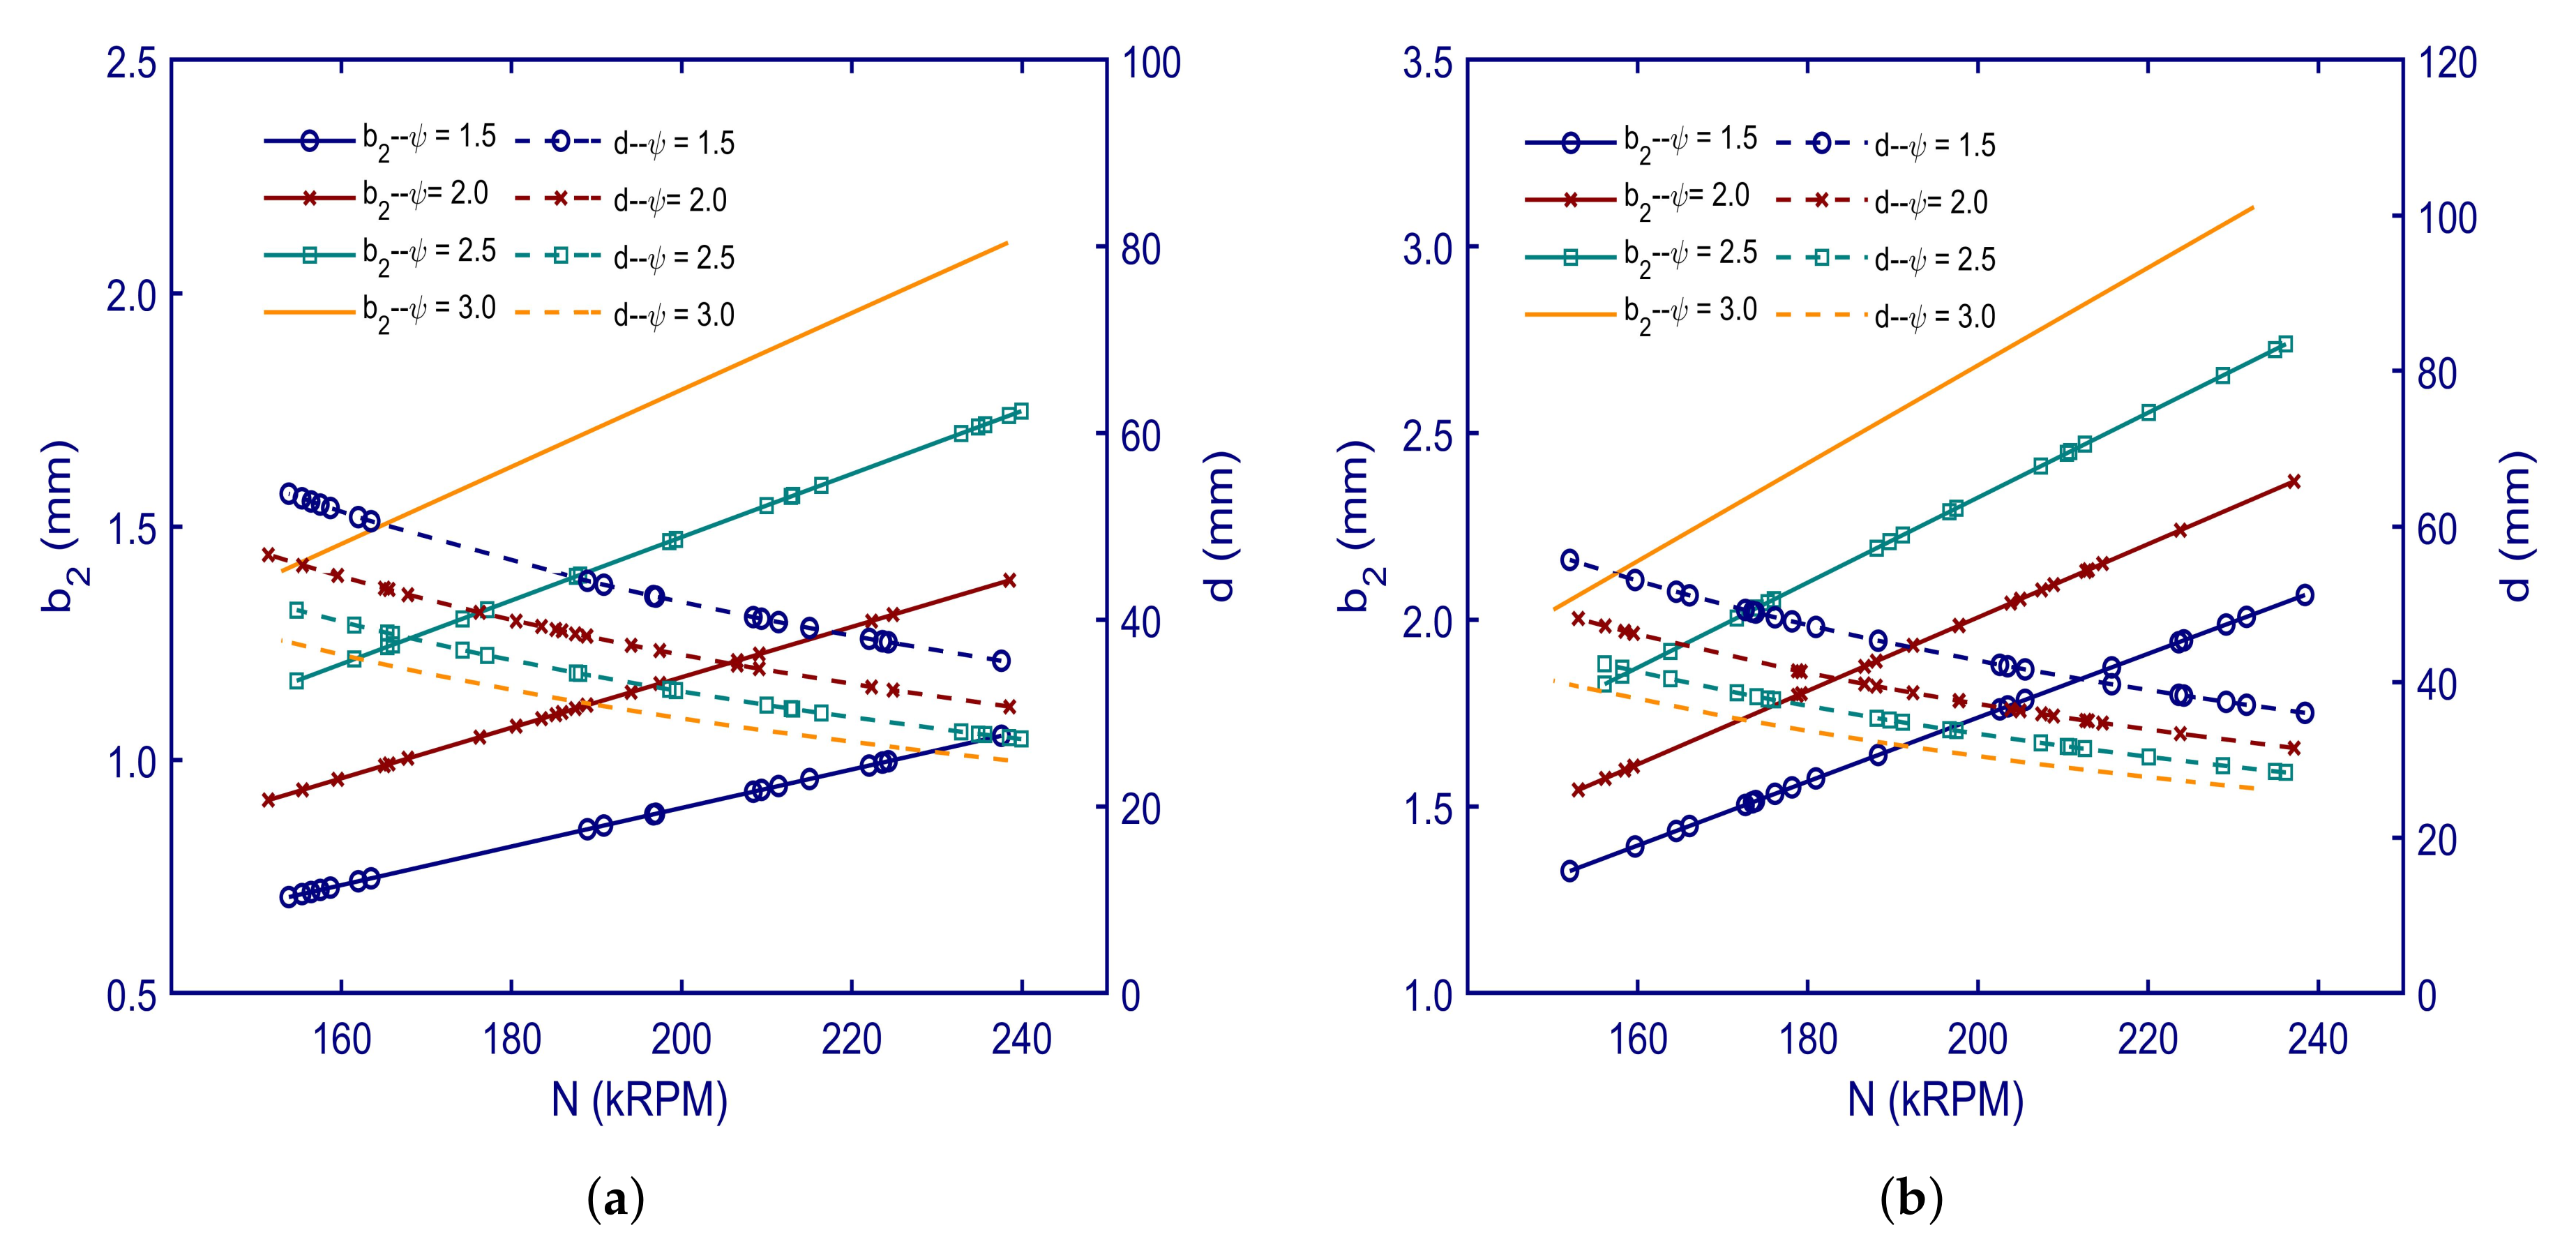
The last part of the parametric study aims to show how the turbine design parameters can be varied to obtain a feasible turbine geometry, defined by a minimum allowable rotor diameter and inlet blade height of 30.00 mm and 1.25 mm respectively, over the range of the rotational speeds from 150 to 250 kRPM. The feasibility criteria can be achieved by operating at a high loading coefficient, where the diameter and inlet blade height are largest. Increasing the rotational speed results in a decrease in the diameter and an increase in the blade height. Hence, this should be considered during the selection of the rotational speed and flow coefficient of the turbine as shown in
Figure 9a,b. The results reported in
Figure 9a refer to 0.5 degree of reaction, while those in
Figure 9b refer to zero degree of reaction. Thus, it can be concluded that running at a zero reaction (impulse) results in a more feasible range of inlet blade heights and diameters. The maximum diameter that can be achieved is 56 mm with a maximum inlet blade height of 3.3 mm at a flow coefficient of 0.2.
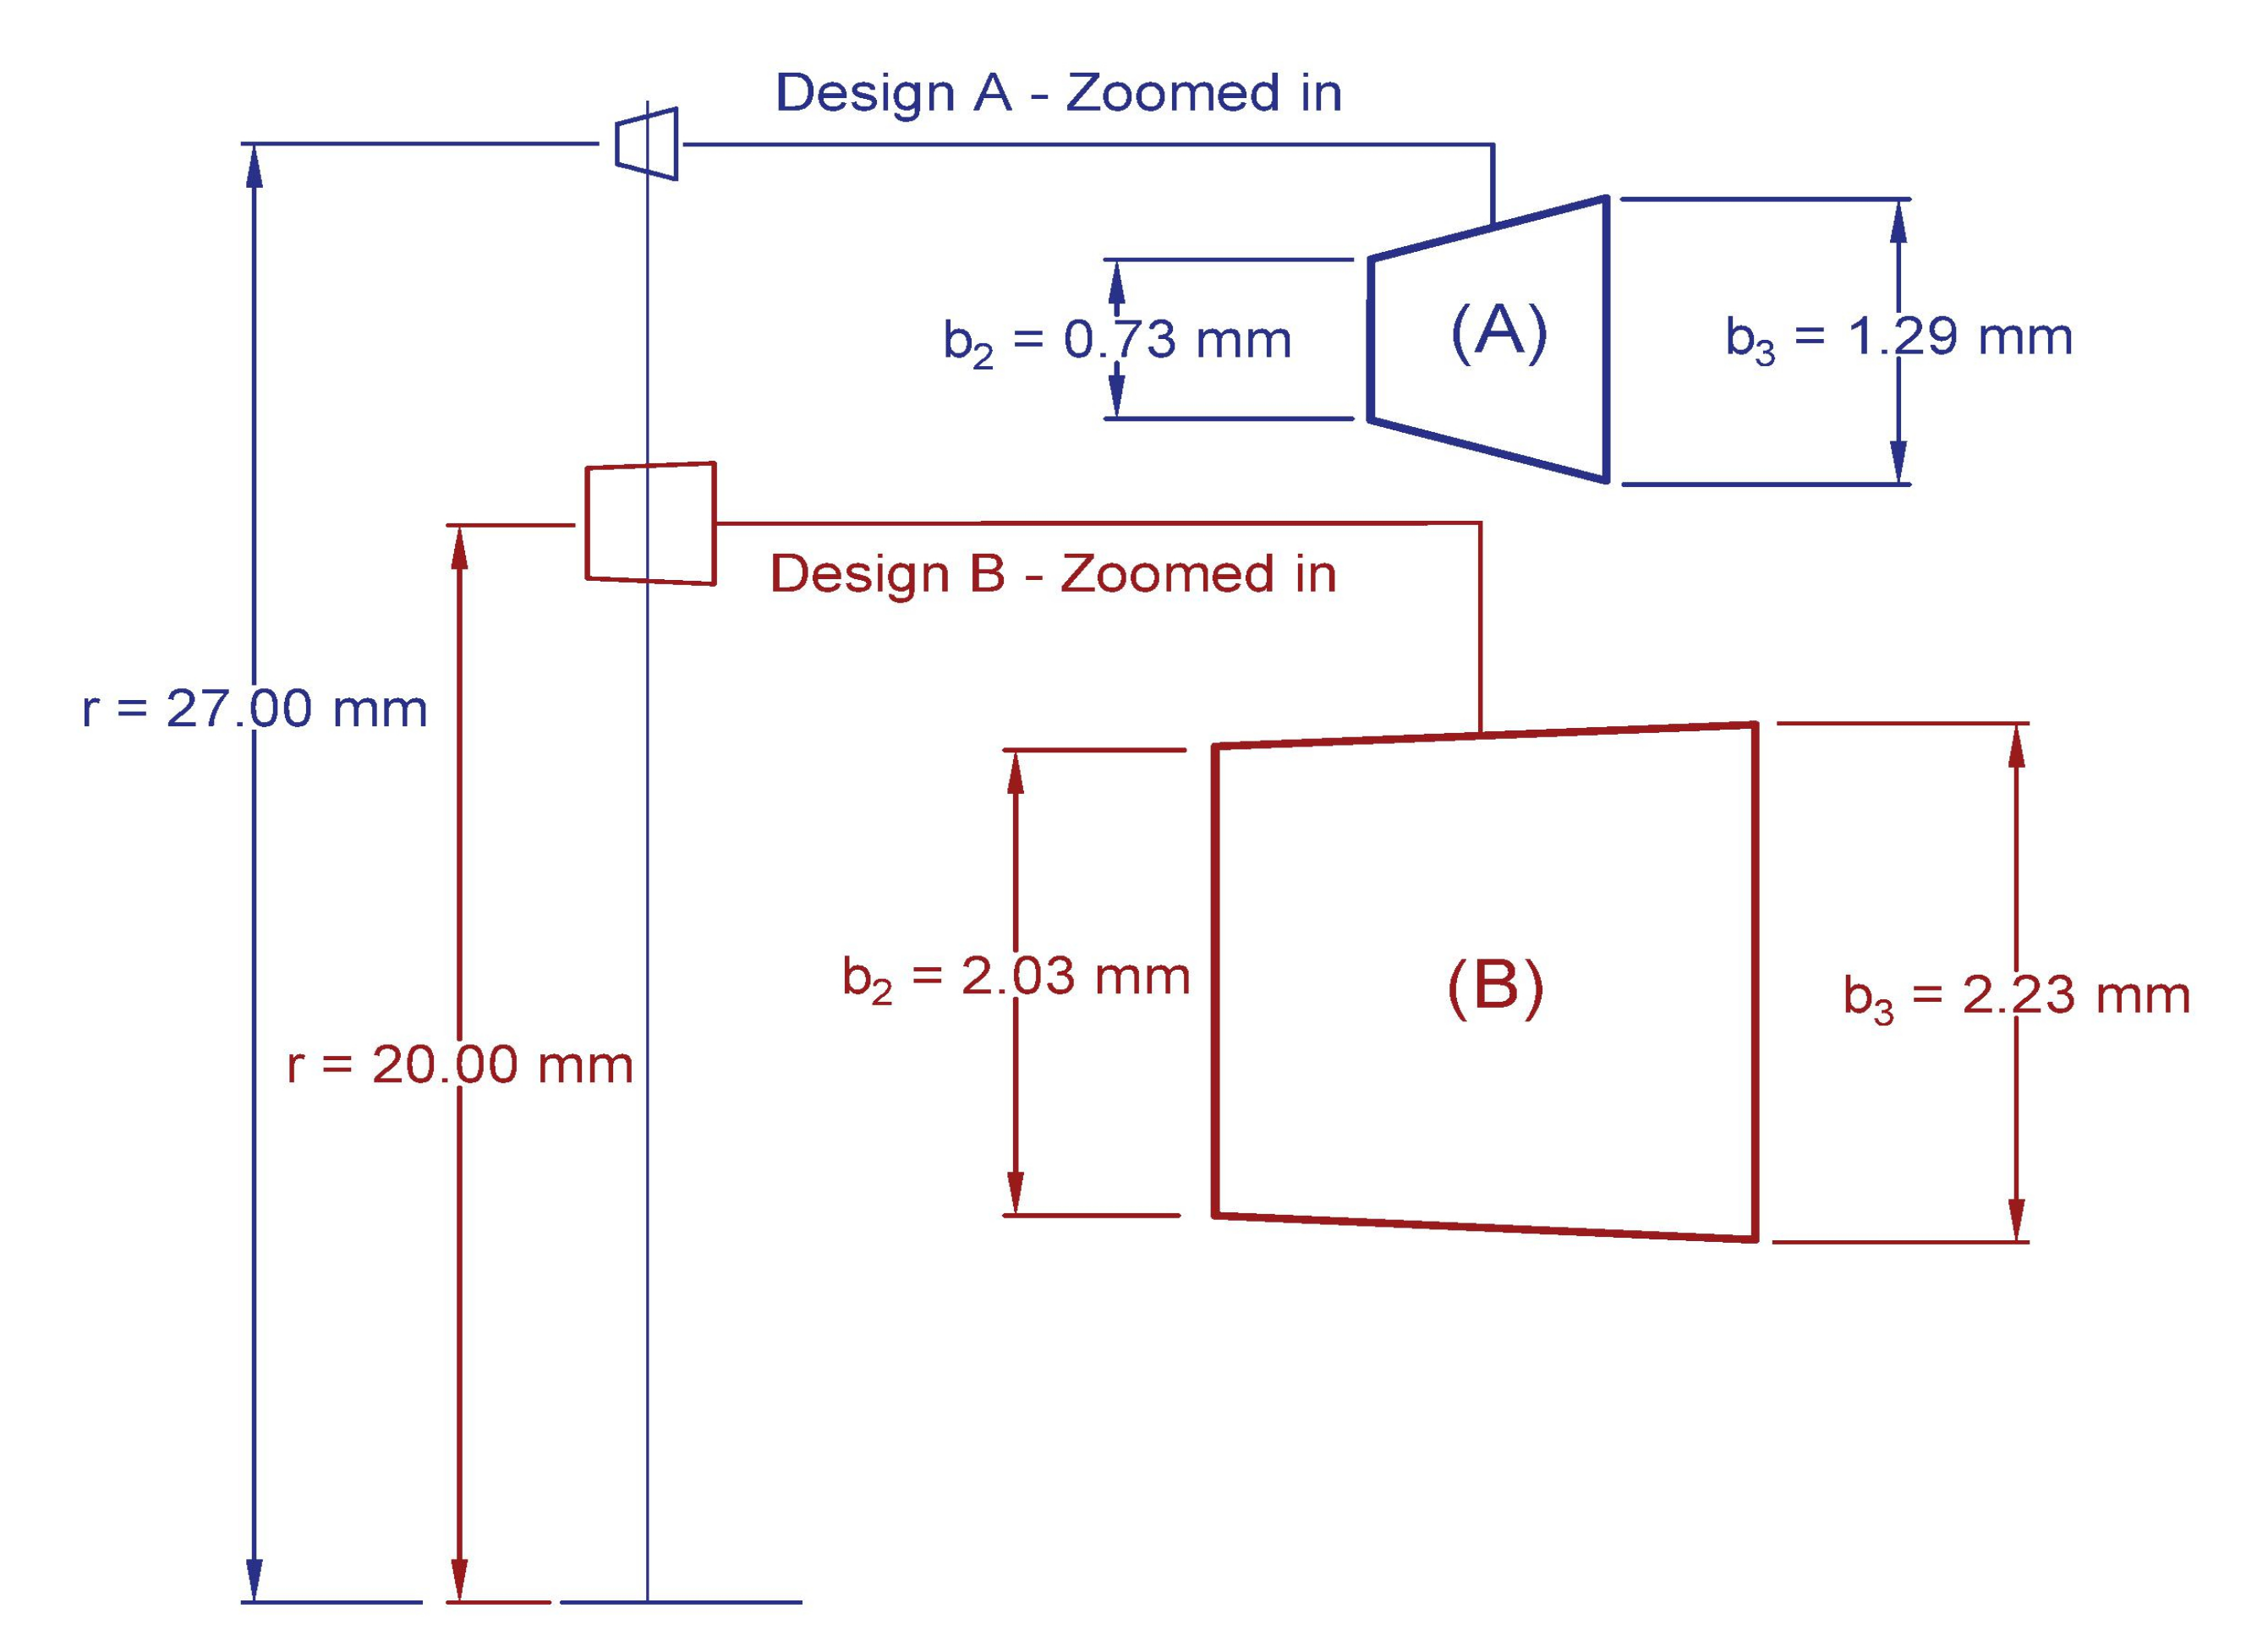
A comparison between two turbine designs, to depict the effect of the selected design variables on the final turbine geometry, is presented in
Figure 10. Geometry (A) is obtained at
= 0.5,
= 1.6 and
= 0.2, while geometry (B) is obtained at
= 0.0,
= 3.0 and
= 0.2 at 150 kRPM. Reducing the degree of reaction and increasing the loading coefficient results in more feasible design dimensions (Design B).


