Article

Investigation on Gas Hydrates Formation and Dissociation in Multiphase Gas Dominant Transmission Pipelines

by
Sayani Jai Krishna Sahith
1,2,
Srinivasa Rao Pedapati
1 and
Bhajan Lal
2,3,*
1
Department of Mechanical Engineering, Universiti Teknologi PETRONAS, Bandar Seri Iskandar, 32610 Perak, Malaysia
2
CO2 Research Centre (CO2RES), Universiti Teknologi PETRONAS, Bandar Seri Iskandar, 32610 Perak, Malaysia
3
Chemical Engineering Department, Universiti Teknologi PETRONAS, 32610 Bandar Seri Iskandar, Perak Darul Ridzuan, Malaysia
*
Author to whom correspondence should be addressed.
Appl. Sci. 2020, 10(15), 5052; https://doi.org/10.3390/app10155052
Submission received: 19 May 2020 / Revised: 25 June 2020 / Accepted: 26 June 2020 / Published: 22 July 2020

Abstract

:
In this work, a gas hydrate formation and dissociation study was performed on two multiphase pipeline systems containing gasoline, CO2, water, and crude oil, CO2, water, in the pressure range of 2.5–3.5 MPa with fixed water cut as 15% using gas hydrate rocking cell equipment. The system has 10, 15 and 20 wt.% concentrations of gasoline and crude oil, respectively. From the obtained hydrate-liquid-vapor-equilibrium (HLVE) data, the phase diagrams for the system are constructed and analyzed to represent the phase behavior in the multiphase pipelines. Similarly, induction time and rate of gas hydrate formation studies were performed for gasoline, CO2, and water, and crude oil, CO2, water system. From the evaluation of phase behavior based on the HLVE curve, the multiphase system with gasoline exhibits an inhibition in gas hydrates formation, as the HLVE curve shifts towards the lower temperature and higher-pressure region. The multiphase system containing the crude oil system shows a promotion of gas hydrates formation, as the HLVE curve shifted towards the higher temperature and lower pressure. Similarly, the kinetics of hydrate formation of gas hydrates in the gasoline system is slow. At the same time, crude oil has a rapid gas hydrate formation rate.

1. Introduction

Multiphase flows can be defined as a fluid flow system comprising two or more phases that are distinct, simultaneously co-flowing in a mixture where the level of separation between phases is at a scale well above the molecular level [1]. Multiphase flow through pipelines is encountered in many engineering installations. In the petroleum, chemical processing, and many other industries, problems associated with the multiphase flow through pipelines have been of interest for a long time. In the petroleum industry, it occurs in oil and gas wells, gathering systems, many piping systems, and critical pieces of equipment needed in refineries and petrochemical industries, such as boilers, condensers, and separators. The low temperature and high-pressure conditions in production pipelines at the subsea region often result in the formation of gas hydrates, causing blockage and affecting transmission safety.
Sir Humphrey Davy first identified gas hydrates or clathrate in 1810. They are solid crystalline inclusion compounds consisting of polyhedral water cavities that enclathrate small gas molecules [2]. Natural gas hydrates removal is essential industrially, because the occurrence of these solids in pipelines presents high economic loss and ecological risks, as well as potential safety hazards to exploration and transmission personnel [3]. The concept of gas hydrate growth in multiphase gas dominant transmission pipelines, which is as well-known as the gaseous phase, dominates the significant portion of the pipeline alongside the other phases like oil and water. When a gas dominant multiphase system is observed, the representation of Gas hydrate growth at various stages is displayed [4]. Besides, they also have technological importance in separation processes, fuel transportation, and storage [5]. They are also a potential fuel resource. So far, gas hydrates have provided more problems than solutions. The formation of gas hydrates in deep-water production can hinder operations; managing or preventing their accumulation in deep-water oil and gas wells and pipelines has been a challenge for many decades, and addressing the existence of gas hydrates is a significant part of planning for deep-water drilling and production. The transportation of natural gas is often achieved through underground transmission lines, and the safety of gas transportation deserves our attention. Due to complex operating temperature and pressure changes, condensation occurs in the transmission pipelines that leads to the generation of gas hydrates [6].
The reported work presents the gas hydrate formation in multiphase systems at various pressure and temperature conditions. Numerous researchers came up with different types of thermodynamic as well as kinetic models that can predict gas hydrates formation and the performance of various gas hydrate inhibitors. Most of them are based on principles such as reaction kinetics, mass transfer, heat transfer, and fluid flow. These studies have played a vital role in research on hydrate formation and growth [7].
There are numerous research studies on hydrate formation and flow in gas dominated pipelines, done to investigate the gas hydrates formation in pipelines and deposition process on the pipe wall in the saturated water containing system. However, the research that focuses on describing the formation of hydrates and the degree of blockage in multiphase gas dominant transmission pipelines is limited.
The first discussion about the formation of gas hydrates in multiphase flow lines was noted to be in the 1980s. A theoretical study has been done on multiphase system gas hydrates with the interest’s in-phase behavior of hydrate formation, temperature, pressure, and quantity of liquid in a gas pipeline to form gas hydrates [8]. Further researchers found that the flow parameters like velocity and discharge of fuel in the pipelines also affect the kinetics of gas hydrates. In a study on the effect of various flow velocities ranging from 0–5 m/sec on gas hydrate formation, it is found that higher velocity results in faster hydrate plugging in the pipeline [9].
Moreover, investigation on the effect of various flow regimes, such as slug flow, bubble flow, and annular flow in multiphase flows has been carried out [10]. Kinetic gas hydrate inhibition study on the low-cost surfactants, trichlorofluoromethane (CC13F) in water-in-oil emulsions has been conducted [11]. Recently, due to the increase in simulation and software capabilities, the research has become more valiant, and the prediction of gas hydrates by theoretical modeling has increased. A prediction model has been developed to evaluate the particle deposition on the pipeline walls due to gas hydrate formation by computational fluid dynamics (CFD) [12]. Various researchers also studied the emulsion pipelines with different water cuts, to experimentally find the phase behavior conditions of gas hydrates in multiphase pipelines. Generally, water cut is defined as the ratio of produced water compared to the volume of the total produced fluids in a well. In work on gas hydrate formation in the crude oil emulsion system with 50%–80% water cuts variations with the mixed gas system of methane, ethane, and propane, it has been found that at a 50% water cut, the gas hydrate formation was high when compared to an 80% water cut [13].
The formation and dissociation of gas hydrate formations in multiphase systems with fuel oils like diesel have also been conducted [14]. Hydrodynamic models are also developed to predict the gas hydrate formation in multiphase pipelines, which paved the way for a detailed study in deep-sea multiphase pipelines [15]. The research about the methane hydrate formation in oil dispersed mediums by experiments and simulation has furthermore drawn attention [16]. Research on gas hydrate formation in multiphase pipelines with gas dominant or oil dominant systems containing black oil or crude oil has later been carries out vividly, to estimate the real-time subsea conditions and kinetics of gas hydrates [17]. So, these days, the gas dominant multiphase pipelines with the presence of crude oil and different water cuts are trending in research [18,19].
In this work, gas hydrate formation and dissociation studies have been performed on the gasoline + CO2 + water and crude oil + CO2 + water system in the pressure range of 2.5–3.5 MPa, with the fixed water cut or the amount of water taken in the system being 15% of the volume using gas hydrate rocking cell equipment.

2. Methodology

2.1. Materials

The list of materials used for the experimental investigation of gas hydrate formation in multiphase pipelines are as follows:
(a). Carbon dioxide Gas
(b). Deionized water
(c). Crude oil
(d). Gasoline
The Linde Malaysia Sdn Bhd delivers the carbon dioxide gas (CO2) with a purity of 99.99 mol%. Deionized water is used, which is available in the gas hydrates research laboratory.
The gasoline sample is collected from the nearest filling station of PETRONAS and the crude oil sample is collected from the Bintulu Refinery in Malaysia.

2.2. Experimental Setup

Figure 1 shows the schematic representation of the experimental setup used for this investigation. The apparatus consists of 6 reactor cells that are identical and are designed to withstand high-pressure and low-temperature conditions. All these cells are placed in a temperature-controlled chamber. All these cells are placed on the metallic frames inside the temperature-controlled chamber, such that they perform the rocking mechanism. During the rocking mechanism, the ball agitator creates agitation in the system within the cell to break the gas-liquid interface and promotes gas hydrate formation. Each of these cells is individually connected to their respective temperature and pressure probes to continually evaluate the changes occurring inside the reactor cell due to gas hydrates formation. The equipment is attached to a programmable logic controller (P.L.C.), which is equipped with a data logging software.

2.3. Experimental Procedure

2.3.1. Materials Characterization

The crude oil and Gasoline samples are collected and analyzed on high-performance liquid chromatography (HPLC) alongside the CHNS test by Carbon Hydrogen Nitrogen Sulfur (CHNS) Analyzer. Since gasoline is known for its high volatility, the HPLC test is quite challenging to perform. Therefore, a gas chromatography and mass spectroscopy (GCMS) study is conducted for gasoline.

2.3.2. To Determine Thermodynamic Phase Behavior

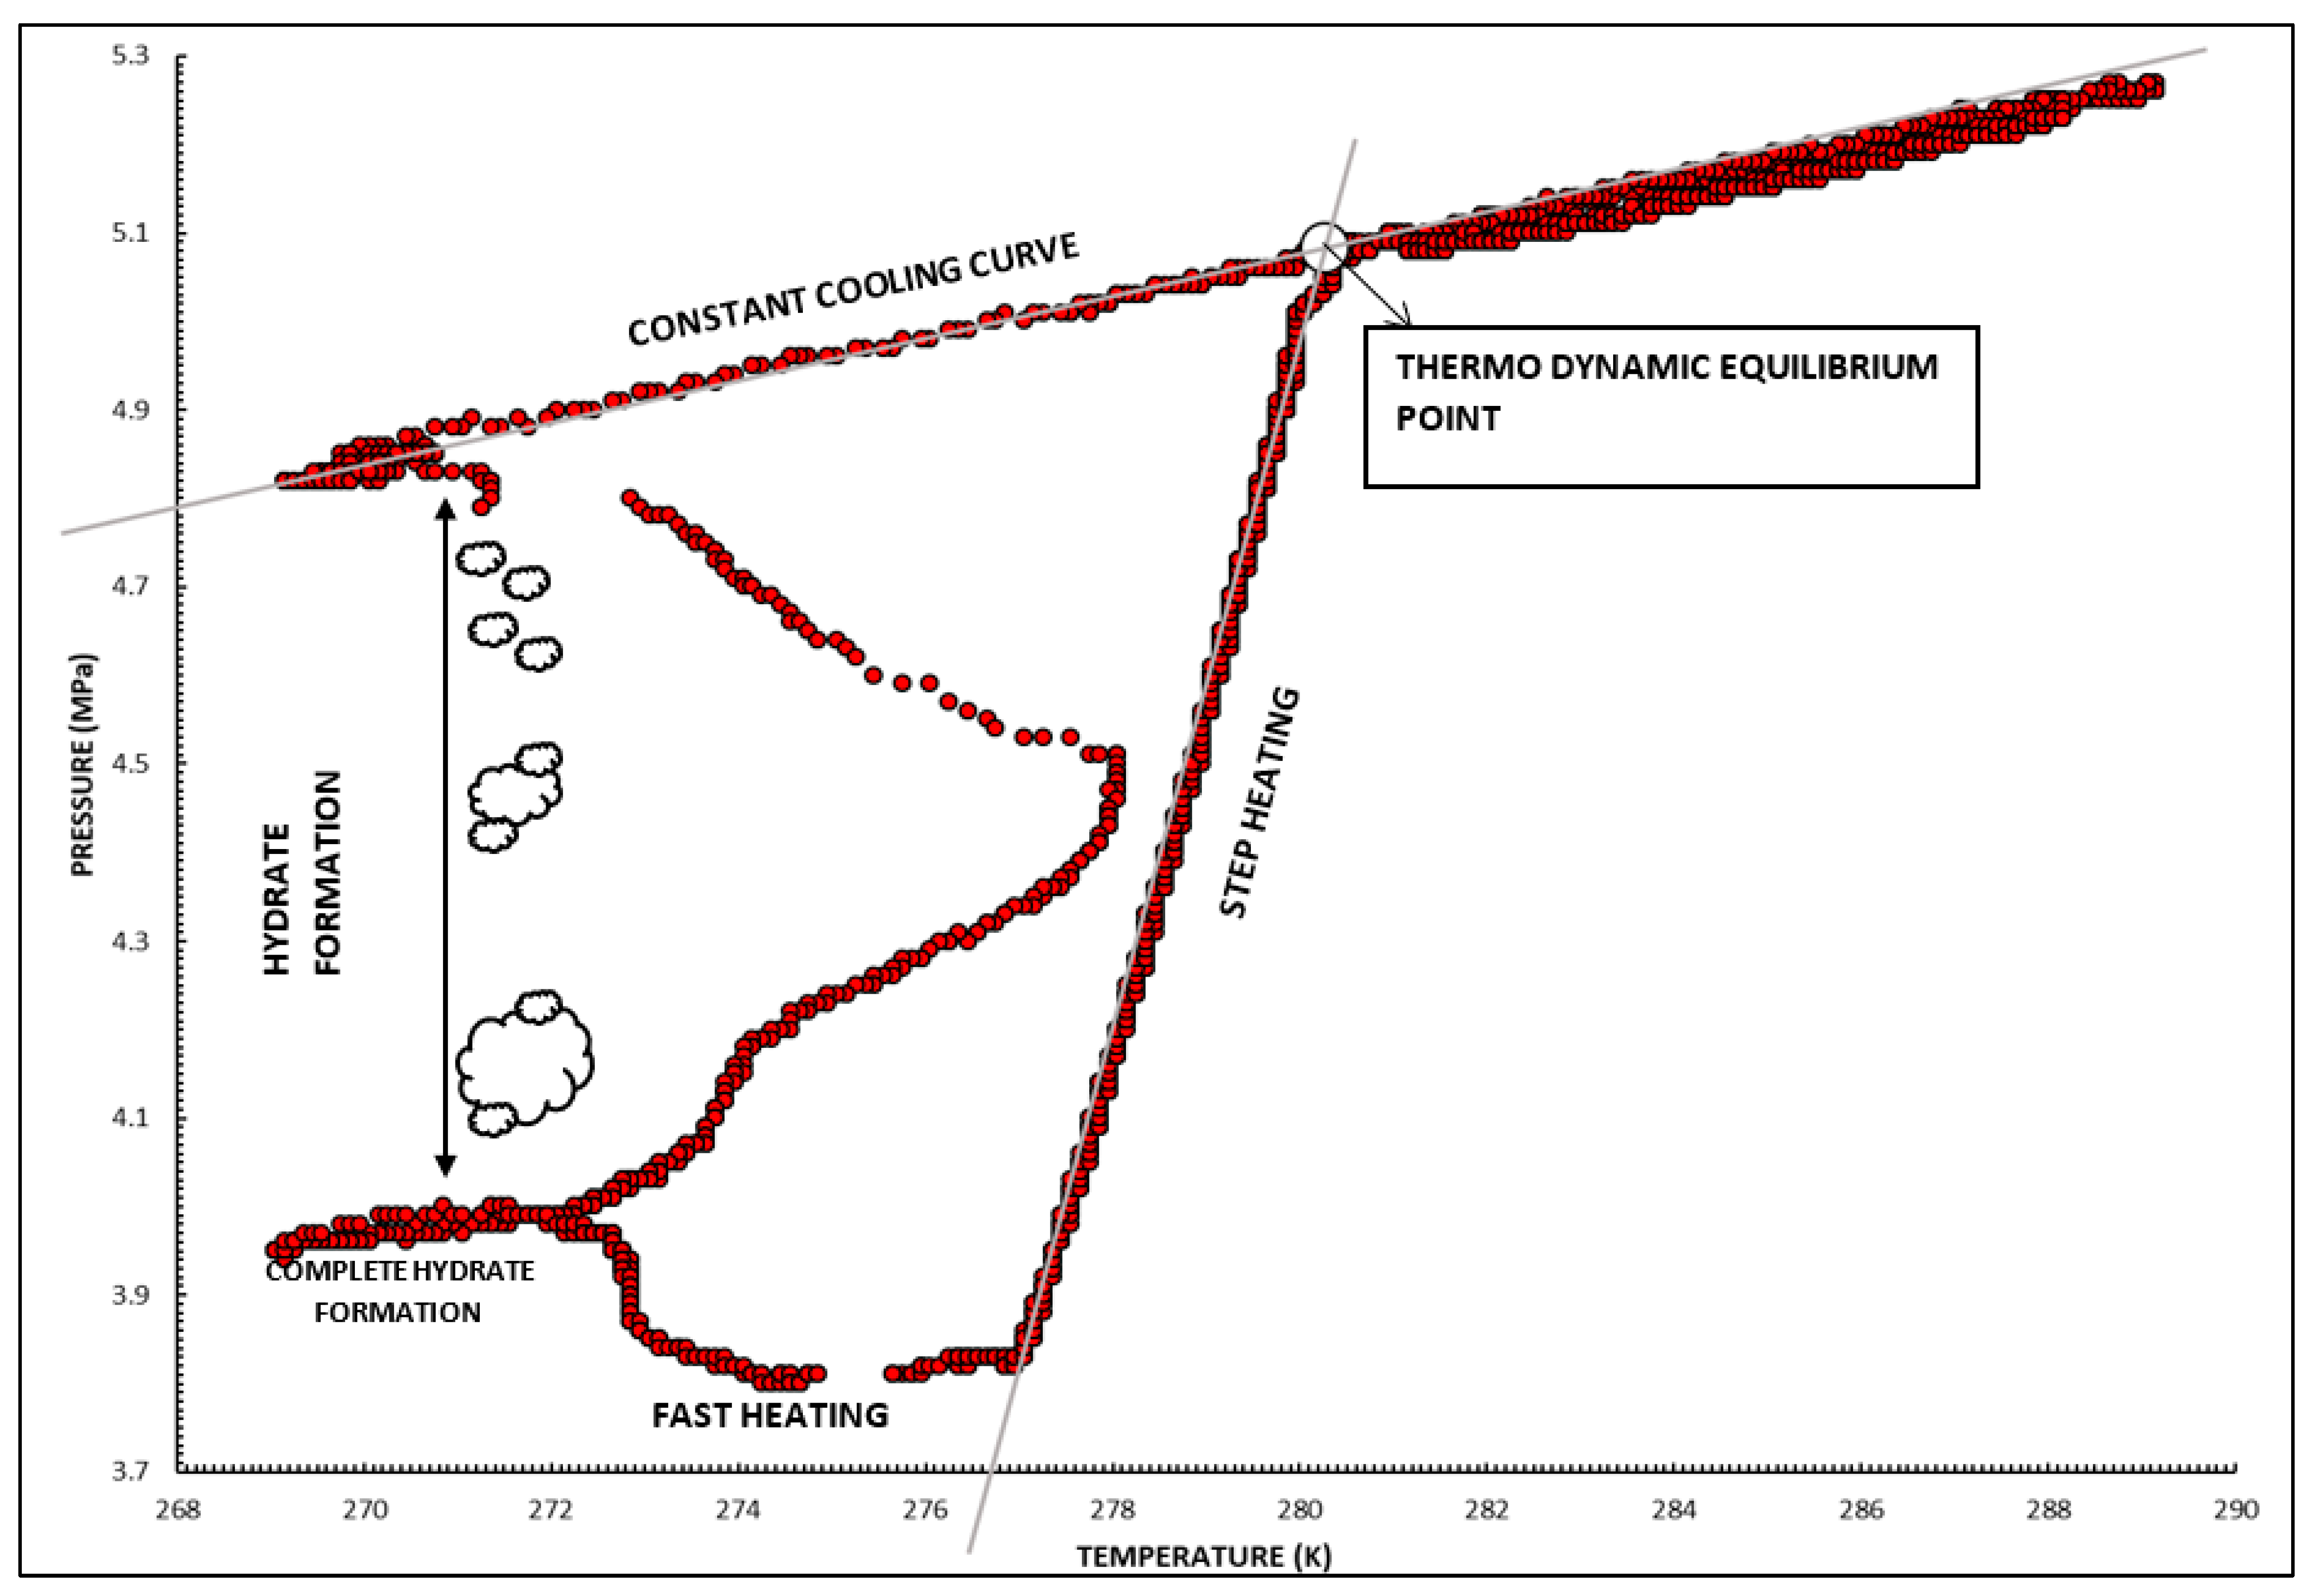
Generally, the T-cycle method at constant volume (isochoric) step heating is adapted for the determination of thermodynamic equilibrium conditions. These conditions are used to plot the hydrate-liquid-vapor-equilibrium (HLVE) curve. This is adapted, as there is no change in the sample volume [2,20]. Firstly, all six reactor cells are thoroughly washed with distilled water and dried. Later, each cell is filled with a total volume of 15 ml. For all these experiments, the water cut is maintained constant at 15%. Deionized water is used. All the sampled are freshly added before running the equipment, as the liquid fuels used are highly volatile. Then, all these cells are pressurized individually to absolute defined pressure. The pressure range for the gasoline and crude oil experiments was set between 3.0 to 3.5 MPa. The equipment is designed to perform a rocking motion, during which the agitator inside the reactor cells provides adequate mixing to the system inside the cell and thus promotes gas hydrates formation. Once the gas hydrate is formed, a slow constant heating process is performed to observe the dissociation of the gas hydrate formed. The heating rate for the study was set as 0.5 °C/Hr. This gradual heating process is done to provide ample required time for the gas hydrate system to dissociate completely, and the thermodynamic equilibrium point is observed. All this process is monitored by a data logging software attached to the system from the time, and the cell is locked and air-cooled. The data logging system monitors the temperature and pressure of the reactor cell at a fixed time interval.

2.3.3. To Determine Gas Hydrates Kinetics

For determining the kinetics of gas hydrate of formation, a fresh sample is taken into the reactor cells. The reactor cells are cooled down to 285 K, which is way above the hydrate formation temperature, even for the multiphase system. Then, CO2 is compressed into the reactor cells. The pressure range is maintained as 2.5–3.5 MPa. Later, the stirrer is activated by switching on the agitation function, and the Gas is let to dissolve appropriately into the multiphase mixture. During this time, the system attains equilibrium. Then, the agitation is stopped, and the multiphase system is further cooled down to 275.15 K. As the pressure reaches a stabilized required pressure, then the stirrer is again turned on. The sudden drop in pressure with an increase in temperature represents the gas hydrate formation. The data logging was done for every 48 s. When the pressure of the multiphase system remains constant for around 2.5 h, it can be concluded that the gas hydrate formation is complete. All kinetic experiments were repeated at least twice, and the reported results are average values.

3. Results and Discussion

3.1. Carbon Chain Analysis in Crude Oil and Gasoline

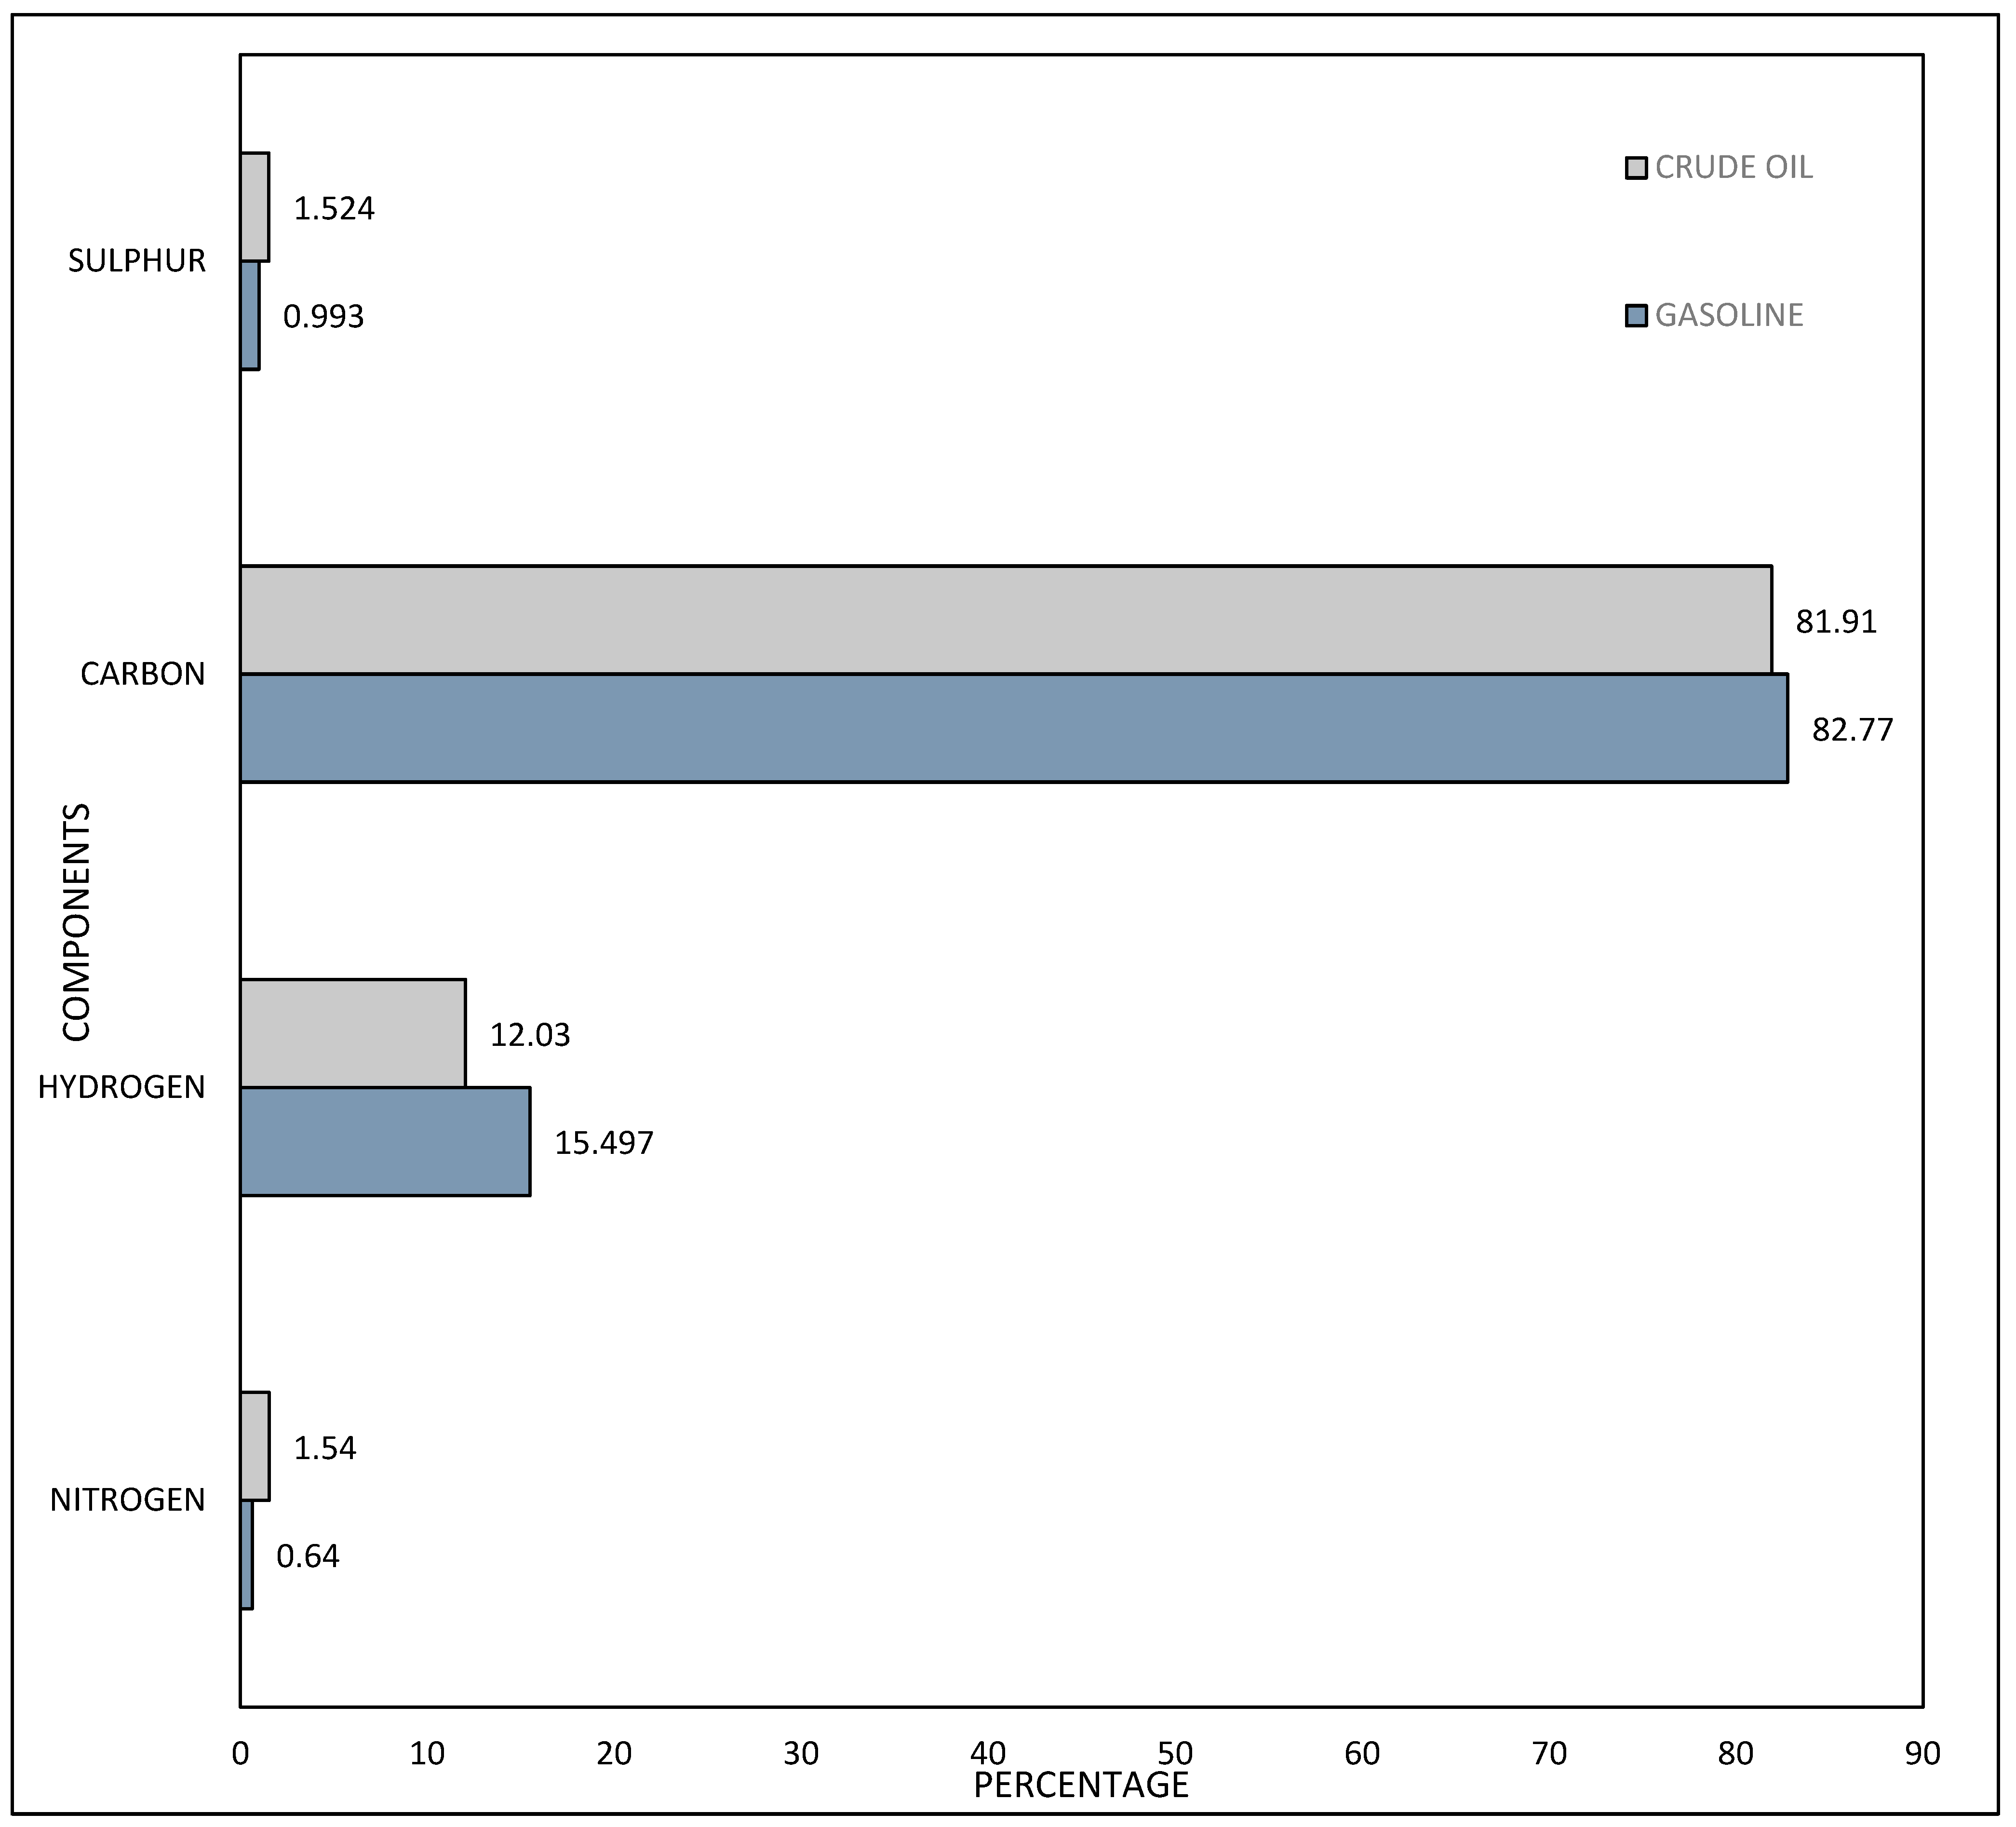
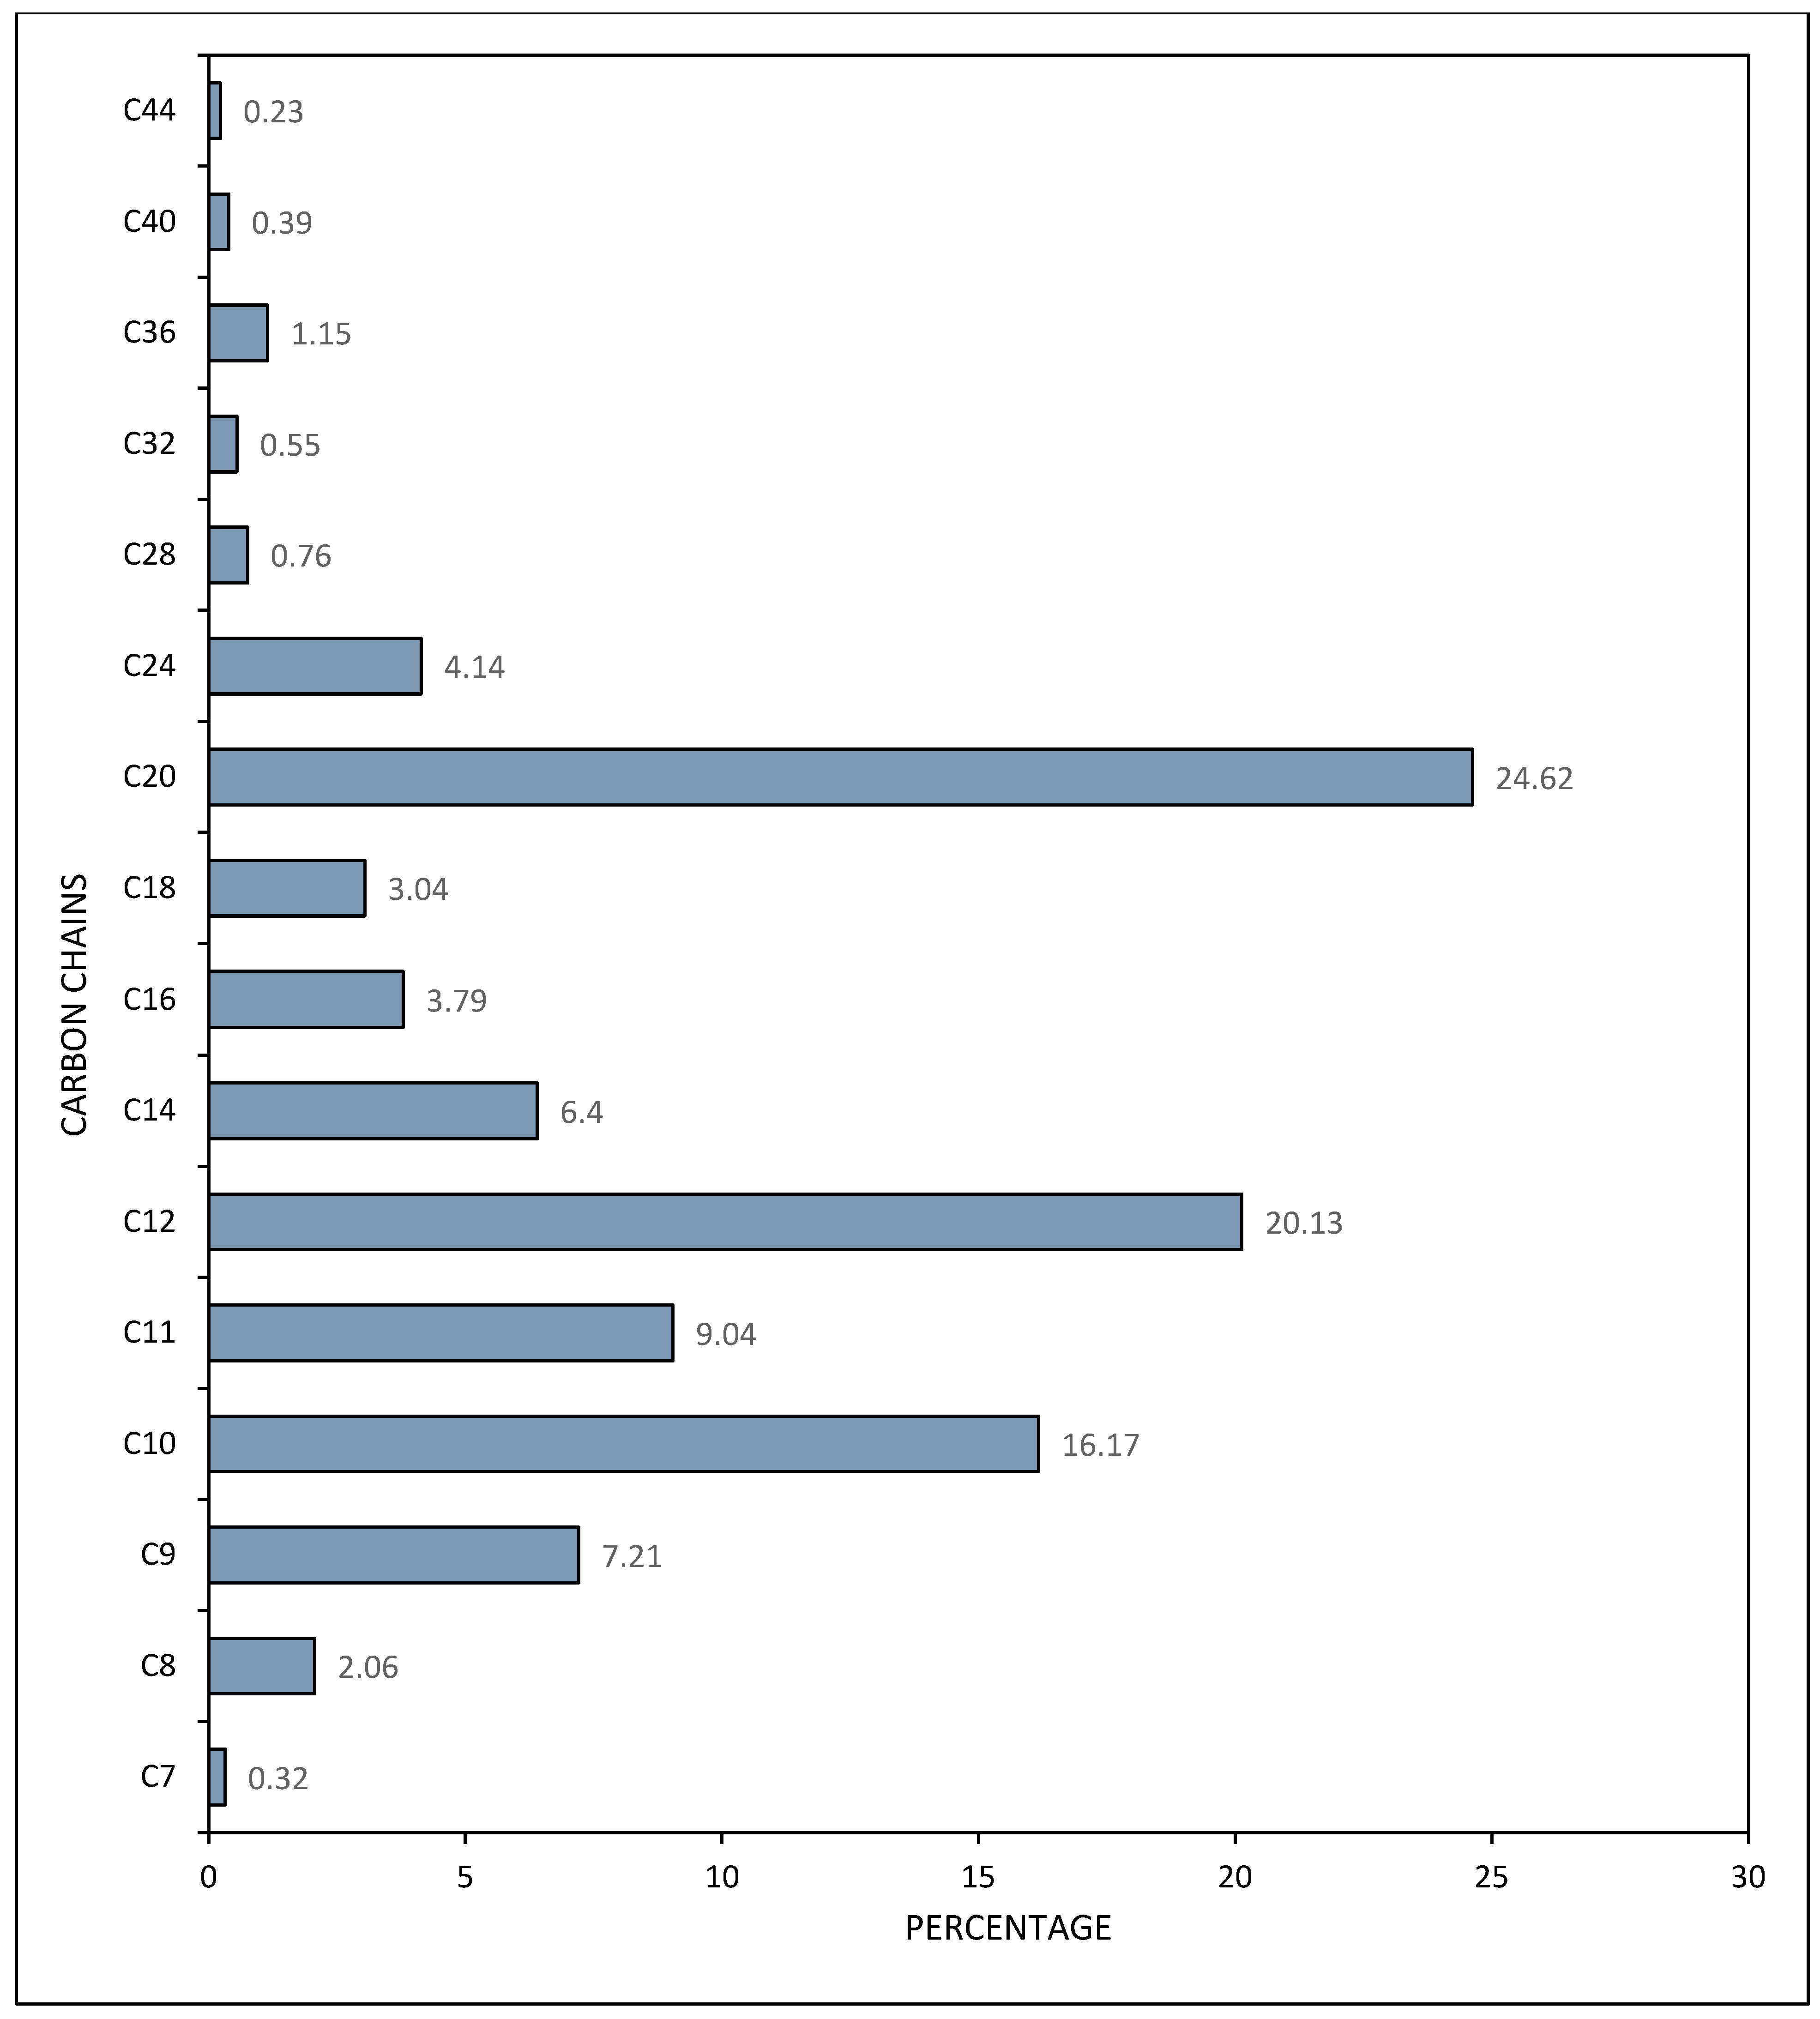
The test is done to find out the composition of the liquid fuels used for experimental analysis. The results of the crude oil CHNS test are in Figure 2.
According to this observation, the carbon content is the maximum, with much less sulfur. The CHNS results justify that the crude sample taken is a sweet crude and is of high usage in the market. Since sweet crude oil has a high economic impact, which is used rigorously for processing, the possibility of its transportation is high. Later, to explain the number of carbon chains in the system, the HPLC test is carried out for the same sample. The results observed are in Figure 3.
Similarly, the gasoline sample is collected from the nearest filling station. CHNS test is done to analyze the carbon composition in the gasoline used. The test result is mentioned in Figure 2.
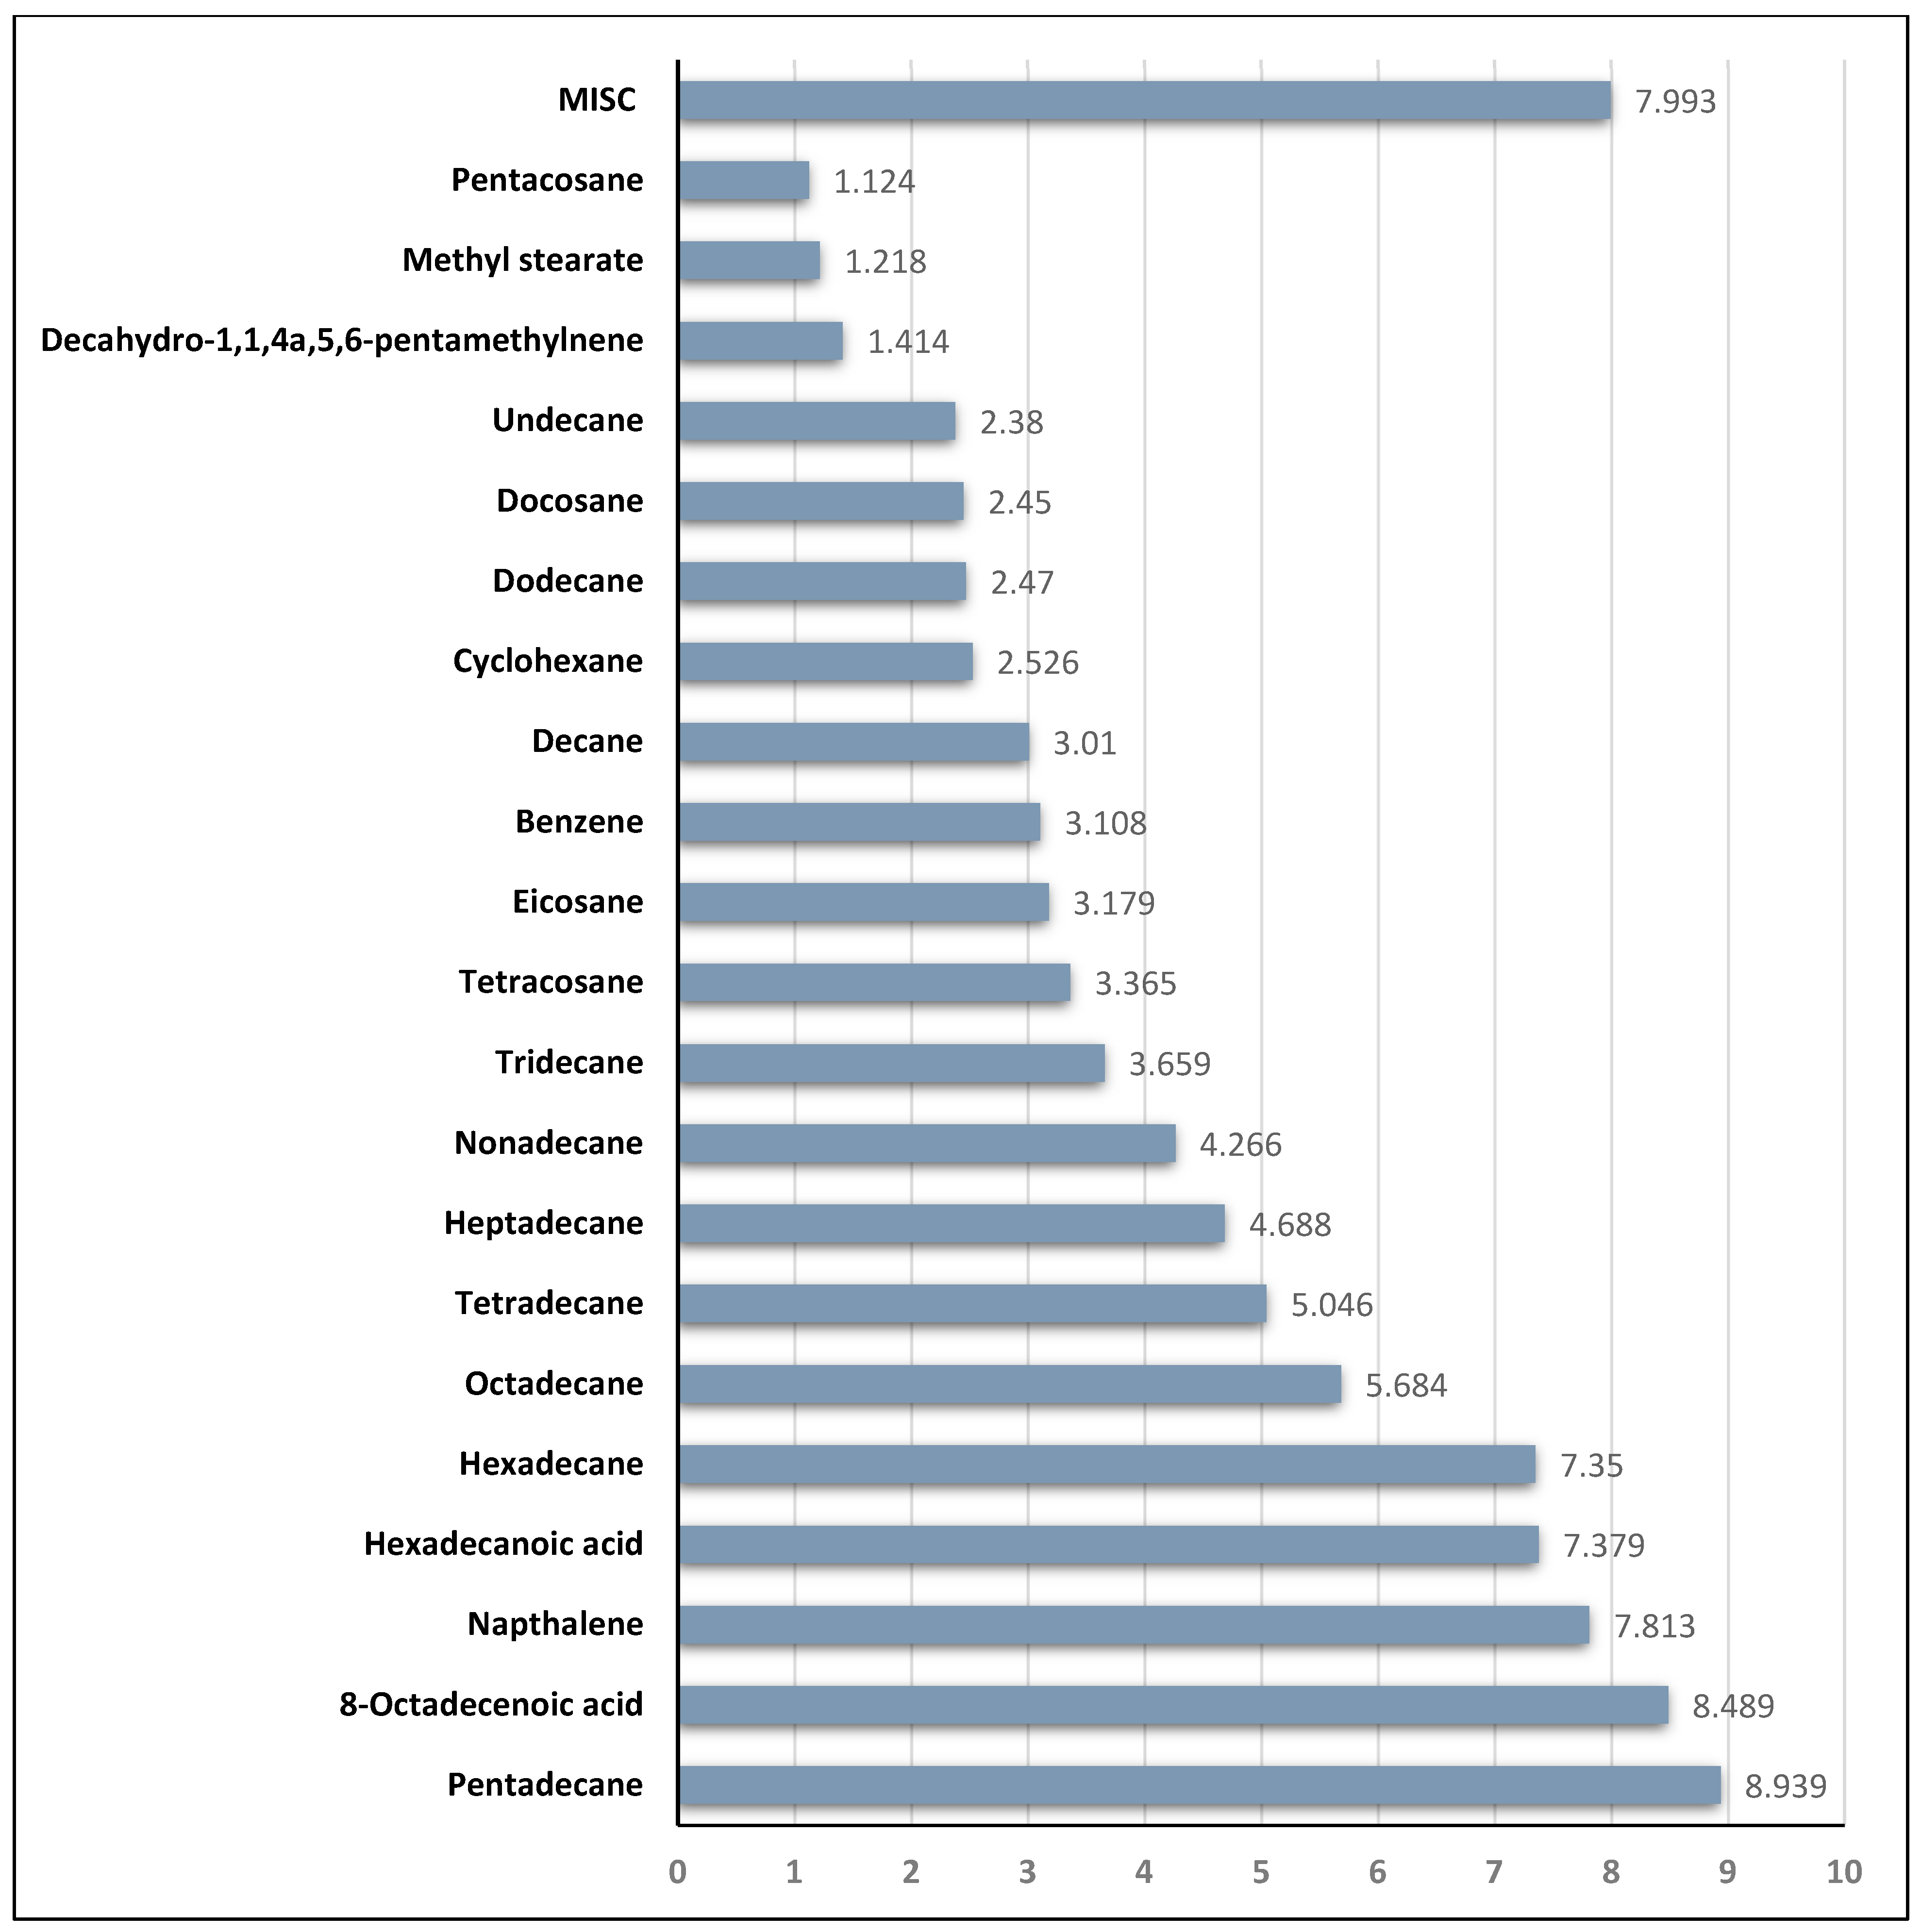
Based on the results, the sulfur content should be negligible, as it is collected from the nearest filling station. The results shown are highly in accordance with the technical details. So, there is a high possibility of the same fuel to be used for transportation in pipelines. Since gasoline is known for its high volatility, the HPLC test is quite challenging to perform. Therefore, a gas chromatography and mass spectroscopy (GCMS) study is conducted and analyzed to find the composition of the gasoline sample used for experiments. The results from the GCMS study are in Figure 4.

3.2. Thermodynamic Equilibrium Conditions

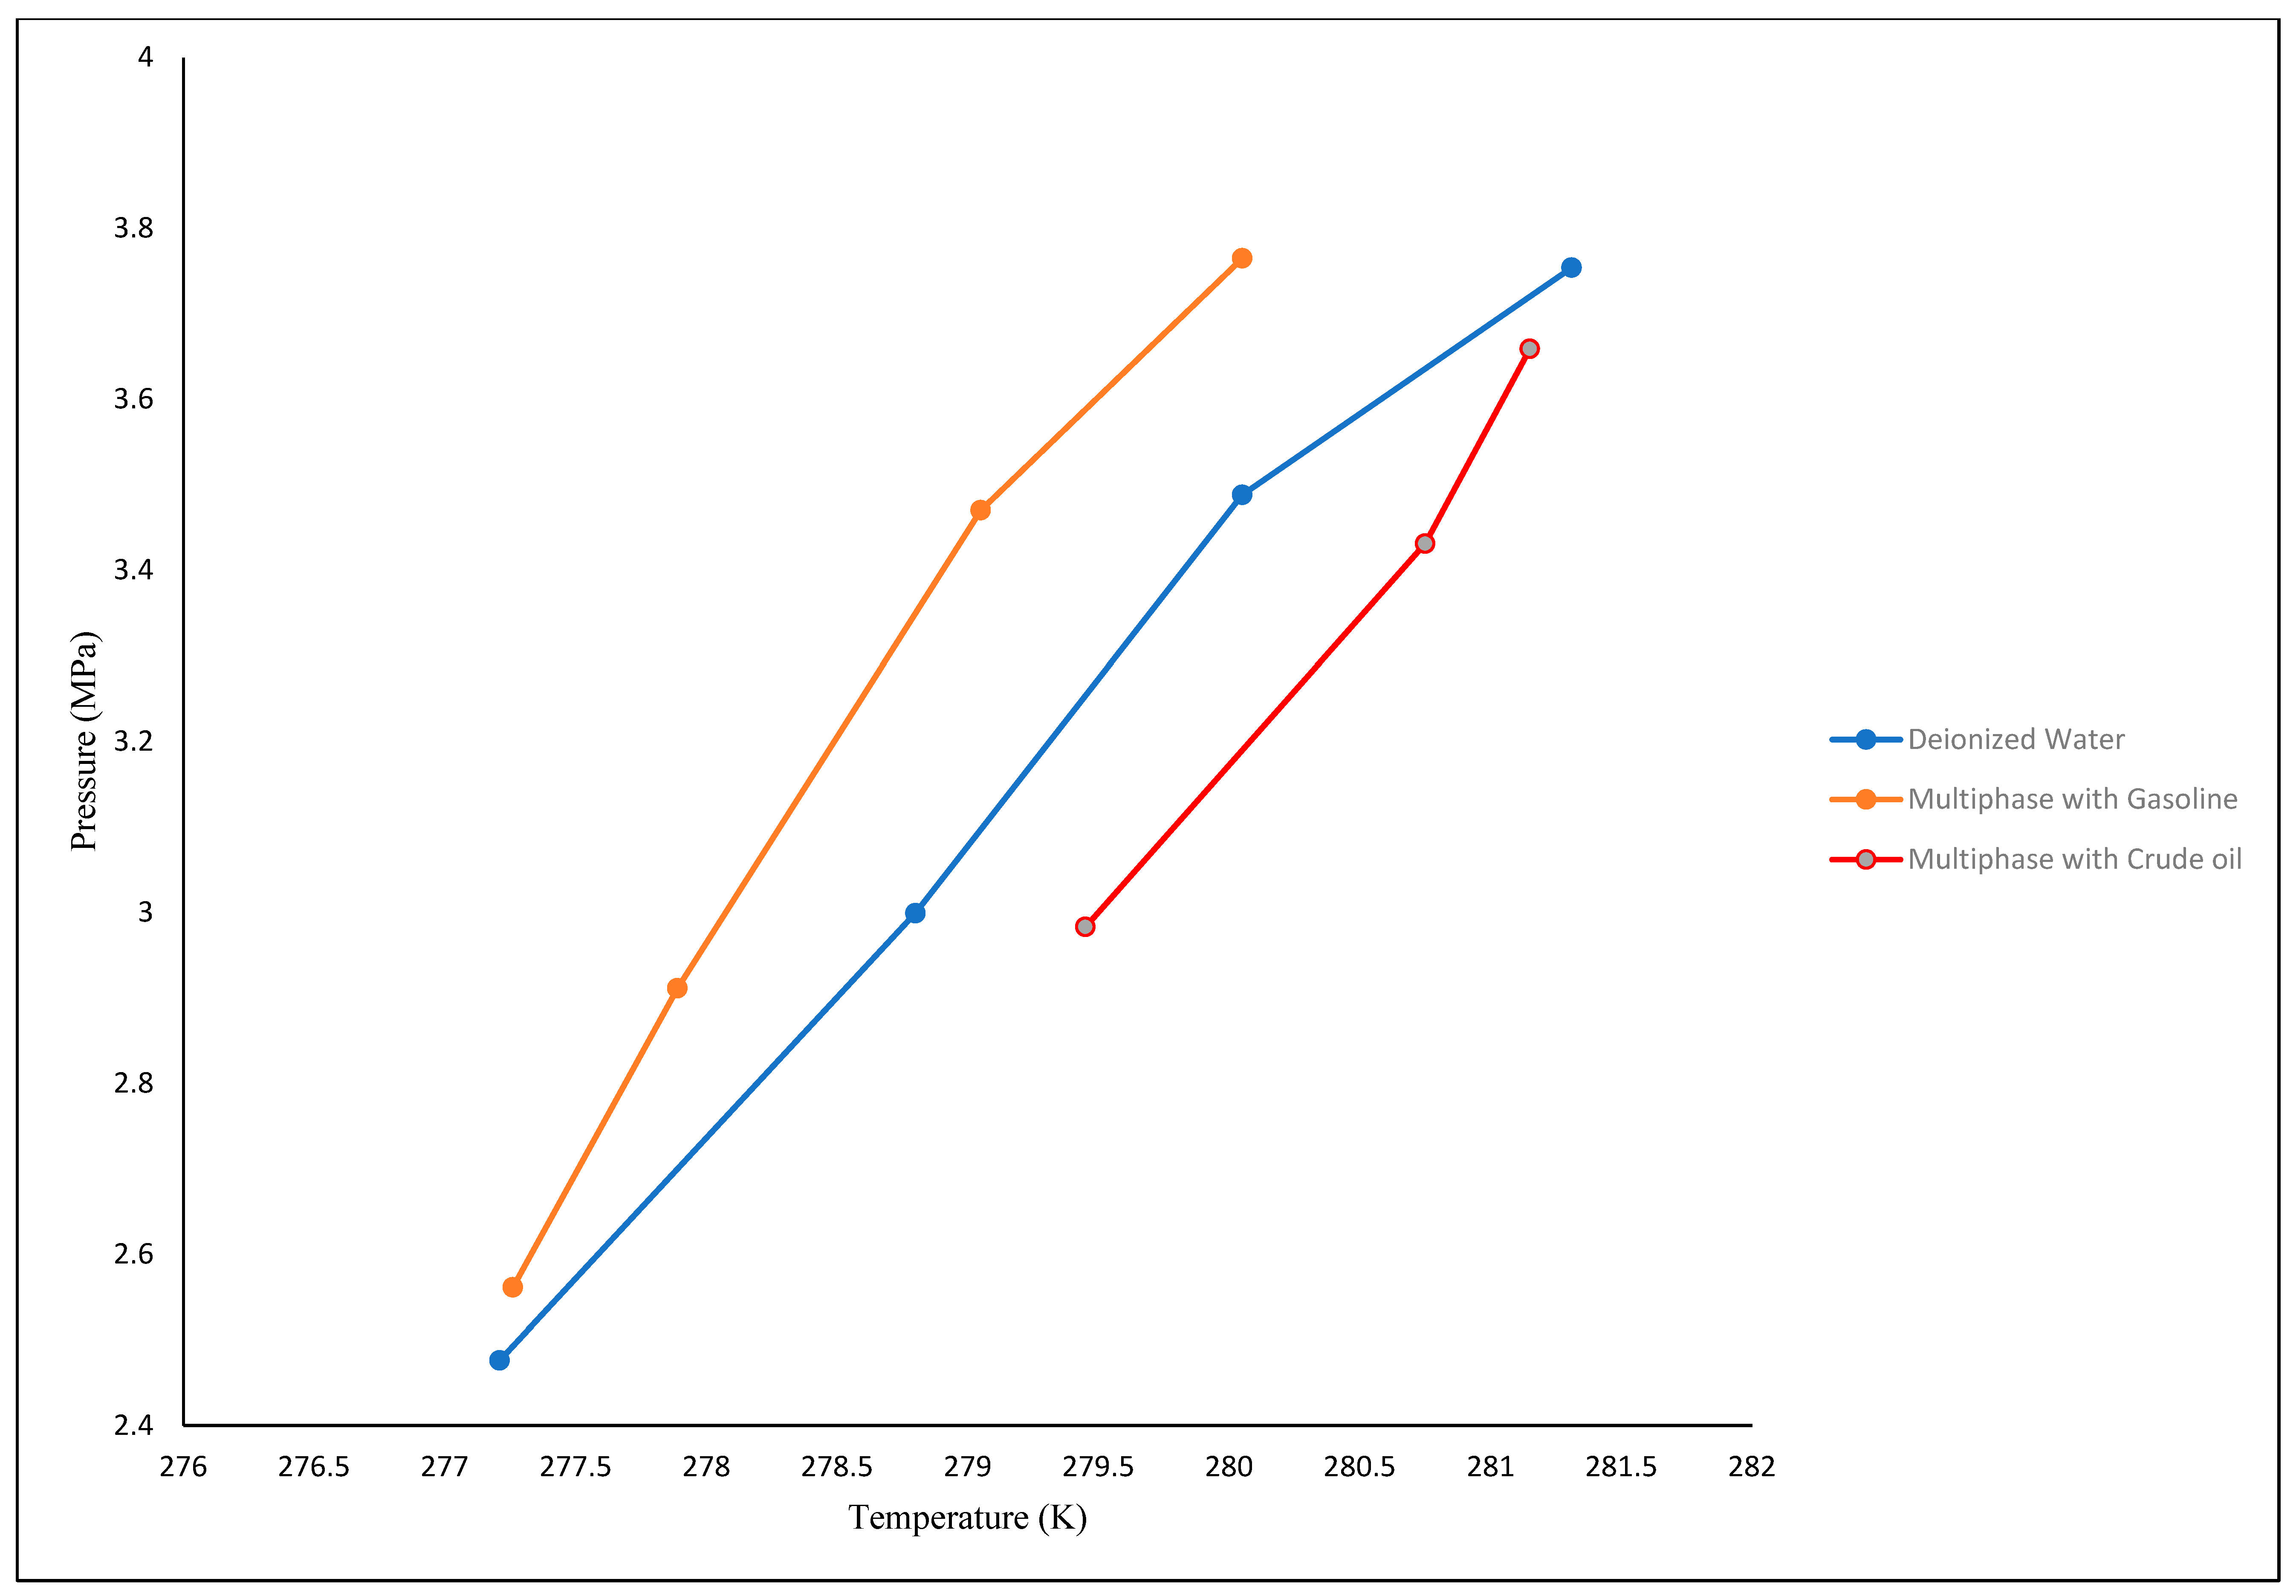
The gas hydrates formed in different cells that are set at various pressure conditions can dissociate by applying a gradual heating process. The data captured for the entire procedure of gas hydrate formation and dissociation are used to estimate the thermodynamic equilibrium point for the prescribed system. The T-cycle method is used for the evaluation of the thermodynamic equilibrium point. A sample pattern that is developed from the captured data is shown in Figure 5. All the thermodynamic points are premeditated by analyzing the data logged into the system during the experimental procedure and then plotting the pressure-temperature profile. All these points are used for developing the HLVE curve based on the multiphase system to understand the phase behavior. The plot of the thermodynamic equilibrium curve is presented in Figure 6.
The plot suggests that there is a definite shift in the thermodynamic equilibrium curve when the thermodynamic gas hydrate data is analyzed, which is produced by using a multiphase system that consists of fuel oils.
For the curve developed from the experimental data generated by the gasoline system, it clearly shows a chosen pressure, and the thermodynamic temperature is below the actual deionized water temperature. This result reflects that the product pipelines have an inhibition effect. This is because of the additives that are added into the processed fuel, which should be more stable towards any fluctuations in temperature and pressure conditions. For the curve developed by the experimental data generated by the crude oil system, at a set pressure condition, the thermodynamic equilibrium temperature is above the water condition. This reflects that the system is promoting gas hydrate formation. This can be because of the high possibility of accumulation of gas hydrates, due to the availability of longer carbon chains available in the system. The presence of longer carbon chains impacts the system, as the higher carbon chain compounds act as surfactants [21]. Moreover, crude oil is an unprocessed fuel which contains a lot of impurities. These impurities can be referred to as COS, SO2, NH3 and H2S, and reflect on the difference in phase behavior. This can also reflect the terms of promotion, because of its highly reactive nature at high-pressure and low-temperature conditions [22].
The thermodynamic equilibrium conditions for the simple system, and the multiphase systems consisting of gasoline and crude oil, are presented in Table 1.

3.3. For Evaluation of Gas Hydrates Kinetics

3.3.1. Hydrate Formation Rate

Gas hydrate is formed by the above-mentioned experimental procedure. The multiphase system with crude oil + deionized water + CO2 gas and gasoline + deionized water + CO2 gas is used for the formation of gas hydrates. Once the gas hydrates are formed, the system is maintained at 274 K for almost 6 h. This time is considered adequate time provided to the multiphase system to achieve thermal equilibrium. Then, the system is depressurized by releasing the Gas in the reactor cell and allowed to reach atmospheric pressure. Then, the valves are closed again, and the gas hydrate is maintained in the reactor cell at a constant temperature. The pressure of the system was recorded continuously for almost four days. The formation rate was calculated from the slope of the P-t curve that is displayed in Figure 7.

3.3.2. Calculation of Kinetic Parameters

Induction Time

The induction time of the gas hydrate formation was taken as the time needed to start the formation of decent amounts of hydrates. It can be detected as the point when a sudden pressure drop with an increase in temperature was observed, as illustrated in Figure 7. The plot of pressure and temperature vs. time has been drawn, and from the sudden change of temperature, as the gas hydrate formation is an exothermic reaction for decreasing pressure, triggered as induction time.

Initial Rate of Gas Consumption

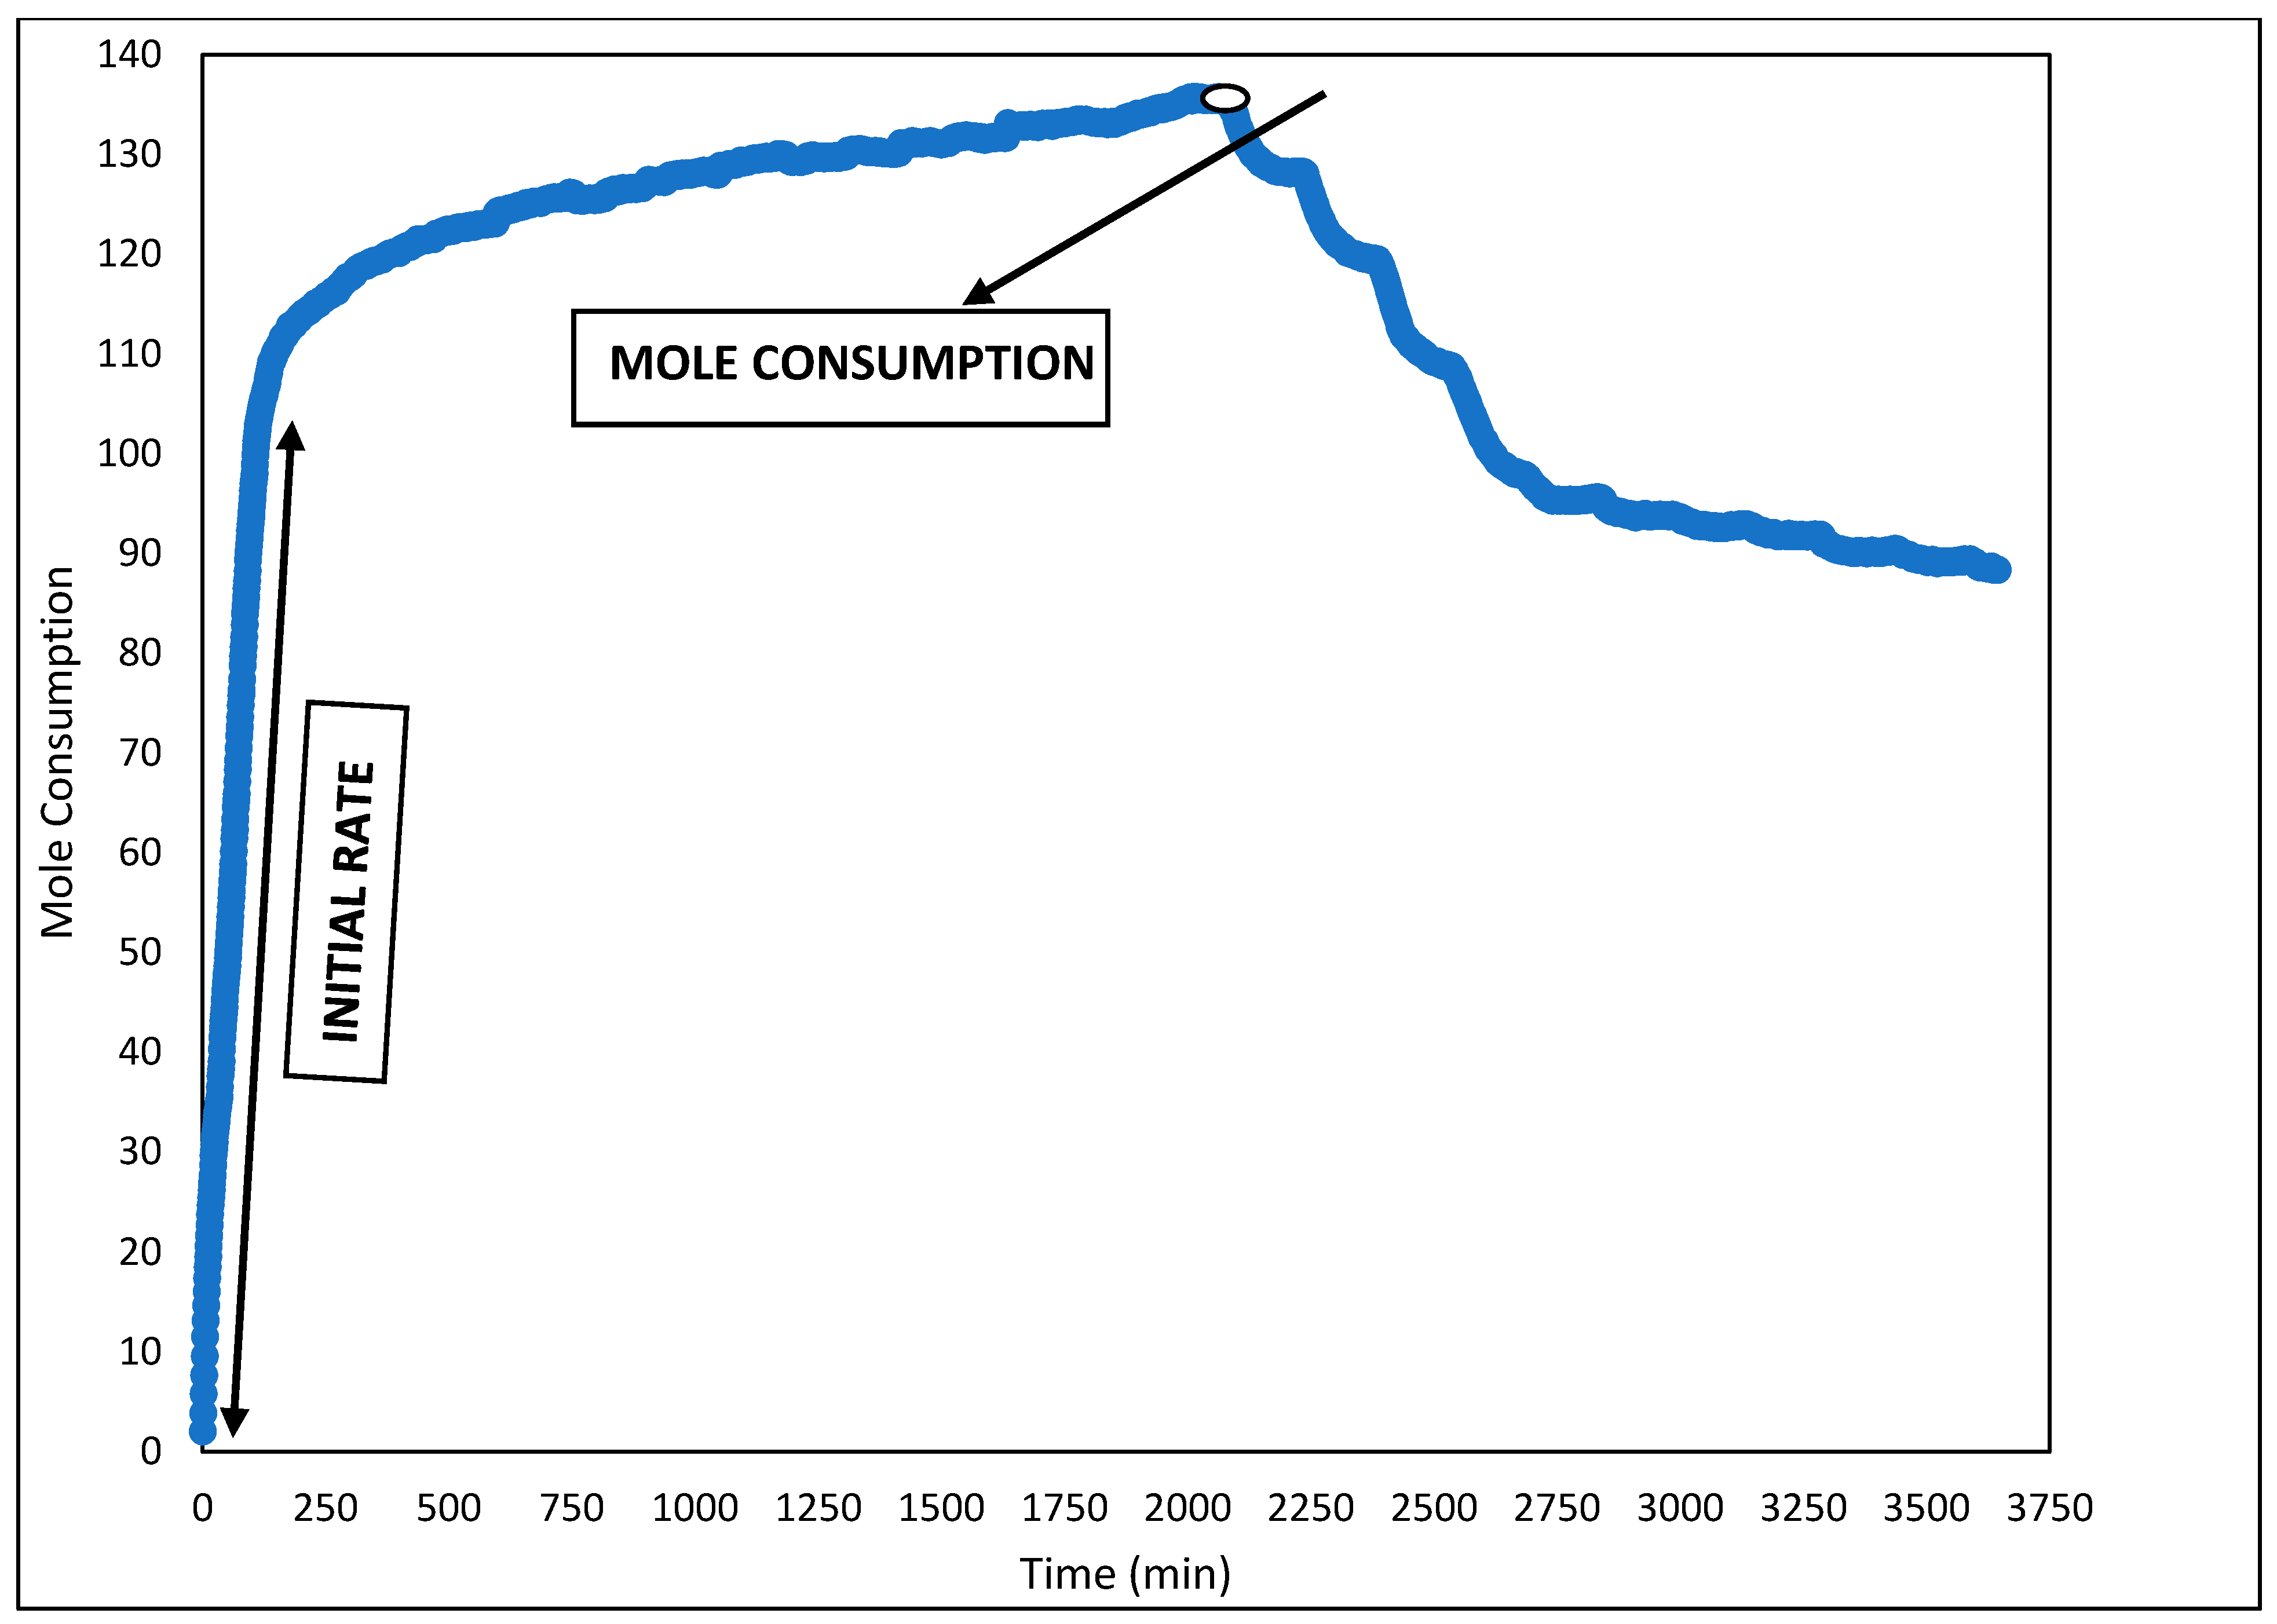
The initial rate of gas consumption is the foremost constraint for the study of the kinetics of gas hydrates. It represents the rate of the multiphase carbon dioxide (CO2) hydrate formation, and is calculated as follows, in Equation (1):
r ( t ) = n i i 1 n i i + 1   t i 1 t i + 1   n w o 1
where, n i i 1 and n i i + 1 are the mole numbers of gas in the gas phase at time intervals t i 1 and   t i + 1 respectively, and n w o is the initial mole number of water [20]. The initial rate of gas consumption from the system can be observed from Figure 8 gas consumption (CO2) curve vs. time (t), in which the time vs. mole consumption plot is available.

CO2 Gas Consumption and Gas Uptake

The amount of carbon dioxide (CO2) consumed to experiment with maximum hydrate formation is a vital constraint to bring gas hydrate technology to the industrial scale. The gas consumption is calculated using Equation (2). An assumption is made that there is no change in the volume of water during the gas hydrate formation. This is because of the closed system in the experimental setup, and the volume change due to the temperature effect is minimal on the volume of the water [23,24,25]. Therefore, the following equation is used for the isothermal experiment:
Δ n g = V R   [ ( P Z T ) 0 ( P Z T ) t   ]
where P and T are the pressure and temperature of the multiphase system, respectively. The volume of the gas-phase is V, and R is the universal Gas constant. Z is the compressibility factor, which is calculated using the Peng−Robinson equation of state. Subscripts 0 and t stands for the starting time of the experiment and the experimental conditions at time t, respectively.
To normalize the amount of gas consumption and eliminate the size of the sample, the gas uptake is calculated, as shown in Equation (3). It represents the amount of gas trapped in one mole of a water sample:
U = Δ n g n w
The graphical representation of mole consumption to time is displayed in Figure 8.
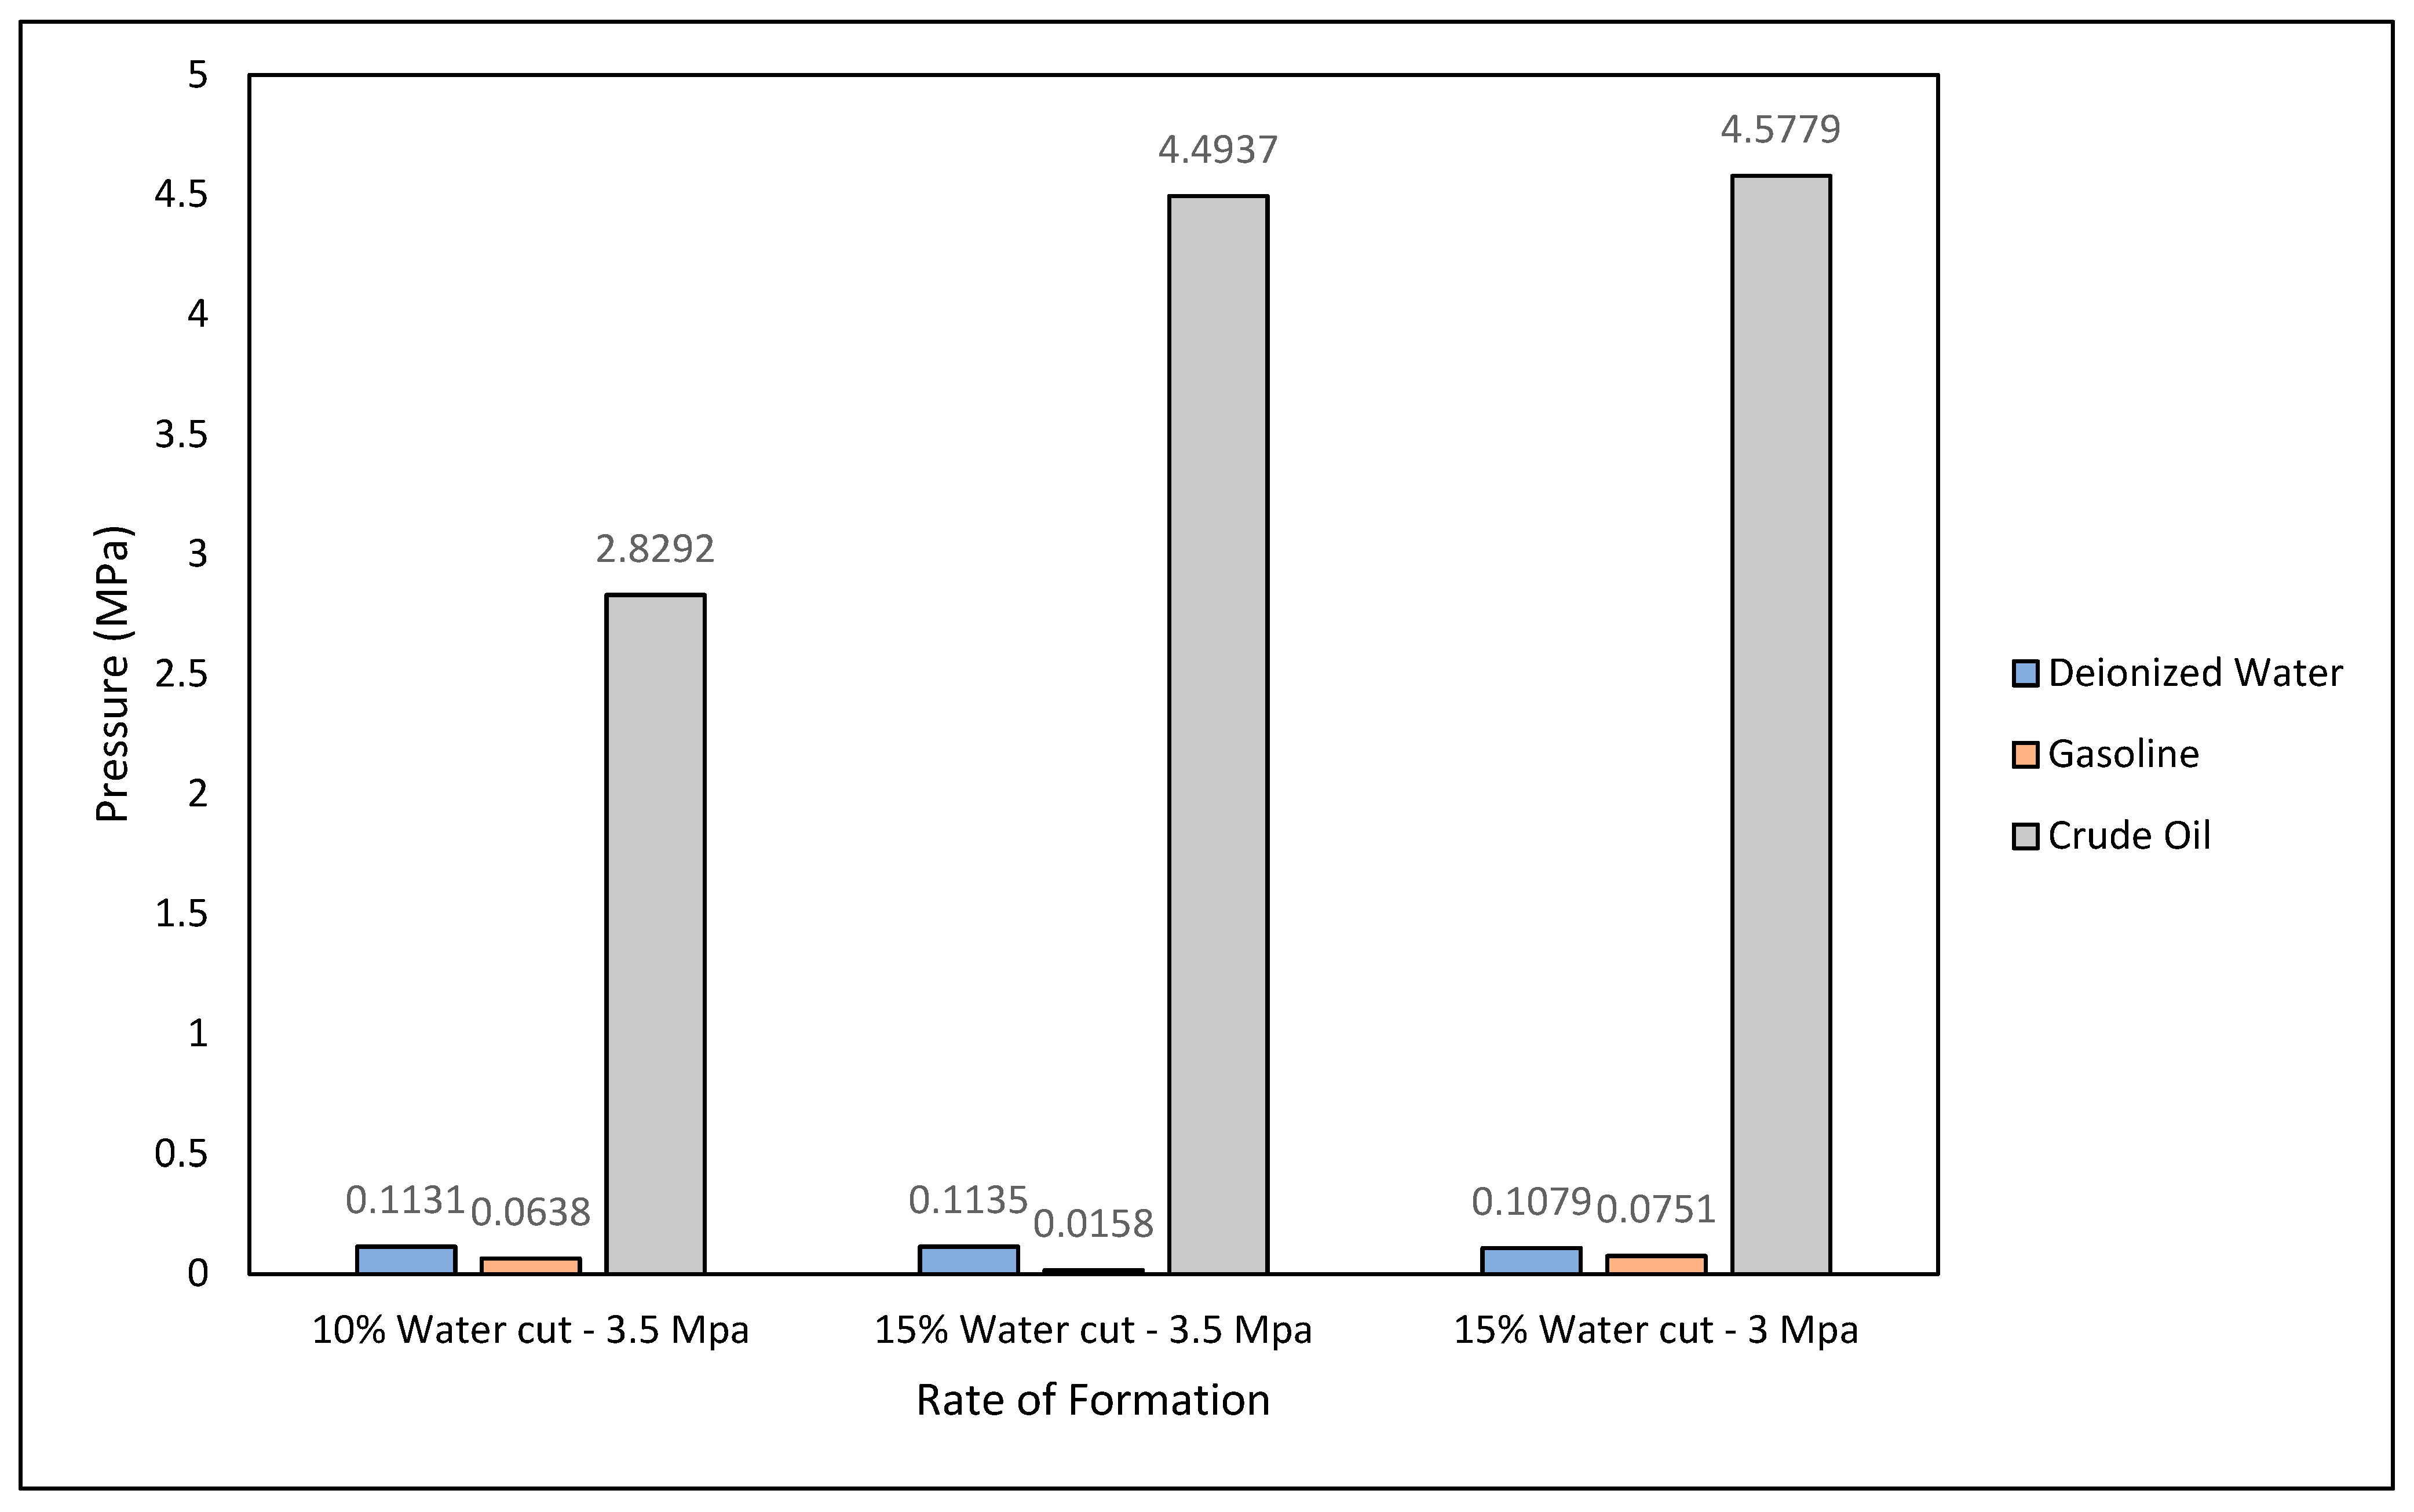
The experimental results to determine the rate of formation of gas hydrates in the multiphase system is stated in Figure 9. When the multiphase system with gasoline is observed, it can be noted clearly that the rate of formation is lower compared to deionized water, which is because of the chemical inhibitors that are added during the processing of gasoline from crude oil. For instance, gasoline consists of oxygenates like ethylene glycol, which is a good gas hydrate inhibitor [26,27]. similarly, when the crude oil multiphase system is observed, the rate of formation is higher because of the presence of long carbon chains and impurities. The presence of longer carbon chains affects the kinetics of the gas hydrates formation [21,22].

4. Conclusions

In this work, an experimental investigation has been done on the thermodynamic equilibrium conditions of gas hydrates formation in multiphase transmission pipelines with the presence of fuel oils, namely gasoline and crude oil. Based on the experiments, the thermodynamic equilibrium curve has been plotted and compared to that of the pure gas system. It can be concluded that the multiphase system possesses a different equilibrium curve compared to that of the simple system. This difference is because of the effect of fuel oil present in the multiphase system; for the gasoline system, which is measured as a highly volatile system, the thermodynamic equilibrium curve shifts towards inhibition. In contrast, the system with crude oil shows the effect of promotion. This study helps in concluding that a precise multiphase equilibrium curve must be considered for the prediction of gas hydrate formation in multiphase transmission pipelines, which is different from the existing process of considering a simple system.

Author Contributions

The conceptualization of this research work is carried out by S.J.K.S. and B.L. The research work was carried out under the supervision of S.R.P., and B.L. The resources for the research were procured by B.L. The methodology, experiments, characterization, and other tests were carried out by S.J.K.S. The original draft was written by S.J.K.S. The manuscript draft was reviewed by S.R.P. and B.L. The project administration and funding acquisition for this project were carried out by S.R.P. and B.L. All authors have read and agreed to the published version of the manuscript.

Funding

This research was funded by PETRONAS Research Sdn Bhd (PRSB) under TD Project Grant No. 053C1-024.

Acknowledgments

The authors are grateful to Marappa Gounder Ramasamy from Chemical Engineering Department, Universiti Teknologi PETRONAS (UTP), for providing the crude oil sample.

Conflicts of Interest

The authors declare no conflict of interest.

References

  1. Griffith, P. Multiphase Flow in Pipes. J. Pet. Technol. 1984, 36, 361–367. [Google Scholar] [CrossRef]
  2. Qasim, A.; Khan, M.S.; Lal, B.; Ismail, M.C.; Rostani, K. Quaternary ammonium salts as thermodynamic hydrate inhibitors in the presence and absence of monoethylene glycol for methane hydrates. Fuel 2020, 259, 116219. [Google Scholar] [CrossRef]
  3. Khan, M.S.; Lal, B.; Keong, L.K.; Ahmed, I. Tetramethyl ammonium chloride as dual functional inhibitor for methane and carbon dioxide hydrates. Fuel 2019, 236, 251–263. [Google Scholar] [CrossRef]
  4. Charlton, T.B.; Di Lorenzo, M.; Zerpa, L.E.; Koh, C.A.; Johns, M.L.; May, E.F.; Aman, Z.M. Simulating Hydrate Growth and Transport Behavior in Gas-Dominant Flow. Energy Fuels 2018, 32, 1012–1023. [Google Scholar] [CrossRef]
  5. Garg, S.; Shariff, A.M.; Shaikh, M.S.; Lal, B.; Suleman, H.; Faiqa, N. Experimental data, thermodynamic and neural network modeling of CO2 solubility in aqueous sodium salt of l-phenylalanine. J. CO2 Util. 2017, 19, 146–156. [Google Scholar] [CrossRef]
  6. Mu, L.; Li, S.; Ma, Q.L.; Zhang, K.; Sun, C.Y.; Chen, G.J.; Liu, B.; Yang, L.Y. Experimental and modeling investigation of kinetics of methane gas hydrate formation in water-in-oil emulsion. Fluid Phase Equilibria 2014, 362, 28–34. [Google Scholar] [CrossRef]
  7. Partoon, B.; Sahith, S.J.K.; Lal, B.; Bin Maulud, A.S. Gas hydrate models. In Chemical Additives for Gas Hydrates; Springer: Cham, Switzerland, 2020; pp. 67–85. [Google Scholar] [CrossRef]
  8. Erickson, D.; Brown, T. Hydrate occurrence in multiphase flowlines. Ann. N. Y. Acad. Sci. 1994, 715, 40–58. [Google Scholar] [CrossRef]
  9. Nygaard, H.F. Hydrate Properties in Multiphase Transportation Systems. Available online: https://www.onepetro.org/general/SPE-20290-MS (accessed on 21 May 2020).
  10. Zheng, D.; Che, D.; Liu, Y. Experimental investigation on gas-liquid two-phase slug flow enhanced carbon dioxide corrosion in vertical upward pipeline. Corros. Sci. 2008, 50, 3005–3020. [Google Scholar] [CrossRef]
  11. Jakobsen, T.; Sjöblom, J.; Ruoff, P. Kinetics of gas hydrate formation in w/o-emulsions the model system trichlorofluoromethane/water/non-ionic surfactant studied by means of dielectric spectroscopy. Colloids Surf. A Physicochem. Eng. Asp. 1996, 112, 73–84. [Google Scholar] [CrossRef]
  12. Jassim, E.; Abdi, M.A.; Muzychka, Y. A new approach to investigate hydrate deposition in gas-dominated flowlines. J. Nat. Gas Sci. Eng. 2010, 2, 163–177. [Google Scholar] [CrossRef]
  13. Talatori, S.; Barth, T. Rate of hydrate formation in crude oil/gas/water emulsions with different water cuts. J. Pet. Sci. Eng. 2012, 80, 32–40. [Google Scholar] [CrossRef]
  14. Xiang, C.; Peng, B.; Liu, H.; Sun, C.; Chen, G.; Sun, B. Hydrate Formation/Dissociation in (Natural Gas + Water + Diesel Oil) Emulsion Systems. Energies 2013, 1009–1022. [Google Scholar] [CrossRef] [Green Version]
  15. Kakati, H.; Kar, S.; Mandal, A.; Laik, S. Methane hydrate formation and dissociation in oil-in-water emulsion. Energy Fuels 2014, 28, 4440–4446. [Google Scholar] [CrossRef]
  16. Chen, J.; Liu, J.; Chen, G.J.; Sun, C.Y.; Jia, M.L.; Liu, B.; Si, S.; Ren, N. Insights into methane hydrate formation, agglomeration, and dissociation in water + diesel oil dispersed system. Energy Convers. Manag. 2014, 86, 886–891. [Google Scholar] [CrossRef]
  17. Daraboina, N.; Pachitsas, S.; Von Solms, N. Natural gas hydrate formation and inhibition in gas/crude oil/aqueous systems. Fuel 2015, 148, 186–190. [Google Scholar] [CrossRef]
  18. Wang, Y.; Fan, S.; Lang, X. Reviews of gas hydrate inhibitors in gas-dominant pipelines and application of kinetic hydrate inhibitors in China. Chin. J. Chem. Eng. 2019, 27, 2118–2132. [Google Scholar] [CrossRef]
  19. Chaudhari, P.; Zerpa, L.E.; Sum, A.K. A correlation to quantify hydrate plugging risk in oil and gas production pipelines based on hydrate transportability parameters. J. Nat. Gas Sci. Eng. 2018, 58, 152–161. [Google Scholar] [CrossRef]
  20. Bavoh, C.B.; Md Yuha, Y.B.; Tay, W.H.; Ofei, T.N.; Lal, B.; Mukhtar, H. Experimental and modelling of the impact of quaternary ammonium salts/ionic liquid on the rheological and hydrate inhibition properties of xanthan gum water-based muds for drilling gas hydrate-bearing rocks. J. Pet. Sci. Eng. 2019, 183, 106468. [Google Scholar] [CrossRef]
  21. Daimaru, T.; Yamasaki, A.; Yanagisawa, Y. Effect of surfactant carbon chain length on hydrate formation kinetics. J. Pet. Sci. Eng. 2007, 56, 89–96. [Google Scholar] [CrossRef]
  22. Wei, Y. Current technologies and prospects of shale gas development in China. J. Pet. Environ. Biotechnol. 2017, 8, 7463. [Google Scholar] [CrossRef] [Green Version]
  23. Nashed, O.; Partoon, B.; Lal, K.M.; Sabil, A.M. Investigation of functionalized carbon nanotubes’ performance on carbon dioxide hydrate formation. Energy 2019, 174, 602–610. [Google Scholar] [CrossRef]
  24. Khan, M.S.; Cornelius, B.B.; Lal, B.; Bustam, M.A. Kinetic Assessment of Tetramethyl Ammonium Hydroxide (Ionic Liquid) for Carbon Dioxide, Methane and Binary Mix Gas Hydrates. Recent Adv. Ion. Liq. 2018. [Google Scholar] [CrossRef] [Green Version]
  25. Bavoh, C.B.; Nashed, O.; Khan, M.S.; Partoon, B.; Lal, B.; Sharif, A.M. The impact of amino acids on methane hydrate phase boundary and formation kinetics. J. Chem. Thermodyn. 2018, 117, 48–53. [Google Scholar] [CrossRef]
  26. Mohammadi, A.H.; Richon, D. Gas hydrate phase equilibrium in the presence of ethylene glycol or methanol aqueous solution. Ind. Eng. Chem. Res. 2010, 49, 8865–8869. [Google Scholar] [CrossRef]
  27. Adams, C.W.M. Chemistry and Physics of Lipids. Nature 1967, 213, 974. [Google Scholar] [CrossRef]
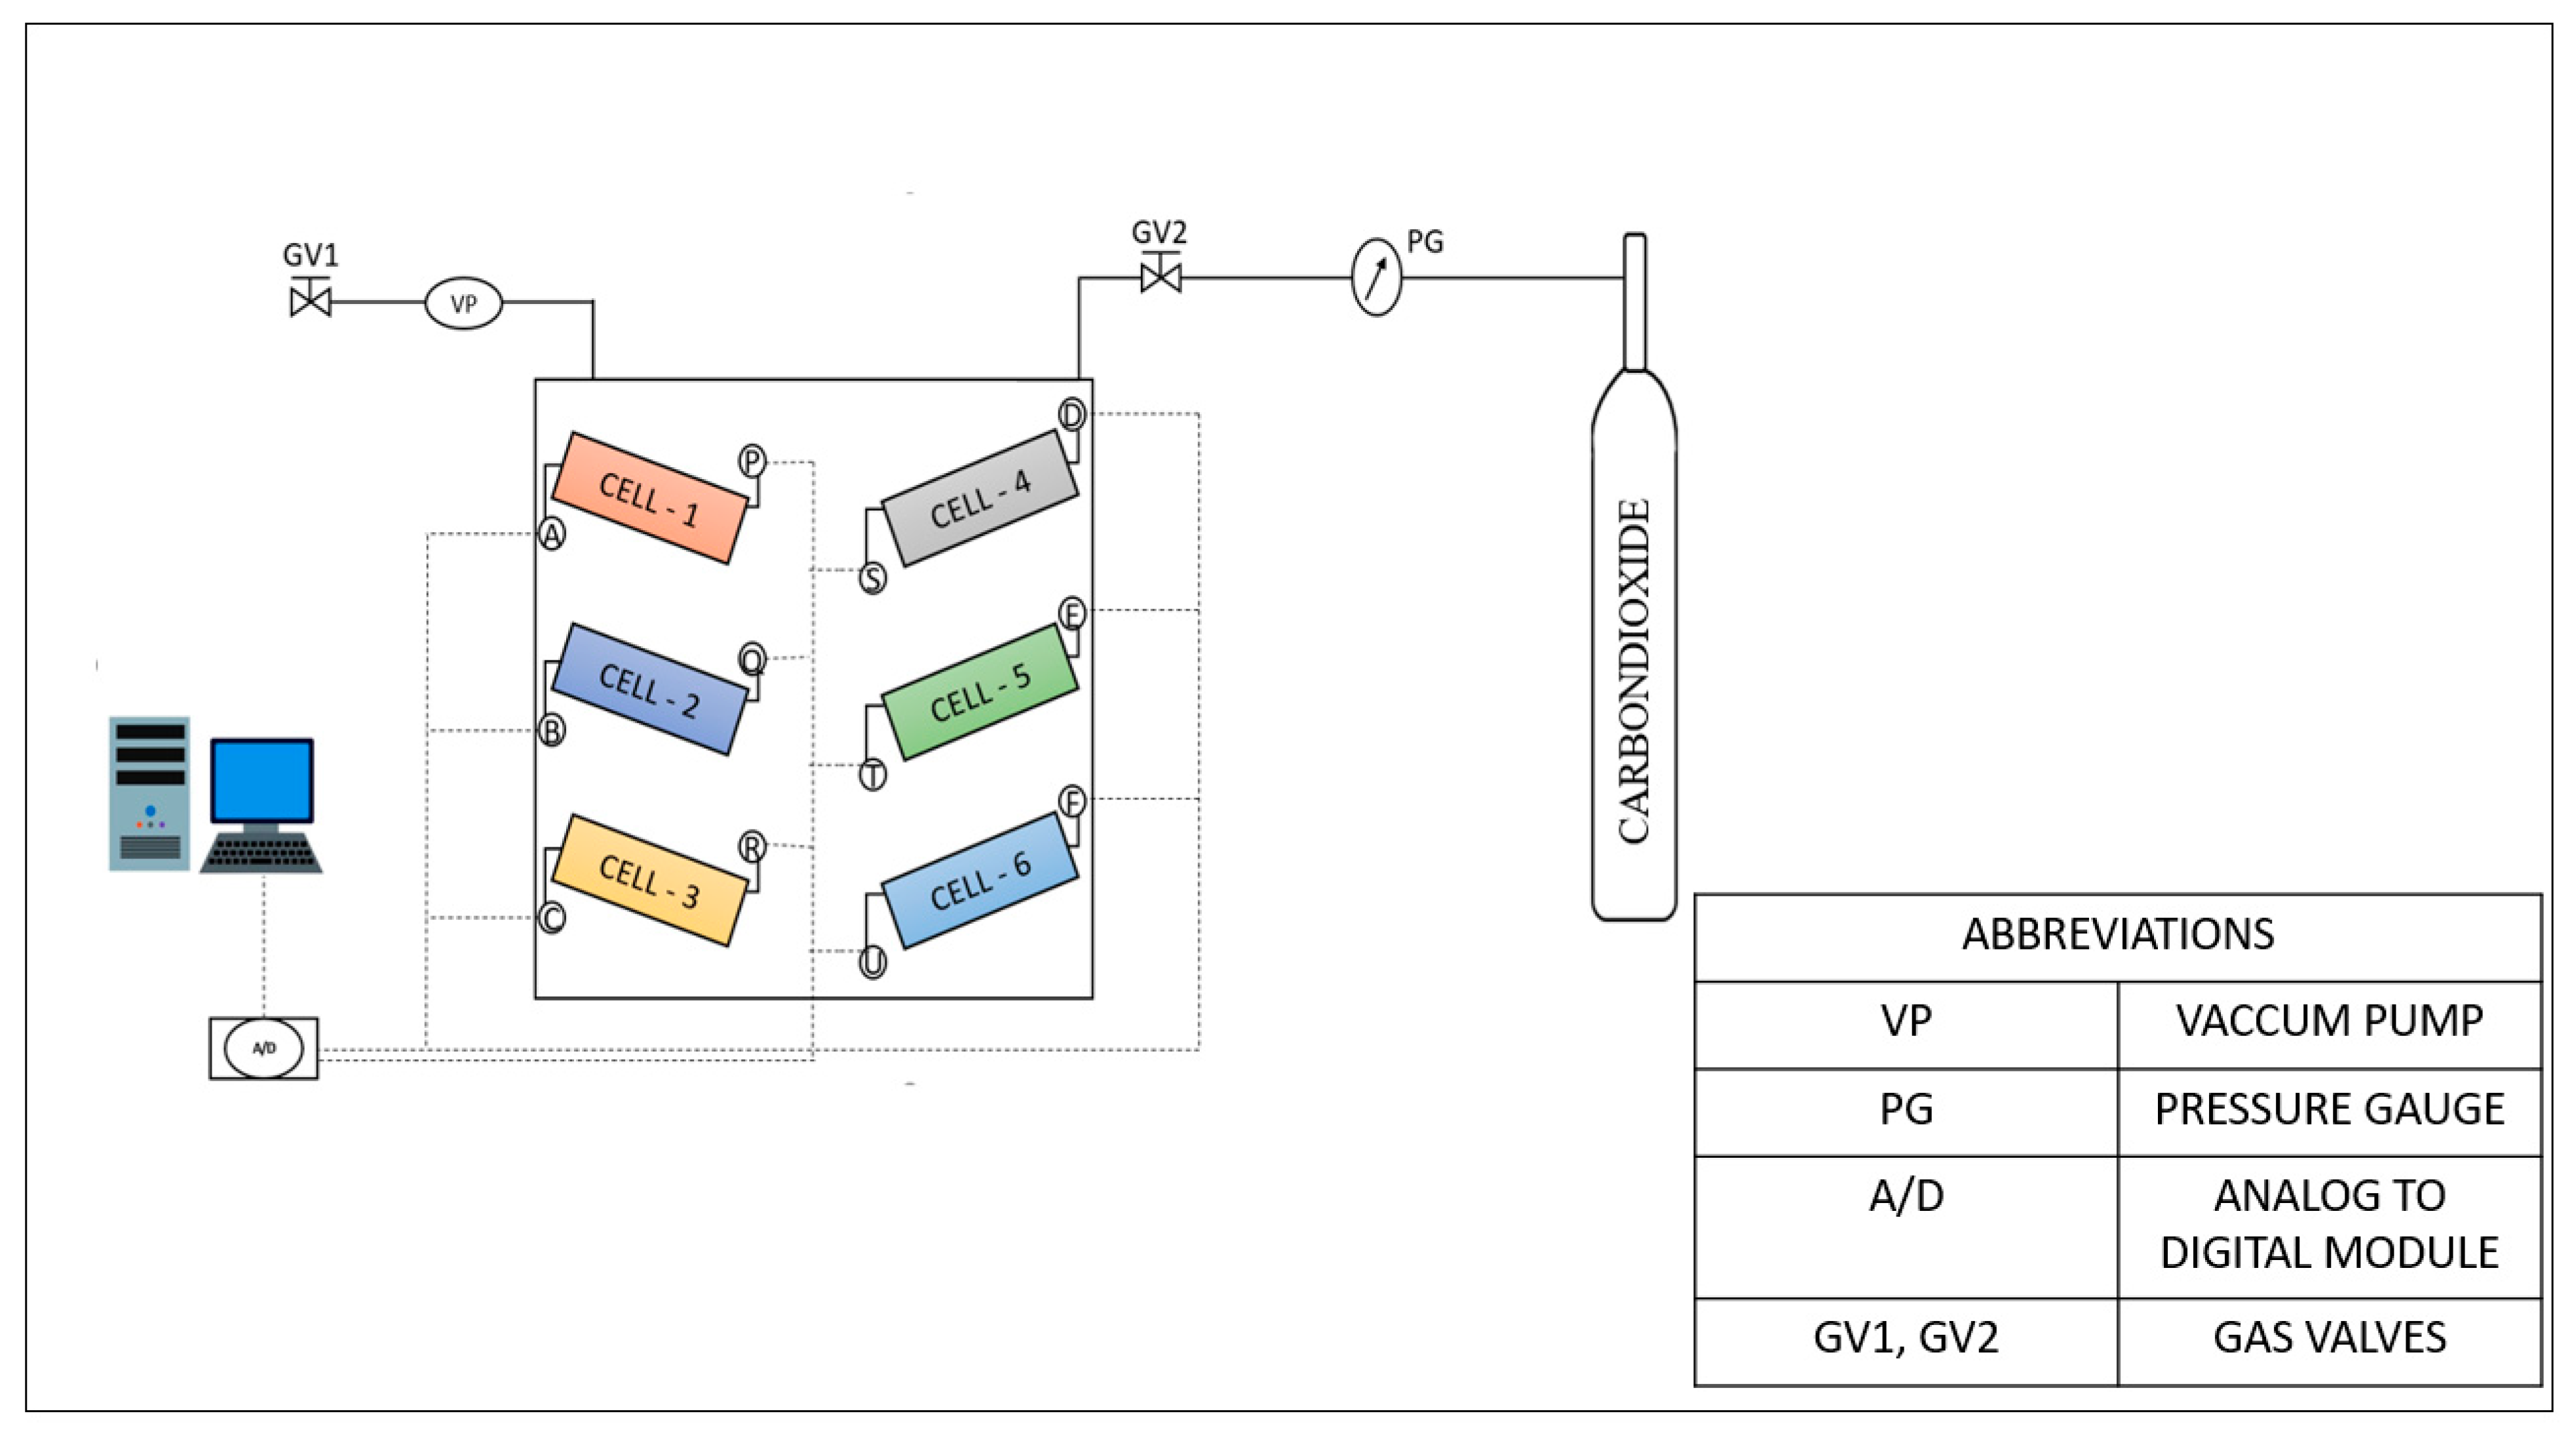
Figure 1. Schematic Representation of Experimental Setup.
Applsci 10 05052 g001
Figure 2. CHNS analysis of the crude sample.
Applsci 10 05052 g002
Figure 3. Carbon chain characterization in the crude sample.
Applsci 10 05052 g003
Figure 4. Gas chromatography and mass spectroscopy (GCMS) analysis of the Gasoline sample.
Applsci 10 05052 g004
Figure 5. Pressure–Temperature Profile generated during experiments (T-Cycle).
Applsci 10 05052 g005
Figure 6. Hydrate Liquid Vapor Equilibrium (HLVE) curve of Deionized Water, Gasoline, and Crude oil systems.
Applsci 10 05052 g006
Figure 7. Pressure/Temperature vs. Time (t) curve to find Induction time.
Applsci 10 05052 g007
Figure 8. Gas consumption (CO2) curve vs. time (t).
Applsci 10 05052 g008
Figure 9. Comparison of Rate of Formation for Different Pressures and Water cuts.
Applsci 10 05052 g009
Table 1. Thermodynamic Equilibrium Conditions.
SystemInitial PressureInitial TemperatureEquilibrium PressureEquilibrium Temperature
Deionized water + Carbon dioxide2.5285.152.476277.21
3285.152.999278.80
3.5285.153.488280.05
3.8285.153.754281.31
Gasoline + Deionized Water + Carbon dioxide2.5285.152.561277.26
3285.152.911277.89
3.5285.153.47279.05
3.8285.153.765280.05
Crude Oil + Deionized Water + Carbon dioxide3285.152.983279.45
3.5285.153.431280.75
3.8285.153.659281.15