Article

Missing Value Imputation in Stature Estimation by Learning Algorithms Using Anthropometric Data: A Comparative Study

1
Department of Industrial and Systems Engineering, Dongguk University—Seoul, Seoul 04620, Korea
2
Department of Industrial & Management Engineering, Sungkyul University, Anyang 14907, Korea
*
Author to whom correspondence should be addressed.
Appl. Sci. 2020, 10(14), 5020; https://doi.org/10.3390/app10145020
Submission received: 24 May 2020 / Revised: 17 July 2020 / Accepted: 18 July 2020 / Published: 21 July 2020
(This article belongs to the Special Issue Advances in Deep Learning Ⅱ)

Abstract

:
Estimating stature is essential in the process of personal identification. Because it is difficult to find human remains intact at crime scenes and disaster sites, for instance, methods are needed for estimating stature based on different body parts. For instance, the upper and lower limbs may vary depending on ancestry and sex, and it is of great importance to design adequate methodology for incorporating these in estimating stature. In addition, it is necessary to use machine learning rather than simple linear regression to improve the accuracy of stature estimation. In this study, the accuracy of statures estimated based on anthropometric data was compared using three imputation methods. In addition, by comparing the accuracy among linear and nonlinear classification methods, the best method was derived for estimating stature based on anthropometric data. For both sexes, multiple imputation was superior when the missing data ratio was low, and mean imputation performed well when the ratio was high. The support vector machine recorded the highest accuracy in all ratios of missing data. The findings of this study showed appropriate imputation methods for estimating stature with missing anthropometric data. In particular, the machine learning algorithms can be effectively used for estimating stature in humans.

1. Introduction

One of the major limitations in attempting to estimate human information such as sex, stature, and age at crime and disaster scenes is that necessary anthropometric measurements can be missing [1,2,3]; previous researchers have shown that estimating the biological information of a human body using a variety of anthropometric measurements such as of the upper and lower limbs is effective [4,5,6]. However, many previous researchers have shown that estimates of biological information vary widely across different ancestry groups and sexes [7,8,9]. Therefore, it is important to identify anthropometric measurements that can best estimate the biological information of a specific ancestry group. In addition, investigators have developed and applied several statistical techniques for estimating human biological information. Most previous researchers used regression analysis based on principles of linearity in body parts [10,11,12,13], but recently, efforts have been made to improve the accuracy through nonlinear analysis methods such as artificial neural networks [14,15,16,17].
There are documented methods of estimating human physical information based on measurement data [18,19], but most of the relevant studies are based on complete bodies including all parts [20,21,22]. In the real world however, human remains are damaged, whether intentionally or naturally. Therefore, it is difficult to extrapolate human biological information from human remains found in the field, where damage is not contained but is instead manifested differently in different situations and environments.
The purpose of this study was to compare imputation methods of managing missing values in anthropometric data in the process of estimating biological information for damaged remains at crime and disaster sites. For this purpose, we first examined the differences in accuracy between different imputation methods. Second, to compare the differences in accuracy according to the learning algorithm, we selected the optimal algorithm according to the missing ratio of data. Finally, we compared the accuracy of machine learning algorithms by dividing body parts into upper versus lower limbs.
The remainder of this study has consisted as follows. Section 2 includes a literature review for previous studies related to this study. In Section 3, we describe the participant, measurement, procedure of experiment, and data processing methods. Section 4 provides the results of three imputation methods for four learning algorithms. Finally, in Section 5, we discuss the results of each learning algorithm by comparing them with the results from previous studies; we also provide future research directions.

2. Background

2.1. Human Biological Information

Estimated stature is known to be one of the most important factors in profiles of human biometric information [23]. Researchers over recent decades have studied methods of predicting human stature by measuring various parts of the human body and have developed and utilized various estimation methodologies [24]. Developed methods include measuring body parts or bones of ashes, and these methods have been used to estimate height in various countries [24,25]. The methods of estimating stature and the measurement variables of interest have differed according to sex and ancestry, and research on Koreans is insufficient. Due to the lack of previous studies, there may be limitations in improving the accuracy of stature estimation, and finally differences occur from the current standard of forensic anthropology.
Human stature is a polymorphic result of a combination of genetic, environmental, and biological elements, and it is essential to develop a method that can be applied universally to different ancestry groups and countries. Most of the research related to estimating stature in Koreans has been conducted on only upper or lower limbs, and the necessity for research based on integrating body parts has been steadily raised. Researchers have highlighted that the accuracy of estimating biological information such as stature, sex, and age with a part of the human body has been lower than the accuracy of estimates for other ancestry groups and countries.
One of the major limitations of previous studies that estimate human stature is that the researchers have assumed intact bodies of human when they have developed their estimation models. In the fields of anthropology and forensic science, however, biological information is estimated using body parts that have been damaged in some way. Therefore, a model is needed that can effectively estimate stature from even damaged body parts.

2.2. Imputation Method for Handling Missing Values

Missing values are one of the most frequent issues in data analysis; they can occur for many reasons such as malfunctioning sensing systems or survey questions left blank. Imputation, the process of replacing missing values, has been extensively studied, and for this study, we compared three methods, mean imputation, nearest neighbor imputation, and multiple imputation.
Mean imputation is one of the simplest methods; it entails filling in missing values with the corresponding means [26]. Medians can be used instead of means for robustness. For categorical variables, the missing values are usually replaced with the most frequent values. Although this approach is simple and can be powerful, it has a limitation that feature variances are underestimated.
Nearest neighbor (NN) imputation, or hot-deck imputation, replaces missing values with the corresponding variables in the closest instance [27,28]. Because imputation based on a single nearest instance may not be robust, there have been several studies to improve NN imputation by using multiple nearest points [29,30,31].
Unlike mean and NN imputation in which a missing value is replaced by a single value, multiple imputation samples a missing value multiple times from the predefined distribution [32]. Then, the multiple data sets are generated by the random sampling of missing values, and the result is obtained by an ensemble of the results of each data set. The parameters in the distribution can be estimated by expectation-maximization algorithm [33,34] and Markov chain Monte Carlo method [35] when they cannot be found analytically.

2.3. Machine Learning Classifier

Recently, machine learning algorithms have been widely used in areas including business and finance, health care, and production due to their superior performance in sophisticated tasks [36,37,38,39,40]. We employed four widely used machine learning classifiers to predict the stature. The brief descriptions of these classifiers are as follows.
Logistic regression is a basic classifier that assumes the logarithm of the ratio between the probability of positive class to that of negative class as a linear combination of independent variables as in Equation (1):
log ( p 1 p 0 ) = b 0 + b 1 x 1 + b 2 x 2 + b 3 x 3 + b p x p .
Because Equation (1) cannot be solved analytically for general cases, it is usually solved by iteratively reweighted least squares. It can be extended to multiclass classification by setting the log odds, the logarithm values of the ratios between the probability of a certain class and that of the reference class, as linear combinations of independent variables as in Equation (2):
log ( p i p K ) = b i , 0 + b i , 1 x 1 + b i , 2 x 2 + b i , 3 x 3 + b i , p x p ,   i = 1 ,   ,   K 1 .
where K denotes the number of classes.
Naïve Bayes classifier (NB) is a probabilistic classifier based on Bayes theorem [41]. It usually assumes that all features are conditionally independent of one another given the class of an instance; thus, the classifier becomes as follows:
P ( y = k | x 1 , x 2 , , x p ) = 1 Z P ( y = k ) P ( x 1 , x 2 , , x p | y = k ) = 1 Z P ( y = k ) i = 1 p P ( x i | y = k ) .
where x i is the i -th feature of an instance, P ( y = k ) is a prior probability that the instance belongs to class k , and Z = k = 1 K P ( y = k ) i = 1 p P ( x i | y = k ) is a normalization factor, usually called evidence. In general, prior probabilities are defined proportional to the number of instances belonging to the class before training. Thus, in a training phase, a model finds the parameters in the likelihood distribution, P ( x i | y = k ) , that best fits the training instances.
Artificial neural networks (ANNs) are one of the most famous machine learning models today because they encompass deep learning, the most powerful algorithms in many applications. Neural networks were originally inspired by the human brain, which consists of several interconnected neurons [42]. In a neural network algorithm, as in a central nervous system, each neuron receives signals from other neurons, processes them into a new signal, and transmits it to others. The output of each neuron is calculated as follows:
output = g ( i = 1 M w i x i )
where x i ’s are inputs from other neurons, w i ’s are weight parameters, and g ( ) is an activation function that gives a neural network model nonlinearity; rectified linear unit, sigmoid, and hyperbolic tangent functions are typical choices for the activation function. In multilayer perceptron, a neural network model for regression and classification, the layers containing a number of neurons are located sequentially, and the neurons in one layer receive inputs from the neurons in the previous layer and transmit outputs to those in the next layer. After calculating the final output values in the output layer, the weight parameters between layers are trained to minimize the cost function by backpropagation [43].
Support vector machine (SVM), proposed by [44], is one of the most famous kernel-based classifiers and has advantages in both sparsity and robustness. It finds a hyperplane, a decision boundary, which maximizes the margin, the distance between a decision boundary and the closest data point, in the feature space, a high-dimensional space mapped from the original space. By mapping from the original space to the high-dimensional feature space, the separating hyperplane can be found even when it does not exist in the original space. Mapping to the high-dimensional space increases the calculation time for most algorithms, and sometimes it fails to find a solution within a reasonable time. However, solving the dual problems of SVM only requires the inner product of two instances in the feature space, the kernel function. This “kernel trick” dramatically reduces the calculation for training SVM and makes the algorithm scalable. Because the original SVM is designed to perform binary classification, one-versus-one or one-versus-all settings are adopted for the multiclass classification tasks. In this paper, we used a one-versus-all scheme for multiclass classification.

3. Method

3.1. Participants

The measurement was performed by SizeKorea (Korean Agency for Technology and Standards) in South Korea (https://sizekorea.kr/page/data/1_2). The 6th investigation for anthropometric dimension in Korean was conducted from March to November 2010 and the total number of participants was 14,016 (7532 males and 6484 females) recruited from various regions of South Korea. The participants’ ages ranged from 7 to 69, with the average age for the men being 22.00; the women’s average age was 23.74. All subjects were measured in the morning because human stature changes throughout the day.

3.2. Measurements

In this study, the upper and lower limbs were defined with referred to previous studies [45,46], and all dimensions of measurement used in this research are explained in Table 1. For the consistency of measurements, only upper and lower limbs on the right side were measured, and Martin Anthropometer, caliper (Martin type), and plastic tapeline were used for each body measurement. All units of measurement are centimeters and are rounded off at the third decimal place. Stature is measured by the vertical distance from the floor surface to the vertex point of the head. The subject was standing parallel to the anthropometer with the gaze fixed in front, and the measurer recorded the stature of the object displayed on the anthropometer.
The human upper limb is defined as the region from deltoid to hand and is commonly composed of the shoulder, upper/lower arm, wrist, hand, and finger. In this study, 10 measurement variables related to the upper limb were selected (see Table 1). In each of the upper limbs, the variables related to arm and elbow were measured with a plastic tapeline, and the variables related to hand were measured with a caliper (Martin type). The lower limb of human consists of the thigh, the leg (or upper/lower leg), and the foot. The researchers selected 15 measurement variables related to length, width, circumference for upper/lower leg, and foot. In each of the lower limbs, all variables except the foot length/breadth of the lower limbs were measured by Martin Anthropometer.

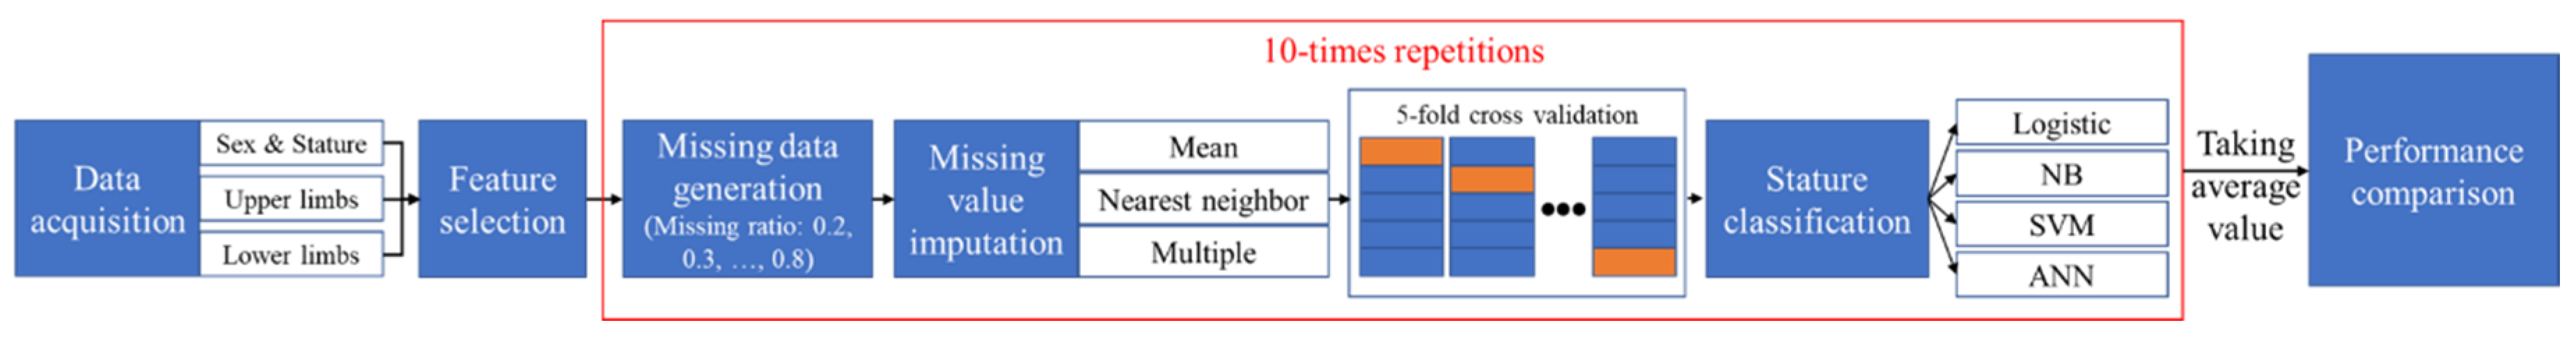
3.3. Experimental Procedure

The overview of the research flow and analysis of this study is shown in Figure 1. First, we generated input data sets for each experiment. After choosing the input features, upper limbs, lower limbs, or both, and sexes, male, female, or both, that would be utilized for the experiment, we randomly made missing values from an input data set according to the missing ratio ranging from 0.2 to 0.8. Then, we employed three imputation methods, mean, nearest neighbor, and multiple, to impute the missing values. For multiple imputation, we assumed that the joint distribution of input variables followed Gaussian distribution and sampled missing values from the conditional distribution five times.
Then, in referring to Miguel-Hurtado and his colleagues, we transformed the target variable, stature, into seven classes [15]. The classes were chosen equally spaced, so that the boundary values were (1047.0, 1173.9, 1300.7, 1427.6, 1554.4, 1681.3, 1808.1, 1935.0) for the seven-class cases, respectively. Because both maximum and minimum values occurred in male cases, the boundary values for males were the same as those for all instances. The boundary values for female cases were (1057.0, 1159.9, 1262.7, 1365.6, 1468.4, 1571.3, 1674.1, 1777.0) for 7 class cases, respectively.
Because the combination of missing value imputation methods and machine learning classifiers for anthropometry data have not yet been studied, we selected four conventional machine learning classifiers, logistic regression, naïve Bayes, neural network, and support vector machine, for the stature classification tasks with the imputed data sets because they have already been employed for anthropometry as well as other applications [15,47]. We also applied five-fold cross validation to find the best hyperparameters for classifiers. For the neural network classifier, we controlled two hyperparameters, the number of layers and the number of nodes in each hidden layer. We changed the number of layers from one to three and the number of hidden nodes from 10 to 50. For SVM, we employed Gaussian kernel. There were also two hyperparameters, γ, which controlled the bandwidth of the kernel function, and C, which balanced the errors for misclassified instances and the regularization for the classifier or the margin maximization. In this study, we varied γ from 0.01 to 100 and C from 0.05 to 10. For each of three imputation methods, the parameters for imputation, including mean values and covariance matrices, were estimated only with the training data set and the imputation for validation set was also conducted based on these parameters. We repeated the whole procedure 10 times for every case, and we reported averaged cross validation errors for comparison.

4. Results

4.1. Stature Classification: Upper Limb

For each learning algorithm, Table 2 shows the relationships between the missing ratio and the accuracy according to the three imputation methods based on variables for the upper limb for both males and females. There was no statistical significance at the 95% confidence level in the one-sample t-test for the results of accuracy obtained through 10 repeated trials for the imputation methods and learning algorithms for both sexes.
First, in cases of both sexes, when the missing ratio was 0.2, multiple imputation had the highest accuracy in all algorithms except NB. In mean and multiple imputation, the accuracy of NB changed less than it did with other algorithms when we increased the missing ratio. Among the three imputation methods, NN imputation showed the lowest accuracy at all missing ratios; all algorithms showed lower accuracy as the missing ratio increased. In addition, when the missing ratio was 0.6 or more, mean imputation had higher accuracy than multiple imputation; this was because the accuracy of multiple imputation when the missing ratio increased was lower than the accuracy of the other two methods under the same conditions. SVM showed the highest accuracy among the four machine learning algorithms: 0.756; missing ratio = 0.2.
Second, for females, when the missing ratio was 0.2 to 0.4, multiple imputation using SVM showed the highest accuracy. In contrast, when the missing ratio was 0.5 to 0.8, mean imputation using SVM showed the highest accuracy. The results of the experiment confirmed that the accuracy derived through SVM was the highest at all missing ratios. In addition, among the imputation methods, NN imputation showed the lowest accuracy at all missing ratios.
Finally, for males, when the missing ratio was 0.2 to 0.4, multiple imputation using SVM showed the highest accuracy, as with females. However, unlike with the female cases, when missing ratio was 0.5 or 0.6, the accuracy of SVM and ANN was the same, and when the missing ratio was larger than 0.7, mean imputation was more accurate than multiple.

4.2. Stature Classification: Lower Limb

The relationship between the missing ratio and the accuracy according to the three imputation methods based on variables for the lower limb is shown in Table 3 by male and female. There was no statistical significance at the 95% confidence level in the one-sample t-test for the results of accuracy obtained through 10 repeated trials for the imputation methods and learning algorithms for both sexes.
First, for both sexes, when the missing ratio was 0.2, multiple imputation had the highest accuracy with all learning algorithms except NB. With mean and multiple imputation, the accuracy of NB changed less than did accuracy with the other algorithms when the missing ratio increased. Among the three imputation methods, as in the upper limb, NN showed the lowest accuracy at all missing ratios.
All learning algorithms were less accurate as the missing ratio increased, although when the missing ratio was 0.5 or more, mean imputation was more accurate than multiple imputation. This was because the accuracy of multiple imputation decreased more than did accuracy with the other two methods when the missing ratio increased. The highest accuracy among the four machine learning algorithms was with SVM: 0.837; missing ratio = 0.2.
Second, with females, when the missing ratio was 0.2 to 0.6, multiple imputation using SVM showed the highest accuracy, and when the missing ratio was 0.5 or 0.6, accuracy was the same for SVM and ANN. In contrast, when the missing ratio was 0.7 to 0.8, mean imputation using SVM showed the highest accuracy. Among all methods, NN imputation showed the lowest accuracy at all missing ratios.
Finally, in the case of males, when the missing ratio was 0.2 to 0.5, multiple imputation using SVM showed the highest accuracy. Unlike with the female cases, when the missing ratio was 0.5, the accuracy of SVM and ANN was the same, and when the missing ratio was larger than 0.7, mean imputation was more accurate than multiple.

4.3. Stature Classification: Both

For each learning algorithm, Table 4 shows the relationship between the missing ratio and the accuracy according to the three imputation methods based on variables for both limbs by male and female. There was no statistical significance at the 95% confidence level in the one-sample t-test for the results of accuracy obtained through 10 repeated trials for the imputation methods and learning algorithms for both sexes.
First, for both sexes, when the missing ratio was 0.2, multiple imputation had the highest accuracy with all algorithms. Among the three imputation methods, NN was the least accurate at all missing ratios, although all algorithms were less accurate as the missing ratio increased. In addition, when the missing ratio was 0.6 or more, mean imputation was more accurate than multiple imputation. This was because multiple imputation showed the least accuracy of any method as the missing ratio increased. Among the four machine learning algorithms, SVM was the most accurate: 0.857; missing ratio = 0.2.
Second, for females, when the missing ratio was 0.2 to 0.6, multiple imputation using SVM showed the highest accuracy, whereas when the ratio was 0.7 or 0.8, mean imputation using SVM was the most accurate. The results of the experiment confirmed that the accuracy derived through SVM was the highest at all missing ratios. In addition, among the learning algorithms, the NB was the least accurate of all methods at all missing ratios. Finally, with males, when the missing ratio was 0.2 to 0.6, multiple imputation using SVM showed the highest accuracy, as with the female cases, but when the missing ratio was larger than 0.7, accuracy was higher with mean rather than multiple imputation.

5. Discussion and Future Work

The purpose of this study was to investigate the optimal missing value imputation and statistical methods for estimating demographic features through anthropometric measurements. We examined general imputation methods with machine learning algorithms to estimate sex and stature using anthropometric measurements related to the upper and lower limbs. In this study, we proposed three ways to impute missing values, and within our classification analysis of machine learning, we used seven classes to classify statures. Estimates of this class are significant for constructing biometric profiles of humans using various kinds of anthropometric data. In addition, this study has provided a baseline of comparison to researchers who conduct study that estimates human biological information based on anthropometric measurements by country and ethnicity.
First, we confirmed through upper and lower limbs that there were differences in the accuracy of the stature estimates for Korean males versus females; specifically, the stature estimates for the men were more accurate than the estimates of Korean women’s stature. Previous researchers obtained similar results for Koreans [10,45], but these results were not unique to Koreans: Other researchers found the same results in multiple studies on estimating stature across different countries [4,5,48,49,50].
Second, through our experiments on imputing missing values, we confirmed that multiple imputation was the most accurate in all cases of estimating biological information based on the upper and lower limbs except for high missing ratios. The multiple imputation used in this study was estimated using Gaussian distribution, which imputes missing data based on covariance between data. Therefore, this method is potentially more accurate than others but has a disadvantage in that it requires a larger minimum data set than do other methods for estimating the parameters of Gaussian distribution. We confirmed similar results in this study: As the missing ratio increased, the accuracy of multiple imputations decreases rapidly; when the missing ratio was over 0.7, mean imputation showed the highest accuracy in all cases. With mean imputation, the missing data are estimated based on the averages of the totals without considering relationships among features, so that the average for each missing ratio in the overall data does not change significantly. The other imputation methods, multiple and nearest neighbor imputations can be overfitted to the small amount of observed information. In this study, among the three imputation methods, the accuracy of mean imputation decreased the least when the missing ratio increased. Therefore, when estimating stature through anthropometric measurements in Koreans, if the victim’s body is severely damaged and it is difficult to obtain measurements for each body part, anthropometric measurements should be calculated using mean imputation.
Third, from the perspective of the learning algorithm, we used two types of linear classification (logistic, NB) and two types of nonlinear classification (SVM, ANN) in this study. In the previous studies of estimating stature through anthropometric data, researchers primarily performed linear regression and classification analysis based on the linearity of the human body. However, recently researchers have confirmed the accuracy of estimating stature using nonlinear or machine learning methods [51]. We also determined that in the context of missing data, which is the main contribution of this study, nonlinear classification was more accurate for measuring stature. Therefore, it is necessary to expand the methodology based on machine learning in research to estimate or classify biological information of humans through anthropometry.
The limitation of this study and future research are as follows. First, this study focused on deriving the best algorithm for estimating stature based on anthropometric measurements of Koreans over a wider range of ages compared to previous studies using statistical methods. In addition, in this research, it was not conducted on the elderly population over the age of 69. The aging of Korean society is progressing, and the population of the elderly is growing rapidly. Therefore, in future studies, it seems necessary to collect anthropometric data of elderly people over 70 years old and propose a more general methodology for estimating stature. Second, for this study we assumed that all missing data occurred randomly and that human body parts in the fields of anthropology and forensic science correlate with each other. For example, in a corpse without an arm, the probability that the hand is damaged is extremely high. In addition, the measurements related to the same body parts, such as the food breadth and the foot length, have high probability that they are missing simultaneously. Therefore, based on the results of this study, it is necessary to carry out additional studies in consideration of missing data specific to humans. Third, it is possible to conduct research to improve accuracy by examining various anthropometric variables that we did not measure in this study.
Since this study was conducted on living people, it can be used when estimating the stature of suspects. However, since a corpse’s body measurements change, it is difficult to apply it directly to the identification of the victims such as a crime or natural disasters. Therefore, in the future, it is necessary to conduct research to find a method for accurately estimating the stature for Korean corpses by additionally considering data on the carcasses. In addition, the type of missingness can be varied by the situations, the imputation methods for anthropometry data with structural missing values can be studied. In addition, the sophisticated machine learning classifiers, such as random forests and deeper neural networks, can be used for similar tasks to improve the prediction performances.

Author Contributions

Conceptualization, Y.S. and W.K.; Methodology, Y.S. and W.K.; Validation, Y.S. and W.K.; Formal Analysis, Y.S. and W.K.; Investigation, Y.S. and W.K.; Resources, Y.S.; Writing—Original Draft Preparation, Y.S. and W.K.; Writing—Review and Editing, Y.S. and W.K.; Visualization, W.K.; Supervision, W.K.; Project Administration, W.K.; Funding Acquisition, Y.S. and W.K. All authors have read and agreed to the published version of the manuscript.

Funding

This research was supported by the National Research Foundation of Korea (NRF) grant funded by the Korea government (MSIT: Ministry of Science and ICT) (No. 2017R1E1A1A03070102; 2020R1C1C1003425; 2020R1G1A1003384).

Acknowledgments

This research was supported by the National Research Foundation of Korea (NRF) grant funded by the Korea government (MSIT: Ministry of Science and ICT) (No. 2017R1E1A1A03070102; 2020R1C1C1003425; 2020R1G1A1003384).

Conflicts of Interest

The authors declare no conflicts of interest.

References

  1. Attallah, N.L.; Marshall, W.A. The estimation of stature from anthropometric and photogrammetric measurements of the limbs. Med. Sci. Law 1986, 26, 53–59. [Google Scholar] [CrossRef]
  2. Awais, M.; Naeem, F.; Rasool, N.; Mahmood, S. Identification of sex from footprint dimensions using machine learning: A study on population of Punjab in Pakistan. Egypt. J. Forensic Sci. 2018, 8, 72. [Google Scholar] [CrossRef]
  3. Lee, J.H.; Kim, Y.S.; Lee, U.Y.; Park, D.K.; Jeong, Y.K.; Lee, N.S.; Han, S.Y.; Han, S.H. Stature estimation from partial measurements and maximum length of lower limb bones in Koreans. Aust. J. Forensic Sci. 2014, 46, 330–338. [Google Scholar] [CrossRef]
  4. Mahakizadeh, S.; Moghani-Ghoroghi, F.; Moshkdanian, G.; Mokhtari, T.; Hassanzadeh, G. The determination of correlation between stature and upper limb and hand measurements in Iranian adults. Forensic Sci. Int. 2016, 260, 27–30. [Google Scholar] [CrossRef]
  5. Nor, F.M.; Abdullah, N.; Mustapa, A.M.; Wen, L.Q.; Faisal, N.A.; Nazari, D.A.A.A. Estimation of stature by using lower limb dimensions in the Malaysian population. J. Forensic Leg. Med. 2013, 20, 947–952. [Google Scholar] [CrossRef]
  6. Bidmos, M.A.; Adebesin, A.A.; Mazengenya, P.; Olateju, O.I.; Adegboye, O. Estimation of sex from metatarsals using discriminant function and logistic regression analyses. Aust. J. Forensic Sci. 2020, 1–14. [Google Scholar] [CrossRef] [Green Version]
  7. Ahmed, A.A. Estimation of stature using lower limb measurements in Sudanese Arabs. J. Forensic Leg. Med. 2013, 20, 483–488. [Google Scholar] [CrossRef]
  8. Bhavna, N.S.; Nath, S. Use of lower limb measurements in reconstructing stature among Shia Muslims. Internet J. Biol. Anthropol. 2009, 2, 86–97. [Google Scholar]
  9. Moshkdanian, G.; Mahaki Zadeh, S.; Moghani Ghoroghi, F.; Mokhtari, T.; Hassanzadeh, G. Estimation of stature from the anthropometric measurement of lower limb in Iranian adults. Anat. Sci. J. 2014, 11, 149–154. [Google Scholar]
  10. Kim, W.; Kim, Y.M.; Yun, M.H. Estimation of stature from hand and foot dimensions in a Korean population. J. Forensic Leg. Med. 2018, 55, 87–92. [Google Scholar] [CrossRef]
  11. Ahmed, A.A. Estimation of stature from the upper limb measurements of Sudanese adults. Forensic Sci. Int. 2013, 228, 178-e1. [Google Scholar] [CrossRef]
  12. Muñoz, J.I.; Liñares-Iglesias, M.; Suárez-Peñaranda, J.M.; Mayo, M.; Miguéns, X.; Rodríguez-Calvo, M.S.; Concheiro, L. Stature estimation from radiographically determined long bone length in a Spanish population sample. J. Forensic Sci. 2001, 46, 363–366. [Google Scholar] [CrossRef]
  13. Ruff, C.B.; Holt, B.M.; Niskanen, M.; Sladék, V.; Berner, M.; Garofalo, E.; Garvin, H.M.; Hora, M.; Maijanen, H.; Niinimäki, S.; et al. Stature and body mass estimation from skeletal remains in the European Holocene. Am. J. Phys. Anthropol. 2012, 148, 601–617. [Google Scholar] [CrossRef]
  14. Czibula, G.; Ionescu, V.S.; Miholca, D.L.; Mircea, I.G. Machine learning-based approaches for predicting stature from archaeological skeletal remains using long bone lengths. J. Archaeol. Sci. 2016, 69, 85–99. [Google Scholar] [CrossRef]
  15. Miguel-Hurtado, O.; Guest, R.; Stevenage, S.V.; Neil, G.J.; Black, S. Comparing machine learning classifiers and linear/logistic regression to explore the relationship between Hand dimensions and demographic characteristics. PLoS ONE 2016, 11, e0165521. [Google Scholar] [CrossRef]
  16. Rativa, D.; Fernandes, B.J.; Roque, A. Height and Weight Estimation From Anthropometric Measurements Using Machine Learning Regressions. IEEE J. Transl. Eng. Health Med. 2018, 6, 1–9. [Google Scholar] [CrossRef]
  17. Ortiz, A.G.; Costa, C.; Silva, R.H.A.; Biazevic, M.G.H.; Michel-Crosato, E. Sex estimation: Anatomical references on panoramic radiographs using Machine Learning. Forensic Imaging 2020, 200356. [Google Scholar] [CrossRef]
  18. Arun Kumar, A.; Soodeen-Lalloo, A.K. Estimation of stature from fragmented human remains. Anthropology 2013, 1, 2. [Google Scholar]
  19. Pablos, A.; Gómez-Olivencia, A.; García-Pérez, A.; Martínez, I.; Lorenzo, C.; Arsuaga, J.L. From toe to head: Use of robust regression methods in stature estimation based on foot remains. Forensic Sci. Int. 2013, 226, 299-e1. [Google Scholar] [CrossRef]
  20. Duyar, I.; Pelin, C. Body height estimation based on tibia length in different stature groups. Am. J. Phys. Anthropol. Off. Publ. Am. Assoc. Phys. Anthropol. 2003, 122, 23–27. [Google Scholar] [CrossRef]
  21. Chikhalkar, B.G.; Mangaonkar, A.A.; Nanandkar, S.D.; Peddawad, R.G. Estimation of stature from measurements of long bones, hand and foot dimensions. J. Indian Acad. Forensic Med. 2010, 32, 329–333. [Google Scholar]
  22. Mahakkanukrauh, P.; Khanpetch, P.; Prasitwattanseree, S.; Vichairat, K.; Case, D.T. Stature estimation from long bone lengths in a Thai population. Forensic Sci. Int. 2011, 210, 279-e1. [Google Scholar] [CrossRef] [PubMed]
  23. Abrahamyan, D.O.; Gazarian, A.; Braillon, P.M. Estimation of stature and length of limb segments in children and adolescents from whole-body dual-energy X-ray absorptiometry scans. Pediatric Radiol. 2008, 38, 311–315. [Google Scholar] [CrossRef]
  24. Kim, W. A comparative study on the statistical modelling for the estimation of stature in Korean adults using hand measurements. Anthropol. Anz. Ber. Uber Die Biol. Anthropol. Lit. 2019, 76, 57–67. [Google Scholar] [CrossRef] [PubMed]
  25. Akhlaghi, M.; Hajibeygi, M.; Zamani, N.; Moradi, B. Estimation of stature from upper limb anthropometry in Iranian population. J. Forensic Leg. Med. 2012, 19, 280–284. [Google Scholar] [CrossRef] [PubMed]
  26. Little, R.J. Regression with missing X’s: A review. J. Am. Stat. Assoc. 1992, 87, 1227–1237. [Google Scholar] [CrossRef]
  27. Sande, I.G. Hot-deck imputation procedures. Incomplete Data Sample Surv. 1983, 3, 339–349. [Google Scholar]
  28. Andridge, R.R.; Little, R.J. A review of hot deck imputation for survey non-response. Int. Stat. Rev. 2010, 78, 40–64. [Google Scholar] [CrossRef]
  29. Cotton, C. Functional description of the Generalized Edit and Imputation System. Business Survey Methods Division. Stat. Can. 1991, 59, 447–461. [Google Scholar]
  30. Kim, J.K.; Fuller, W. Fractional hot deck imputation. Biometrika 2004, 91, 559–578. [Google Scholar] [CrossRef]
  31. Van Hulse, J.; Khoshgoftaar, T.M. Incomplete-case nearest neighbor imputation in software measurement data. Inf. Sci. 2014, 259, 596–610. [Google Scholar] [CrossRef]
  32. Rubin, D.B. Multiple imputations in sample surveys-a phenomenological Bayesian approach to nonresponse. Proc. Surv. Res. Methods Sect. Am. Stat. Assoc. 1978, 1, 20–34. [Google Scholar]
  33. Dempster, A.P.; Laird, N.M.; Rubin, D.B. Maximum likelihood from incomplete data via the EM algorithm. J. R. Stat. Soc. Ser. B (Methodol.) 1977, 1–38. [Google Scholar] [CrossRef]
  34. Schafer, J.L. Analysis of Incomplete Multivariate Data; CRC Press: Boca Raton, FL, USA, 1997. [Google Scholar]
  35. Lin, T.H. A comparison of multiple imputation with EM algorithm and MCMC method for quality of life missing data. Qual. Quant. 2010, 44, 277–287. [Google Scholar] [CrossRef]
  36. Park, S.; Lee, J.; Son, Y. Predicting market impact costs using nonparametric machine learning models. PLoS ONE 2016, 11, e0150243. [Google Scholar] [CrossRef] [Green Version]
  37. Kim, Y.M.; Son, Y.; Kim, W.; Jin, B.; Yun, M.H. Classification of children’s sitting postures using machine learning algorithms. Appl. Sci. 2018, 8, 1280. [Google Scholar] [CrossRef] [Green Version]
  38. Kim, C.; Son, Y.; Youm, S. Chronic Disease Prediction Using Character-Recurrent Neural Network in The Presence of Missing Information. Appl. Sci. 2019, 9, 2170. [Google Scholar] [CrossRef] [Green Version]
  39. Lee, S.; Lee, Y.S.; Son, Y. Forecasting Daily Temperatures with Different Time Interval Data Using Deep Neural Networks. Appl. Sci. 2020, 10, 1609. [Google Scholar] [CrossRef] [Green Version]
  40. Son, Y.; Byun, H.; Lee, J. Nonparametric machine learning models for predicting the credit default swaps: An empirical study. Expert Syst. Appl. 2016, 58, 210–220. [Google Scholar] [CrossRef]
  41. Maron, M.E. Automatic indexing: An experimental inquiry. J. ACM (JACM) 1961, 8, 404–417. [Google Scholar] [CrossRef]
  42. Rosenblatt, F. The perceptron: A probabilistic model for information storage and organization in the brain. Psychol. Rev. 1958, 65, 386. [Google Scholar] [CrossRef] [Green Version]
  43. Rumelhart, D.E.; Hinton, G.E.; Williams, R.J. Learning representations by back-propagating errors. Nature 1986, 323, 533–536. [Google Scholar] [CrossRef]
  44. Cortes, C.; Vapnik, V. Support-vector networks. Mach. Learn. 1995, 20, 273–297. [Google Scholar] [CrossRef]
  45. Rhiu, I.; Kim, W. Estimation of stature from finger and phalange lengths in a Korean adolescent. J. Physiol. Anthropol. 2019, 38, 13. [Google Scholar] [CrossRef] [PubMed]
  46. Simmons, K.P.; Istook, C.L. Body measurement techniques: Comparing 3D body-scanning and anthropometric methods for apparel applications. J. Fash. Mark. Manag. 2003, 7, 306–332. [Google Scholar] [CrossRef]
  47. Son, Y.; Noh, D.J.; Lee, J. Forecasting trends of high-frequency KOSPI200 index data using learning classifiers. Expert Syst. Appl. 2012, 39, 11607–11615. [Google Scholar] [CrossRef]
  48. Auerbach, B.M. Methods for estimating missing human skeletal element osteometric dimensions employed in the revised fully technique for estimating stature. Am. J. Phys. Anthropol. 2011, 145, 67–80. [Google Scholar] [CrossRef]
  49. Uhrová, P.; Beňuš, R.; Masnicová, S.; Obertová, Z.; Kramárová, D.; Kyselicová, K.; Dörnhöferová, M.; Bodoriková, S.; Neščáková, E. Estimation of stature using hand and foot dimensions in Slovak adults. Leg. Med. 2015, 17, 92–97. [Google Scholar] [CrossRef]
  50. Wilson, R.J.; Herrmann, N.P.; Jantz, L.M. Evaluation of stature estimation from the database for forensic anthropology. J. Forensic Sci. 2010, 55, 684–689. [Google Scholar] [CrossRef]
  51. Feng, L.; Peng, F.; Li, S.; Jiang, L.; Sun, H.; Ji, A.; Zeng, C.; Li, C.; Liu, F. Systematic feature selection improves accuracy of methylation-based forensic age estimation in Han Chinese males. Forensic Sci. Int. Genet. 2018, 35, 38–45. [Google Scholar] [CrossRef]
Figure 1. Schematic diagram of the research flow and analysis.
Applsci 10 05020 g001
Table 1. Measurement variables used in the experiment
CategoryMeasurement
Variable
Definition
Upper LimbUpper Arm LengthThe distance from lateral shoulder to radial
Arm LengthThe distance from lateral shoulder to ulnar styloid over radial
Under Arm LengthThe distance from axilla to ulnar styloid
Hand LengthThe distance between a line connecting radial styloid and dactylion III
Palm LengthThe distance between a line connecting radial styloid and base of the middle finger
Hand BreadthThe distance between metacarpal V and metacarpal II
Hand ThicknessThe maximum thickness between dorsum of hand and palm at metacarpal III
Inner Grip CircumferenceThe circumference of grip, shaped as the interphalangeal joint of thumb where it meets the tip of index finger
Hand CircumferenceThe circumference of the hand over metacarpal V and metacarpal II
Elbow CircumferenceThe circumference of the elbow at center olecranon with the arm bent 90°
Wrist CircumferenceThe smallest circumference from the elbow to the knuckles of the hand
Upper Arm CircumferenceThe circumference of the upper arm around the flexed biceps with the upper arm extended horizontally and the elbow flexed 90°
Lower LimbHip HeightThe vertical distance between a buttock protrusion and standing surface
Waist HeightThe vertical distance between a standing surface and side waist band (half the distance between the tenth rib and iliac crest)
Iliac Spine HeightThe vertical distance between a standing surface and anterior superior iliac spine
Knee HeightThe vertical distance between a standing surface and the tibia
Thigh Vertical LengthThe distance between gluteal fold and popliteal fossa
Outside Leg LengthThe vertical distance between a standing surface and side waist band (half the distance between the tenth rib and iliac crest)
Foot BreadthThe horizontal length between metatarsophalangeal V and metatarsophalangeal I
Foot LengthThe straight length between ptemion and acropodion
Lateral Malleolus HeightThe vertical distance between a standing surface and lateral malleolus
Thigh CircumferenceThe horizontal circumference at gluteal fold
Knee CircumferenceThe horizontal circumference at mid-patella
Ankle Circumferencethe maximum circumference over lateral malleolus and medial malleolus
Table 2. Accuracy results by imputation method and learning algorithm: Upper limb.
SexMethodImputationMissing Ratio
0.20.30.40.50.60.70.8
Combined sexesLogisticMean0.7210.7000.6800.6540.6280.5840.549
Nearest neighbor (NN)0.6570.5940.5390.4870.4450.4170.407
Multiple0.7450.7320.7130.6840.6430.5790.493
Naïve Bayes classifier (NB)Mean0.6660.6600.6500.6340.6140.5810.537
NN0.6220.5860.5500.5080.4650.4320.398
Multiple0.6620.6500.6330.6050.5630.5100.436
Support vector machine (SVM)Mean0.7490.7340.7170.6960.6710.6380.595
NN0.6980.6470.5970.5390.4910.4520.445
Multiple0.7560.7410.7190.6880.6440.5820.493
Artificial neural network (ANN)Mean0.7340.7140.6970.6700.6420.6090.565
NN0.6920.6420.5860.5260.4760.4390.432
Multiple0.7530.7380.7170.6870.6440.5820.495
FemaleLogisticMean0.6810.6610.6420.6220.5960.5660.528
NN0.6250.5760.5290.4860.4570.4320.420
Multiple0.6990.6860.6630.6340.5910.5350.466
NBMean0.6440.6340.6200.5970.5700.5330.479
NN0.6000.5720.5360.5010.4640.4340.406
Multiple0.6350.6190.5940.5590.5090.4530.405
SVMMean0.6970.6820.6650.6450.6220.5910.551
NN0.6520.6110.5690.5250.4860.4540.440
Multiple0.7070.6910.6680.6380.5950.5390.469
ANNMean0.6840.6640.6450.6250.6000.5710.532
NN0.6350.5900.5450.5060.4700.4410.429
Multiple0.7030.6890.6650.6360.5940.5380.467
MaleLogisticMean0.7290.7100.6860.6620.6370.6050.562
NN0.6580.5960.5370.4880.4510.4310.425
Multiple0.7570.7440.7270.6990.6580.6010.514
NBMean0.6960.6860.6690.6480.6200.5800.519
NN0.6510.6150.5730.5310.4880.4510.420
Multiple0.6920.6790.6590.6270.5830.5280.458
SVMMean0.7340.7150.6950.6710.6450.6140.573
NN0.6880.6400.5850.5320.4840.4480.438
Multiple0.7620.7480.7290.7000.6600.6020.517
ANNMean0.7490.7330.7170.6950.6730.6430.604
NN0.7040.6580.6070.5550.5100.4680.453
Multiple0.7600.7460.7280.7000.6600.6030.518
Table 3. Accuracy results by imputation method and learning algorithm: Lower limb.
SexMethodImputationMissing Ratio
0.20.30.40.50.60.70.8
Combined sexesLogisticMean0.7780.7570.7350.7100.6790.6430.596
NN0.6940.6240.5590.5000.4540.4330.427
Multiple0.8160.8050.7880.7560.7020.6150.497
NBMean0.7840.7720.7570.7370.7090.6680.613
NN0.7090.6550.5990.5430.4930.4570.428
Multiple0.8000.7900.7700.7340.6680.5700.451
SVMMean0.8220.8110.7960.7770.7520.7160.668
NN0.7550.7000.6380.5730.5190.4860.493
Multiple0.8370.8240.8030.7670.7060.6170.501
ANNMean0.8110.7980.7770.7610.7320.6890.636
NN0.7700.7220.6570.5790.5110.4750.477
Multiple0.8350.8220.8020.7670.7070.6170.498
FemaleLogisticMean0.7570.7380.7150.6960.6690.6370.596
NN0.6900.6240.5680.5200.4850.4620.456
Multiple0.7910.7840.7680.7400.6900.6120.513
NBMean0.7590.7470.7290.7050.6740.6310.574
NN0.7010.6530.6030.5580.5130.4770.440
Multiple0.7710.7620.7430.7100.6490.5570.462
SVMMean0.7880.7750.7580.7400.7180.6820.637
NN0.7320.6800.6290.5760.5330.5040.496
Multiple0.8080.7970.7780.7450.6920.6140.517
ANNMean0.7710.7510.7300.7090.6810.6470.603
NN0.7190.6680.6110.5580.5160.4870.477
Multiple0.8060.7950.7760.7450.6920.6130.514
MaleLogisticMean0.7700.7490.7260.7030.6740.6390.594
NN0.6830.6100.5470.4930.4590.4400.443
Multiple0.8130.8040.7870.7560.7020.6180.512
NBMean0.7760.7620.7410.7180.6840.6390.577
NN0.7070.6550.6020.5520.5050.4690.439
Multiple0.7920.7810.7620.7240.6590.5650.465
SVMMean0.8080.7930.7760.7570.7320.6930.651
NN0.7480.6930.6370.5810.5330.5010.501
Multiple0.8330.8190.7980.7630.7050.6210.519
ANNMean0.7880.7680.750.7240.6940.6570.609
NN0.7480.6930.6310.5670.5170.4850.480
Multiple0.8300.8170.7960.7630.7060.6210.515
Table 4. Accuracy results by imputation method and learning algorithm: Upper/lower limb.
SexMethodImputationMissing Ratio
0.20.30.40.50.60.70.8
BothLogisticMean0.8010.7840.7690.7480.7240.6930.650
NN0.7170.6480.5780.5150.4650.4240.407
Multiple0.8290.8210.8110.7910.7550.6940.594
NBMean0.7710.7650.7540.7400.7200.6880.642
NN0.7000.6540.6050.5510.4980.4470.410
Multiple0.7910.7840.7730.7490.7060.6340.529
SVMMean0.8340.8210.8090.7930.7750.7460.702
NN0.7650.7080.6470.5850.5230.4670.434
Multiple0.8570.8470.8330.8100.7670.6980.595
ANNMean0.8180.8000.7840.7610.7360.7050.658
NN0.7580.7000.6280.5610.4980.4420.417
Multiple0.8540.8450.8310.8080.7670.6990.596
FemaleLogisticMean0.7680.7530.7340.7180.6960.6670.625
NN0.7010.6450.5810.5330.4860.4480.426
Multiple0.7940.7890.7780.7590.7250.6640.567
NBMean0.7560.7480.7350.7170.6890.6530.591
NN0.6940.6520.6040.5560.5090.4600.422
Multiple0.7710.7630.7500.7270.6790.5960.481
SVMMean0.7980.7830.7690.7510.7300.7000.656
NN0.7400.6910.6380.5860.5330.4820.449
Multiple0.8220.8120.7970.7740.7320.6670.572
ANNMean0.7870.7690.7510.7320.7100.6810.635
NN0.7170.6630.6030.5540.5030.4600.434
Multiple0.8190.8100.7950.7730.7320.6660.571
MaleLogisticMean0.7980.7840.7650.7430.7190.6880.647
NN0.7120.6420.5720.5150.4700.4340.420
Multiple0.8230.8200.8110.7930.7590.6980.604
NBMean0.7870.7760.7620.7430.7170.6780.615
NN0.7130.6700.6180.5700.5160.4660.424
Multiple0.8030.7960.7820.7570.7110.6330.526
SVMMean0.8290.8160.7980.7820.7610.7320.689
NN0.7690.7170.6590.6010.5430.4880.453
Multiple0.8570.8470.8320.8100.7680.7020.609
ANNMean0.8170.7990.7790.7580.7320.7010.655
NN0.7420.6870.6250.5610.5070.4550.431
Multiple0.8530.8440.8290.8070.7680.7020.607

