Article

Thermophilic Methane Production from Hydrothermally Pretreated Norway Spruce (Picea abies)

Department of Process, Energy and Environmental Technology, University of South-Eastern Norway, Kjølnes Ring 56, NO 3918 Porsgrunn, Norway
*
Author to whom correspondence should be addressed.
Appl. Sci. 2020, 10(14), 4989; https://doi.org/10.3390/app10144989
Submission received: 2 July 2020 / Revised: 16 July 2020 / Accepted: 17 July 2020 / Published: 20 July 2020
(This article belongs to the Special Issue Intensified Conversion of Organic Waste into Biogas)

Abstract

:
Norway spruce (Picea abies) is an industrially important softwood species available in northern Europe and can be used to produce bio-methane after proper pretreatment to overcome its recalcitrant complex structure. Hot water extraction (HWE) pretreatment at two different conditions (170 °C for 90 min (severity 4.02) and 140 °C for 300 min (severity 3.65)) was applied to extract hemicellulosic sugars from Norway spruce for thermophilic anaerobic digestion (AD) of the hydrolysate. The methane yield of hydrolysate prepared at the lower pretreatment severity was found to be 189 NmL/gCOD compared to 162 NmL/gCOD after the higher pretreatment severity suggesting higher pretreatment severity hampers the methane yield due to the presence of inhibitors formed due to sugars and lignin degradation and soluble lignin, extracted partially along with hemicellulosic sugars. Synthetic hydrolysates simulating real hydrolysates (H170syn and H140syn) had improved methane yield of 285 NmL/gCOD and 295 NmL/gCOD, respectively in the absence of both the inhibitors and soluble lignin. An effect of organic loadings (OLs) on the methane yield was observed with a negative correlation between OL and methane yield. The maximum methane yield was 290 NmL/gCOD for hydrolysate pretreated at 140 °C compared to 195 NmL/gCOD for hydrolyate pretreated at 170 °C, both at the lowest OL of 6 gCOD/L. Therefore, both pretreatment conditions and OL need to be considered for efficient methane production from extracted hydrolysate. Such substrates can be utilized in continuous flow industrial AD with well-adapted cultures with stable organic loading rates.

1. Introduction

Biofuels are of great interest to reduce excessive dependence on fossil fuels that trigger issues related to global warming and energy security. Lignocellulosic biomass such as wood, food wastes, energy crops, and agricultural and forest residues are the most abundant renewable sources for biofuels and do not compete with food production. Methane production from such biomass can reduce a significant fraction of fossil fuel usage paving ways for a cleaner environment in a sustainable way.
Spruce, a softwood, is found abundantly as the major forest reserve in Nordic countries [1] and can be considered as a potential source of biogas due to its high carbohydrate content. However, its inherent recalcitrant structure and complex composition must be overcome to enhance hydrolysis and further conversion by anaerobic microorganism [2]. Various pretreatments, such as mechanical, thermal, chemical, and biological methods, have been attempted on lignocellulosic biomass prior to anaerobic digestion (AD) to enhance methane production. Hot water extraction (HWE) has several advantages and is widely accepted as a green technology as it involves only lignocellulosic biomass and water and avoids corrosion problems, acid recycling, and formation of neutralization sludges [3,4,5]. HWE, usually carried out at temperatures between 120 °C and 230 °C and various pressure conditions for different retention times, effectively dissolves hemicellulose sugars which may be beneficial to the anaerobic digestion in theory [6]. This liquid hydrolysate is rich in oligomeric and monomeric products like xylose, glucose, mannose, arabinose, and galactose [7] and is a suitable substrate for AD [8]. AD on hydrolysate, instead of AD on the original lignocellulose, overcomes problems related to traditional solid-state (SS) or semi SS-AD such as higher retention time, poor biodegradation, low methane yield, and acidification [9]. In addition to the hemicellulosic sugars in the liquid hydrolysate, inhibiting compounds are also formed due to degradation of sugar molecules during HWE [10] which usually inhibit bacteria and archea and operating parameters of the pretreatment need to be optimized to reduce their formation [11]. The nature and concentration of such inhibiting compounds depend upon the condition of pretreatment of the raw material types [12]. The main inhibitors are furfural and 5-hydroxymethylfurfural (HMF) formed by the dehydration of pentose and hexose sugars respectively in addition to degradation products of lignin polymer such as phenol, cresol, syringaldehyde, and vanillin [12].
Temperature plays a crucial role in AD as increased temperature leads to increased reaction rate in biochemical systems [13]. Thermophilic AD (55–60 °C) is considered a highly-efficient system due to a better pathogen inactivation and enhanced biogas production rate compared to mesophilic AD (35–40 °C) [13]. However, several studies have reported that thermophilic AD is susceptible to VFAs accumulation (especially propionic acid), inhibiting the methanogenic activity and decreasing the pH-buffer system [14,15,16]. Besides the operating condition, a higher proportion of feeding can also influence the rate of anaerobic digestion. The organic loading (OL) of the reactor with a reasonable amount of inoculum, also called substrate-to-inoculum ratio (S/I), is an important parameter when estimating methane potential [17]. High OL leads to VFA accumulation inhibiting the methanogens, thus lowering the amount of methane produced. On the contrary, lower OL cannot provide enough nutrition for microorganism growth, thus hampering the AD process [18].
Although hot water extracted hydrolysates of several agricultural residues and energy crops have been anaerobically digested to produce methane [11,19,20], AD of woody biomass hydrolysate (especially spruce) is still lacking. Among the available experiments, very few [21] are conducted in a thermophilic condition although it would save energy cost cooling the hydrolysates prepared at high temperatures. It is also imperative to test AD of hydrolysate prepared at different pretreatment conditions to have an overview of the effects of possible inhibitors in methane production due to the severity of the pretreatment.
This paper aims to evaluate the methane yield in thermophilic AD condition from hot water extract of Norway spruce pretreated at two different pretreatment severities, also by testing corresponding synthetic hydrolysates and the effect of organic loadings in AD.

2. Materials and Methods

Norway spruce is pretreated using hot water extraction before anaerobic digestion is conducted on the hydrolysate. Synthetic similar substrates, without inhibitors from the pretreatment, are also anaerobic digested and compared with the spruce hydrolysates. Two batch AD methods are used, syringe and automatic methane potential testing system (AMPTS II).

2.1. Raw Materials

Wood chips of Norway spruce was used for the experiment. The wood chips had a dry matter content of 44.5% when received from a Norwegian forestry company. The sample was air dried to 93.9% dry matter, hammer milled with 1000 RPM through a 19 mm hole screen and fractionated to a size between 13 mm and 5 mm.

2.2. Hot Water Extraction (HWE)

The wood chips were hot water extracted in a Mini-Mill Laboratory Digester (MMLD) from MK Systems Inc. Distilled water and wood chips were mixed in a 5:1 weight ratio and loaded into the MMLD before preheated at 110 °C for 20 min. The temperature was then increased to the target temperature of 140 °C or 170 °C over the course of 20 or 30 min, respectively, while the final temperature was kept for 300 min or 90 min, respectively. After the HWE, the hydrolysate was collected, analyzed and tested for anaerobic digestion.
In order to describe the combined effects of pretreatment time and temperature for each pretreatment, a severity factor (Equation (1)) [22] is calculated for each hydrolysate (Table 1). The temperatures and retention times were chosen based on literatures [10,23] so as to extract maximum hemicellulose from the biomass without the formation of AD inhibitors in the hydrolysate while also pretreating the solid residues to be used elsewhere such as bio-char production for enhanced carbon recovery. Pretreatment at 140 °C for 300 min and 170 °C for 90 min gives a severity factor ((log(R0)) of 3.65 and 4.02 respectively, both considered as relatively moderate treatment severities with relatively low concentration of inhibitory degradation products [23].
Severity   factor =   log ( R 0 )   =   log ( t × exp ( T 100 14.75 ) )
where T (°C) is the pretreatment temperature and t (min) is the reaction time.

2.3. Synthetic Hydrolysate

Synthetic hydrolysates H170syn and H140syn were prepared to closely simulate hydrolysate pretreated at 170 °C (H170) and 140 °C (H140) respectively, based on the concentrations of sugars and acetic acid and excluding the amount of furfural, 5-HMF, and soluble lignin (Table 2).

2.4. Anaerobic Digestion in Batch Reactors

The two hydrolysates from HWE of Norway spruce were tested for bio-methane potential (BMP) during syringe batch anaerobic digestion (AD) at different organic loads, while both hydrolysates and the synthetic hydrolysates are tested in the AMPTS II at one load.
All hydrolysates, including the synthetic, had micronutrients and macronutrients added. A macronutrient solution was made of NH4Cl (44.48 g/L), (NH4)H2PO4 (5.3 g/L), (NH4)2HPO4 (1.78 g/L), MgCl2·6H2O (21.4 g/L), CaCl2·2H2O (7.56 g/L) and NaHCO3 (100 g/L). Similarly, a micronutrient was prepared from the yeast extract (2.5 g/L), FeCl3·6H2O (0.2 g/L), ZnCl2 (5.2 g/L), MnCl2·4H2O (0.0472 g/L), (NH4)6Mo7O24·4H2O (0.064 g/L), AlKO8S2·12H2O (0.01 g/L), CoCl2·6H2O (0.2 g/L), NiCl2·6H2O (0.52 g/L), H3BO3 (0.12 g/L), CuCl2·2H2O (0.32 g/L) and HCl (20 mL/L). The macronutrient solution was added to maintain a minimum COD:N:P ratio of 350:5:1 [24], while 4 mL micronutrient was added per 1000 L feed. Nutrients and NaOH addition increased the feed pH to 7.

2.5. Bio-Methane Potential AMPTS II Test Setup

The BMP test was performed [25] with the Automatic Methane Potential Test System II (AMPTS II, Bioprocess Control® AB, Lund, Sweden), a standardized laboratory set-up designed to automatically determine BMP of any biodegradable material by water displacement method. Each sample was run in triplicates (Table 3) in standard 650 mL glass flasks (Kimax® kimble) with working volume of 400 mL and the same organic loading of 20 gCOD/L. The system was purged with pure nitrogen gas for 3–5 min to ensure desired anaerobic condition. An intermittent mixing was 50 s every hour (motor speed adjustment of 80%). The carbon dioxide was removed by passing produced biogas through 80 mL of 3 M sodium hydroxide (NaOH) mixed with 0.4% thymolphthalein solution as pH-indicator for each reactor. The methane produced from AMPTS II were automatically provided as NmL by Bioprocess Control® software. A more detailed description of the system can be found in Badshah, Lam [26].

2.6. Bio-Methane Potential Syringe Test Setup

Cheap disposable plastic medical syringes (BD Plastipak, Franklin Lakes, NJ, USA) of 100 mL were used as batch reactors for BMP test [27]. Triplicates of each OL of 6, 10, 20, and 30 g COD/L for both HWE feeds were prepared (Table 4) for bio-methane potential (BMP) tests to study the effect of OL on methane yield. After feeding, syringes were closed airtight by adding a needle with silicone rubber stopper at the tip. Fed syringes were kept at 55 °C in a thermostat. Stirring was not applied but frequent gas sampling acted as manual stirrer. During the test, gas volume was recorded depending upon the activity. After prolonged gas accumulation, gas (minimum 5 mL) was transferred to a separate syringe by pushing through interconnected gas valves (Mininert® syringe valve) for determination of methane content of the produced biogas. Methane volume was adjusted to 0 °C and 1 atm and presented as NmL.
Usually, OL is used interchangeably with substrate to inoculum (S/I) ratio. However, S/I is based on volatile solids (VS) of substrate and inoculum. The value of 0.5 (based on volatiles) has been found to be boundary to avoid overloading conditions if the inoculum is sewage sludge [28]. However, this value can change with the types of inoculum and substrate used. The S/I value can be higher if inoculum is compact such as granular sludge and lower if the substrate is more complex such as algae residues [29]. As our substrate is mostly liquid, COD based loading per volume of inoculum is more logical. In addition, volatiles such as acetic acid is lost during drying at 105 °C which gives incorrect methane potential values using VS.

2.7. Inoculum

Mesophilic granular sludge used as inoculum was originally obtained from a mesophilic industrial internal recirculation reactor treating paper mill effluent with total solid and volatile solid concentrations of 181 and 119 g/L respectively. Inoculum was degassed at 30 °C for at least 5 days before using for the experiment to reduce the gas production from inoculum. Thermophilic sludge was prepared [30] by running initial similar tests in both syringes (Table 4) and AMPTS II (Table 3) at 55 °C for 53 days until complete methane production before used as inoculum in this experiments. Blank sample, only containing inoculum, was tested in triplicates along with the investigated samples. Gas produced from blank sample was deducted from the gas produced from hydrolysates to offset the gas produced by endogenous respiration of microorganisms in inoculum. The result thus represents gas produced only from the tested samples.

2.8. Analytical Methods

Gas composition was determined by SRI gas chromatography (model 8610C) (Table 5) using Helium as a carrier gas and the oven temperature was kept constant at 83 °C.
VFA concentrations were carried out using gas chromatography HP 6890 serial C (Hewlett-Packard) with a flame ionization detector and a capillary column (DB-FFAP 30 m long and 0.25 mm ID, 0.25 µm film). Helium was used as the carrier gas at a flow velocity of 5 mL/min with detector gases as hydrogen and air. The injector and the detector temperatures were set to be 200 °C and 250 °C, respectively. The oven was programmed to start at 80 °C and hold for 1 min, then to 180 °C at a rate of 30 °C/min, then to 230 °C at a rate of 100 °C/min.
COD was measured according to US standard 5220D [31]. Samples were filtered through 0.45 µm pore size glass filter after sampling to measure CODs using commercial kits (WTWTM). pH was measured using WTW inolab pH7110. The carbohydrate composition was analyzed according to the NREL procedure by Sluiter, Hames [32], using a Dionex ICS500 HPLC system from ThermoFisher Scientific. Approximations of the furfural and HMF concentrations in the hydrolysates was done according to the procedure of Chi, Zhang [33], using a UV 1800 from Shimadzu.

2.9. Kinetic Modeling

Maximum methane production potential was determined by fitting the observed cumulative methane yield with the modified Gompertz equation Equation (2) [35]. It can simulate methane yield and explain the lag time and sigmoidal growth curve [36].
G ( t ) = G 0 exp { exp [ R max e G 0 ( λ t )   +   1 ] }
where G(t) is the cumulative methane production (mL CH4 gCOD−1) at a given time t, t is time over the digestion period in days (d), G0 is the maximum methane production potential (mL CH4 gCOD−1), Rmax is the maximal methane production rate (mL CH4 Gcod−1 day−1), λ is the lag phase time in days (d), and e is Euler’s constant (=2.7183).

3. Results

3.1. AD Feed Characteristics

Hot water extraction of Norway spruce led to higher organic concentrations in the hydrolysate when treated at 170 °C than at 140 °C, with total COD (CODt) and soluble COD (CODs) concentrations of 30.7 and 26.9 g/L respectively when treated at 170 °C compared to 22.3 and 20.0 g/L at 140 °C (Table 6).
The sugars found in the hydrolysate were the hemicellulose sugars arabinose, galactose, glucose, xylose, and mannose. Mannose was the major compound in both hydrolysates with 56% and 43% for pretreated at 170 °C and 140 °C, respectively. The total sugar concentration was higher (18.6 g/L) when treated at 170 °C than at 140 °C (11.9 g/L). All other individual sugar concentrations, except arabinose, was found higher in hydrolysate pretreated at 170 °C than at 140 °C.
Both furfural and HMF concentrations were higher in hydrolysate pretreated at 170 °C (923 and 451 mg/L respectively) than pretreated at 140 °C (160 and 168 mg/L respectively) due to higher severity pretreatment.
The pH of hydrolysate pretreated at 170 °C (3.7) was lower than for hydrolysate pretreated at 140 °C (3.8) due to higher acetic acid released from the hydrolysis of acetyl groups contained in the hemicellulose. Acetic acid was the dominant volatile fatty acid in the hydrolysate and is also a substrate for methane production if the concentration is not above the threshold value of inhibition (2400 mg/L) [37,38]. The concentrations were below for both hydrolysates with acetic acid concentration of hydrolysates pretreated at 170 °C of 1030 mg/L and at 140 °C of 590 mg/L.

3.2. AMPTS II Test

Methane yield in AMPTS II was recorded for 8 days in which methane formation was completed within 6 days and resulted in cumulative methane yields of 189 NmL/gCOD (0.53 gCOD/gCOD) and 162 NmL/gCOD (0.45 gCOD/gCOD) for hydrolysate pretreated at 140 °C and 170 °C, respectively (Table 7).
The methane yield of real hydrolysates was significantly lower than of synthetic hydrolysates (Table 7). Synthetic hydrolysate had 87% and 58% higher methane yield than hydrolysate prepared at 170 °C and 140 °C, respectively. Values of CODs and accumulated VFA (acetic acid, propionic acid, and total) (Table 7) at the end of the experiment shows higher degradability of synthetic hydrolysates compared to real hydrolysates as observed by lower concentration of undigested CODs and VFA. Synthetic hydrolysates had negligible amount of VFA which is in accordance with its high biodegradability while hydrolysate pretreated at 170 °C had more than double total VFA concentration (221 mg/L) compared to hydrolysate pretreated at 140 °C (103 mg/L). Even propionic concentration (112 mg/L) was higher than acetic acid (97 mg/L).

3.3. Kinetic Modeling

The modified Gompertz model was applied for modelling the methane yield of both real and synthetic hydrolysates from the AMPTS II tests (Figure 1). It shows that the tested model provided reasonable fit to the experimental data (Table 8). It was confirmed by the high values (all above 0.96) of determination coefficient (R2) and less than 4% difference between the predicted (G0) and the measured cumulative methane yield. It implies that the model could explain greater than 96% of the variations in the results.
Hydrolysate pretreated at 170 °C had a lower maximum methane production rate (Rmax = 34 mL CH4 gCOD−1day−1) compared to hydrolysate pretreated at 140 °C (Rmax = 100 mL CH4 gCOD−1day−1). It shows that higher severity index pretreatment not only reduced the methane yield, but also decreased the rate of the AD process.
The lag phases (Table 8) during the beginning of the digestion period were less than 0.4 days for all substrates. Interestingly, the synthetic hydrolysates had slightly higher lag phase in both cases and lower Rmax in case of 140 °C hydrolysate compared to real hydrolysates for some unknown reasons.

3.4. Syringe Tests

The batch experiments in syringes were run for 38 days until the biogas production became negligible but most of the biogas was produced before 10 days.

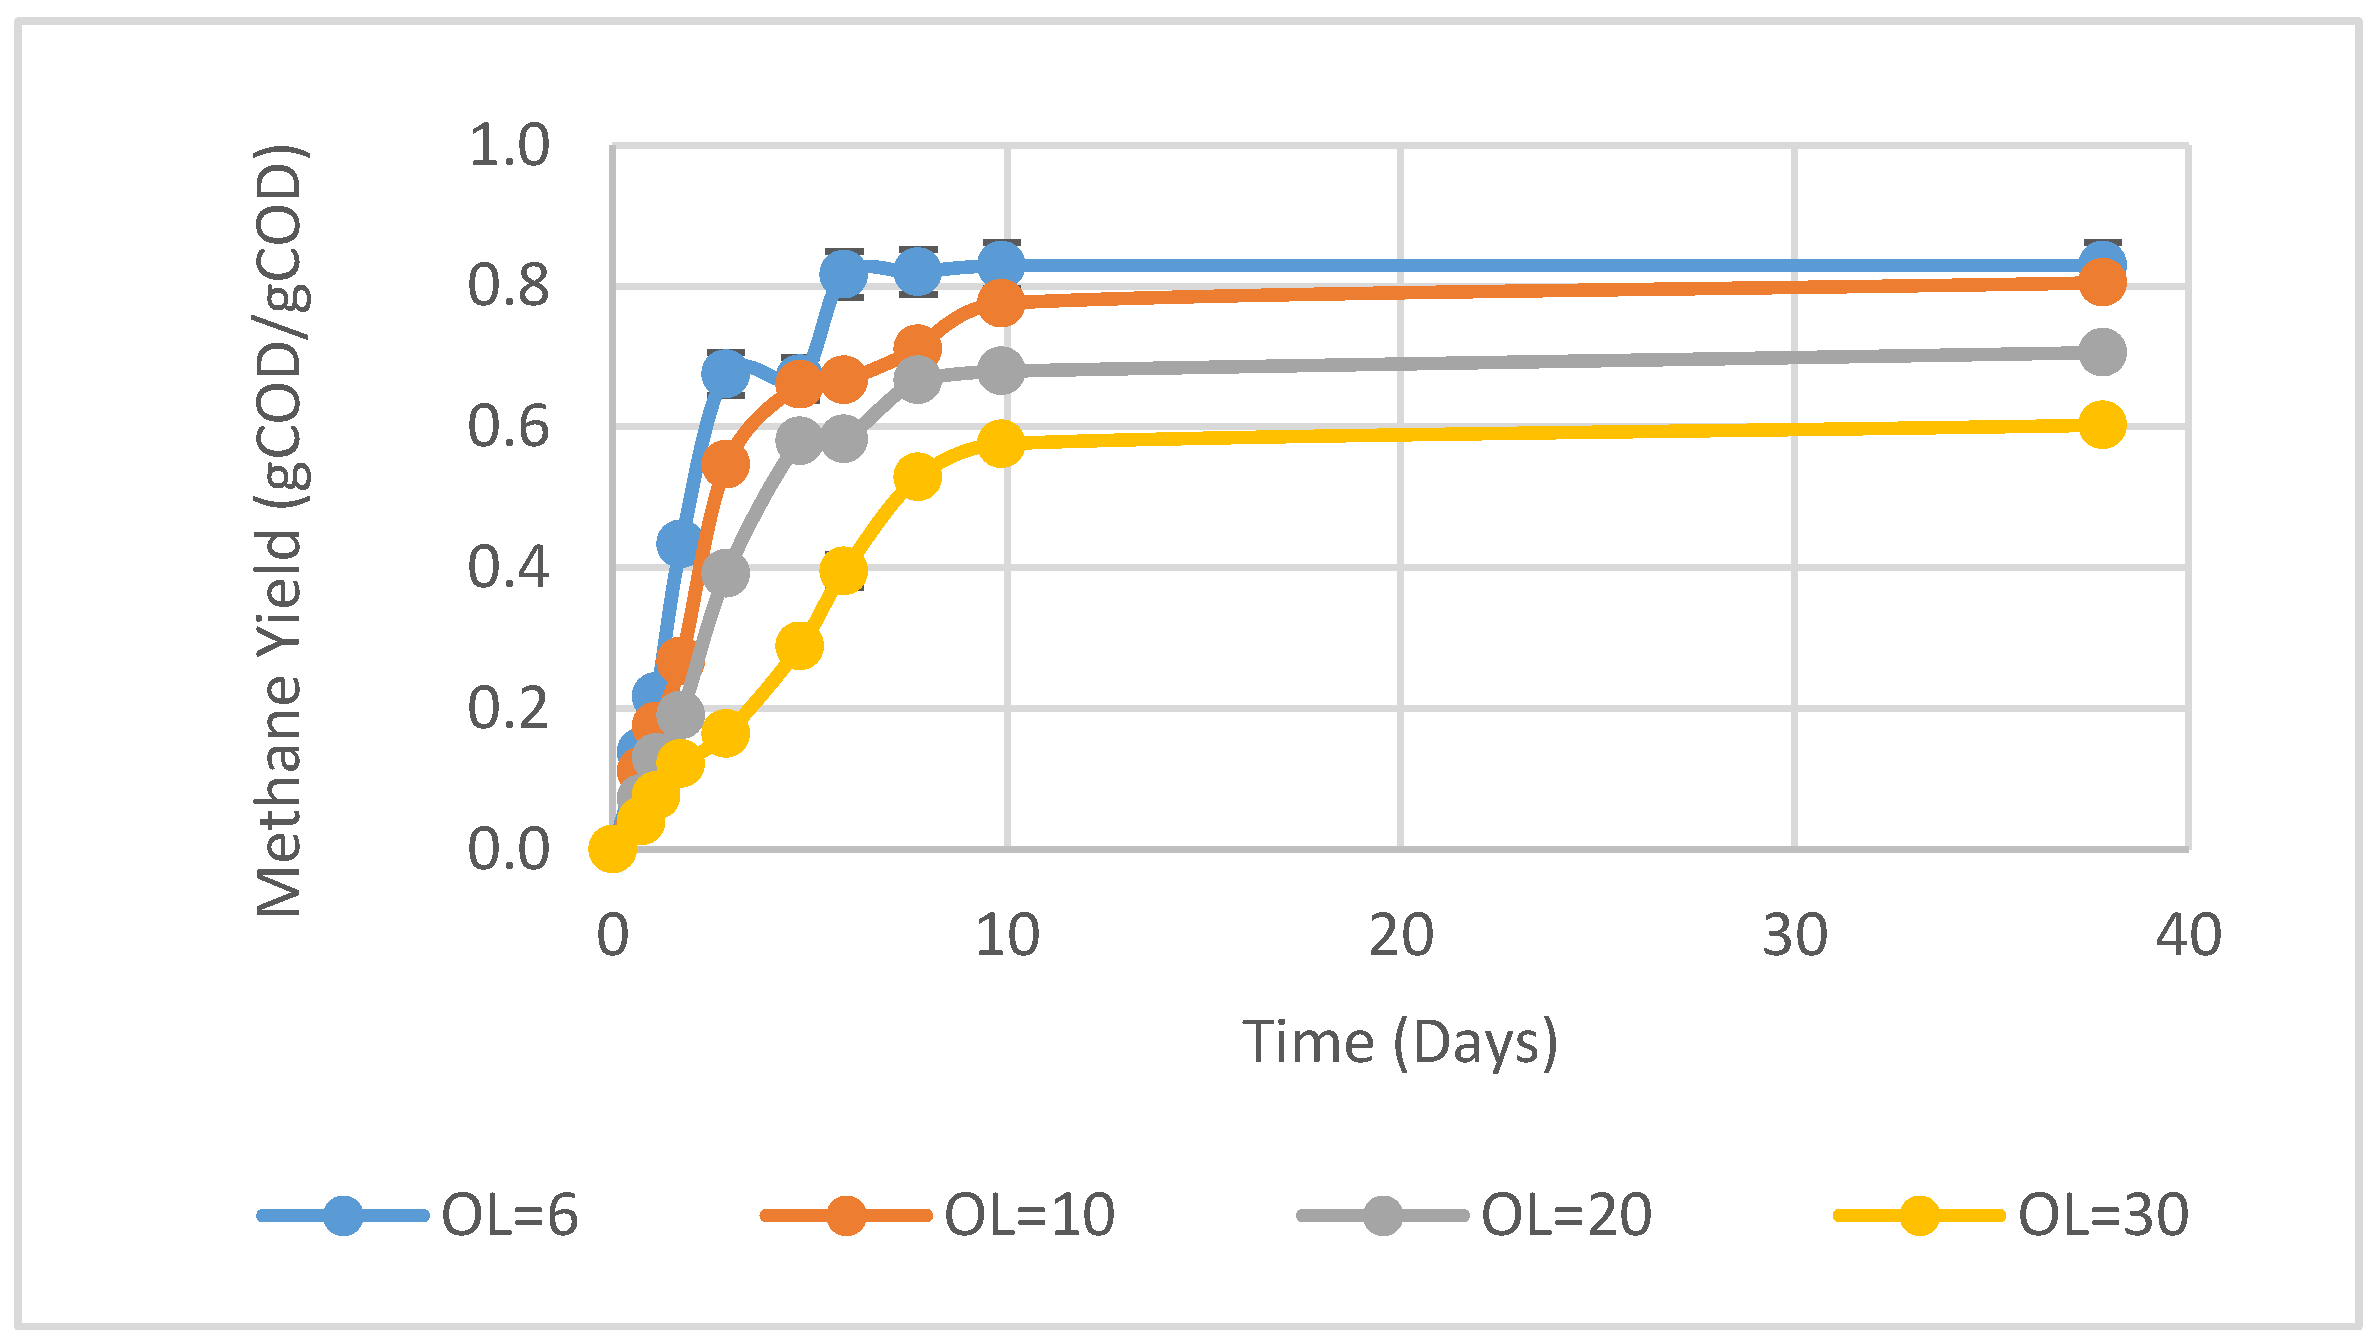
3.4.1. Influence of Organic Loading on AD of Hydrolysate

Increasing OL of the hydrolysate pretreated at 170 °C had negative effect on the methane yield (Figure 2). Methane yields at OL of 6 and 10 gCOD/L were 0.56 gCOD/gCOD (195 NmL/gCOD) and 0.53 gCOD/gCOD (186 NmL/gCOD) respectively. At higher loadings of 20 and 30 gCOD/L, the methane yield decreased even more to 0.48 (167 NmL/gCOD) and 0.43 gCOD/gCOD (152 NmL/gCOD) respectively.
The methane yields from hydrolysate pretreated at 140 °C (Figure 3) had a similar trend as that of hydrolysate pretreated at 170 °C. During the lower OLs of 6 and 10 gCOD/L, the methane yield was 0.83 (290 NmL/gCOD) and 0.80 gCOD/gCOD (282 NmL/gCOD) respectively while decreasing to 0.71 (247 NmL/gCOD) and 0.6 gCOD/gCOD (211 NmL/gCOD) for 20 and 30 gCOD/L respectively. The methane yield of hydrolysate pretreated at 140 °C was significantly higher than hydrolysate pretreated at 170 °C at all OLs (Figure 4), as also observed during AD in AMPTS II.

3.4.2. pH and Methane Content in the Biogas

The methane content, ranging from 10% to 84 %, increased over time, and remained constant at the later stages for both substrates at all loadings (Figure 5 and Figure 6). The main difference between the substrates was the higher methane content of hydrolysate pretreated at 140 °C than 170 °C during the initial period of higher loadings suggesting higher inhibitor concentration in higher severity pretreated hydrolysate. The low initial biogas methane content also implies that the methanogenesis step was inhibited. The final weighted-average methane content in the biogas ranged from 64.9% to 73.3% (Table 9). It was higher for hydrolysate pretreated at 170 °C compared to 140 °C and decreased at increased OL.

4. Discussion

4.1. Effect of Sugars

Hydrolysate pretreated at 170 °C had a higher concentration of sugars and COD values compared to hydrolysate pretreated at 140 °C due to increased solubilization of macromolecular organic compounds (e.g., hemicelluloses) that hydrolyzed into small molecular matter like oligosaccharides and monosaccharide (e.g., glucose and xylose). A similar trend has been observed by others [39,40]. Higher methane yield for hydrolysate produced at 140 °C than at 170 °C is also observed by others [11,36]. Contrary to different studies, that higher sugar content in the hydrolysate is best for methane production [20], it shows that it is not necessarily true. The reason is assumed to be the formation of sugar and lignin degradation products (e.g., furfural, HMF, phenol, cresol) which inhibit the AD process [2,19]. Therefore, sugar content should not be the sole objective to be considered if methane production is the main goal, and the amounts of inhibitors and soluble lignin in the hydrolysate needs to be considered [19,41]. The severity index during the pretreatment appears to be a useful control parameter to obtain fewer inhibitors, solubilize lignin and cellulose in the hydrolysate and to obtain a solid residue ideal for other purposes, like making bio-char.
Usually, glucose is present in the hydrolysate due to hydrolysis of cellulose but as the HWE is not severe enough to cause dissolution of cellulose, it is expected to have originated from hemicelluloses or extractives [6,42].

4.2. Effect of Sugar Degradation Products

Higher pretreatment severity leads to higher sugar dissolution which increases the concentration of sugar degradation products such as furfural and HMF which inhibit the AD process [2]. Furfural is formed in the hydrolysate as degradation product from pentose sugars (xylose and arabinose) while HMF is formed from hexose sugars (mannose, glucose, and galactose) [43]. Increase in severity leads to low arabinose concentration in hydrolysate pretreated at 170 °C due to its assumed conversion to furfural. Since only arabinose and xylose can be converted to furfural as they are pentose sugars, and arabinose has the lowest activation energy in the degradation reaction of arabinose to furfural when compared to that of xylose to furfural a conversion of arabinose is assumed [19].
Although the concentration of furfural and HMF is within the threshold value (2 g/L for furfural and 0.8 g/L for HMF) for both the samples [44], inhibition could be expected from the synergistic effect of both inhibitors [45]. Although inhibitors are also considered to be more pronounced at thermophilic condition than mesophilic condition [46,47], this may not be a problem in continuous flow industrial processes since the microorganisms can get acclimatized to toxic compounds over time. The inhibitors are themselves degraded in an adapted culture, but if furfural is present in the HMF, the conversion rates of both decrease significantly and HMF degradation started only with the complete degradation of furfural in batch experiments [48]. Continuous flow experiments are needed to better understand the effects of hydrolysate inhibitors on AD and culture adaptations to such.

4.3. Effect of Soluble Lignin and its Derivatives

During hot water extraction, part of the lignin is also dissolved along with the hemicellulose depending upon the severity index [4,7]. Hydrolysate from higher pretreatment temperature is therefore expected to have higher concentrations of complex recalcitrant compounds and soluble lignin than lower temperature pretreated hydrolysate. These compounds will remain undigested, are slowly degraded, or act as inhibitors to different steps of AD [41,49,50] and can be observed as higher undigested CODs at the end of the experiment (Table 7). Decrease in methane yield has been observed previously due to the addition of lignin during AD of xylose [12].
Although not quantified here, it can be safely assumed that there must be some lignin degradation products such as phenols and cresols due to long residence time in HWE which inhibit the AD process [51,52].

4.4. Effect of OL

Methane yield of hydrolysate pretreated at 140 °C at OL of 6 gCOD/L was similar to that of synthetic hydrolysate (Figure 4) suggesting concentration of inhibitors below threshold values and favorable organic loading for AD microbes. This is similar to findings of wheat straw hydrolysate [8], but no similar studies on woody biomass hydrolysates are found for comparison. Additionally, most of the existing experiments on hydrolysate from agricultural residues are based on mesophilic conditions.
The trend that the comparative cumulative methane yield (gCOD/gCOD) from the syringe batch reactors decreased with increased OLs (R2 = 0.995 for both hydrolysates) is also observed by others [18] and can be explained by increased stress on microorganisms. Lower OL provides favorable microbial symbiosis leading to higher methane yield while higher OL leads to imbalance between VFA production and its consumption.

4.5. Methane Content as a Tool to Monitor Reactor Health

Monitoring the methane content to evaluate possible overloading situations revealed a rather normal behavior [18,53] where the methane content in the produced biogas increased over time and remained nearly constant at the later stages for both substrates at all loadings. The behavior can be explained by VFA production and consumption affecting the pH. Soluble sugars are the most readily biodegradable organics and are converted into VFAs and finally to methane [20]. Easily degraded substrate can lead to accumulation of intermediate products such as alcohol and VFAs due to imbalance of micro-organisms created by stressful conditions such as nutrient deficiency and toxicity in the feed, leading to thermodynamic and kinetic constraints in the system. Then microorganisms are unable to convert acetate to methane efficiently, compromising the methane content [19]. Overtime, VFA is consumed slowly increasing pH, creating more favorable conditions for methanogens, and the methane concentration increases accordingly. During lower loading, the initial condition is not as acidic compared to higher loading avoiding pH inhibition of the methane production. The initial pH drop due to excessive VFA accumulation and methanogens inhibition increases with OL as confirmed by low methane concentration (Figure 6) [37]. The reactor recovered from this initial stress in our cases (end pH between 8.1 and 8.3) with reasonable final methane concentrations in all cases (Table 9). This implies that continuous flow industrial AD will work well on these substrates as long as large, abrupt organic load changes are avoided.

4.6. Kinetic Modeling

170 °C synthetic hydrolysate also had lower Rmax compared to 140 °C synthetic hydrolysate but the difference was not as drastic as in real hydrolysates and can be attributed to the higher concentration of xylose in 170 °C synthetic hydrolysate which is generally less preferred to degrade as feed by microorganisms than other sugars [54]. A short lag phase of less than 0.4 days was also observed by others during AD of sugars [55].

4.7. Comparison of AD Batch Methods

Comparing the methane yields from hydrolysate pretreated at 170 °C and 140 °C for both real hydrolysates and synthetic hydrolysates at 20 gCOD/L, the AMPTS II gave lower methane yields compared to the syringe test method (Figure 4), and has also been reported lower than the German DIN standard method using eudiometers [56]. Hydrolysate pretreated at 170 °C had 7% higher methane yield in the syringe method (0.48 gCOD/gCOD) versus AMPTS II (0.45 gCOD/gCOD), while hydrolysate pretreated at 140 °C had 34% higher in syringe method (0.71 gCOD/gCOD) versus AMPTS II (0.53 gCOD/gCOD). The difference can be attributed to human error due to manual operation [57], while headspace gas concentration in syringe and microbiology of AD also can be affected due to change of temperature while removing incubated syringes from the temperature-controlled environment during measurement of gas [58]. The relative differences between the different feeds compared are similar for the two methods implying that both methods worked well for the comparisons in this study.

5. Conclusions

Hydrolysates of Norway spruce from hot water extract are a promising feed for anaerobic digestion and hydrothermal pretreatment conditions influence both methane production rates and yields. Higher pretreatment severity yielded higher concentrations of AD inhibitors. Despite having lower sugar content, hydrolysate pretreated at the lower temperature of 140 °C had 18% higher methane yield (0.53 gCOD/gCOD) than higher pretreatment temperature of 170 °C (0.45 gCOD/gCOD). Comparison of methane yield between real hydrolysate and synthetic hydrolysate showed that soluble lignin and inhibitors (furans) had a significant effect on methane yield. Synthetic hydrolysate had 87% and 58% higher methane yields than hydrolysates prepared at 170 °C and 140 °C, respectively. Negative correlation was observed between methane yield and organic loadings (OLs) of the hydrolysates prepared at both temperatures. The higher organic loadings were found to cause the most stress initially, assumed to be mainly due to inhibition of the methane production, but all batch reactors eventually recovered with reasonably high final methane yields. This implies that these substrates can be utilized safely in continuous flow industrial AD with well adapted cultures where large, abrupt organic load changes are avoided.

Author Contributions

Conceptualization, N.G. and W.H.B.; methodology, N.G.; validation, N.G.; formal analysis, N.G. and W.H.B.; investigation, N.G. and W.H.B.; data curation, N.G.; writing—original draft preparation, N.G.; writing—review and editing, N.G., W.H.B. and R.B.; supervision, W.H.B. and R.B.; funding acquisition, R.B. All authors have read and agreed to the published version of the manuscript.

Funding

This research is done as a part of Norske skog innovation project Pyrogas co-funded by The Norwegian research council (EnergyX programme; Project number: 269322).

Acknowledgments

The authors would like to thank RISE PFI AS, Trondheim for the hydrolysates preparation and sugars, furfural and HMF content analysis. The authors like to thank Zahra Nikbakht Kenarsari and Jitendra Sah for the good cooperation while carrying out the experiment.

Conflicts of Interest

The authors declare no conflict of interest.

References

  1. Koppram, R.; Albers, E.; Olsson, L. Evolutionary engineering strategies to enhance tolerance of xylose utilizing recombinant yeast to inhibitors derived from spruce biomass. Biotechnol. Biofuels 2012, 5, 32. [Google Scholar] [CrossRef] [PubMed] [Green Version]
  2. Monlau, F.; Sambusiti, C.; Barakat, A.; Quemeneur, M.; Trably, E.; Steyer, J.P.; Carrere, H. Do furanic and phenolic compounds of lignocellulosic and algae biomass hydrolyzate inhibit anaerobic mixed cultures? A comprehensive review. Biotechnol. Adv. 2014, 32, 934–951. [Google Scholar] [CrossRef] [PubMed]
  3. Saha, B.C.; Yoshida, T.; Cotta, M.A.; Sonomoto, K. Hydrothermal pretreatment and enzymatic saccharification of corn stover for efficient ethanol production. Ind. Crop. Prod. 2013, 44, 367–372. [Google Scholar] [CrossRef]
  4. Garrote, G.; Dominguez, H.; Parajo, J.C. Hydrothermal processing of lignocellulosic material. Holz Als Roh Und Werkst. 1999, 57, 191–202. [Google Scholar] [CrossRef]
  5. Gullón, P.; Romaní, A.; Vila, C.; Garrote, G.; Parajó, J.C. Potential of hydrothermal treatments in lignocellulose biorefineries. Biofuels Bioprod. Biorefining 2012, 6, 219–232. [Google Scholar] [CrossRef]
  6. Nitsos, C.K.; Matis, K.A.; Triantafyllidis, K.S. Optimization of hydrothermal pretreatment of lignocellulosic biomass in the bioethanol production process. ChemSusChem 2013, 6, 110–122. [Google Scholar] [CrossRef]
  7. Mosier, N.; Wyman, C.; Dale, B.; Elander, R.; Lee, Y.Y.; Holtzapple, M.; Ladisch, M. Features of promising technologies for pretreatment of lignocellulosic biomass. Bioresour. Technol. 2005, 96, 673–686. [Google Scholar] [CrossRef]
  8. Kaparaju, P.; Serrano, M.; Angelidaki, I. Effect of reactor configuration on biogas production from wheat straw hydrolysate. Bioresour. Technol. 2009, 100, 6317–6323. [Google Scholar] [CrossRef]
  9. Yang, L.; Xu, F.; Ge, X.; Li, Y. Challenges and strategies for solid-state anaerobic digestion of lignocellulosic biomass. Renew. Sustain. Energy Rev. 2015, 44, 824–834. [Google Scholar] [CrossRef]
  10. Liu, S. A synergetic pretreatment technology for woody biomass conversion. Appl. Energy 2015, 144, 114–128. [Google Scholar] [CrossRef]
  11. López González, L.M.; Pereda Reyes, I.; Dewulf, J.; Budde, J.; Heiermann, M.; Vervaeren, H. Effect of liquid hot water pre-treatment on sugarcane press mud methane yield. Bioresour. Technol. 2014, 169, 284–290. [Google Scholar] [CrossRef]
  12. Barakat, A.; Monlau, F.; Steyer, J.P.; Carrere, H. Effect of lignin-derived and furan compounds found in lignocellulosic hydrolysates on biomethane production. Bioresour. Technol. 2012, 104, 90–99. [Google Scholar] [CrossRef] [PubMed]
  13. Li, Q.; Qiao, W.; Wang, X.; Takayanagi, K.; Shofie, M.; Li, Y.Y. Kinetic characterization of thermophilic and mesophilic anaerobic digestion for coffee grounds and waste activated sludge. Waste Manag. 2015, 36, 77–85. [Google Scholar] [CrossRef] [PubMed]
  14. Lier, J.B.v.; Grolle, K.C.F.; Frijters, C.T.M.J.; Stams, A.J.M.; Lettinga, G. Effects of Acetate, Propionate, and Butyrate on the Thermophilic Anaerobic Degradation of Propionate by Methanogenic Sludge and Defined Cultures. Appl. Environ. Microbiol. 1993, 59, 1003–1011. [Google Scholar] [CrossRef] [Green Version]
  15. Dinsdale, R.M.; Hawkes, F.R.; Hawkes, D.L. Mesophilic and thermophilic anaerobic digestion with thermophilic pre-acidification of instant-coffee-production wastewater. Water Res. 1997, 31, 1931–1938. [Google Scholar] [CrossRef]
  16. Nges, I.A.; Liu, J. Effects of solid retention time on anaerobic digestion of dewatered-sewage sludge in mesophilic and thermophilic conditions. Renew. Energy 2010, 35, 2200–2206. [Google Scholar] [CrossRef]
  17. Hashimoto, A.G. Effect of Inoculum by Substrate Ratio on methane yield and production rate from straw. Biol. Wastes 1989, 28, 247–255. [Google Scholar] [CrossRef]
  18. Feng, L.; Li, Y.; Chen, C.; Liu, X.; Xiao, X.; Ma, X.; Zhang, R.; He, Y.; Liu, G. Biochemical methane potential (BMP) of vinegar residue and the influence of feed to inoculum ratios on biogas production. Bioresources 2013, 8, 2487–2498. [Google Scholar] [CrossRef]
  19. Baeta, B.E.; Lima, D.R.; Adarme, O.F.; Gurgel, L.V.; Aquino, S.F. Optimization of sugarcane bagasse autohydrolysis for methane production from hemicellulose hydrolyzates in a biorefinery concept. Bioresour. Technol. 2016, 200, 137–146. [Google Scholar] [CrossRef] [PubMed]
  20. Costa, A.G.; Pinheiro, G.C.; Pinheiro, F.G.C.; Dos Santos, A.B.; Santaella, S.T.; Leitão, R.C. The use of thermochemical pretreatments to improve the anaerobic biodegradability and biochemical methane potential of the sugarcane bagasse. Chem. Eng. J. 2014, 248, 363–372. [Google Scholar] [CrossRef]
  21. Kaparaju, P.; Serrano, M.; Thomsen, A.B.; Kongjan, P.; Angelidaki, I. Bioethanol, biohydrogen and biogas production from wheat straw in a biorefinery concept. Bioresour. Technol. 2009, 100, 2562–2568. [Google Scholar] [CrossRef] [PubMed]
  22. Overend, R.P.; Chornet, E. Fractionation of lignocellulosics by steam-aqueous pretreatments. Philos. Trans. R. Soc. A 1987, 321, 523–536. [Google Scholar]
  23. Nitsos, C.K.; Choli-Papadopoulou, T.; Matis, K.A.; Triantafyllidis, K.S. Optimization of Hydrothermal Pretreatment of Hardwood and Softwood Lignocellulosic Residues for Selective Hemicellulose Recovery and Improved Cellulose Enzymatic Hydrolysis. ACS Sustain. Chem. Eng. 2016, 4, 4529–4544. [Google Scholar] [CrossRef]
  24. Baeta, B.E.; Luna, H.J.; Sanson, A.L.; Silva, S.Q.; Aquino, S.F. Degradation of a model azo dye in submerged anaerobic membrane bioreactor (SAMBR) operated with powdered activated carbon (PAC). J. Environ. Manag. 2013, 128, 462–470. [Google Scholar] [CrossRef] [Green Version]
  25. Stromberg, S.; Nistor, M.; Liu, J. Towards eliminating systematic errors caused by the experimental conditions in Biochemical Methane Potential (BMP) tests. Waste Manag. 2014, 34, 1939–1948. [Google Scholar] [CrossRef]
  26. Badshah, M.; Lam, D.M.; Liu, J.; Mattiasson, B. Use of an Automatic Methane Potential Test System for evaluating the biomethane potential of sugarcane bagasse after different treatments. Bioresour. Technol. 2012, 114, 262–269. [Google Scholar] [CrossRef]
  27. Ostgaard, K.; Kowarz, V.; Shuai, W.; Henry, I.A.; Sposob, M.; Haugen, H.H.; Bakke, R. Syringe test screening of microbial gas production activity: Cases denitrification and biogas formation. J. Microbiol. Methods 2017, 132, 119–124. [Google Scholar] [CrossRef] [PubMed]
  28. Raposo, F.; De la Rubia, M.A.; Fernández-Cegrí, V.; Borja, R. Anaerobic digestion of solid organic substrates in batch mode: An overview relating to methane yields and experimental procedures. Renew. Sustain. Energy Rev. 2012, 16, 861–877. [Google Scholar] [CrossRef]
  29. Li, Y.; Hua, D.; Zhang, J.; Gao, M.; Zhao, Y.; Xu, H.; Liang, X.; Jin, F.; Zhang, X. Influence of inoculum to substrate ratios (ISRs) on the performance of anaerobic digestion of algal residues. Ann. Microbiol. 2013, 64, 955–960. [Google Scholar] [CrossRef]
  30. Shin, J.; Jang, H.M.; Shin, S.G.; Kim, Y.M. Thermophilic anaerobic digestion: Effect of start-up strategies on performance and microbial community. Sci. Total Environ. 2019, 687, 87–95. [Google Scholar] [CrossRef]
  31. APHA; Water Environment Federation; American Water Works Association. Standard Methods for the Examination of Water and Wastewater; American Public Health Association: Washington, DC, USA, 1998. [Google Scholar]
  32. Sluiter, A.; Hames, B.; Ruiz, R.; Scarlata, C.; Sluiter, J.; Templeton, D.; Crocker, D. Determination of structural carbohydrates and lignin in biomass. Lab. Anal. Proced. 2008, 1617, 1–16. [Google Scholar]
  33. Chi, C.; Zhang, Z.; Chang, H.-m.; Jameel, H. Determination of Furfural and Hydroxymethylfurfural Formed From Biomass Under Acidic Conditions. J. Wood Chem. Technol. 2009, 29, 265–276. [Google Scholar] [CrossRef]
  34. Bergland, W.H.; Dinamarca, C.; Toradzadegan, M.; Nordgard, A.S.; Bakke, I.; Bakke, R. High rate manure supernatant digestion. Water Res. 2015, 76, 1–9. [Google Scholar] [CrossRef] [PubMed] [Green Version]
  35. Zwietering, M.H.; Jongenburger, I.; Rombouts, F.M.; van’t Riet, K. Modeling of the bacterial growth curve. Appl. Environ. Microbiol. 1990, 56, 1875–1881. [Google Scholar] [CrossRef] [Green Version]
  36. He, L.; Huang, H.; Zhang, Z.; Lei, Z.; Lin, B.-L. Energy Recovery from Rice Straw through Hydrothermal Pretreatment and Subsequent Biomethane Production. Energy Fuels 2017, 31, 10850–10857. [Google Scholar] [CrossRef]
  37. Wang, Y.; Zhang, Y.; Wang, J.; Meng, L. Effects of volatile fatty acid concentrations on methane yield and methanogenic bacteria. Biomass Bioenergy 2009, 33, 848–853. [Google Scholar] [CrossRef]
  38. Horn, S.J.; Estevez, M.M.; Nielsen, H.K.; Linjordet, R.; Eijsink, V.G. Biogas production and saccharification of Salix pretreated at different steam explosion conditions. Bioresour. Technol. 2011, 102, 7932–7936. [Google Scholar] [CrossRef]
  39. Razavi, A.S.; Hosseini Koupaie, E.; Azizi, A.; Hafez, H.; Elbeshbishy, E. Hydrothermal pretreatment of source separated organics for enhanced solubilization and biomethane recovery. Bioresour. Technol. 2019, 274, 502–511. [Google Scholar] [CrossRef]
  40. Leppänen, K.; Spetz, P.; Pranovich, A.; Hartonen, K.; Kitunen, V.; Ilvesniemi, H. Pressurized hot water extraction of Norway spruce hemicelluloses using a flow-through system. Wood Sci. Technol. 2010, 45, 223–236. [Google Scholar] [CrossRef]
  41. Koyama, M.; Yamamoto, S.; Ishikawa, K.; Ban, S.; Toda, T. Inhibition of anaerobic digestion by dissolved lignin derived from alkaline pre-treatment of an aquatic macrophyte. Chem. Eng. J. 2017, 311, 55–62. [Google Scholar] [CrossRef]
  42. Rättö, M.; Siika-aho, M.; Buchert, J.; Valkeajävi, A.; Viikari, L. Enzymatic hydrolosis of isolated and fibre-bound galactoglucomannans from pine-wood and pine kraft pulp. Appl. Microbiol. Biotechnol. 1993, 40, 449–454. [Google Scholar] [CrossRef]
  43. Cai, C.M.; Zhang, T.; Kumar, R.; Wyman, C.E. Integrated furfural production as a renewable fuel and chemical platform from lignocellulosic biomass. J. Chem. Technol. Biotechnol. 2014, 89, 2–10. [Google Scholar] [CrossRef]
  44. Ghasimi, D.S.M.; Aboudi, K.; de Kreuk, M.; Zandvoort, M.H.; van Lier, J.B. Impact of lignocellulosic-waste intermediates on hydrolysis and methanogenesis under thermophilic and mesophilic conditions. Chem. Eng. J. 2016, 295, 181–191. [Google Scholar] [CrossRef]
  45. Mussatto, S.I.; Roberto, I.C. Alternatives for detoxification of diluted-acid lignocellulosic hydrolyzates for use in fermentative processes: A review. Bioresour. Technol. 2004, 93, 1–10. [Google Scholar] [CrossRef]
  46. Leven, L.; Eriksson, A.R.; Schnurer, A. Effect of process temperature on bacterial and archaeal communities in two methanogenic bioreactors treating organic household waste. FEMS Microbiol. Ecol. 2007, 59, 683–693. [Google Scholar] [CrossRef] [PubMed]
  47. Li, Y.F.; Nelson, M.C.; Chen, P.H.; Graf, J.; Li, Y.; Yu, Z. Comparison of the microbial communities in solid-state anaerobic digestion (SS-AD) reactors operated at mesophilic and thermophilic temperatures. Appl. Microbiol. Biotechnol. 2015, 99, 969–980. [Google Scholar] [CrossRef] [PubMed]
  48. Taherzadeh, M.J.; Gustafsson, L.; Niklasson, C.; Lidén, G. Conversion of furfural in aerobic and anaerobic batch fermentation of glucose by Saccharomyces cerevisiae. J. Biosci. Bioeng. 1999, 87, 169–174. [Google Scholar] [CrossRef]
  49. Jimenez, S.; Cartagena, M.C.; Arce, A. Influence of lignin on the methanization of lignocellulosic wastes. Biomass 1990, 21, 43–54. [Google Scholar] [CrossRef]
  50. Benner, R.; Maccubbin, A.; Hodson, R.E. Anaerobic biodegradation of the lignin and polysaccharide components of lignocellulose and synthetic lignin by sediment microflora. Appl. Env. Microbiol. 1984, 47, 998–1004. [Google Scholar] [CrossRef] [Green Version]
  51. Hendriks, A.T.; Zeeman, G. Pretreatments to enhance the digestibility of lignocellulosic biomass. Bioresour. Technol. 2009, 100, 10–18. [Google Scholar] [CrossRef]
  52. Teghammar, A.; Yngvesson, J.; Lundin, M.; Taherzadeh, M.J.; Horváth, I.S. Pretreatment of paper tube residuals for improved biogas production. Bioresour. Technol. 2010, 101, 1206–1212. [Google Scholar] [CrossRef] [PubMed]
  53. Kafle, G.K.; Kim, S.H.; Sung, K.I. Ensiling of fish industry waste for biogas production: A lab scale evaluation of biochemical methane potential (BMP) and kinetics. Bioresour. Technol. 2013, 127, 326–336. [Google Scholar] [CrossRef] [PubMed]
  54. Gong, C.S.; Cao, N.J.; Du, J.; Tsao, G.T. Ethanol production from renewable resources. Adv. Biochem. Eng. Biotechnol. 1999, 65, 207–241. [Google Scholar]
  55. Li, W.; Khalid, H.; Zhu, Z.; Zhang, R.; Liu, G.; Chen, C.; Thorin, E. Methane production through anaerobic digestion: Participation and digestion characteristics of cellulose, hemicellulose and lignin. Appl. Energy 2018, 226, 1219–1228. [Google Scholar] [CrossRef]
  56. Kleinheinz, G.; Hernandez, J. Comparison of two laboratory methods for the determination of biomethane potential of organic feedstocks. J. Microbiol. Methods 2016, 130, 54–60. [Google Scholar] [CrossRef] [PubMed]
  57. Koch, K.; Hafner, S.D.; Weinrich, S.; Astals, S. Identification of Critical Problems in Biochemical Methane Potential (BMP) Tests From Methane Production Curves. Front. Environ. Sci. 2019, 7, 178. [Google Scholar] [CrossRef]
  58. Parajuli, P. Biogas Measurement Techniques and the Associated Errors. Master’s Thesis, University of Jyväskylä, Jyväskylä, Finland, 2011. [Google Scholar]
Figure 1. Cumulative methane yield of hydrolysate pretreated at 140 °C and 170 °C from AMPTS II fitted with modified Gompertz law.
Applsci 10 04989 g001
Figure 2. Methane yield of H170 under thermophilic condition under different organic loadings (OLs).
Applsci 10 04989 g002
Figure 3. Methane yield of H140 under thermophilic condition under different OLs.
Applsci 10 04989 g003
Figure 4. Methane yield in syringes for both hydrolysates at varying OLs. Yields from AMPTS II are added for comparison.
Applsci 10 04989 g004
Figure 5. Methane content of H170 at different OLs over time in syringes.
Applsci 10 04989 g005
Figure 6. Methane content of H140 at different OLs over time in syringes.
Applsci 10 04989 g006
Table 1. Severity factor for the hydrolysates from HWE.
Hydrolysate SamplesHydrothermal Pretreatment ConditionsSeverity Factor (log(R0))
Temperature (°C)Time (min)
H170170904.02
H1401403003.65
Table 2. Content of synthetic hydrolysates.
ParametersH170synH140syn
Soluble COD (gCODs/L)20.712.6
Arabinose (g/L)0.811.63
Galactose (g/L)2.171.67
Glucose (g/L)3.001.55
Xylose (g/L)2.241.95
Mannose (g/L)10.395.11
Acetic acid (g/L)1.030.59
pH3.073.14
Table 3. Organic loading (OL) of AMPTS II-fed hydrolysates and synthetic hydrolysates.
SampleInoculum (mL)Substrate (mL)OL (gCODt/L)
H17024016020
H14020020020
H170syn20020020
H140syn16024020
Control (Blank)240160 (distilled water)NA
NA: Not applicable.
Table 4. Organic loading (OL) of batch syringes fed HWE hydrolysates.
SampleInoculum (mL)Substrate (mL)OL (g CODt/L)
H1701536
H17015510
H170151020
H170151530
H1401546
H140156.710
H1401513.420
H140152030
Control (Blank)1510 (distilled water)NA
NA: Not applicable.
Table 5. Various analysis carried out during the experiment using different instruments.
AnalysisInstruments UsedReferences
Biogas compositionSRI gas chromatography (model 8610C)[34]
VFA concentrationsGas chromatography HP 6890 serial C (Hewlett Packard)[34]
CODCommercial kits (WTW™)[31]
pHWTW inolab pH7110
Carbohydrate compositionDionex ICS500 HPLC (ThermoFisher Scientific)[32]
Furfural and HMFUV 1800 from Shimadzu[33]
Table 6. Characteristics of hydrolysate pretreated at 140 °C and 170 °C (Average values ± standard deviation (n, number of samples)).
ParametersH170H140
Total COD (gCODt/L)30.7 ± 1.7 (41)22.3 ± 1.6 (66)
Soluble COD (gCODs/L)26.9 ± 2.6 (41)20.0 ± 1.9 (66)
Acetic acid (g/L)1.0 ± 0.2 (8)0.6 ± 0.1 (14)
pH 3.7 ± 0.1 (2)3.8 ± 0 (2)
Furfural (g/L)0.9 ± 0.02 (2)0.2 ± 0.01 (2)
5-Hydroxy methyl furfural (g/L)0.5 ± 0.01 (2)0.2 ± 0.01 (2)
Arabinose (g/L)0.8 ± 0.003 (2)1.6 ± 0.02 (2)
Galactose (g/L)2.2 ± 0.01 (2)1.7 ± 0.05 (2)
Glucose (g/L)3.0 ± 0.01 (2)1.6 ± 0.05 (2)
Xylose (g/L)2.2 ± 0.02 (2)2 ± 0.04 (2)
Mannose (g/L)10.4 ± 0.02 (2)5.1 ± 0.1 (2)
Total sugars (g/L)18.6 ± 0.01 (2)11.9 ± 0.3 (2)
Table 7. Initial pH values and effluent characteristics at the end of AMPTS II experiments.
SamplesInitial pHEnd pHEnd CODs
(mg/L)
End Acetic Acid
(mg/L)
End Propionic Acid
(mg/L)
End Total VFA
(mg/L)
Methane Yield
(gCOD/gCOD)
H17077.97 ± 0.065780 ± 20097 ± 22112 ± 30221 ± 420.45 ± 0.01
H14078.00 ± 0.044730 ± 3067 ± 836 ± 7103 ± 60.53 ± 0
H170syn77.77 ± 0.052490 ± 12015 ± 4015 ± 40.84 ± 0.01
H140syn77.73 ± 0.051970 ± 12015 ± 7015 ± 70.84 ± 0.01
Table 8. Regression results of cumulative biogas yield with the modified Gompertz model.
SamplesG0 (NmL CH4 gCOD −1)Rmax (NmL CH4 Gcod −1Day−1)λ (Days)R2Cumulative Methane Yield (NmL gCOD−1)
H170168.034.00.40.962162
H140187.499.80.30.962189
H170syn302.942.20.80.960285
H140syn295.260.10.60.960295
Table 9. Weighted average methane content in the produced biogas in syringes.
OL (gCOD/L)H170H140
673.3 ± 0.370.1 ± 0.4
1069.4 ± 0.465.7 ± 0.1
2069.5 ± 0.866.4 ± 0.3
3068.2 ± 1.464.9 ± 0.8

