Abstract
A fast and highly sensitive polymer nano-mechanical thermal analysis method for determining the melting temperature (Tm) of polymer microwires was proposed. In this method, a small-size, low-cost quartz tuning fork was used as a piezoelectric transducer to analyze the thermodynamics of polymer microwires at the nanogram level without changing its own properties. Due to the thin wire sample, which has a length of 1.2 mm and a diameter of ~5 µm, which is bridged across the prongs of the tuning fork, the nanogram-level sample greatly reduces the thermal equilibrium time for the measurement, resulting in a fast analysis for the melting temperature of the polymer sample. Compared with the traditional method, the analysis method based on the quartz enhanced conductivity spectrum (QECS) does not require annealing before measurement, which is an essential process for conventional thermal analysis to reduce the hardness, refine the grain, and eliminate the residual stress. In this work, the melting temperatures of three of the most commonly used polymers, namely polymers polymethyl methacrylate, high-density polyethylene, and disproportionated rosin, were obtained under the temperature from room temperature to >180 °C, proving the QECS method to be a useful tool for nano-mechanical thermal analysis.
1. Introduction
The nanomechanics of polymer materials has become increasingly significant for advanced technological applications including the field of optics, electricity, acoustics, mechanics, and biomedicine [1]. In order to determine the mechanics of polymer materials, research using micro samples is a large challenge, especially in some special environments or experiments [2,3,4,5,6,7]. In 2016, Qi et al. presented a novel approach to achieve microscale stimuli-responsive deformation of Janus structures for polymer actuators [6]. In addition, nanogram-level biomaterials with a silk structure have also been widely applied in many fields such as tissue engineering, drug delivery, electronic, and optical devices [7,8,9,10].
The melting temperature (Tm), which is the temperature at which one material can coexist and balance in a solid–liquid two phase, is one of the basic parameters to characterize the physicochemical properties of a crystal [11,12]. The Tm of polymers is usually not a constant value since there are two factors that have a great impact on the Tm pressure and impurity [12]. Under a certain pressure, the temperature deviation from early fusion to the melt is not more than 0.5–1 °C [11,13]. However, the Tm will change while the material is mixed with impurities. Therefore, the Tm determination is also the basic means to identify material purity [12].
In the past decades, thermometry-based Tm determination has been developed and reported. Capillary melting point measurement is one of the conventional approaches to determine the Tm [14,15,16]. In this method, the powder samples are placed in the capillary tube with a temperature increment of 1 °C/min and the Tm corresponds to the temperature at which the powder samples in the tube begin to fall, and small droplets appear. Differential scanning calorimetry (DSC) is also an alternative and accurate technique for determining the Tm [17,18,19,20,21]. The samples are heated to 120 °C and the temperature is maintained for 2 h, then the nitrogen gas is passed over for dozens of minutes and a temperature increase rate at ~10 °C/min is kept until the waxes have melt. The endothermic peak is shown in the DSC curve, and the melting point of samples is obtained accordingly. Bian et al. measured the melting point and enthalpy of wax by means of the DSC method [18]. A polarized optical microscope (POM) was also used for Tm measurement of polymers [20,21,22]. With the light beam going into the crystal material, a double refraction phenomenon appears due to the anisotropy effect of the crystal. Heating the samples at a constant temperature rise rate, the melting of the sample and the disappearance of the birefringence phenomenon determines the Tm.
In this paper, we proposed a fast and convenient method to determine the polymer Tm based on a quartz tuning fork (QTF), which was characterized by the features of small volume but femto-Newton level force sensing [23,24]. Quartz is a kind of material which has low internal losses, therefore the Q factor of a QTF is extremely high, usually ~100,000 in vacuum and ~10,000 in the atmosphere [25,26,27,28,29,30]. The QTF can be used to detect the trace gas upon absorbing the excitation laser or to determine the inter-layer friction in multiwall carbon nanotubes [31,32,33,34,35,36,37,38,39,40,41,42]. Recently, quartz-enhanced conductance spectroscopy (QECS) based on a QTF was developed for analyzing the nanomechanical behaviors of polymers near the glass transition temperature [25]. In this work, the thermodynamics of three of the most commonly used polymers, namely, polymethyl methacrylate (PMMA), high-density polyethylene (HDPE), and disproportionated rosin (DPR) were analyzed in order to determine the Tm with the sample requirement of a few nanograms.
2. Experimental Section
The spring constant of a QTF can be given by
where is the Young’s modulus of the QTF prongs, t is the QTF thickness, w is the QTF width, and l is the QTF length [28]. The length, width, thickness, and prong spacing of the QTF are measured as 3.65 mm, 0.57 mm, 0.33 mm, and 0.29 mm, respectively. The resonance frequency of the QTF can be expressed in terms of fundamental material properties
where , . are the resonance frequency and effective mass of the QTF, respectively. Therefore, the effective . which was related to the QTF spring constant and the polymer microwire thermal dynamics can be calculated from the of polymer microwire modified QTF (MM-QTF). Loss modulus E″ is the metric of energy loss when material is deformed. E″ is proportional to the square of resonance frequency f and related to the inverse of the Q factor [25].
Resistance film heaters were used to melt the polymer powder samples quickly. A tungsten microwire with a diameter of ~10 μm was used to pull and form polymer microwires from polymer melt. The polymer microwire solidified quickly in the air as a conic shape with a diameter from ~15 µm (head) to ~4 µm (tail). The polymer microwires were transferred to the microscope and cut into pieces with different diameters. The polymer microwire was transferred across the prongs of a QTF by use of a three-dimensional translation stage. The photograph of MM-QTF under an optical microscope is shown in Figure 1.
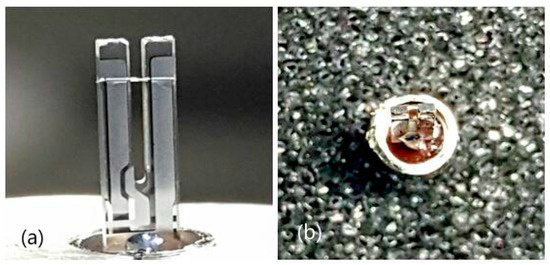
Figure 1.
Photograph of a quartz tuning fork (QTF) with polymer microwire bridged across its prongs under a 45× stereomicroscope: (a) front view, (b) top view.
A schematic diagram of the experimental setup is depicted in Figure 2. The MM-QTF was placed in a custom-made tri-prism heat cell made of stainless steel. Three side walls of the heat cell were heated by three resistance heating films, respectively.
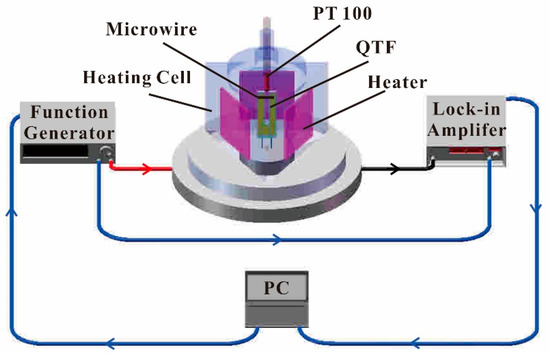
Figure 2.
Schematic of the experimental setup.
Based on the piezoelectric effect of the quartz crystal, the conductance spectroscopy of the MM-QTF in the cell was measured [25]. A function generator (Agilent 33210A) was used to generate a sinusoidal signal to excite the MM-QTF. The frequency of the sinusoidal signal applied to the QTF pin was scanned across the resonance frequency of the QTF, from 33,200 Hz to 33,550 Hz with a step increment of 1 Hz. The output current of the MM-QTF was firstly converted into voltage by a custom-made preamplifier with a feedback resistance of 10 MΩ (not shown in Figure 2), and then demodulated by a lock-in amplifier (Stanford Research System model SR830) working in 1f mode [31,43]. The time constant and the slope of the lock-in amplifier was 1 s and 12 dB/octave, respectively, resulting in a detection bandwidth of 0.25 Hz. The output signal of the lock-in amplifier was recorded by a personal computer (PC). The conductance spectroscopy of the MM-QTF in the frequency scanning range was acquired. The resonance frequency and Q factor of the MM-QTF can be obtained by fitting the square of the conductance spectra to a Lorenz curve.
3. Results
The conductance spectra of the QTF in the vacuum sealed metal shell, in the air as well as modified by PMMA microwire, were measured at room temperature, respectively. The obtained conductance spectra as a function of frequencies are shown in Figure 3. The corresponding resonance frequencies, Q factors, and equivalent resistances of the QTFs calculated from Lorentz curve fitting are listed in Table 1. The resonance frequency of the QTF decreased from 32,764.3 Hz to 32,758.9 Hz and the Q factor reduced from 73,131 to 13,537 after the removal of the metal shell. This is due to the dampening effect caused by air. However, when the PMMA microwire with a diameter of ~5 μm was bridged across the QTF prongs, the resonance frequency of the MM-QTF increased to 33,362.2 Hz with a frequency shift Δf of ~603 Hz. The resonance increasing, instead of decreasing, indicated that the bridged microwire had a comparable spring constant with the QTF and was able to resonate efficiently with the QTF [25,44]. The Q factor of a resonator represents the ratio of stored to dissipated energy per cycle. The Q factor of the QTF decreased from 13,537 to 920 resulting from the damping caused by the PMMA microwire, suggesting that the energy dissipating rate increases.
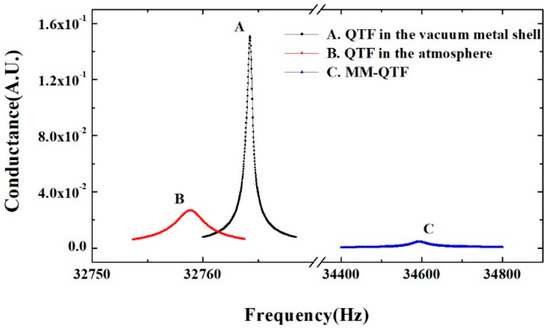
Figure 3.
Conductance spectroscopy of QTF in the vacuum sealed metal shell (squares), QTF in the air (diamond), and QTF modified by polymethyl methacrylate (PMMA) microwire (triangle), respectively.

Table 1.
The QTF parameters obtained by conductance spectroscopy.
In the measurement, the tri-prism cell was heated from room temperature (~28 °C) to over 180 °C. As shown in Figure 4a, the resonance frequency of MM-QTF decreased monotonically from 33,362.2 Hz to 32,825.2 Hz, yielding a frequency shift Δf of 463 Hz. This is attributed to the PMMA polymer chain segments’ rearrangement when the temperature changes. The curve showed an abrupt plummet at T ~180.5 °C, which corresponds to the sudden change in the QTF effective spring constant according to Equation (2). The inset of Figure 4a shows the resonance frequency of an unmodified QTF kept constant as a comparison, indicating that the large frequency shift was caused by the spring constant variation of the polymer microwire.
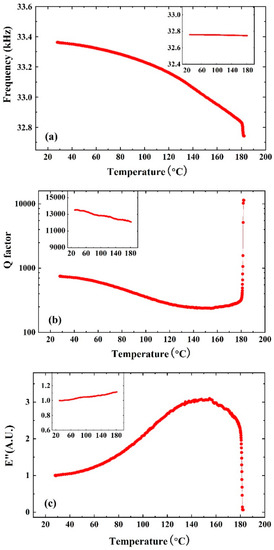
Figure 4.
(a) The resonance frequency, (b) Q factor, and (c) loss modulus variations of PMMA MM-QTF as a function of temperature. The figure insets show the parameter variation of QTF without modification.
Figure 4b shows the Q factor of the PMMA MM-QTF as a function of temperature. The Q factor showed a valley around 150 °C corresponding to the glass transition behavior. However, there was a steep jump of the Q factor from 346 to 11,440 around 180.5 °C, which revealed a sudden decrease in the energy dissipation rate. The inset of Figure 4b shows the Q factor of the QTF without modification by the PMMA microwire. The Q factor of bare QTF monotonously decreased slightly from 13,537 to 12,098.
The loss modulus E″ is proportional to the ratio of the square of resonance frequency to the Q factor [25]. Figure 4c shows the E″ variations of a PMMA MM-QTF with temperature. The E″ increased to the maximum value E″max near the glass transition and then began to decrease due to the polymer chains’ rearrangement. When the temperature of the material is lower than T (E″max), the polymer is in a glassy state and exhibits plasticity, and when the temperature is higher than T (E″max), the material is in a highly elastic state and exhibits elasticity, where T (E″max) is the temperature corresponding to the maximum loss modulus E″max. The loss modulus E″ plummeted at 180.5 °C, indicating the sudden modulus change of the MM-QTF. This is powerful evidence that the microwire bridged across the pongs of QTF began to melt. The polymer microwire was observed to be broken under the microscope at 180.5 >°C. The inset of Figure 4c depicts the E″ of unmodified QTF, where the E″ increased monotonously.
The QTF modified by polymethyl methacrylate (PMMA), disproportionated rosin (DPR), and high-density polyethylene (HDPE), was measured as the function of temperature in order to determine the Tm. As shown in Figure 5, there is an obvious inflection point on each curve, which means the polymer microwire started to melt. Three vertical lines were made through the inflection point of the curve, indicating that the melting points Tm of the used DPR, PMMA, and HDPE microwires were 112.5 °C, 180.5 °C, and 137.6 °C, respectively. Additionally, the measurement error of ±1 °C was estimated due to the uncertainty in the actual temperature of the microwires. According to the literature [45,46,47,48,49], the melting temperatures of DPR, PMMA, and HDPE were proven to be about 114 °C, 180 °C, and 139 °C under similar conditions. The consistency with the melting temperature measured by conventional comparative methods showed the feasibility of the QECS.
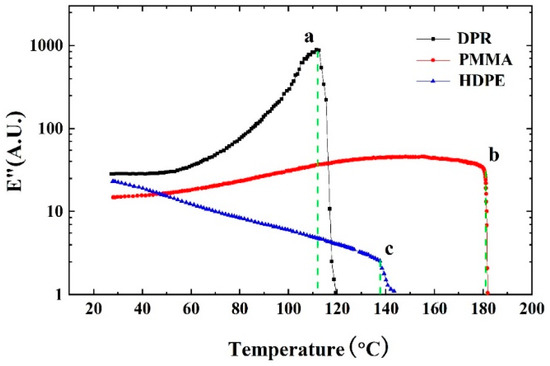
Figure 5.
E″ of disproportionated rosin (DPR), polymethyl methacrylate (PMMA), and high-density polyethylene (HDPE) microwire modified QTF as a function of temperature.
4. Conclusions
In summary, a fast and highly sensitive method for polymer nanomechanical thermal analysis was developed based on a commercially available QTF which costs less than one dollar. The advantage of the new method compared with a conventional instrument is that the required mass of the polymer was only a few nanograms. The nanogram level samples greatly reduced the thermal equilibrium time for the measurement, making the new method a fast analysis tool. Sample pretreatment for the new method is also easier, because no annealing treatment is required before the measurement, which is an essential process for conventional thermal analysis to reduce the hardness, refine the grain, and eliminate the residual stress. Compared to micro-cantilevers or other optical measurement methods, QTF has the advantage of self-sensing; the resonance frequency and Q factor can be directly read out by means of its electrical conductance spectroscopy with respect to the frequency of the external excitation source and therefore no optical beam is required. Along with the resonance frequency and Q factor, the equivalent inductance and resistance of a MM-QTF can be simultaneously acquired from the conductance spectroscopy. Further improvement can be made by bridging two or more polymer microwires across the QTF prongs to analyze the thermodynamics of multiple kinds of materials simultaneously.
Author Contributions
S.L. and L.D. performed the experiments and wrote the manuscript; B.S., Z.S., and B.L. analyzed the data; R.C., H.W., and L.D. reviewed and edited the manuscript. All authors have read and agreed to the published version of the manuscript.
Funding
This research was supported by the National Natural Science Foundation of China (NSFC) (61805132, 11434007), the National Key R&D Program of China (2017YFA0304203), Changjiang Scholars and Innovative Research Team at the University of Ministry of Education of China (IRT_17R70), 111 project (D18001), Outstanding Innovative Teams of Higher Learning Institutions of Shanxi, Foundation for Selected Young Scientists Studying Abroad, Sanjin Scholar (2017QNSJXZ- 04), Applied basic research program of Shanxi Province (201801D221174), Scientific and Technological Innovation Programs of Higher Education Institutions In Shanxi (2019L0028), and Shanxi “1331KSC”.
Acknowledgments
We thank Huadan Zheng and Tingting Wei for valuable discussions.
Conflicts of Interest
The authors declare no conflicts of interest.
References
- Jackson, N.; Dhir, R.K. Coarser- and Finer-grained Soils. Macmillan Educ. UK 1996, 367–372. [Google Scholar]
- Moller, K.; Bein, T.; Fischer, R.X. Entrapment of PMMA polymer strands in micro-and mesoporous materials. Chem. Mater. 1998, 10, 1841–1852. [Google Scholar] [CrossRef]
- Nunes, J.K.; Ertas, M.; Du, L.; DeSimone, J.M. Hierarchical control of polymer composite nano-and micro-structure with lithography. Chem. Mater. 2010, 22, 4069–4075. [Google Scholar] [CrossRef]
- Tu, S.; Wang, B.; Chen, Y.; Li, Z.; Luo, X. Polymeric Nanocubes Spontaneously Formed from Poly(ε-caprolactone). ACS Macro Lett. 2012, 1, 933–936. [Google Scholar] [CrossRef]
- Bose, S.; Schmid, S.; Larsen, T.; Keller, S.S.; Sommer-Larsen, P.; Boisen, A.; Almdal, K. Micromechanical string resonators: Analytical tool for thermal characterization of polymers. ACS Macro Lett. 2013, 3, 55–58. [Google Scholar] [CrossRef]
- Qi, H.; Zhou, T.; Mei, S.; Chen, X.; Li, C.Y. Responsive shape change of sub-5 nm thin, Janus polymer nanoplates. ACS Macro Lett. 2016, 5, 651–655. [Google Scholar] [CrossRef]
- Huang, G.; Tian, L.; Liu, K.; Hu, B.; Xu, F.; Lu, T.; Naik, R.R.; Singamaneni, S. Elastoplastic deformation of silk micro-and nanostructures. ACS Biomater. Sci. Eng. 2016, 2, 893. [Google Scholar] [CrossRef]
- Rockwood, D.N.; Preda, R.C.; Yücel, T.; Wang, X.; Lovett, M.L.; Kaplan, D.L. Materials fabrication from Bombyx mori silk fibroin. Nat. Protocols. 2011, 6, 1612. [Google Scholar] [CrossRef]
- Porter, D.; Vollrath, F. Silk as a biomimetic ideal for structural polymers. Adv. Mater. 2009, 21, 487–492. [Google Scholar] [CrossRef]
- Hu, X.; Shmelev, K.; Sun, L.; Gil, E.S.; Park, S.H.; Cebe, P.; Kaplan, D.L. Regulation of silk material structure by temperature-controlled water vapor annealing. Biomacromolecules 2011, 12, 1686–1696. [Google Scholar] [CrossRef]
- Siavosh-Haghighi, A.; Thompson, D.L. Melting Point Determination from Solid−Liquid Coexistence Initiated by Surface Melting. J. Phys. Chem. C 2007, 111, 7980–7985. [Google Scholar] [CrossRef]
- Deman, J.M.; Deman, L.; Blackman, B. Melting-point determination of fat products. J. Am. Oil Chem. Soc. 1983, 60, 91–94. [Google Scholar] [CrossRef]
- Wunderlich, B.; Kashdan, W.H. Thermodynamics of crystalline linear high polymers. I. Comparison of the melting transitions of solution and melt-crystallized polyethylene. J. Polymer Sci. 1961, 50, 71–78. [Google Scholar] [CrossRef]
- Shvartsburg, A.A.; Jarrold, M.F. Solid clusters above the bulk melting point. Phys. Rev. Lett. 2000, 85, 2530. [Google Scholar] [CrossRef]
- Tubbs, R.K. Melting point and heat of fusion of poly (vinyl alcohol). J. Polymer Sci. 1965, 3, 4181–4189. [Google Scholar] [CrossRef]
- Zhang, Y.; Faghri, A. Melting of a subcooled mixed powder bed with constant heat flux heating. Int. J. Heat Mass Transfer. 1999, 42, 775–788. [Google Scholar] [CrossRef]
- Nassu, R.T.; Goncalves, L.A.G. Determination of melting point of vegetable oils and fats by differential scanning calorimetry (DSC) technique. Grasas Y Aceites. 1999, 50, 16–21. [Google Scholar] [CrossRef]
- Bian, W.; He, G. Measuring melting point and enthalpy of wax by DSC method. Chem. Eng. 2014, 42, 40–42. [Google Scholar]
- Berger, R.; Gerber, C.; Gimzewski, J.K.; Meyer, E.; Güntherodt, H.J. Thermal analysis using a micromechanical calorimeter. Appl. Phys. Lett. 1996, 69, 40–42. [Google Scholar] [CrossRef]
- Hamley, I.W.; Castelletto, V.; Castillo, R.V.; Müller, A.J.; Martin, C.M.; Pollet, E.; Dubois, P. Crystallization in Poly(L-lactide)-b-poly(ϵ-caprolactone) Double Crystalline Diblock Copolymers: A Study Using X-ray Scattering, Differential Scanning Calorimetry, and Polarized Optical Microscopy. Macromolecules 2005, 38, 463–472. [Google Scholar] [CrossRef]
- Zhang, L.; Xiong, C.; Deng, X. Miscibility, crystallization and morphology of poly (β-hydroxybutyrate)/poly (d, l-lactide) blends. Polymer 1996, 37, 235–241. [Google Scholar] [CrossRef]
- Blümm, E.; Owen, A.J. Miscibility, crystallization and melting of poly (3-hydroxybutyrate)/poly (L-lactide) blends. Polymer 1995, 36, 4077–4081. [Google Scholar] [CrossRef]
- Barbic, M.; Eliason, L.; Ranshaw, J. Femto-Newton force sensitivity quartz tuning fork sensor. Sens. Actuators. 2007, 136, 564–566. [Google Scholar] [CrossRef]
- Otero, J.; Gonzalez, L.; Puig-Vidal, M. Nanocharacterization of soft biological samples in shear mode with quartz tuning fork probes. Sensors 2012, 12, 4803–4819. [Google Scholar] [CrossRef] [PubMed]
- Zheng, H.; Yin, X.; Zhang, G.; Dong, L.; Wu, H.; Liu, X.; Ma, W.; Zhang, L.; Yin, W.; Xiao, L.; et al. Quartz-enhanced conductance spectroscopy for nanomechanical analysis of polymer wire. Appl. Phys. Lett. 2015, 107, 221903. [Google Scholar] [CrossRef]
- Ma, Y.; Qiao, S.; Patimisco, P.; Sampaolo, A.; Wang, Y.; Tittel, F.K.; Spagnolo, V. In-plane quartz-enhanced photoacoustic spectroscopy. Appl. Phys. Lett. 2020, 116, 061101. [Google Scholar] [CrossRef]
- Yin, X.; Dong, L.; Zheng, H.; Liu, X.; Wu, H.; Yang, Y.; Ma, W.; Zhang, L.; Yin, W.; Xiao, L.; et al. Impact of humidity on quartz-enhanced photoacoustic spectroscopy based CO detection using a near-IR telecommunication diode laser. Sensors 2016, 16, 162. [Google Scholar] [CrossRef]
- Weidmann, D.; Kosterev, A.A.; Tittel, F.K.; Ryan, N.; McDonald, D. Application of a widely electrically tunable diode laser to chemical gas sensing with quartz-enhanced photoacoustic spectroscopy. Opt. Lett. 2004, 29, 1837–1839. [Google Scholar] [CrossRef]
- Chen, K.; Zhang, B.; Guo, M.; Chen, Y.; Deng, H.; Yang, B.; Liu, S.; Ma, F.; Zhu, F.; Gong, Z.; et al. Photoacoustic trace gas detection of ethylene in high-concentration methane background based on dual light sources and fiber-optic microphone. Sens. Actuators B Chem. 2020, 310, 127825. [Google Scholar] [CrossRef]
- Becker, P.M.; Olsson, A.A.; Simpson, J.R. Erbium-Doped Fiber Amplifiers: Fundamentals and Technology; Academic Press: San Diego, CA, USA, 1999. [Google Scholar]
- Wu, H.; Dong, L.; Zheng, H.; Liu, X.; Yin, X.; Ma, W.; Zhang, L.; Yin, W.; Jia, S.; Tittel, F.K. Enhanced near-infrared QEPAS sensor for sub-ppm level H2S detection by means of a fiber amplified 1582 nm DFB laser. Sens. Actuators B Chem. 2015, 221, 666–672. [Google Scholar] [CrossRef]
- Zheng, H.; Dong, L.; Liu, X.; Liu, Y.; Wu, H.; Ma, W.; Zhang, L.; Yin, W.; Jia, S. Near-IR telecommunication diode laser based double-pass QEPAS sensor for atmospheric CO2 detection. Laser Phys. 2015, 25, 125601. [Google Scholar] [CrossRef]
- Chen, K.; Zhang, B.; Liu, S.; Yu, Q. Parts-per-billion-level detection of hydrogen sulfide based on near-infrared all-optical photoacoustic spectroscopy. Sens. Actuators B Chem. 2019, 283, 1–5. [Google Scholar] [CrossRef]
- Kosterev, A.A.; Bakhirkin, Y.A.; Curl, R.F.; Tittel, F.K. Quartz-enhanced photoacoustic spectroscopy. Opt. Lett. 2002, 27, 1902–1904. [Google Scholar] [CrossRef]
- Dong, L.; Kosterev, A.A.; Thomazy, D.; Tittel, F.K. QEPAS spectrophones: Design, optimization, and performance. Appl. Phys. B 2010, 100, 627–635. [Google Scholar] [CrossRef]
- Dong, L.; Spagnolo, V.; Lewicki, R.; Tittel, F.K. Ppb-level detection of nitric oxide using an external cavity quantum cascade laser based QEPAS sensor. Opt. Express. 2011, 19, 24037–24045. [Google Scholar] [CrossRef]
- Kosterev, A.A.; Tittel, F.K.; Serebryakov, D.V.; Malinovsky, A.L.; Morozov, I.V. Applications of quartz tuning forks in spectroscopic gas sensing. Rev. Sci. Instrum. 2005, 76, 043105. [Google Scholar] [CrossRef]
- Liu, K.; Li, J.; Wang, L.; Tan, T.; Zhang, W.; Gao, X.; Chen, W.; Tittel, F.K. Trace gas sensor based on quartz tuning fork enhanced laser photoacoustic spectroscopy. Appl. Phys. B 2009, 94, 527–533. [Google Scholar] [CrossRef]
- Ma, Y.; Qiao, S.; He, Y.; Li, Y.; Zhang, Z.; Yu, X.; Tittel, F.K. Highly sensitive acetylene detection based on multi-pass retro-reflection-cavity-enhanced photoacoustic spectroscopy and a fiber amplified diode laser. Opt. Express. 2019, 27, 14163–14172. [Google Scholar] [CrossRef]
- Wu, H.; Dong, L.; Zheng, H.; Liu, Y.; Ma, W.; Zhang, L.; Wang, W.; Zhu, Q.; Yin, W.; Jia, S. Purity analysis of helium using quartz-enhanced photoacoustic spectroscopy with two non-resonant micro-tubes. Acta Phys. Sin. 2013, 62, 070701. [Google Scholar]
- Spagnolo, V.; Patimisco, P.; Borri, S.; Scamarcio, G.; Bernacki, B.E.; Kriesel, J. Mid-infrared fiber-coupled QCL-QEPAS sensor. Appl. Phys. B 2013, 112, 25–33. [Google Scholar] [CrossRef]
- Wysocki, G.; Kosterev, A.A.; Tittel, F.K. Influence of molecular relaxation dynamics on quartz-enhanced photoacoustic detection of CO2 at λ = 2 μm. Appl. Phys. 2006, 85, 301–306. [Google Scholar] [CrossRef]
- Schilt, S.; Kosterev, A.A.; Tittel, F.K. Performance evaluation of a near infrared QEPAS based ethylene sensor. Appl. Phys. B 2009, 95, 813–824. [Google Scholar] [CrossRef]
- Bontempi, A.; Nguyen, T.P.; Salut, R.; Thiery, L.; Teyssieux, D.; Vairac, P. Scanning thermal microscopy based on a quartz tuning fork and a micro-thermocouple in active mode (2ω method). Rev. Sci. Instrum. 2016, 87, 063702. [Google Scholar] [CrossRef]
- Qi, F.; Shang, S.; Gao, H.; Wang, D.; Wang, J. Current Application of Rosin and Modified Rosin in Fluxes. Biomass. Chem. Eng. 2014, 48, 56–61. [Google Scholar]
- Qi, F.; Cai, Z.; Shang, S.; Huang, X. Effects of Rosin and Modified Rosin on Welding Performance of Sn0.7Cu Solder. Chem. Ind. Forest Prod. 2015, 35, 53–57. [Google Scholar]
- Song, G.; Wang, H.; Wang, L.; Li, P. Optimization of Lubricant and Thermodynamic Property of HDPE-g-MAH Compatibilized HDPE/Wood Flour Composite. China. Plast. Ind. 2006, 34, 53–56. [Google Scholar]
- Jiang, B.; Yin, X.; Weng, C.; Wang, J. HDPE static non-isothermal crystallization in micro-injection molding process. J. Cent. South Univ. (Sci. Technol.) 2007, 38, 912–916. [Google Scholar]
- Wang, X.; Huang, Z. Melt-Electrospinning of Pmma. Chin. J. Polym. Sci. 2010, 28, 45–53. [Google Scholar] [CrossRef]
© 2020 by the authors. Licensee MDPI, Basel, Switzerland. This article is an open access article distributed under the terms and conditions of the Creative Commons Attribution (CC BY) license (http://creativecommons.org/licenses/by/4.0/).