Article

Design, Simulation, and Test of a New Threshing Cylinder for High Moisture Content Corn

Beijing Key Laboratory of Optimized Design for Modern Agricultural Equipment, China Agricultural University, Beijing 100083, China
*
Author to whom correspondence should be addressed.
Appl. Sci. 2020, 10(14), 4925; https://doi.org/10.3390/app10144925
Submission received: 17 June 2020 / Revised: 9 July 2020 / Accepted: 14 July 2020 / Published: 17 July 2020

Abstract

:

Featured Application

This paper aims to reduce the rate of broken and uncleared grain during the corn threshing process. In terms of structural design, a new corn threshing cylinder based on the longitudinal axial flow threshing method and three different types of T-type rasp bar, separating straight rod, and spiral extracting rod were devised. In terms of research technology, discrete element method solution (DEM) software was used to analyze the threshing process of corn ears. In terms of experimental design, the effective combination of structural parameters was obtained by the three-factor multiple test. These works can be used in the structural design and parameter setting of threshing mechanisms of corn combine harvesters.

Abstract

Corn harvesting mode has gradually changed from ear harvesting to direct grain harvesting. In view of the problems of high moisture content in corn harvesting in China, such as the rates of broken grains (BGR) and uncleared grains (UGR) being too high, a new single longitudinal axial threshing cylinder was designed, which mainly included a cylinder spindle, a spiral feeding inlet, a T-type rasp bar, a separating straight rod, and a spiral extracting rod. Firstly, the three states of grain during the threshing process and the key influence factors of threshing and force analysis of corn ears in the threshing device were analyzed, then the structure of the threshing cylinder was designed, and its parameters were determined by theoretical analysis results. The arrangement mode of threshing elements adopted a combination of a T-type rasp bar, a separating straight rod, and a spiral extracting rod with a 6-head spiral pattern and an arrangement step of 250 mm. Secondly, the arrangement step of threshing elements was determined by discrete element method solution (DEM) simulation; the result showed that the average movement velocity was 55.04 m/s and the threshing time was 6–8 s. Finally, a multiple factors experiment of the threshing device was carried out, and the result showed that the order of the effect factors of the BGR and UGR was cylinder rotational speed > concave clearance > feed amount. When cylinder rotational speed was 309.17 r/min, concave clearance was 35.48 mm, and the feed amount was 6.13 kg/s. The verification experiment result showed that the BGR and UGR were 1.24% and 1.33%, respectively, which meet standard requirements. The research results could provide a reference for the design of a high moisture content grain threshing device and combine harvester.

1. Introduction

Corn is one of the main crops in China; the total production was 25.717 million tons in 2018 [1]. Corn harvesting is usually carried out when the moisture content of the grain is within the range of 20% to 35%, after a long time of drying, then threshed by a small thresher after moisture content reduced to about 15% [2,3]. This method has some disadvantages, such as a long treatment cycle and high labor intensity and operating costs, which cannot meet the requirements of modern corn production operations. Therefore, the corn harvesting operations in China that have gradually changed to directly harvested grain are of great significance to shorten harvest cycles, save production costs, improve operational efficiency, and promote overall agricultural mechanization [4,5].
The threshing device, as one of the key components of corn grain direct harvesters, determines the operation efficiency of the harvester. The rate of broken grain (BGR) and the rate of uncleared grain (UGR) are important indexes to evaluate the operation quality of threshing. Grain with high moisture content is easily damaged during threshing [6]; thus, the threshing method, structure, and parameters are important to improve the quality of the direct grain harvesting operation. Countries represented by the United States, Italy, and Germany generally use combined harvesting machinery to directly harvest grain because of the vast land planting areas, single crop variety, and mature farm management models. Some large-scale corn combine harvesters developed by famous agricultural machinery brands such as John Deere, CASE, and CLASS have higher power, efficiency, and mechanization than other products. In China, domestic universities, scientific research institutions, and related enterprises, such as Foton Lovol, Wuzheng Group, and Yongmeng Company, have carried out a lot of research on corn combine harvesters. These combine harvesters have good field test results in various provinces, but high moisture content corn harvesting still has the problems of high rates of broken and uncleared grain.
In terms of mechanism design, Tang et al. [7,8,9] built a test-bed of threshing and cleaning, including a shear-flow threshing cylinder, an auxiliary feeding wheel, and a longitudinal axial flow cylinder. The optimal threshing and separating performance indexes of rice and wheat were obtained through orthogonal tests. Li et al. [10] designed a discrete roller model based on the discrete principle of rostrum bionic; the roller destroyed the arrangement rule of corn ears and loosened the corn grain, and the platform experiment indicated the optimal parameter combination. Kiniulis et al. [11,12] studied the influence rules of threshing cylinder filler plates on the corn threshing process; cylinder rasp bars were designed and the test showed that the shape of spaces between rasp bars was related to ear threshing performance. Then, an influence model of working parameters on the corn feed rate during threshing was established, and test results showed that the force acting on the rear part of the concave tended to operate evenly at higher feed rates. Steponaviċcius et al. [13] analyzed the influence of concave clearance and rasp bar layout on evaluation indexes of high moisture content corn threshing performance; the loss rate of grain amounted to 2.2% when the clearance between the concave and rasp bar was 62.5 mm and the feed rate was 20.6 kg/s. This result provided a reference to the structural design of the threshing device.
In terms of research technology, Yu et al. [14,15] first developed the AgriCAE simulation software based on the material contact model and the connection model to research the method of constructing discrete element models of soybean, corn, wheat, rice, and other crop grains, while building a finite element analysis model of corn ear, defining a contact-mechanical model of grain-grain and grain-ear and designing a calculation method of the force and movement situation of grain to complete the simulation of corn threshing. Chen et al. [16] used EDEM software to study the material and interaction properties of corn and wheat grains. Compared with the actual measurement results, it had high accuracy, and the study can provide a reference for the interaction between agricultural materials and external mechanical interference. Pužauskas et al. [17] used the finite element analysis method to research the theory of the corn threshing process, established a mathematical model to verified it through experiments, and analyzed the relationship between the structural form of the threshing elements and the BGR.
In order to improve the quality of corn threshing and reduce the high rate of broken and uncleared grains, in this paper, a new corn threshing cylinder is designed based on the longitudinal axial flow threshing method, which mainly includes a T-type rasp bar, a separating straight rod, and a spiral extracting rod. Through theoretical analysis, simulation, and experimental verification, the factors of structure and working parameter effects on BGR and UGR, such as threshing element friction coefficients and arrangement modes, rotational speeds of the cylinder, concave clearance, and feeding amounts, were studied. The optimal matching strategy for parameters was determined. This research could provide a reference for the design and intelligent development of grain combine harvesters.

2. Materials and Methods

2.1. Characteristic of High Moisture Content Corn

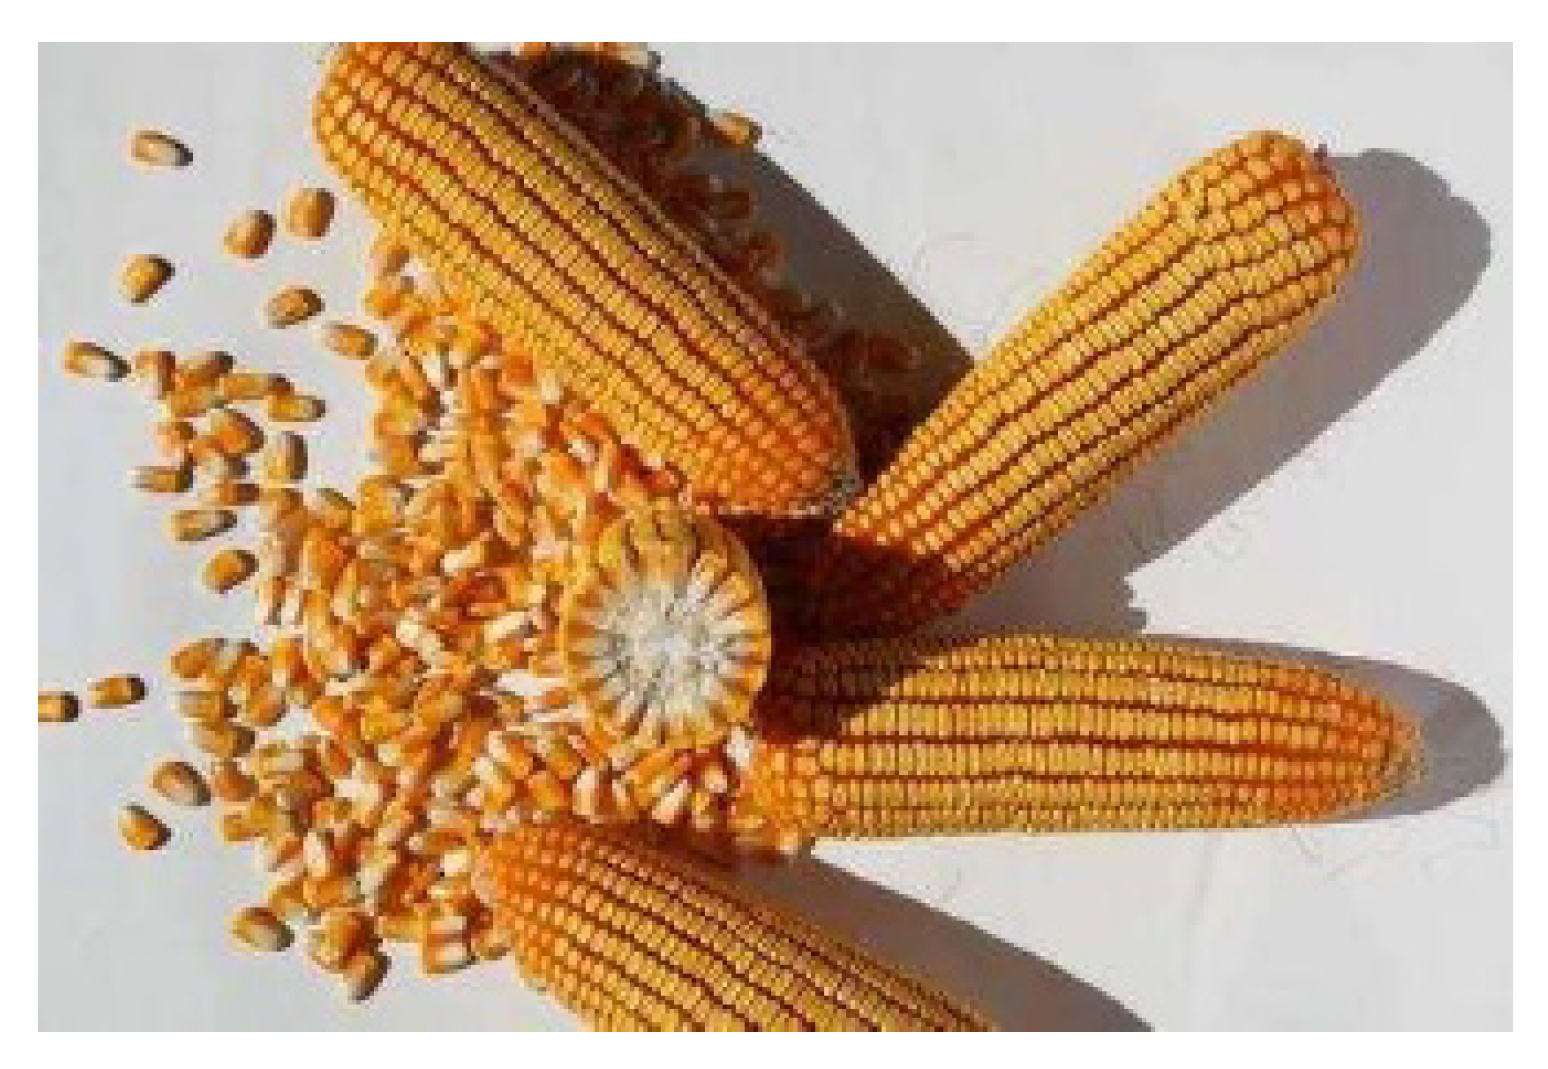
The moisture content of corn has a significant impact on the rate of broken grain (BGR) and the rate of uncleared grain (UGR) of direct grain harvesting [18,19]. BGR and UGR are the smallest when the grain moisture content is in the range of 15–25% [20]. The test material was Zhengdan 958, which is the main planting variety in the Huanghuaihai region, with the advantages of being cold-tolerant and lodging-resistant, as shown in Figure 1. The summer sowing period is about 96 days. The average height of this variety is 245 cm, the average height of the spike point is 113 cm, the average length of an ear is 17.1 cm, the number of grain rows on an ear is about 15–18, the number of rows is 32–36, its grain size (long × width × thickness) is about 6.3 × 3.4 × 5.6 mm with a half horse toothed type, and the average weight of ear is 313 g.
Before the experiment, corn grains were randomly sampled to measure the moisture content by a grain moisture measurement instrument; this was repeated three times to obtain the average value. The test instruments included a small electronic scale (Xiangshan EK 3550, accuracy is 0.01 g) and a grain moisture measurement instrument (Puyun 9500, measurement range is 0–40%, accuracy is 0.1%, measurement error is ≤ ±0.5%). The result showed that the grain moisture content of the corn was 28.24%, which is in the range of high moisture content corn.

2.2. Test-Bed of Threshing Mechanism

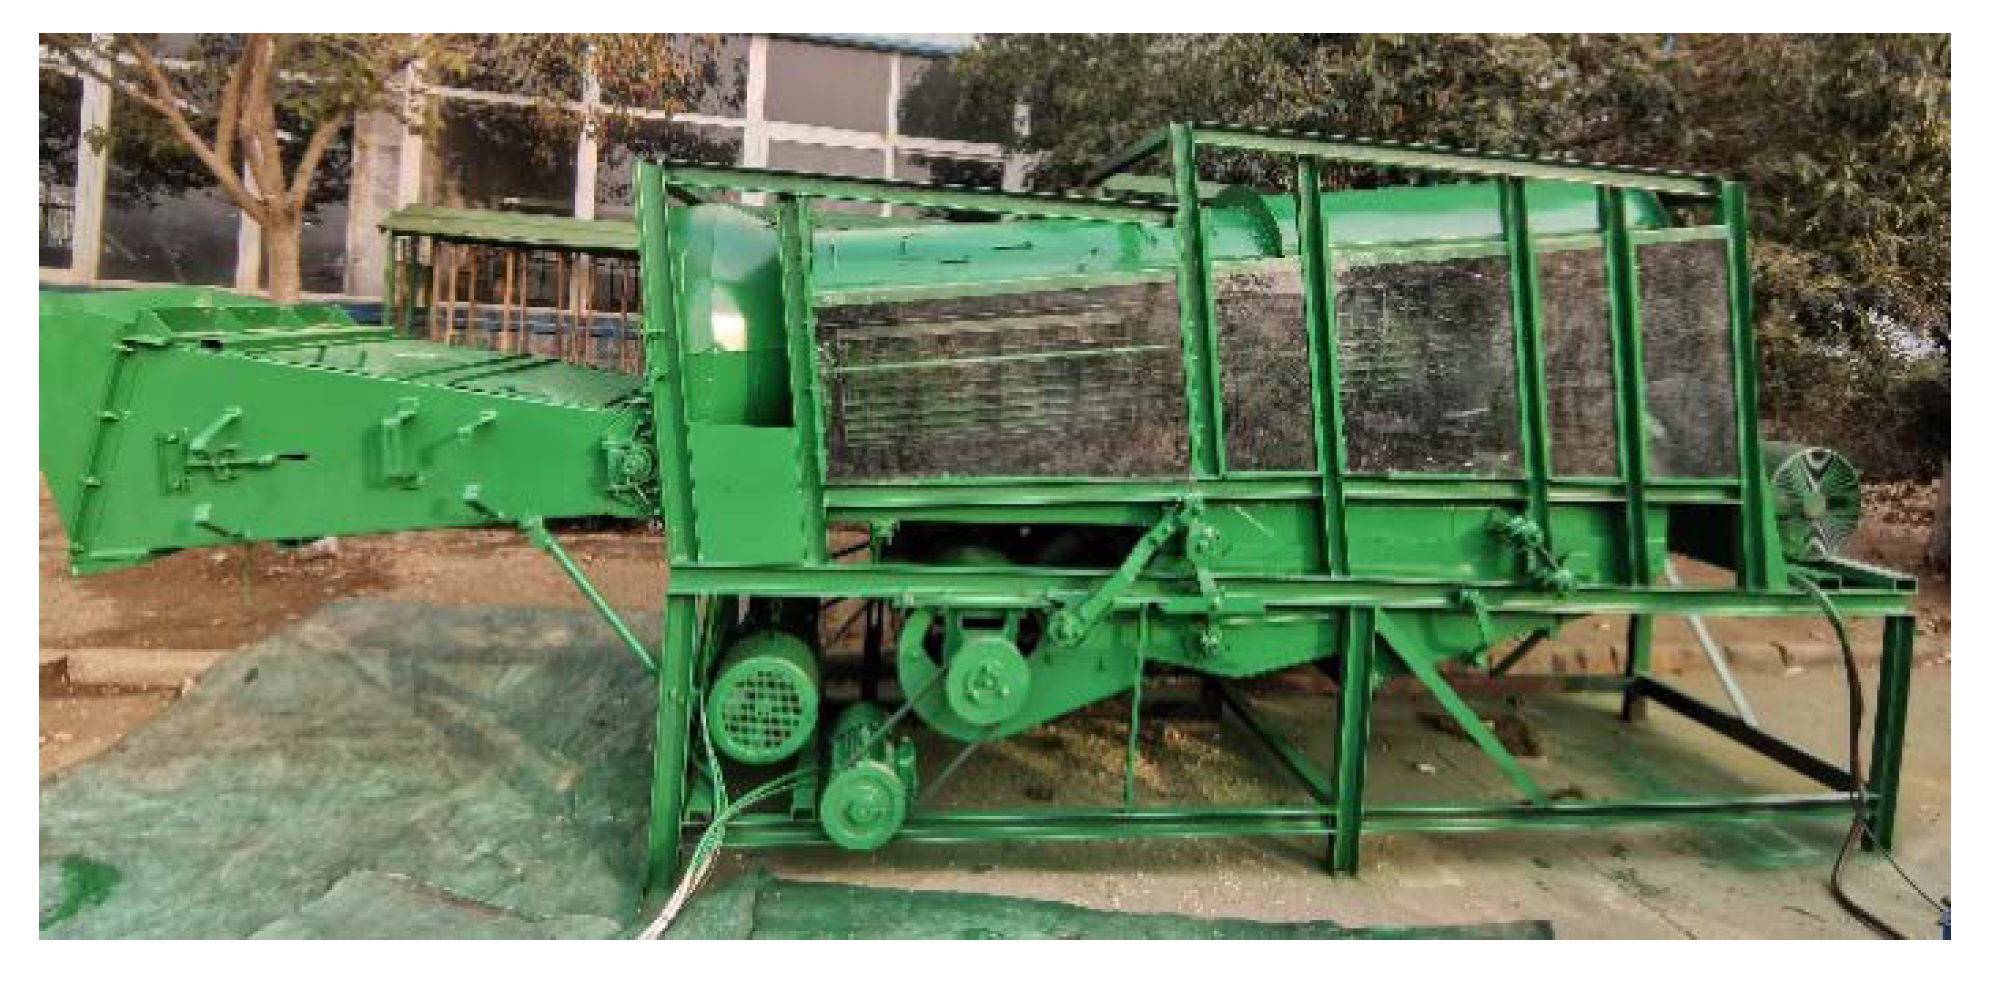
The test-bed experiment was carried out in January 2020 at the Shandong Wuzheng Agricultural Equipment Research Institute based on a self-developed longitudinal axial flow corn threshing and cleaning device, as shown in Figure 2 Test tools included a Hall rotational speed sensor (Deke CY12-02PK, working voltage is 0–24 V) and a three-phase asynchronous motor (Xinling YVF2-4, rated power is 11 kW). The cylinder was driven by a frequency converter; the clearance between the concave and the threshing element was adjusted by a mechanism. Ears were fed to the threshing cylinder through a chain conveyor and the separated grain felled onto a collecting plate under the cylinder as the threshing process residues such as mandrel and bract leaves were discharged out of the device through an extracting rod. After the experiment, the test data was determined according to GB/T 21961-2008 “Test methods for maize combine harvester” and GB/T5982-2017 “Thresher test method” [21,22]. The evaluation indexes were BGR and UGR. The sample of grains was randomly taken from the collecting plate, the mass of broken kernels was weighed, and the BGR was calculated by Equation (1). The mass of kernels remaining on the broken mandrel in the extraction mixture and the total mass of kernels in the test area were weighed, respectively, and the UGR was calculated by Equation (2). This work was repeated three times to calculate the average values.
Y 1 = m 1 M 1 × 100 %
Y 2 = m 2 M 2 × 100 %
where m1 is the mass of broken grains in the sample, g; M1 is the mass of sample grain, g; m2 is the mass of the remaining grain on the broken core, g; M2 is the mass of grain in the test region, g.

2.3. Statistic Analysis

In order to further determine the working parameters of the threshing device, the three factors and three levels of the experiment were conducted, and the effect of the different parameter combinations on the test indexes was analyzed [23,24]. The rotational speed of the threshing cylinder was selected as 275, 315, and 355 r/min, the concave clearance was selected as 30, 35, and 40 mm, and the feed amount was selected as 6, 8, and 10 kg/s; the levels of parameters are shown in Table 1. The results of the multiple factor experiment results are shown in Table 2.
The results of the multiple factor experiment were analyzed through ANOVA and a Box-Behnken Design (BBD) was used to find the optimal values of the three parameters. ANOVA is a method to distinguish the difference between test results caused by the influence of factor levels and the difference between test results caused by fluctuations of the error. Before ANOVA, a hypothesis was put forward that the influence of the three-factor parameters on BGR and UGR was not significant.
According to Table 2, normal distribution was verified by the Shapiro-Wilk test and homogeneity of variance was verified by Levine’s test. The results showed that the test result data satisfied normal distribution and variances. The analysis of results was conducted at a significance level of p = 0.05. Design Expert and Statistical Product and Service Solutions (SPSS) software was used for statistical analysis.

3. Structure Design of Threshing Cylinder

3.1. Design of Threshing Elements

According to the characteristics of high moisture content corn threshing, if the contact area between the grain and the rasp bar is relatively large, the force of rasp bar to grain has to be appropriate. Threshing efficiency mainly depends on impact times and velocity, and it has low power consumption. In this paper, the longitudinal axial flow threshing cylinder adopted a T-type rasp bar to enhance the rubbing force of the ear-mechanism and reduce the damage of grain in the threshing process. The T-type rasp bar was designed as a right angle trapezoid with the length of the top being 65 mm, the length of the bottom 116.5 mm, the height 105 mm, and the bottom angle 60°, which had a certain diversion effect. The rasp bar block was fixed to the base by a bolt with a depth of 12 mm to simulate the squeezing effect of ears by hands. The length of the separating straight rod was 410 mm and the inclined angle was 67°, which was fixed to a base on the cylinder with two bolts. In the separating section of the cylinder, the separating straight rod enhanced separation efficiency and the spiral extracting rod at the rear of the cylinder enhanced the discharge of stems and bract leaves. The spiral structure was beneficial for the remaining materials to flow to the tail of the cylinder to reduce the possibility of blockage. The installation height of the threshing elements (radial distance between the top of the threshing element and the cylinder spindle) was 55 mm. Three kinds of threshing elements aimed at different requirements at different positions of the cylinder and the structure of threshing elements are shown in Figure 3.

3.2. Analysis of Factors of Influence on Quality of Threshing Cylinder

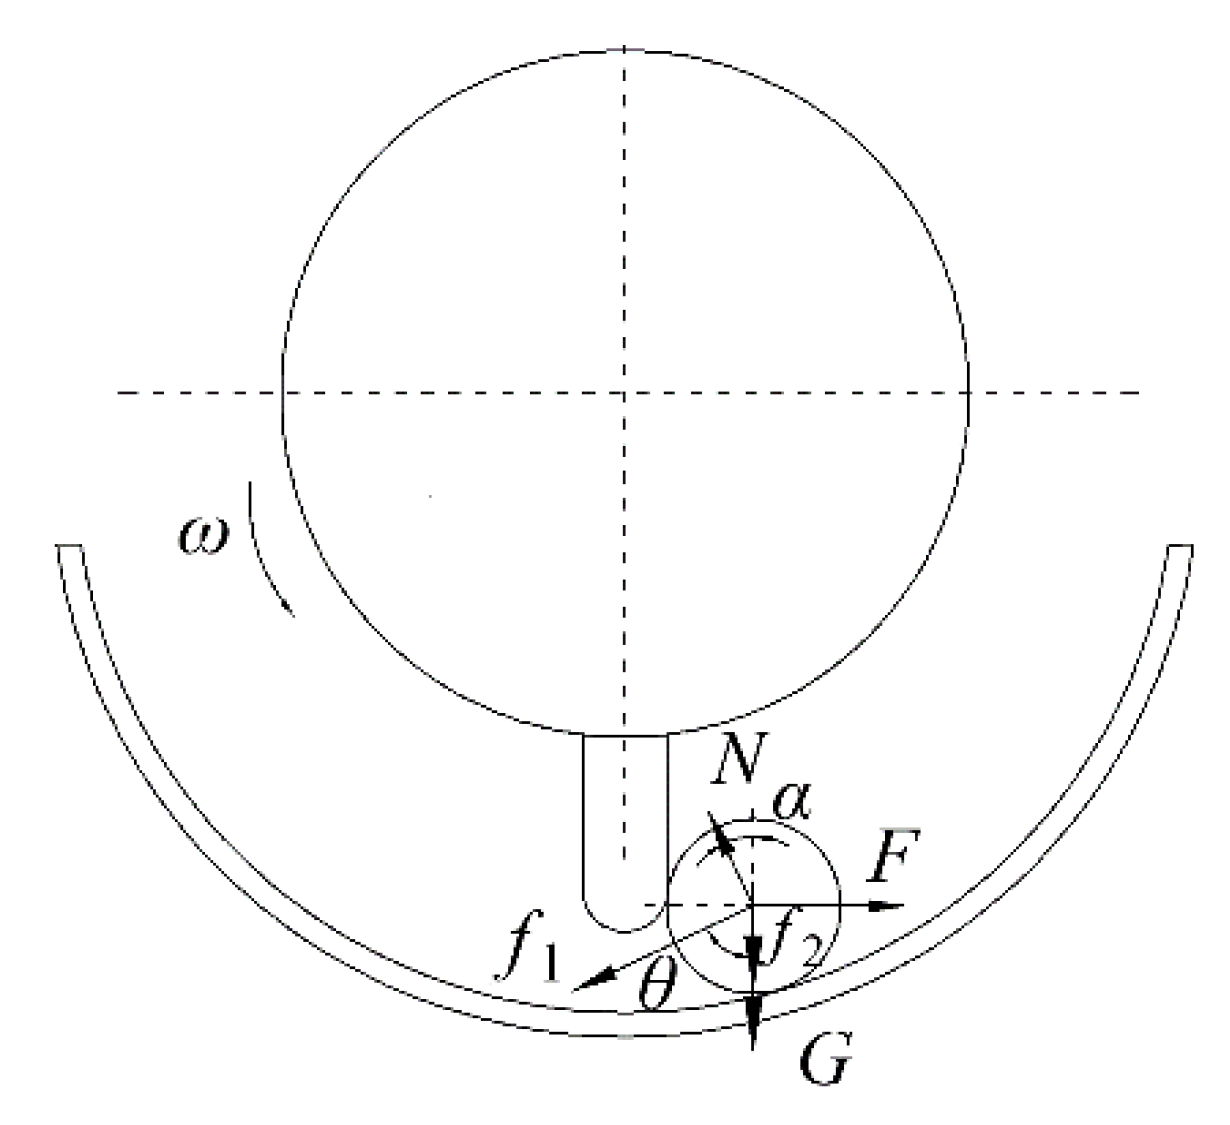
Clarifying the influence factors of the threshing process is an important prerequisite for reducing BGR and UGR. Based on the model of ears in the threshing device during the threshing process, the force of the rasp bar on an ear was analyzed, as shown in Figure 4.
According to Newton’s second law, the force of an ear impacted by threshing elements F was calculated by Equation (3).
{ N cos α = G + f 1 sin θ + f 2 F = N sin α + f 1 cos θ G = m g f 1 = μ 1 N f 2 = μ 2 F
F = G ( sin α + μ 1 cos α ) cos α ( 1 μ 1 μ 2 ) sin α ( μ 1 + μ 2 )
where N is the holding power of the concave to the ear, N; F is the holding power of the threshing element to the ear, N; f1 is the friction between the threshing element and the ear, N; μ1 is the friction coefficient of the threshing element; f2 is the friction between the concave and the ear, N; μ2 is the friction coefficient of the concave; G is the gravity of the ear, N; m is the weight of the ear, g; g is the gravitational acceleration, 9.8 m/s2; α is the angle between force N and vertical ground, (°); θ is the angle between force f1 and gravity G, (°).
From Equation (3), the force F, as well as angle α, are related to friction f1 and angle θ, where α and θ are complementary. The changing trend of force F under different friction coefficients, μ1 and μ2, is shown in Figure 5.
As shown in Figure 5, the changing trend of force F with angle α is the same when friction coefficients of the threshing element and the concave were different. The maximum value Fmax occurred when angle α = 35°, 46°, 54.5°, 61°, and 66°, respectively, which was most likely to cause grain breakage. The stress of ear was the largest when friction coefficients μ1 and μ2 were 0.5, while the stress was the smallest when friction coefficients were 0.4. In order to further explore the relationship between force F and friction coefficients, the analysis of the change law of force F with μ1 and μ2 at angle α = 54.5° is shown in Figure 6.
When angle α is a constant value, the force F gradually increases when friction coefficients increase, and curve μ1 + 0.685 μ1μ2 + 0.96 μ2 = 0.629 (when the value of F was 150 N in Equation (4)) as the boundary rapidly rises. According to existing literature and previous test results, the maximum destructive power of grain was at the range of 86.5–150 N; this should be considered when selecting materials of the threshing element and the concave. Thus, the threshing element and the concave were made of 50 Mn structural steel and welded to the threshing cylinder through the base. The friction coefficient between 50 Mn structural steed with spray coating and corn was tested as 0.28.
In order to determine installation parameters of the threshing element, the movement time of ear t in the threshing device was calculated as Equation (5).
t = D v sin ( arctan n p π D )
where D is the diameter of the cylinder, mm; v is the velocity of an ear in the threshing device, m/s; n is the number of threshing element screw heads; p is the installation pitch of the threshing elements, mm.
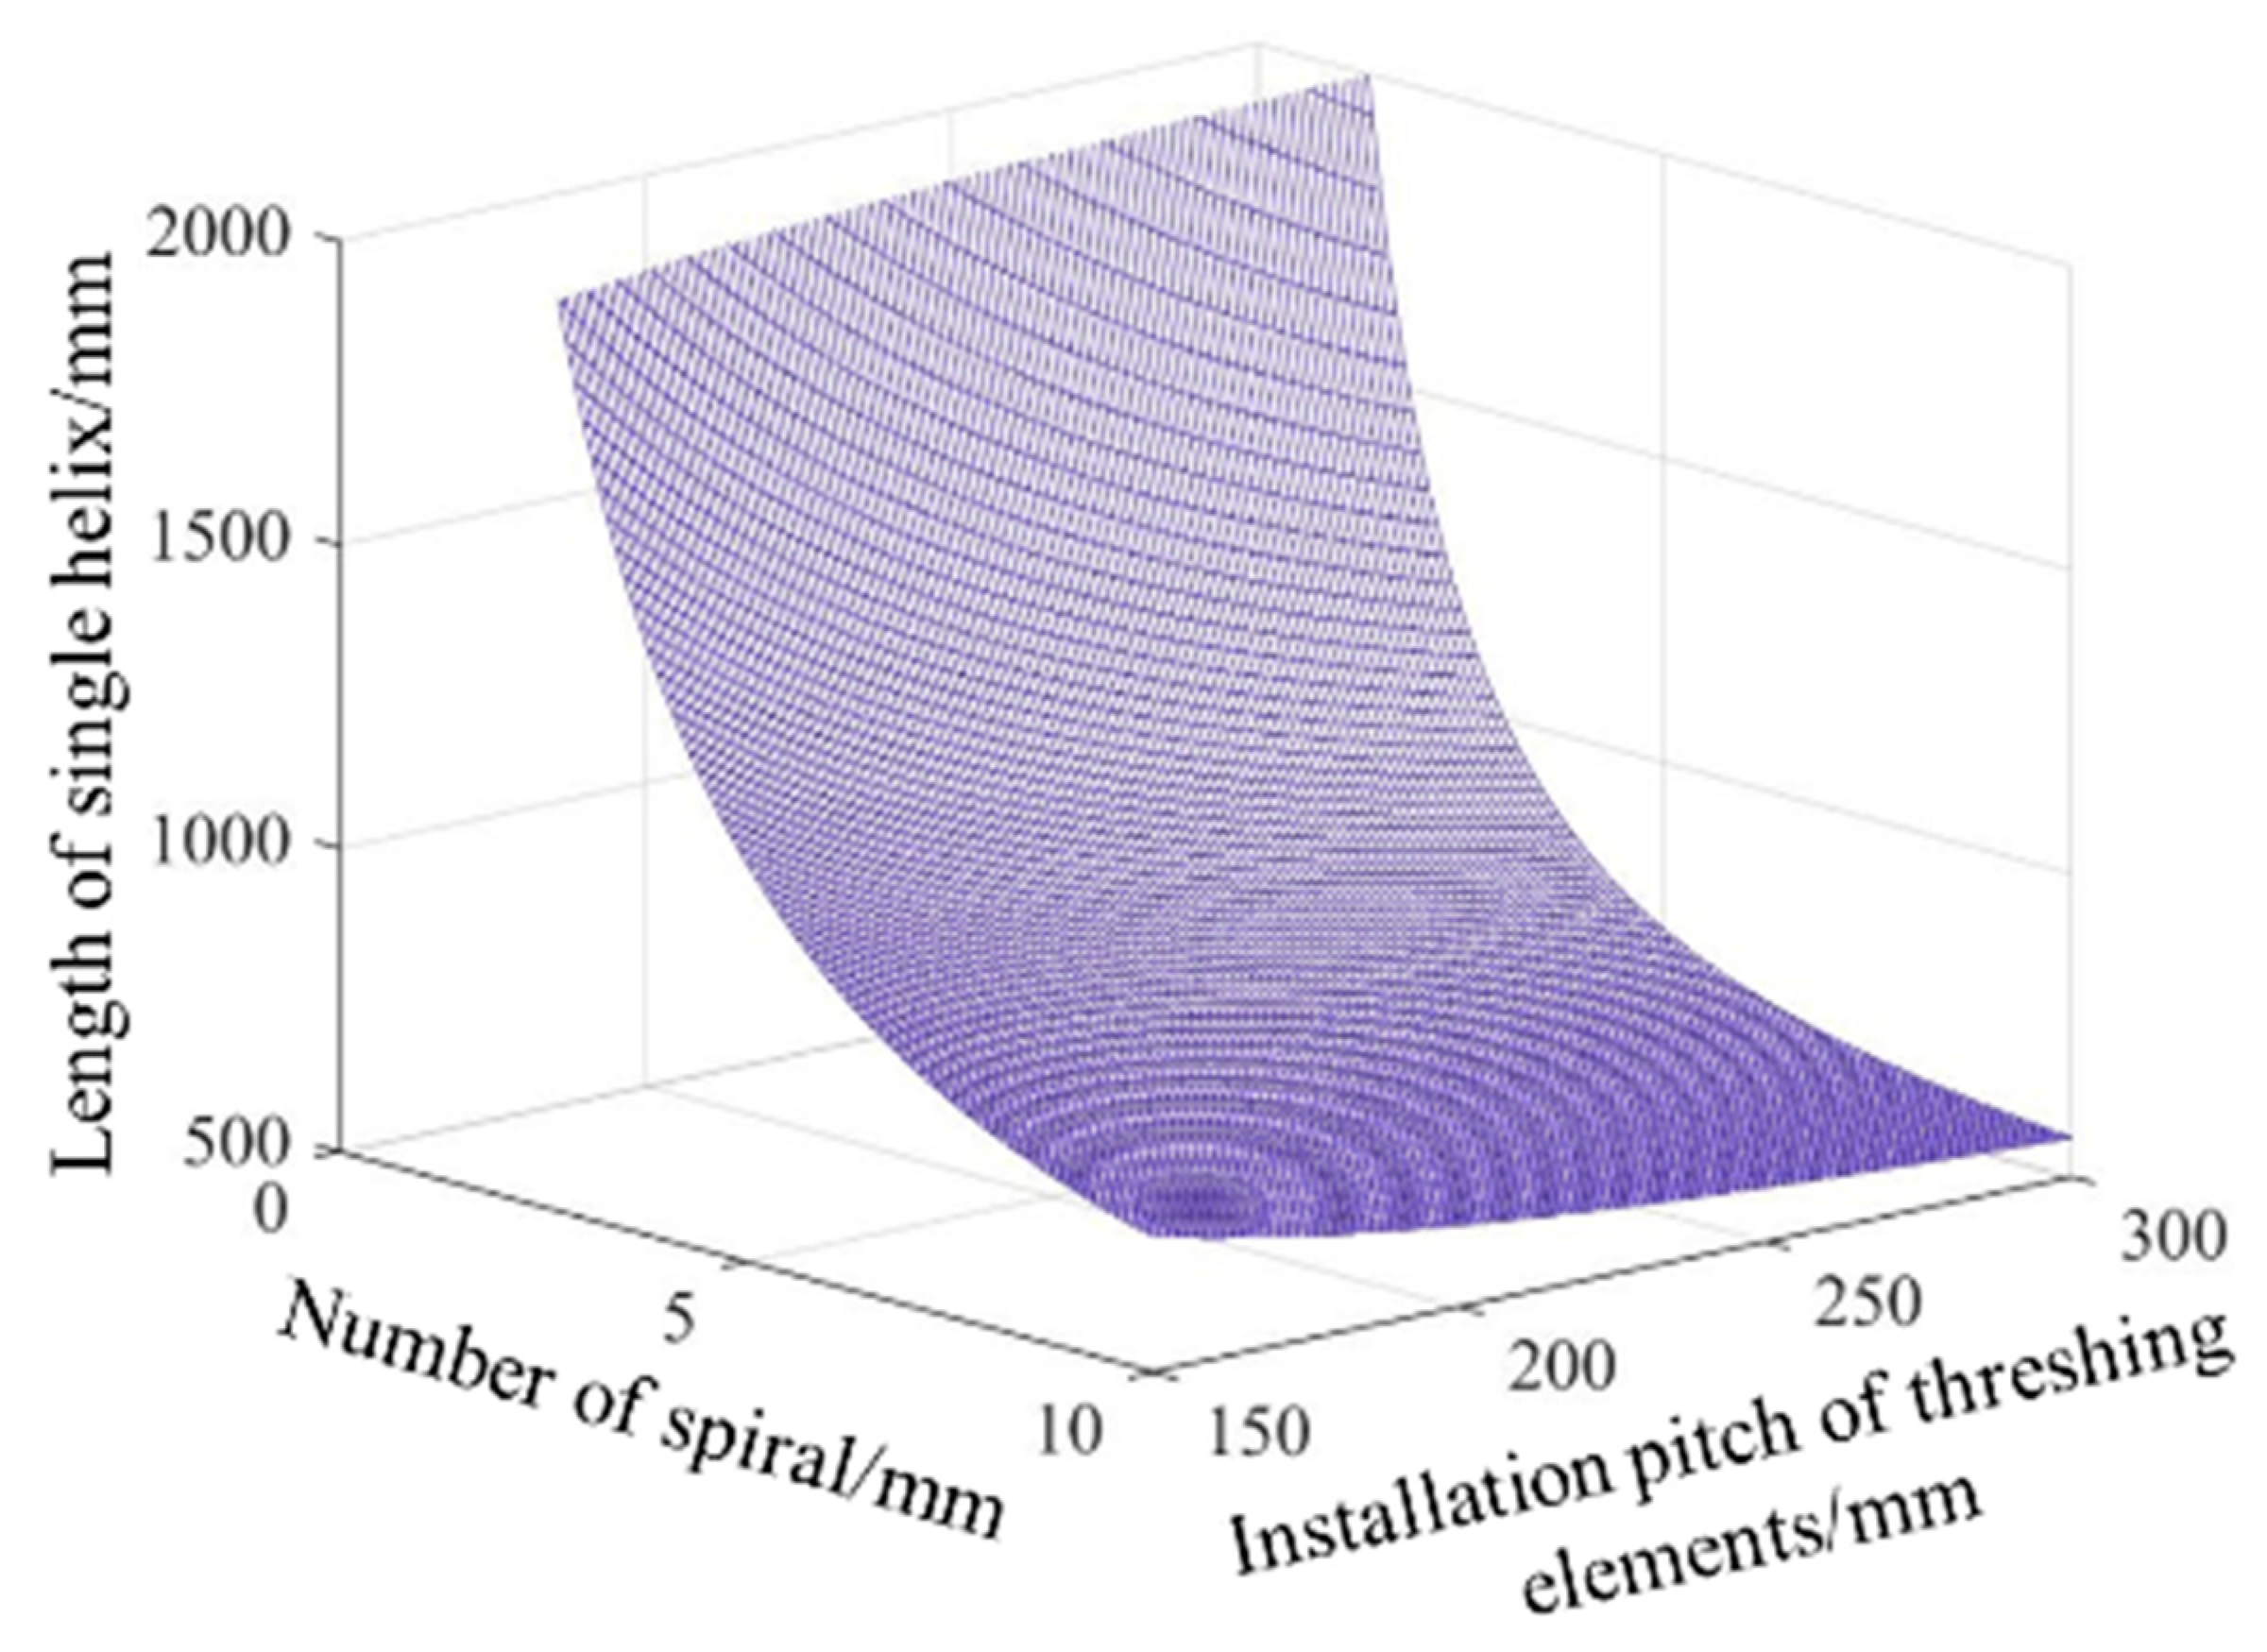
The relationship between the number of heads n, pitch p, and the length of a spiral l is shown in Figure 7, where the X axial is the number of spirals n, the Y axial is the installation pitch p. Length l gradually decreased with increasing values of n and p. Equation (5) explains that the less time required for threshing, the higher the threshing efficiency when the velocity of an ear is a constant value.

3.3. Establishment of Threshing Performance Indexes Models of Evaluating

3.3.1. Model of Rate of Broken Grain

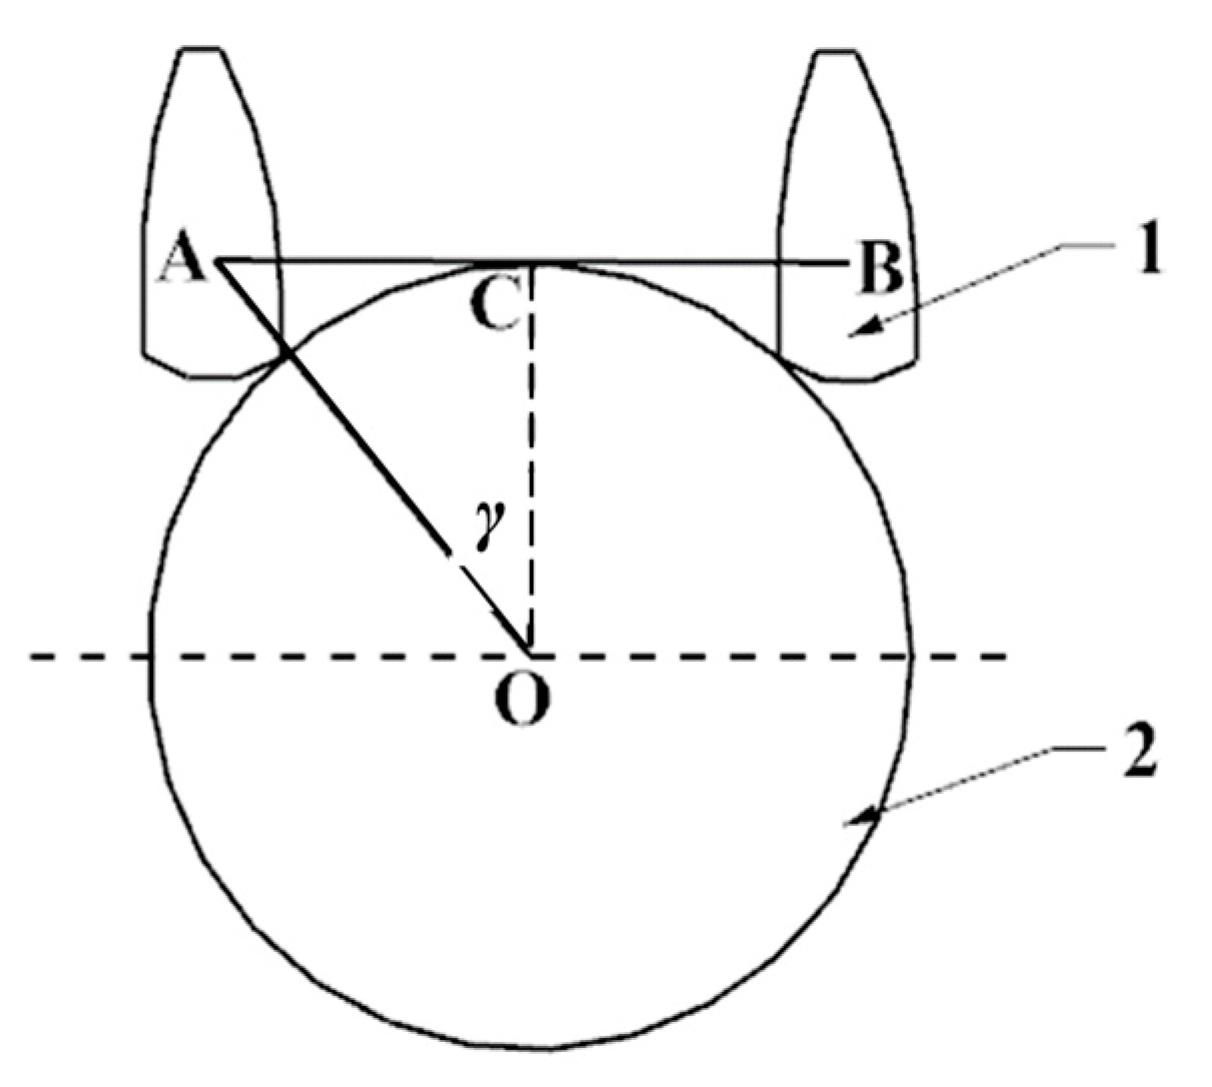
According to the collision effect between threshing elements and ears in the threshing device, the model of BGR was established. We assumed that the surface of the grain is smooth and the contact surface between the grain and threshing element is simplified to arc, as shown in Figure 8, where points A and B represent the centroid position of two grains. The grain collides with the threshing element at different angles γ and its contacted area is extremely small, so energy obtained by the collision is different because of the different impact angles γ. Grains that absorb too much energy are easily broken. Assuming that grain obtains energy Eb at point A and is damaged within the range of line AC, the BGR p1 is calculated by Equation (6).
p 1 = | A C | R 0 + r i
where AC is the vertical distance between point A to center O; R0 is the radius of the threshing element, mm; ri is the radius of grain, mm.
According to Figure 8, the energy of new surface caused by the unit grain breaking is proportional to the energy of a new surface caused by grain breaking Ef, that is
{ E f = 1 2 K m V t 2 ( 1 e 2 ) cos 2 γ cos γ = ( R 0 + r i ) 2 | A C | R 0 + r i
where Ef is the energy of a new surface caused by grain breaking, J; Vt is the velocity of grain that has contact with the threshing element, m/s; K is energy dissipation coefficient of the collision process; γ is impact angle of grain when colliding with the threshing element, (°); m is unit mass of grain, g; e is the Euler number.
Substituting Equation (7) into (6), the BGR p1 is sorted as Equation (8).
p 1 = 1 2 E f K m ( 1 e 2 ) V t 2

3.3.2. Model of Rate of Uncleared Grain

The process of grain threshing was done by the impact of threshing elements arranged on the cylinder. As Gregory et al. pointed out, the impact between the ear and the threshing elements could be regarded as a random process, each impact on the ear would cause a part of the grains to be threshed and separated from the core, and the probability of threshing decreases as the number of uncleared grain (UG) decreases [25,26], that is
d U d N i = E i E n M U
where U is the mass of UG, g; Ni is the times of collision; Ei is the energy of per impact region delivered, J/m2; En is the energy of the unit mass grain in the unit impact region needed to thresh, J/m2; M is the mass of non-separated grain in the unit region, g.
Integrating both sides of Equation (9) to get Equation (10),
U i U f d U d N = E i E n M 0 N f d N
where Ui is the mass of the original UG, g; Uf is the mass of the final UG corresponding to the final impact, g; Nf is the times of impact.
Then, the UGR P2 can be expressed as Equation (11)
p 2 = U f U i = e E i E n M N f
Obviously, the overlapping of threshing impact areas provides more times of impact to avoid excessive loss of threshing. It is assumed that when the ear contacts the threshing element, its velocity immediately changes and the impact behavior is random. If the ears pass through the area between the threshing cylinder and the concave at a constant velocity, then the times that threshing elements will impact on ears can be expressed as Equation (12).
N f = B L V
where B is the number of times the threshing element passes a point on the concave in unit time; L is the length of the concave, mm; V is the velocity of the ear from front concave to rear, m/s.
The UGR is rewritten as follows:
p 2 = e ( B E n ) ( E i M ) ( L V )
Considering the power of the machine P and feeding speed R are important working parameters of the threshing cylinder design, the energy required per unit mass in Equation (10) is repressed as a product of the unit feeding power ratio P/R and the grass-valley ratio r, as shown in the following equation:
p 2 = e ( P E n ) ( L V ) n r M P R
where P is the power of the driving threshing cylinder, kW.

3.4. Design of Threshing Elements Arrangement

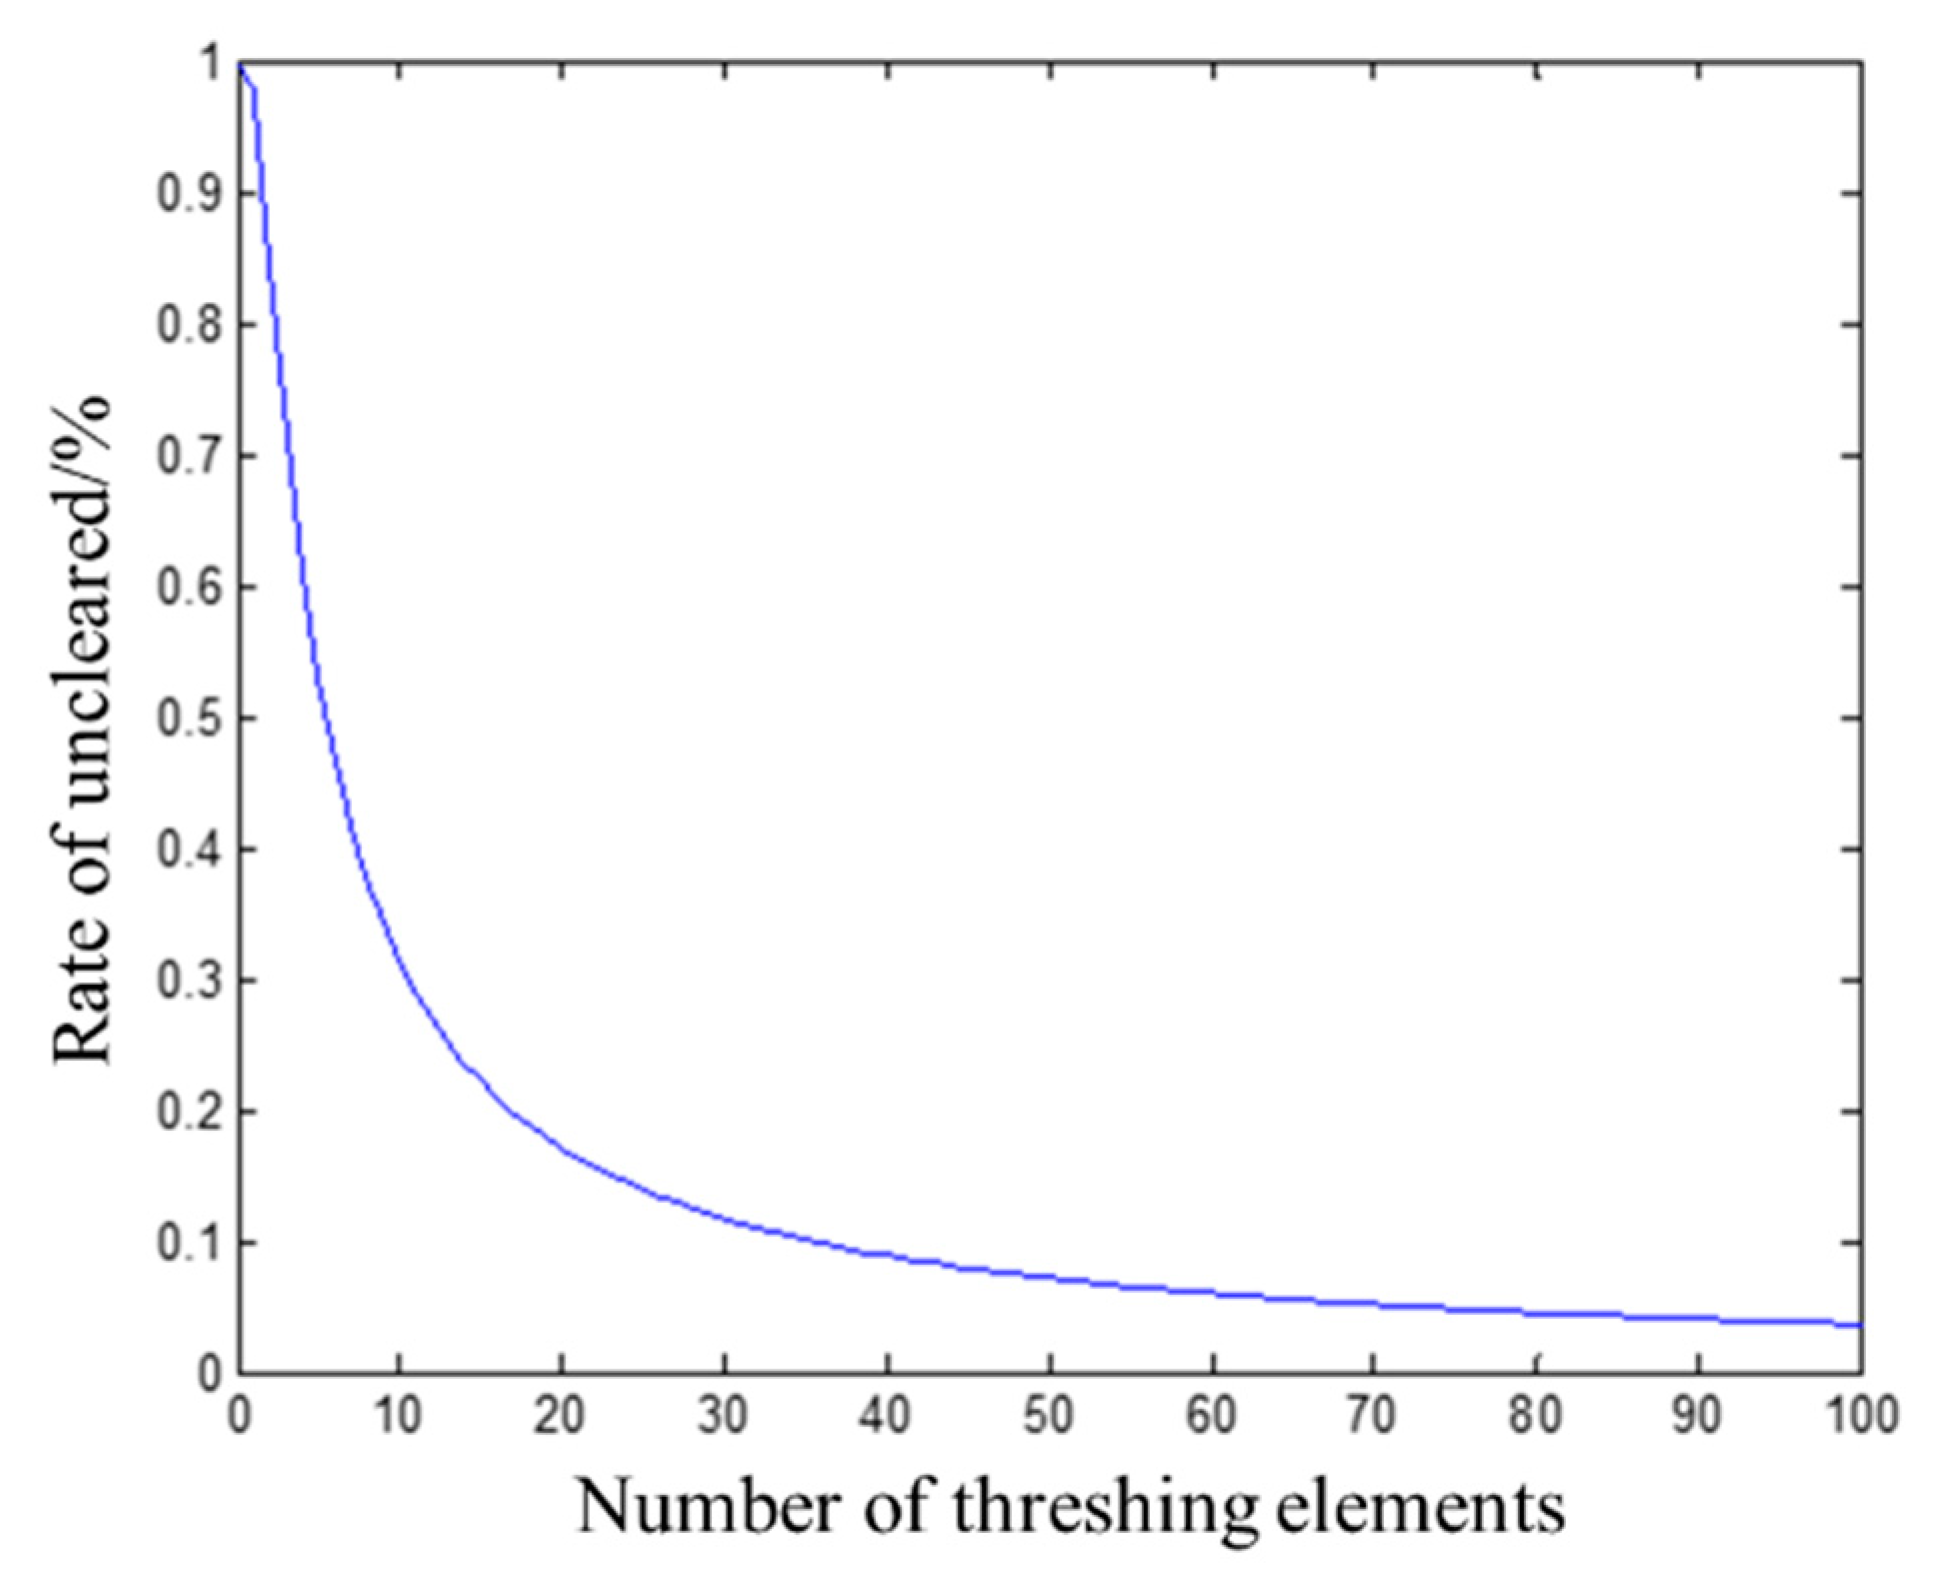
At present, there are two arrangement modes of threshing elements on the cylinder: in-line uniform distribution and spiral arrangement. The spiral arrangement has gradually become the main form of corn harvesting due to the excellent diversion effect. In order to make the cylinder spindle evenly stressed, the arrangement of threshing elements needs to meet the dynamic balance standard. The number of threshing elements arranged on the cylinder directly determines the times of collision of the ear. The length of the cylinder was determined to be 2400 mm, according to Equation (14), and the relationship between the number of threshing elements and the UGR is shown in Figure 9. The UGR drops to 7% when the number of threshing elements is between 50–70, and it declines slowly after the number of threshing elements is more than 70. Excessive threshing elements would consume more power and reduce production efficiency.
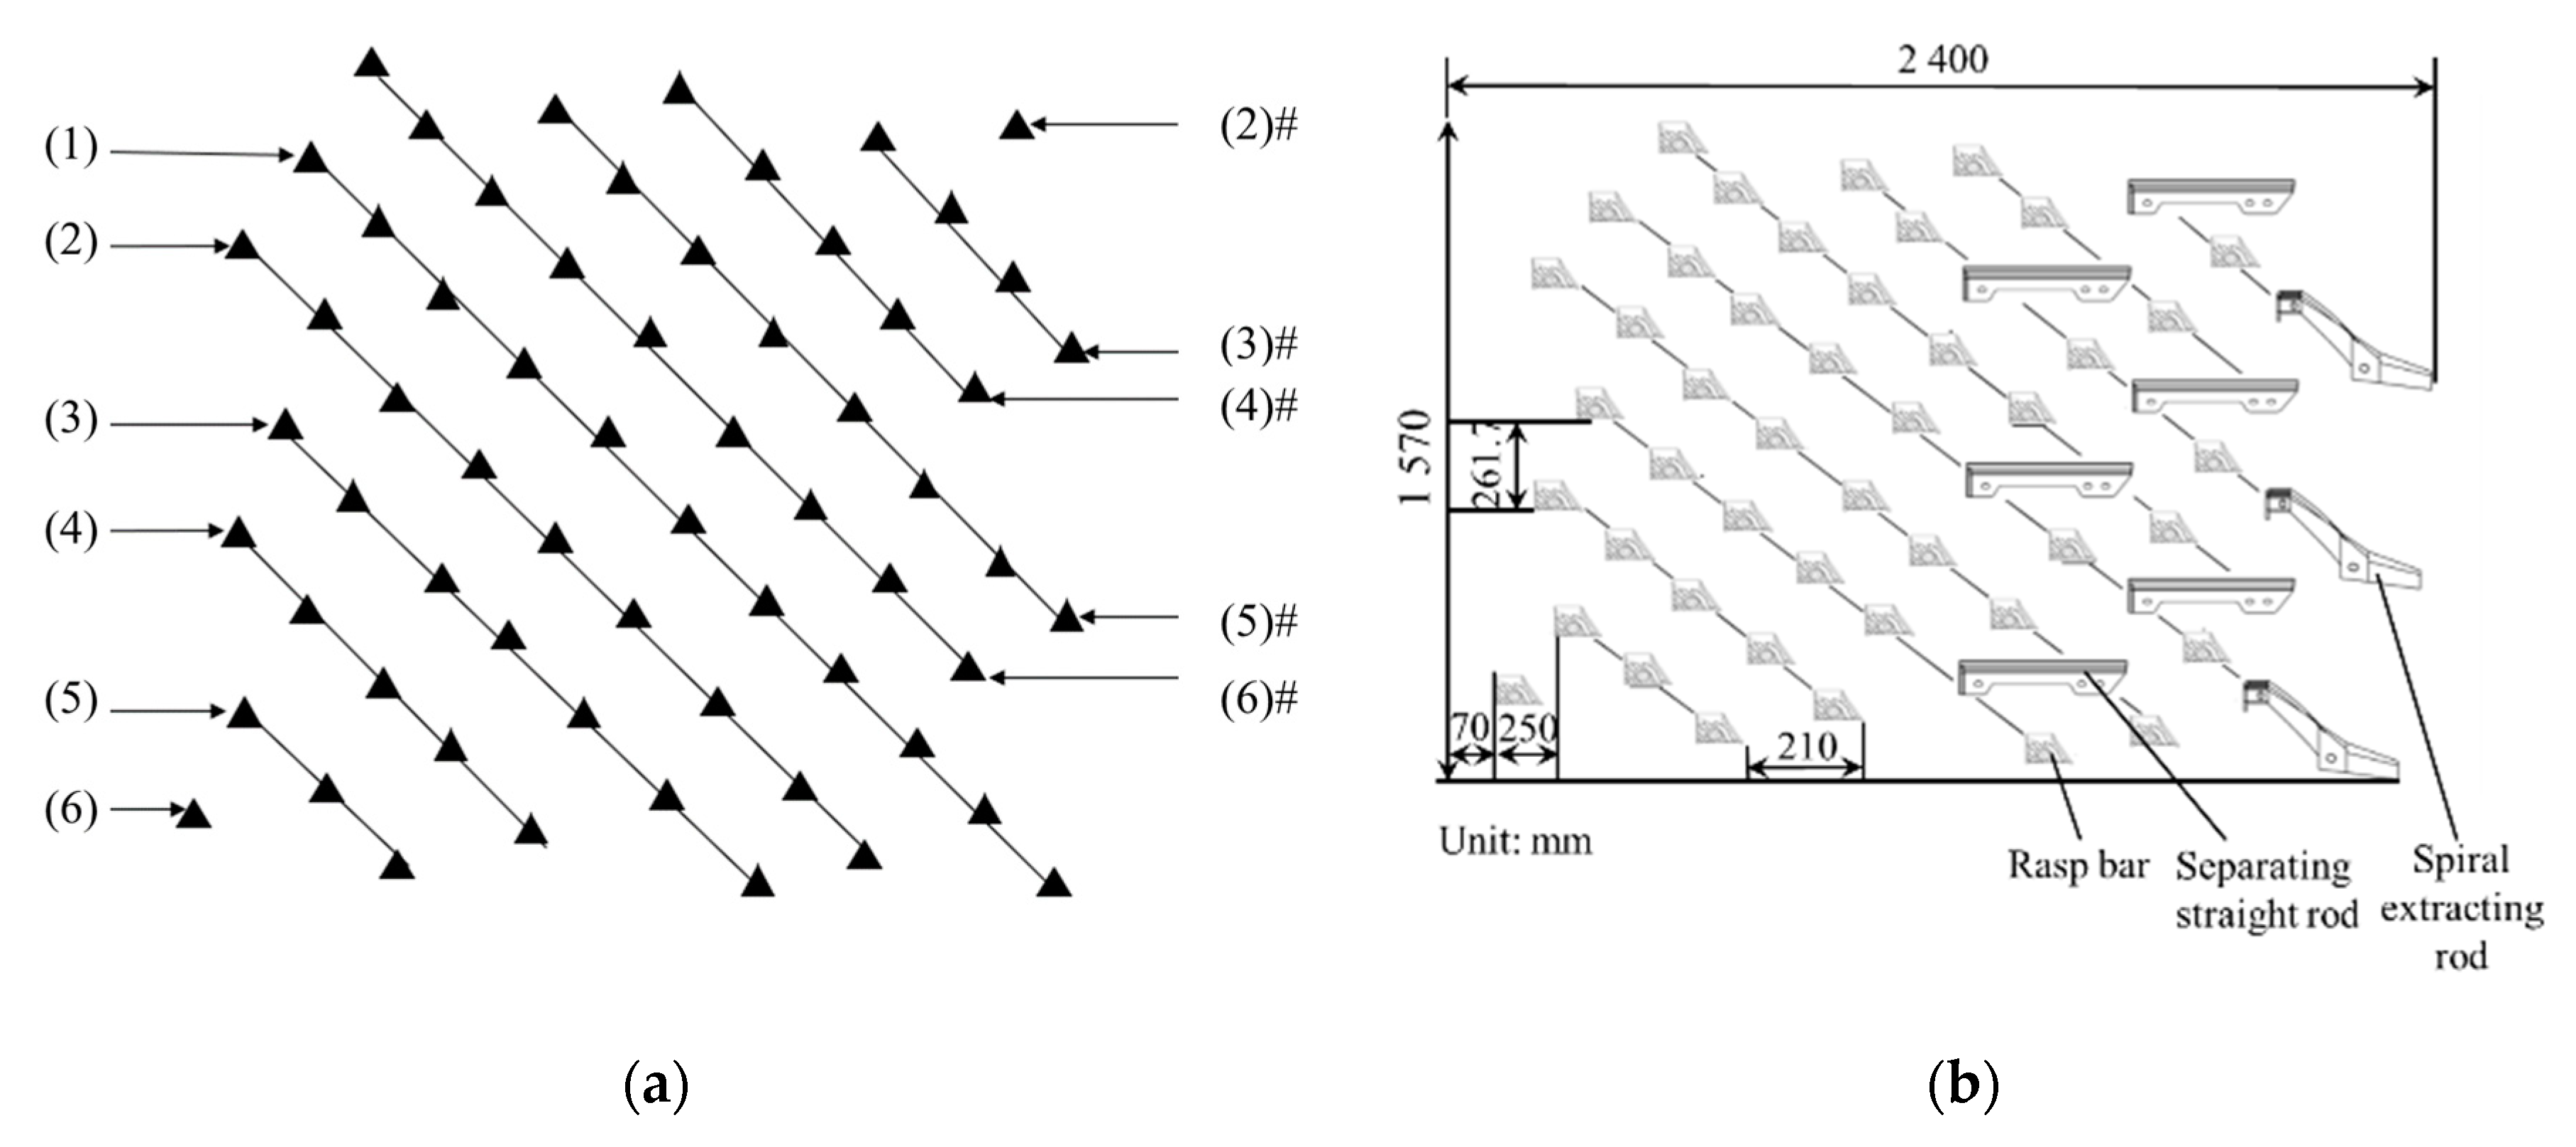
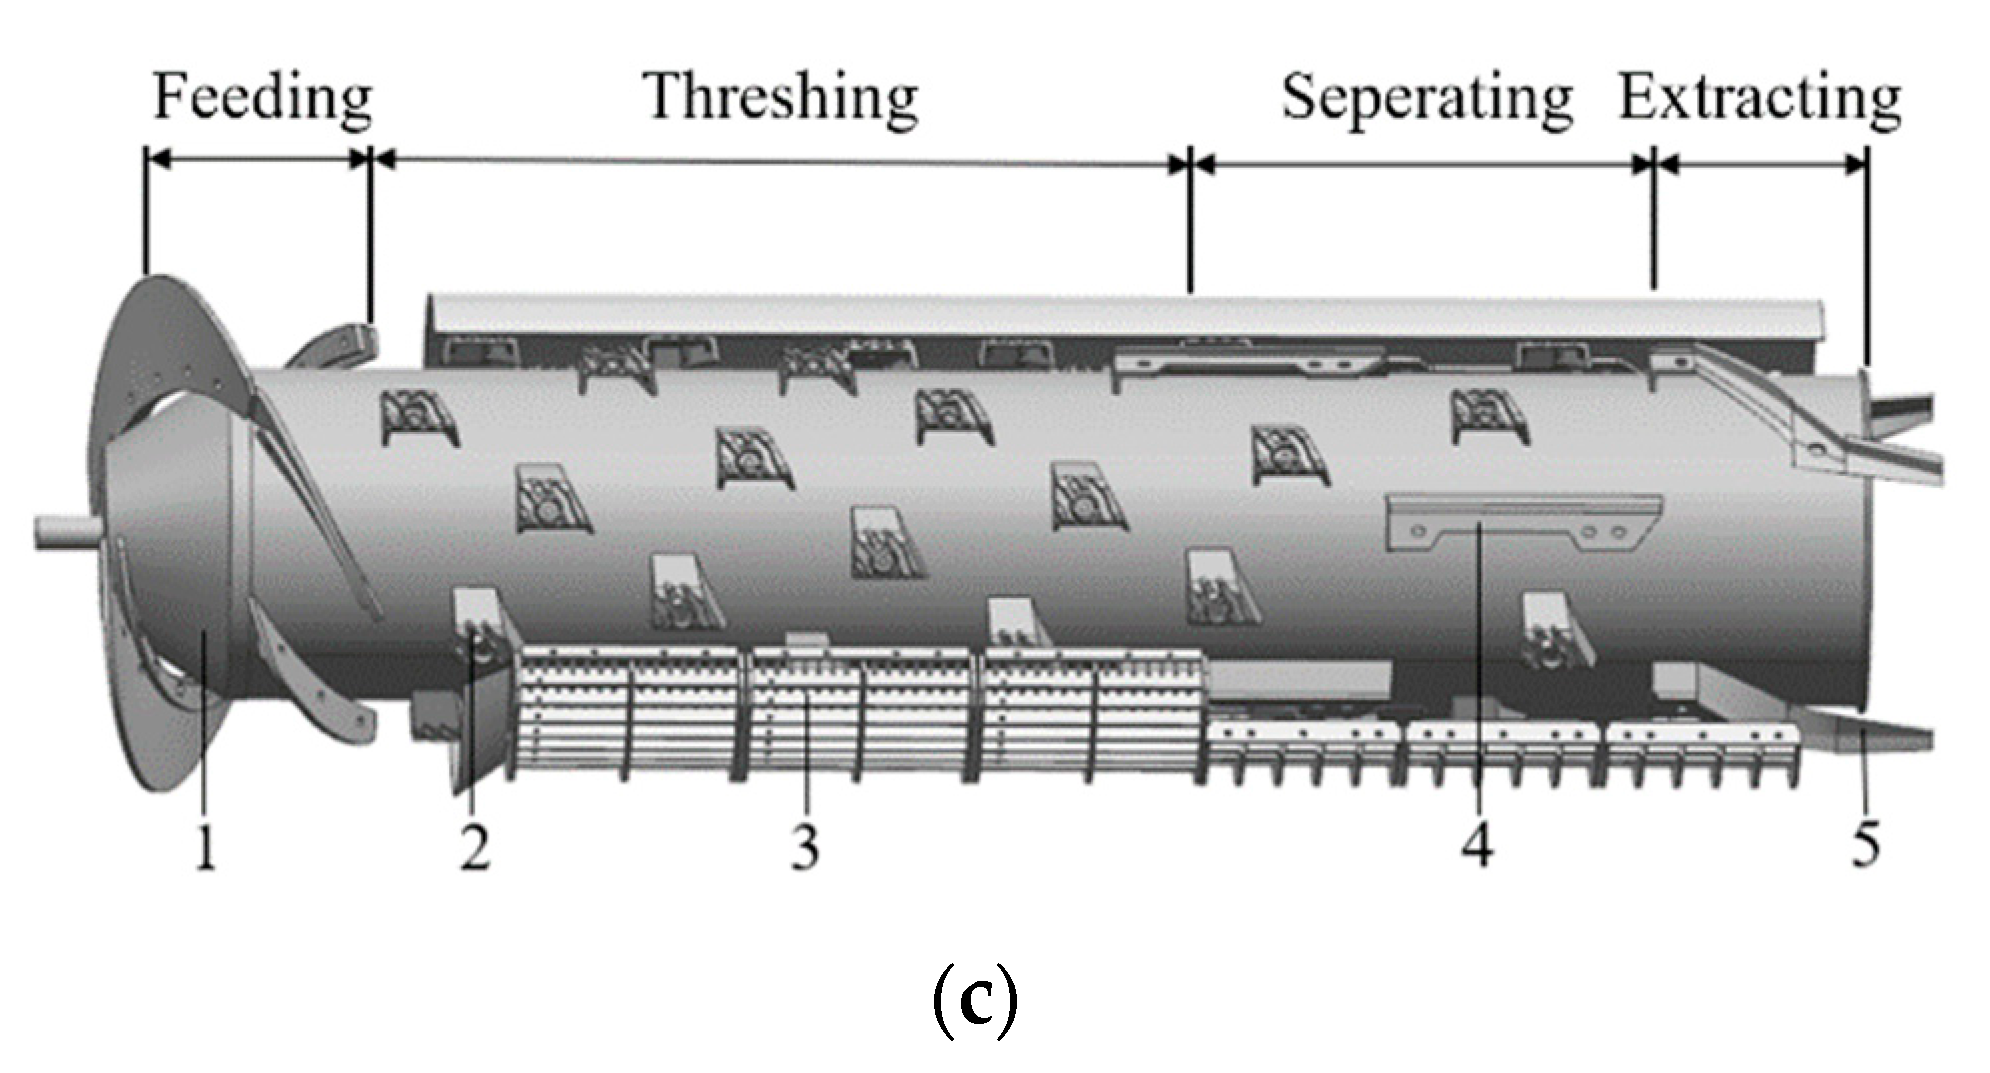
Considering the dynamic balance, the number of threshing element spiral heads was gradually designed as an even number. On large threshing harvesters, usually, 4, 6, and 8 heads are adopted. Combined with the above analysis, the number of spiral heads was 6 on the premise of satisfying dynamic balance and threshing efficiency. The threshing elements were evenly distributed on the cylinder spindle when the diameter was 500 mm, the circumferential space was 261.7 mm, and its installation method adopted the right-handed screw. Combined with theoretical analysis results, the helix angle of the threshing elements was 45°, the pitch was 210 mm, and the length of a spiral was 2510 mm, as shown in Figure 10a. Line (1) was a complete spiral arrangement of threshing elements on the cylinder. Lines (2) and (2#), (3) and (3#), (4) and (4#), (5) and (5#), as well as (6) and (6#) were also a complete spiral; these six spiral lines were regularly arranged with different threshing elements. The specific rules were as follows: Tracks (1), (3) and (3#), as well as (5) and (5#) had 11 arrangements; Tracks (2) and (2#), (4) and (4#), as well as (6) and (6#) had 10 arrangements. According to the design of helix angle and pitch, the rasp bar blocks were finally determined as 45, separating straight rods were 6, and spiral extracting rods were 3; they are consistent with the spiral parameters of the installation position of the threshing element shown in Figure 10a. All threshing elements installed on the cylinder are shown in Figure 10b. The structure of the cylinder is shown in Figure 10c.

4. Simulation of Threshing Process

The threshing device is a core device to complete ear threshing; its arrangement directly affects the working performance of corn grain direct harvesters. In view of the fact that the collision process between the ears and threshing elements is difficult to analyze by existing techniques, in order to investigate the effect of the arrangement density of threshing elements on the ears, EDEM 2018 (DEM Solutions Ltd., Edinburgh, UK) was used to explore the characteristics of trajectory, force, and speed of the ear movement process and to determine the optimal threshing method [27,28].

4.1. Simulation Model and Setting of Boundary Conditions

The model of the threshing device in x_t format was established by Pro/E (an abbreviation of Pro/Engineering, American Parametric Technology Corporation, USA), then imported into the Geomagic panel of DEM with the unit mm. Y-axis negative was set to the gravity acceleration direction with a value of 9.8 m/s2; the rotational speed of the cylinder was set to 350 r/min according to general corn harvester working parameters; other parameters were default. The discrete element model of corn is shown in Figure 11; its characteristic parameters of ears and threshing device materials are shown in Table 3 and Table 4, which cite the literature [29,30]. In order to eliminate the influence of cohesive force caused by the collision between ear models on simulation results, the Hertz-Mindlin no-slip contact model was selected between particle-particle and particle-geometry. The central axis of the cylinder was set to a rotational axis, the factory of corn was added at a spiral feed inlet to simulate actual corn feeding, the corn models were all generated within 0.2 s at a speed of 8 kg/s, and the simulation duration was set to 7 s. The threshing element installation steps were selected as 200, 250, and 300 mm to analyze movement situations of the ear in the device model.

4.2. Analysis of Simulation Results

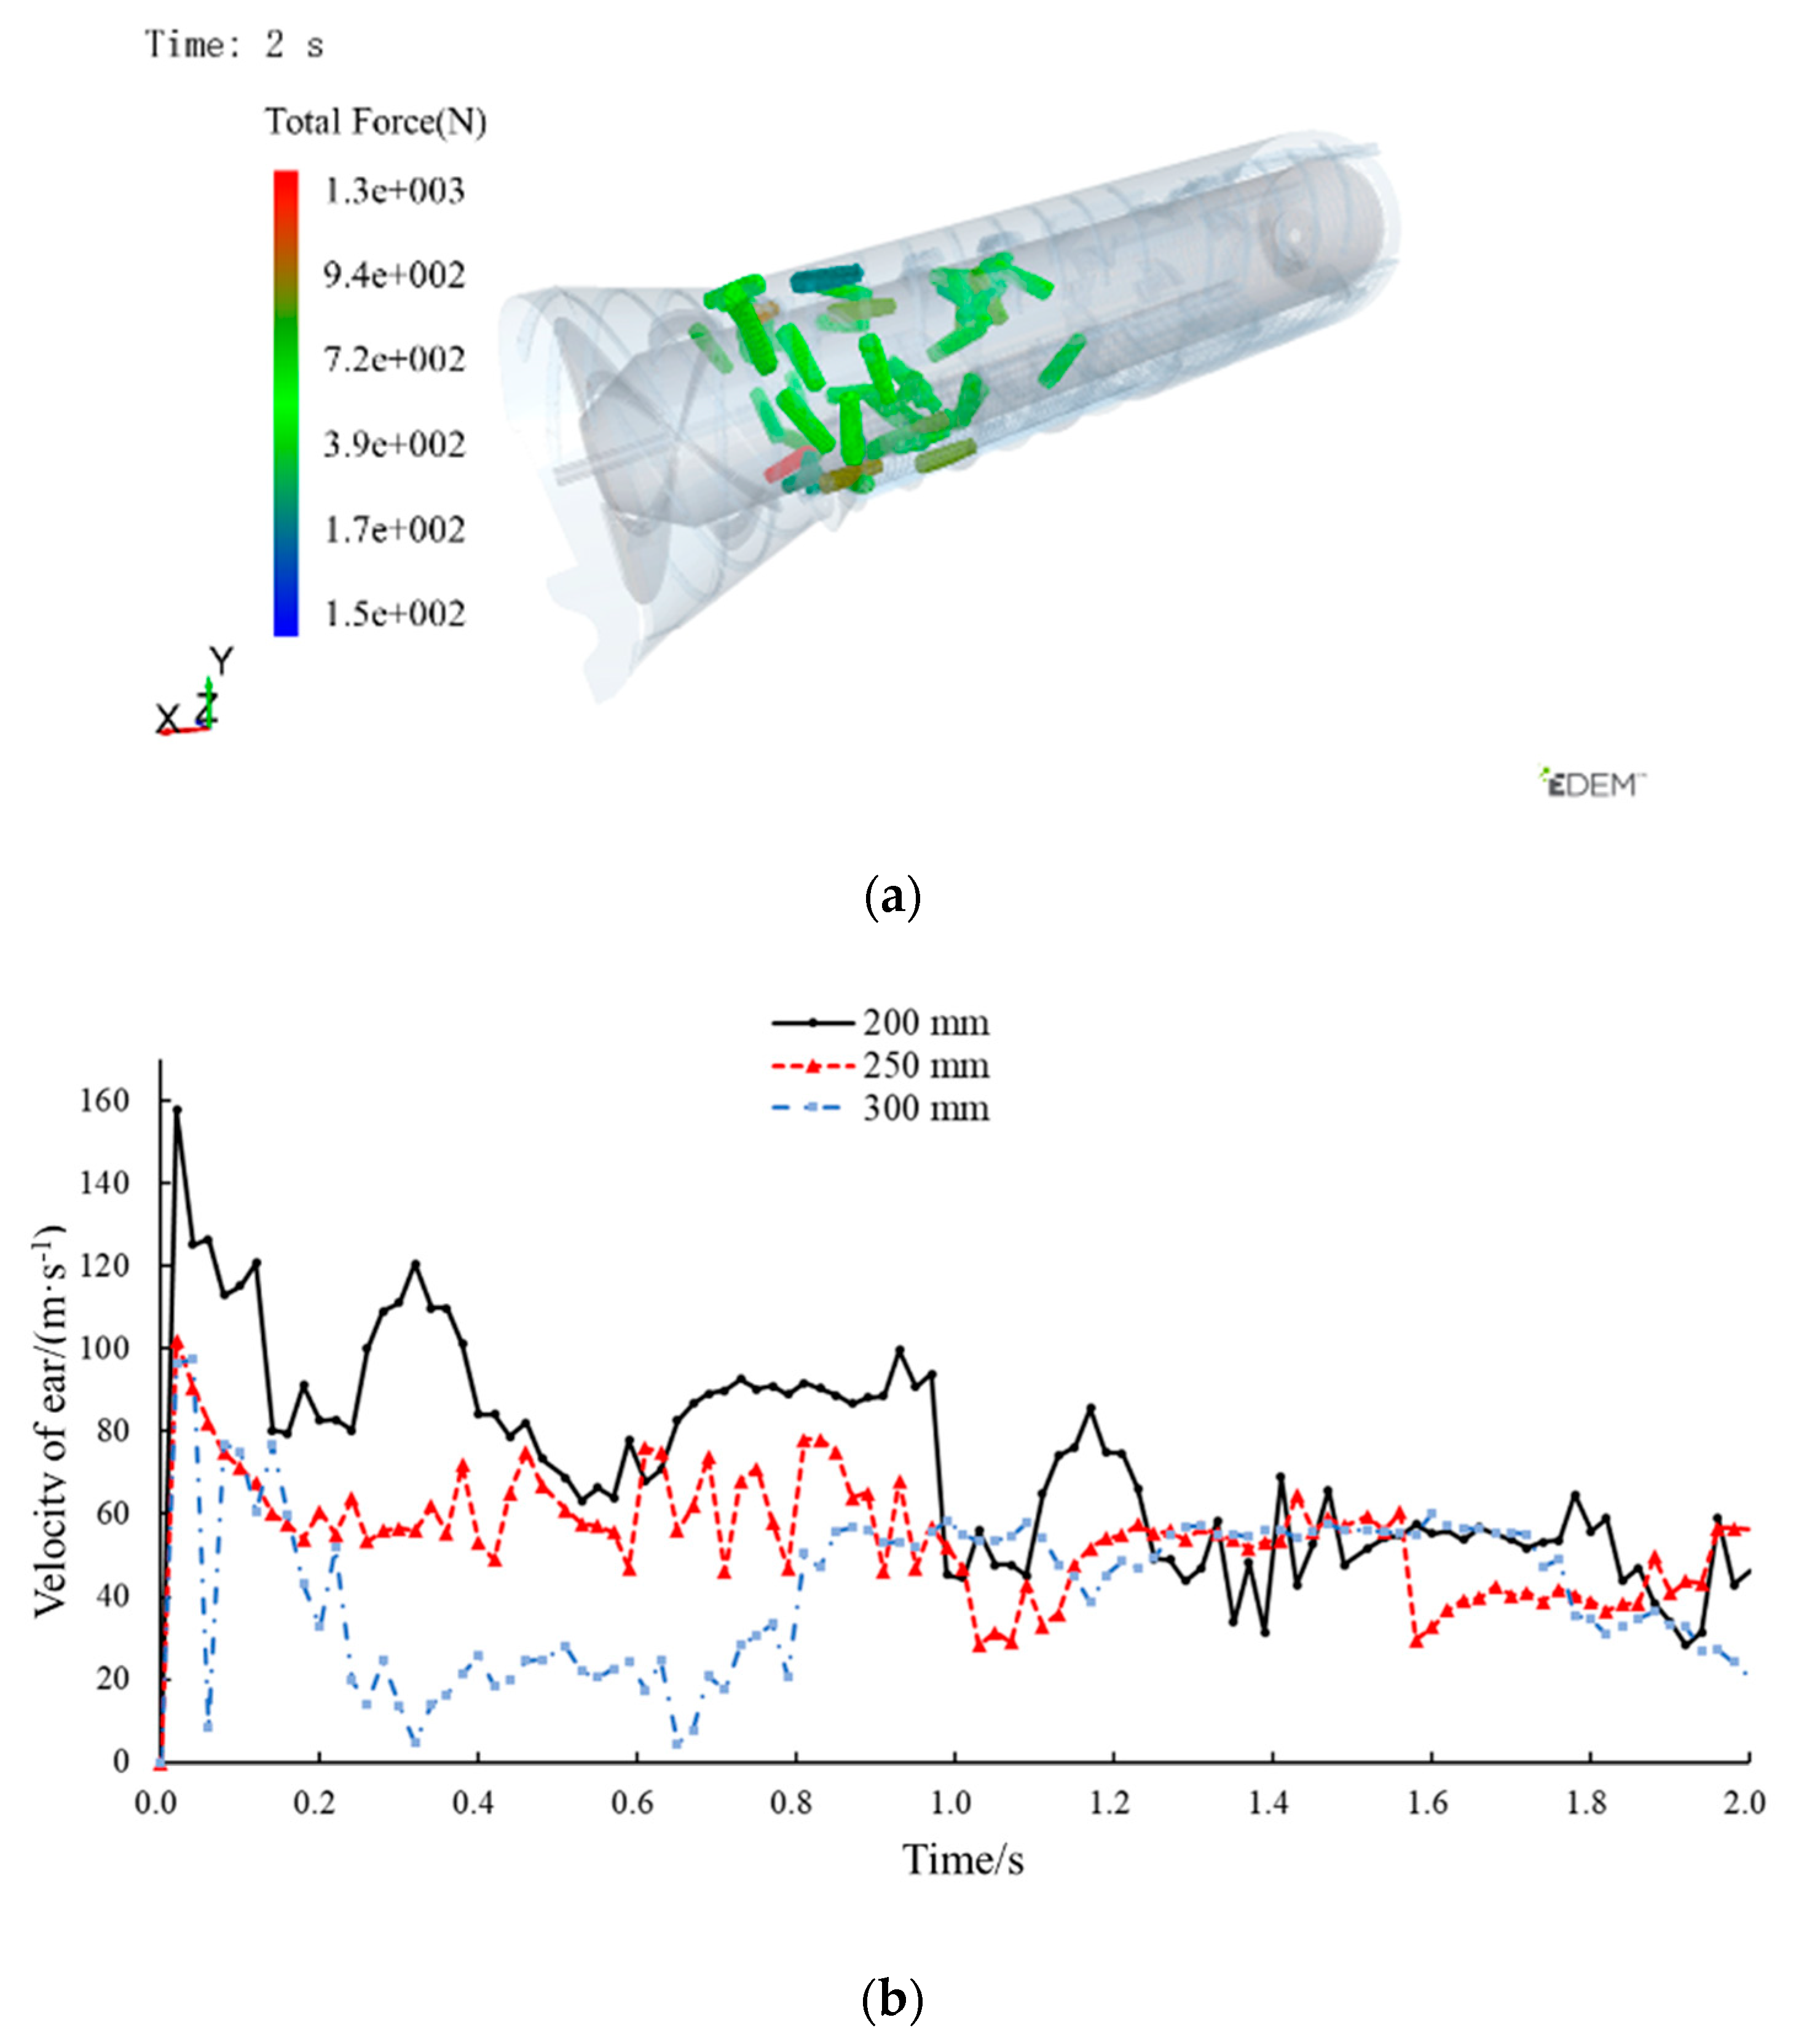
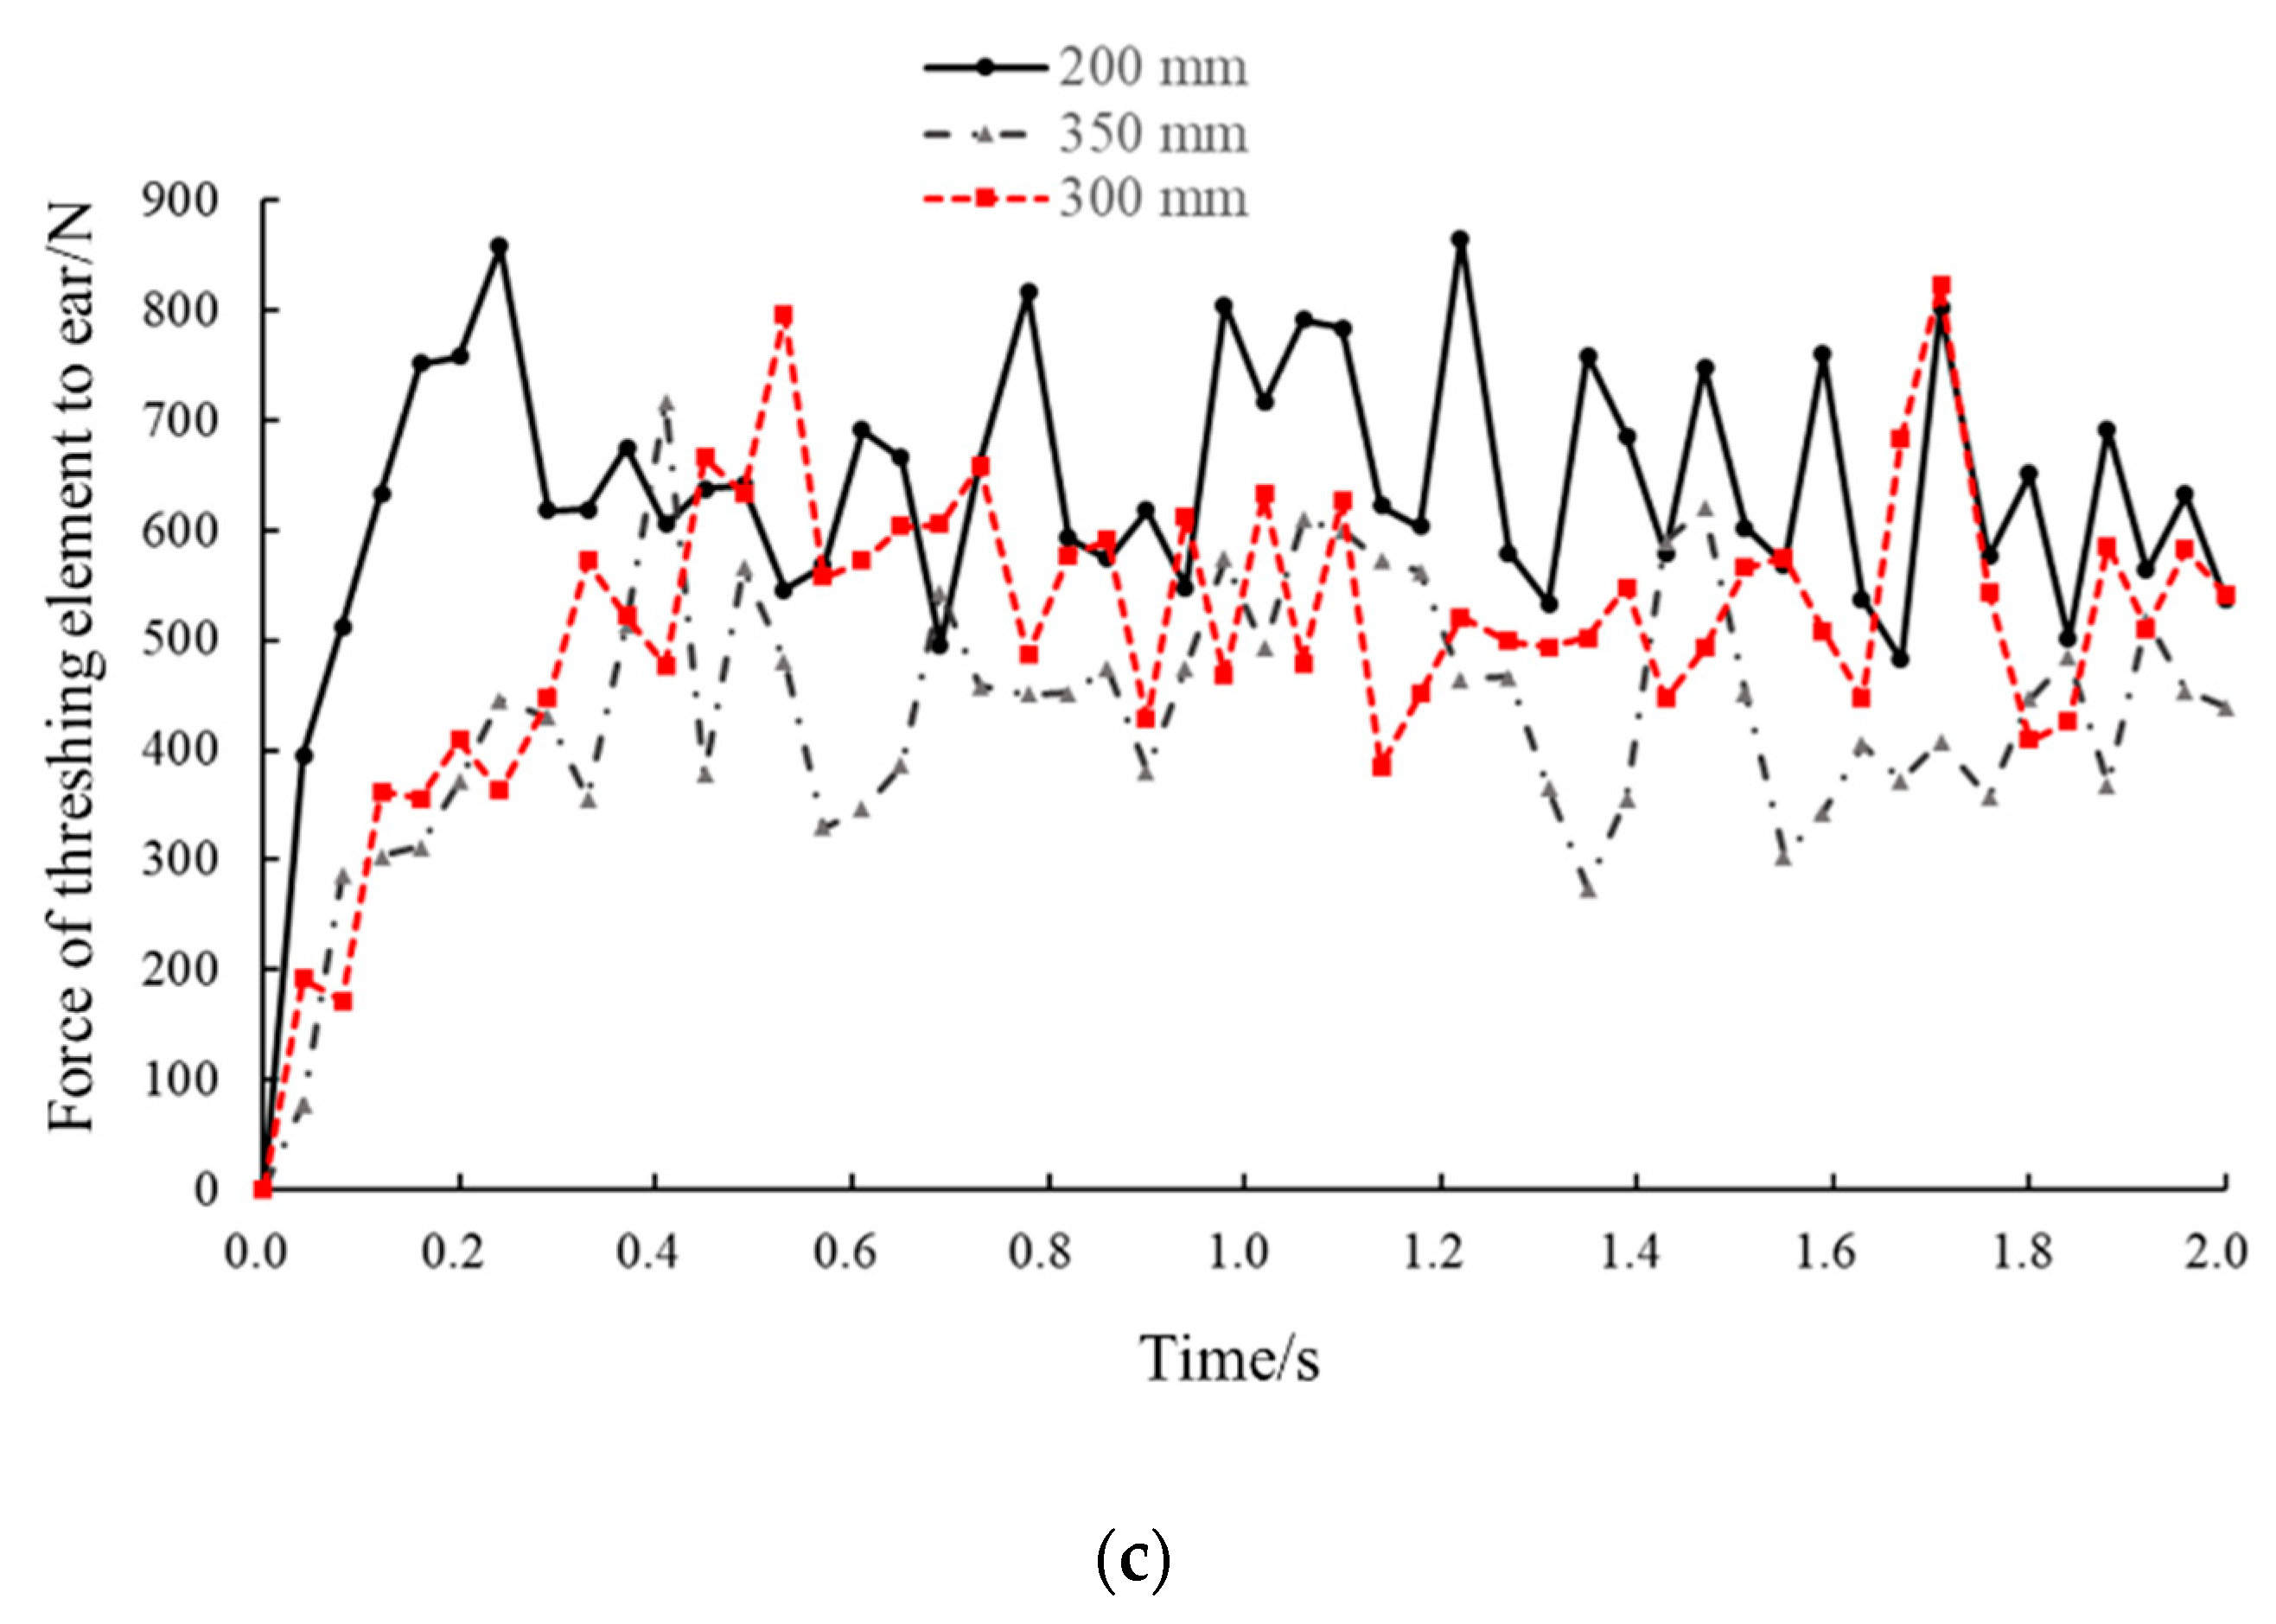
The nephogram of the ear is shown in Figure 12a. The average movement velocity and force of the ear within 0–2 s were extracted, as shown in Figure 12b,c. The simulation results indicate that the average impact force of threshing elements on ears was 629.06 N when the arrangement step was 200 mm, and the force was 428.52 N and 507.96 N when the arrangement steps were 250 and 300 mm, respectively. The maximum movement velocity of ears in the device was 157.83, 102.11, and 96.55 m/s when the arrangement steps were 250 and 300 mm, and its average value was 71.29, 55.04, and 41.86 m/s, respectively. According to Equation (8), the time of the whole threshing process was 6–8 s.
As known in the simulation result, the impact force at the arrangement step of 250 mm was less than that of 200 mm; this indicates this arrangement could reduce the impact force on ears and the BGR. Compared with the arrangement step of 300 mm, the number of threshing elements was less than at 250 mm, and the contact area between the ear and threshing elements decreased. Due to certain slip during a collision, the impact strength of the threshing element on the ear was also reduced; thus, the BGR was reduced. The increase in the number of threshing elements would increase the times of collision and the movement velocity of the ears. When the residence time of the ear in the threshing space decreases, the removal rate will decrease accordingly. The simulation results were consistent with the theoretical analysis. When the arrangement steps and number of the threshing elements are too small, this leads to a decrease in the BGR and uncleared grain. Conversely, when the arrangement step is too small, the density of the threshing element increases and the ears are frequently impacted; thus, the BGR is large. At the same time, it causes a burden on the subsequent cleaning process. Considering BGR and UGR comprehensively, the optimal arrangement step distance was determined as 250 mm.

5. Results and Discussion

5.1. Multiple Factor Experiment Analysis

ANOVA analyses for the BGR and UGR are shown in Table 5 and Table 6, respectively. In Table 5 and Table 6, the p-value represents the probability of an event happening. The p-values were obtained by a statistical significance test; p < 0.05 was significant, p < 0.01 was very significant, p < 0.001 was extremely significant.
From Table 5, the BGR was analyzed as the target, the linear term of C and quadratic terms of C2 were significant to BGR, the factors of clearance between the concave and cylinder B was very significant, and the linear term of A and quadratic terms of A2 were extremely significant. Therefore, the order of factors affecting the BGR are as follows: A > B > C. Since the smaller the BGR, the better the threshing effect, Fu et al. found that the damage rate of frozen corn grain using longitudinal axial threshing cylinder was at a range of 2.634% to 6.114%, and the speed of the threshing cylinder was the strongest factor for the grain damage rate [31].
As shown in Table 6, the UGR was analyzed as the target, the factors of the linear term of B were significant to UGR, the linear term of B and interactive items of AB were very significant to the UGR, and the linear terms of A and quadratic terms of A2 and B2 were extremely significant to the UGR. Judging from the analysis of the test target as the UGR, the order of factors was A > B > C. Obviously, the main effects were significant, and therefore, the null hypothesis is rejected.
According to ANOVA, to test the validity of significance, posthoc tests of the main effects were carried out by SPSS, as shown in Table 7; a method of least significant difference (LSD) was used for the backtesting. (1) As for the BGR, the factor of the A—cylinder rotational speed was extremely significant; B—clearance between the concave and the cylinder, as well as the C—feed amount were very significant. (2) The differences between level −1 (275 r/min) and level 1 (355 r/min), as well as level 0 (315 r/min) and level 1 of factor A had extreme significance. (3) The differences between level −1 (30 mm) and level 0 (35 mm), as well as level −1 (30 mm) and level 1 (40 mm) of factor B were extremely significant. (4) The differences between level 0 (8 kg/s) and level 1 (10 kg/s) of factor C were extremely significant; the differences between level −1 (6 kg/s) and level 1 were very significant. (5) As for the UGR, factor A was extremely significant, and factor B was very significant. (6) Among the differences between level −1 (275 r/min) and level 1 (355 r/min), as well as level 0 (315 r/min) and level 1, factor A had extreme significance. (7) The differences between level 0 (35 mm) and level 1 (40 mm) were extremely significant, and the differences between level −1 (30 mm) and level 0 (35 mm) were significant. The differences between the levels of factor C were not significant.

5.2. Effect of Interaction

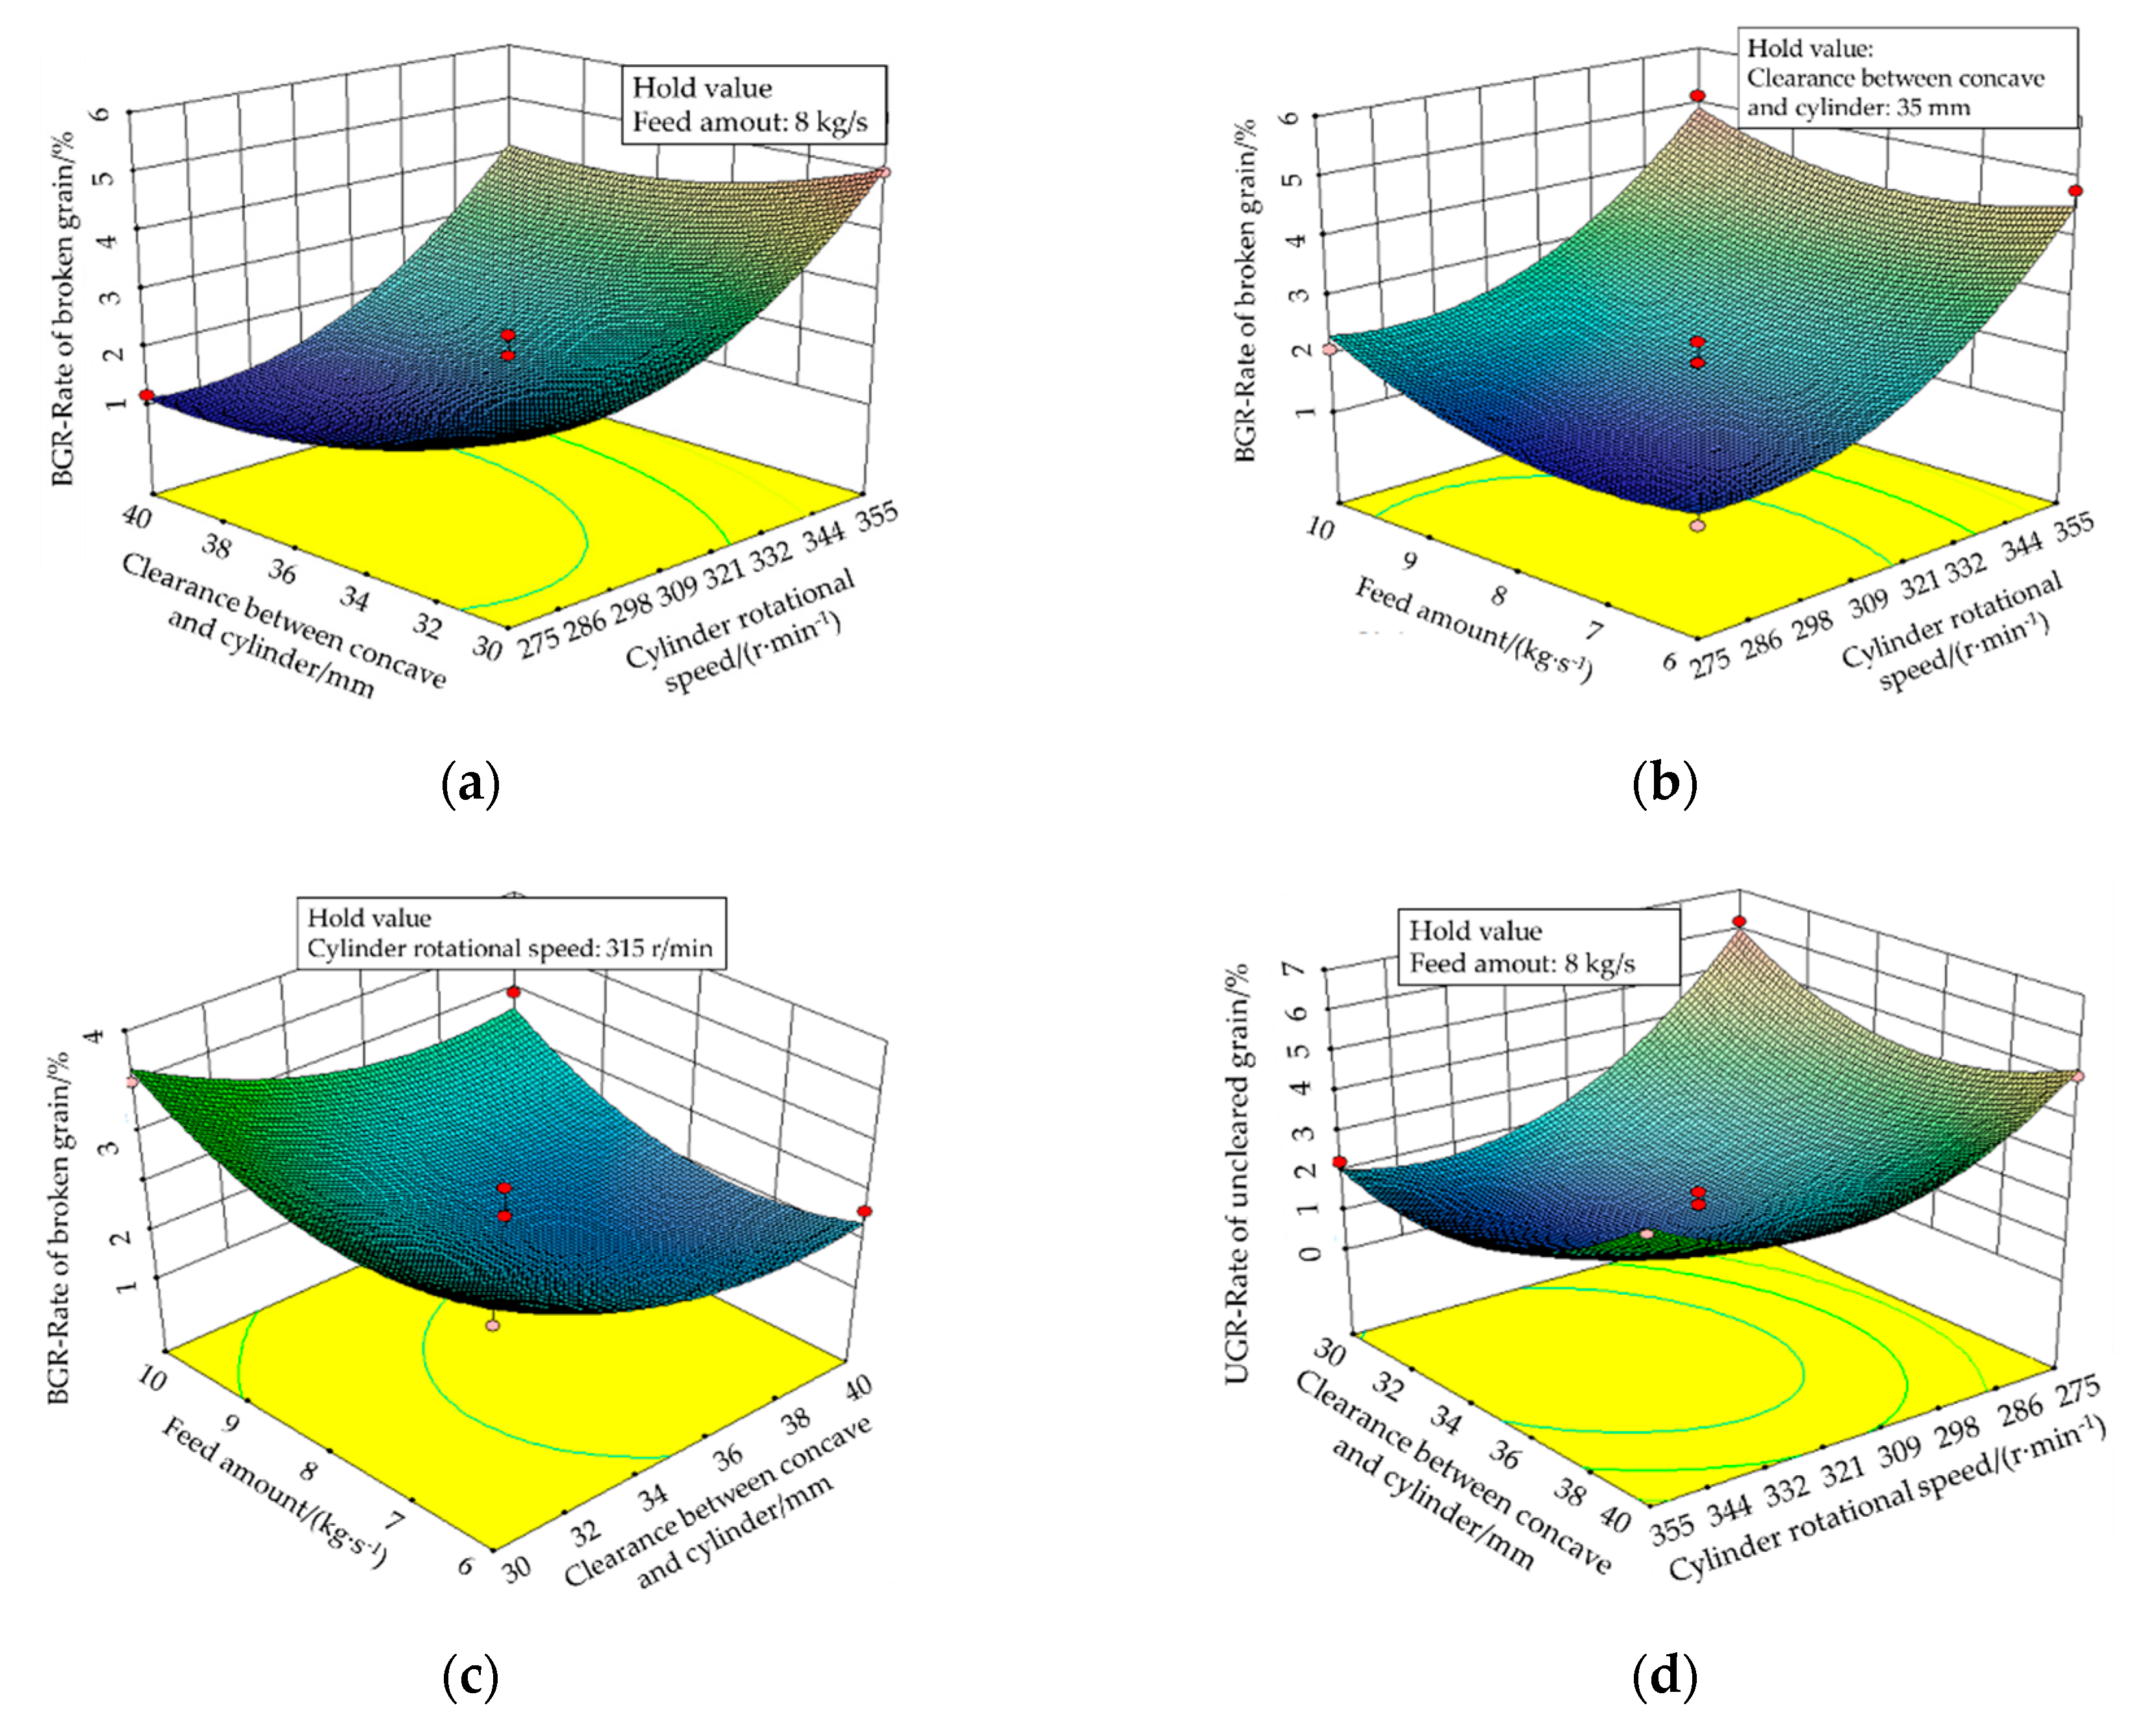
Based on the analysis results of Table 4, the quadratic polynomials and the regression model were analyzed; its initial equation is shown in (15). The regression response surface model of BGR and UGR is shown in Equation (16), and the model of BGR and UGR after removing the terms of nonsignificance is shown in Equation (17). In order to observe certain curvature regions and interactions among the three parameters, the response surfaces of Equations (16) and (17) are established, as shown in Figure 13.
{ B G R = C o n s t 1 + a 11 A + a 12 B + a 13 C + a 14 A B + a 15 A C + a 16 B C + a 17 A 2 + a 18 B 2 + a 19 C 2 U G R = C o n s t 2 + a 21 A + a 22 B + a 23 C + a 24 A B + a 25 A C + a 26 B C + a 27 A 2 + a 28 B 2 + a 29 C 2
{ B G R = 1.74 + 1.44 A 0.54 B + 0.34 C + 0.088 A B 0.14 A C + 0.04 B C + 0.99 A 2 + 0.44 B 2 + 0.56 C 2 U G R = 1.38 1.23 A + 0.36 B + 0.46 C + 0.73 A B + 0.29 A C 0.29 B C + 1.77 A 2 + 1.25 B 2 0.35 C 2
{ B G R = 1.92 + 1.44 A 0.54 B + 0.34 C + 1.01 A 2 + 0.59 C 2 U G R = 1.97 + 1.44 A 0.54 B + 0.34 C + 0.088 A B + 1.02 A 2 + 0.47 B 2
where Const1, Const2 is the constant value of BGR and UGR regression equations, respectively; a11, a12, and a13 are the principal effect coefficients of A, B, and C for BGR, respectively; a14, a15, and a16 are the interaction coefficients of AB, AC, and BC for BGR, respectively; a17, a18, and a19 are the quadratic coefficients of A2, B2, and C2 for BGR, respectively; a21, a22, and a23 are the principal effect coefficients of A, B, and C for UGR, respectively; a24, a25, and a26 are the interaction coefficients of AB, AC, and BC for UGR, respectively; a27, a28, and a29 are the quadratic coefficients of A2, B2, and C2 for UGR, respectively.
As shown in the contour map of Figure 13d, (1) the central color is obviously darker than the other figures and it indicates that the interaction of factors A and B on the UGR is more significant, which is consistent with the measurement results. (2) When the C–feeding amount is constant, the BGR gradually increases with an increase of A–cylinder rotational speed and a decrease of B–clearance between the cylinder and the concave plate. This is because the grain is subjected to an increase of collision force during movement, the impact between the ear, the threshing element, and the concave, and the collision between the ear and ear, leading to an increase of BGR, but not the reduction of UGR. (3) When factor B is a constant, the BGR gradually increases with an increase of factor A and factor C. The UGR first decreases and then increases as factor A increases; this is because the smaller factors A and C are, the smaller the impact force between ears and threshing elements; hence, the UGR is larger. When factor A is larger, the UGR will also increase due to the insufficient threshing of the ears. (4) When factor A is a constant, the BGR decreases with an increase of factor B and a decrease of factor C, while the UGR first decreases and then increases with an increase of factor B; this is because a value of factor B that is too large or too small will lead to a failure of threshing the ears.
In combination with the ANOVA analysis results in Table 5 and Table 6, the effect order of factors like the rotational speed of the cylinder, the clearance of the concave and the cylinder, and feed amount was consistent, just the degree of action was different. Considering the operation parameters of the threshing cylinder should be of as low rates of broken grain and uncleared grain as possible in Equation (18), the numerical optimization of the combination of parameters was a rotational speed of the threshing cylinder of 309.17 r/min, a concave clearance of 35.48 mm, and a feed amount of 6.13 kg/s. The BGR and UGR were 1.65% and 0.96%, respectively; this result still meets the requirement of the corn harvest standard.
{ B G R = minimize U G R = minimize 275 A 315 30 B 40 6 C 10

5.3. Verification Experiment

Based on the above analysis results, in order to verify the accuracy and effectiveness of results, a verification experiment was carried out at the Wuzheng Agricultural Equipment Research Institute in July 2020, the state of experiment as shown in Figures S1 and S2. The test conditions were exactly the same as the previous experiments: the moisture of the corn was 22.7%, the rotational speed of the threshing cylinder was 309.17 r/min, the concave clearance was 35.48 mm, and the feed amount was 6.13 kg/s. The test was repeated three times to obtain the average values; the results are shown in Table 8. The average value of the BGR was 1.24%, which is 0.41% lower than the multiple factors test, and the UGR was 1.33%, which is 0.37% higher than the multiple factors test. This result indicates that the applicability of the optimal parameter combination is reasonable.

6. Conclusions

The states of grain during the threshing process were analyzed, and the structure of the main components of the threshing device was designed based on a force analysis of the main influence factors on threshing performance. The relationship between the structural parameters of the cylinder was studied; the diameter was determined as 500 mm, and the length of the threshing cylinder was determined as 2400 mm, of which the front 1350 mm section had a threshing function and the next 1050 mm section had a separating function. The arrangement of threshing elements was designed with a mode of T-type rasp bar, separating straight rod, and spiral extracting rod with a 6-head spiral pattern and a step distance of 250 mm, according to DEM simulation technology.
The optimum values of working parameters of the threshing device for high moisture content corn were determined through single-factor and multiple-factor experiments. According to range and variance analyses of the test results, the rotational speed of the cylinder was 309.17 r/min, the concave clearance was 35.48 mm, and the feeding rate was 6.13 kg/s. The BGR was 1.24%, and the UGR was 1.33%. This will provide the design method for reducing the grain breakage and uncleared rates for corn harvesters.
Supplementary Materials

The following are available online at https://www.mdpi.com/2076-3417/10/14/4925/s1, Figure S1: Platform of Corn Threshing and Cleaning Experiment, Figure S2: Mixture Distribution After Experiment.

Author Contributions

Conceptualization, X.L.; data curation, X.L. and J.G.; methodology, X.L.; validation, X.L. and J.G.; investigation, X.L. and J.G.; resources, Y.D. and E.M.; writing—original draft preparation, X.L.; writing—review and editing, X.L.; supervision, Y.D. and E.M.; project administration, Y.D. and E.M.; funding acquisition, Y.D. and E.M. All authors have read and agreed to the published version of the manuscript.

Funding

This research was funded by the Major Scientific and Technological Innovation Projects of Shan Dong Province 2018CXGC0217 and the National Natural Science Fund for Distinguished Young Scholars, grant number 51805536.

Acknowledgments

The authors are grateful for the high moisture content corn and experiment field provided by the Shandong Wuzheng Group Co. Ltd.

Conflicts of Interest

The authors declare no conflict of interest.

Nomenclature

ACVertical distance from center of threshing elements A to center of threshing cylinder O, mmpInstallation pitch of threshing elements, mm
BTimes of threshing element passes a point on the concave in unit time p1Rate of grain breaking, %
DDiameter of threshing cylinder, mmp2Rate of unpeeled, %
EfEnergy of new surface caused by grain breaking, JR0Radius of threshing element, mm
EiEnergy of per impact region delivered, J·m−2riRadius of grain, mm
EnEnergy of unit mass grain in unit impact region needed to thresh, J·m−2ttime, mm
FForce of threshing element to ear, NUGMass of nonthreshed grain, g
f(x)Probability density function of threshed grainvVelocity of ear in threshing device, m·s−1
f1Friction between threshing element and ear, NVVelocity of ear from front of concave to rear, m·s−1
f2Friction between concave and ear, NVtVelocity of grain which contact with threshing element, m·s−1
GGravity of ear, 2.94 NxLength of threshing cylinder, mm
g(x)Probability density function of separated of grain-coreBGRRate of broken grain, %
KEnergy dissipation coefficient of collision processUGRRate of uncleared grain, %
LLength of concave, mmαAngle between force N and vertical of ground, (°)
mUnit mass of grain, gβCoefficient of separation, m−1
m1Mass of broken grain of sample, gθAngle between force f1 and gravity G, (°)
m2Mass of remained grain on broken core, gγImpact angle of grain when colliding with threshing element, (°)
MMass of non-threshed grain in unit region, gλCoefficient of threshing, m−1
M1Mass of sample grain, gμ1Friction coefficient of threshing element
M2Mass of grain in test region, gμ2Friction coefficient of concave
NForce of concave to ear, N--
nNumber of threshing element screw head --
NiTimes of impact--
PPower of driving threshing cylinder, kW--

References

  1. The People’s Republic of China. China Statistical Yearbook 2019; China Statistics Press: Beijing, China, 2019. Available online: http://www.stats.gov.cn/tjsj/ndsj/2019/indexch.htm (accessed on 15 March 2020).
  2. Chen, Z.; Hao, F.; Wang, F.; Su, W.; Cui, J. Development of technology and equipment of corn harvester in China. Trans. Chin. Soc. Agric. Mach. 2012, 43, 44–50. [Google Scholar] [CrossRef]
  3. Ai, G.; Jian, Y.; Zhao, Z.; Ji, Z.; Ru, S. Discuss about the current situation and future of corn harvest machinery about domestic and abroad. J. Agric. Mech. Res. 2016, 38, 251–256. [Google Scholar] [CrossRef]
  4. Yu, B.; Zi, Y.; Duan, G. Improvement and development trend of corn harvester technology. Agric. Equip. Veh. Eng. 2010, 7, 3–6 and 32. [Google Scholar] [CrossRef]
  5. Guo, J.; Du, Y.; Wu, Y.; Mao, E. Research status and development trend of corn harvester threshing device. In 2019 ASABE Annual International Meeting; American Society of Agricultural and Biological Engineers: Boston, MA, USA; St. Joseph, MI, USA, 2019. [Google Scholar] [CrossRef]
  6. Xin, L.; Yu, L.; Hang, G.; Zhao, Q.; Fu, M.; Lian, G. Bionic threshing process analysis of seed corn kernel. Trans. Chin. Soc. Agric. Mach. 2011, 42, 99–103. [Google Scholar]
  7. Zhong, T.; Yao, L.; Li, X.; Hong, L.; Jing, Y. Experiment and evaluating indicators of wheat threshing and separating on test-bed of longitudinal axial-threshing unit. Trans. Chin. Soc. Agric. Eng. Trans. CSAE 2012, 28, 14–19. [Google Scholar] [CrossRef]
  8. Zhong, T. Theoretical and Experimental Investigations of Cereals Threshing and Separation on Tangential-Longitudinal Axial Device; Jiangsu University: Zhenjiang, China, 2013. [Google Scholar]
  9. Zhong, T.; Yao, L.; Zhan, Z.; Li, X.; Hong, L. Test and analysis of wheat entrainment loss for tangential-longitudinal-axial combine harvester. Trans. Chin. Soc. Agric. Eng. Trans. CSAE 2012, 28, 11–16. [Google Scholar] [CrossRef]
  10. Xin, L.; Kang, W. Design and experiment of bionic discrete devices based on corn threshing system. Chem. Eng. Trans. 2016, 51, 127–132. [Google Scholar] [CrossRef]
  11. Valdas, K.; Daninus, S.; ALbinas, A.; Aurelija, K.; Darius, J. Corn ear threshing performance of filler-plate-covered threshing cylinders. Mechanics 2017, 23, 714–722. [Google Scholar] [CrossRef] [Green Version]
  12. Valdas, K.; Dainius, S.; Aurelija, K.; ALbinas, A.; Darius, J. Dynamic indicators of a corn ear threshing process influenced by the threshing-separation unit load. Mechanics 2018, 24, 412–421. [Google Scholar] [CrossRef] [Green Version]
  13. Dainius, S.; Edvinas, P.; Liudvikas, S.; Egle, J.; Aurelija, K.; Sigitas, P. Concave design for high-moisture corn ear threshing. Mechanics 2018, 24, 80–91. [Google Scholar] [CrossRef]
  14. Ya, Y.; Hai, Z.; Hong, F. Modeling method of corn ears based on particles agglomerate. Trans. Chin. Soc. Agric. Eng. Trans. CSAE 2012, 28, 167–174. [Google Scholar]
  15. Jian, Y.; Hong, F.; Hong, L.; Yanfang, S. Application of discrete element method to research and design of working parts of agricultural machines. Trans. Chin. Soc. Agric. Eng. Trans. CSAE 2005, 21, 1–6. [Google Scholar] [CrossRef]
  16. Zheng, C.; Carl, W.; Eric, V.; Kingsly, A. Determination of material and interaction properties of maize and wheat kernels for DEM simulation. Biosyst. Eng. 2019, 195, 208–226. [Google Scholar] [CrossRef]
  17. Pužauskas, E.; Steponavičius, D.; Jotautienė, E.; Petkevičius, S.; Kemzūraitė, A. Substantiation of concave crossbars shape for corn ears threshing. Mechanika 2016, 22, 353–361. [Google Scholar] [CrossRef]
  18. Shahbazi, F.; Shahbazi, R. Mechanical damage to corn seeds. Cercet. Agron. Mold. 2018, 51, 1–12. [Google Scholar] [CrossRef] [Green Version]
  19. Bajus, P.; Mraz, M.; Rigo, I.; Findura, P.; Fürstenzeller, A.; Kielbasa, P.; Malaga-Tobola, U. The influence of drying temperature and moisture of corn seeds planted on their damage. Agric. Eng. 2019, 23, 5–12. [Google Scholar] [CrossRef] [Green Version]
  20. Marvin, R.P.; Mukti, S.; Vijay, S. Measurement and maintenance of corn quality. In Corn; Michelle, M., Greg, G., Eds.; AACC International Press: Cambridge, MA, USA, 2019; pp. 165–211. [Google Scholar] [CrossRef]
  21. GB/T 21961-2008. Test Methods for Maize Combine Harvester; Administration of Quality Supervision, Inspection and Quarantine of People’s Republic of China; Standardization Administration of China: Beijing, China, 2008.
  22. GB/T5982-2017. Thresher-Test Method; Administration of Quality Supervision, Inspection and Quarantine of People’s Republic of China; Standardization Administration of China: Beijing, China, 2017.
  23. Renata, F.; Jadwiga, K.; Slawomir, F.; Ryszard, G.; Miroslaw, K. Bis(4,4′-dimethyl-2, 2′-bipyridine) oxidovanadium (IV) sulfate dehydrate: Potential candidate for controlling lipid metabolism. BioMed Res. Int. 2017, 6950516, 1–5. [Google Scholar] [CrossRef]
  24. Jestinah, M.; Mahachie, J.; Francois Van, L.; Elena, S.G.; Kristel Van, S. A robustness study of parametric and nonparametric tests in model-based multifactor dimensionality reduction for epistasis detection. BioData Min. 2013, 6, 1–17. [Google Scholar] [CrossRef] [Green Version]
  25. Teollope, J.R. A mathematical model of the threshing process in a conventional combine-thresher. J. Agric. Eng. Res. 1982, 27, 119–130. [Google Scholar] [CrossRef]
  26. Gregory, J.M. Combine model for grain threshing. Math. Comput. Model. 1988, 11, 506–509. [Google Scholar] [CrossRef]
  27. Zhao, X.; Zheng, P.; He, L.; Tao, M. Cutting edge preparation using the discrete element software EDEM. J. Braz. Soc. Mech. Sci. Eng. 2020, 42, 1–10. [Google Scholar] [CrossRef]
  28. Yun, X.; Zhi, L.; Dong, Z.; Tao, C.; Song, S.; Ke, L.; Li, Y. Calibration method of contact characteristic parameters for corn seeds based on EDEM. Trans. Chin. Soc. Agric. Eng. 2016, 32, 36–42. [Google Scholar] [CrossRef]
  29. Li, W.; Rui, L.; Bao, W.; Zhen, W.; Zhen, D. Determination of the coefficient of rolling friction of an irregularly shaped maize particle group using physical experiment and simulations. Particuology 2018, 38, 185–195. [Google Scholar] [CrossRef]
  30. Kovács, Á.; Kerényi, G. Modeling of corn ears by discrete element method (DEM). In ECMS 2017; Zita, Z.P., Péter, H., Kata, V., Peéter, T.Z., Ágnes, V., János, P.R., Eds.; European Council for Modeling and Simulation: Budapest, Hungary, 2017; pp. 355–361. [Google Scholar] [CrossRef]
  31. Jun, F.; Hai, Y.; De, Z.; Zhi, C.; Lu, R. Multi-objective optimization of process parameters of longitudinal axial threshing cylinder for frozen corn using RSM and NSGA-II. Appl. Sci. 2020, 10, 1646. [Google Scholar] [CrossRef] [Green Version]
Figure 1. Zheng single 958 maize sample.
Applsci 10 04925 g001
Figure 2. Test bench of the threshing device.
Applsci 10 04925 g002
Figure 3. Diagram of threshing elements. (a) Diagram of rasp bar; (b) diagram of straight separating bar; (c) diagram of spiral excretion rod.
Applsci 10 04925 g003
Figure 4. Model of maize threshing.
Applsci 10 04925 g004
Figure 5. Change rules of force F with angle α when μ1 and μ2 are different values.
Applsci 10 04925 g005
Figure 6. Change rule of force F of an ear with friction coefficient μ1 and μ2 when α is 54.5°.
Applsci 10 04925 g006
Figure 7. Influence of the number of spirals and the installation pitch of the threshing elements on the length of a single helix.
Applsci 10 04925 g007
Figure 8. Model of the contact surface between grain and threshing. 1—grain; 2—threshing element; A—barycenter of grain; B—barycenter of another grain; C—distance between the center of cylinder O and line AB; γ—impact angle of grain when colliding with the threshing element (°).
Applsci 10 04925 g008
Figure 9. Relationship between the number of threshing elements and rate of uncleared grain.
Applsci 10 04925 g009
Figure 10. Installation position of threshing elements and the structure of the threshing cylinder. (a) Distribution of threshing element installation seat. Note: ▲ is the installation position of threshing elements. (b) Diagram of the installation position of threshing elements; (c) diagram of the threshing cylinder. 1—spiral feeding inlet, 2—rasp bar, 3—concave, 4—separating straight rod, 5—spiral extracting rod.
Applsci 10 04925 g010aApplsci 10 04925 g010b
Figure 11. Discrete element model of corn ear.
Applsci 10 04925 g011
Figure 12. Simulation results of the ear threshing process. (a) Nephogram of the ear in the threshing device; (b) velocity of the ear in the threshing device; (c) force of ear in the threshing device.
Applsci 10 04925 g012aApplsci 10 04925 g012b
Figure 13. Response surface diagrams of interaction: (a) Interaction of A–B on BGR; (b) interaction of A–C on BGR; (c) interaction of B–C on BGR; (d) interaction of A–B on UGR; (e) interaction of A–C on UGR; (f) interaction of B–C on UGR.
Applsci 10 04925 g013aApplsci 10 04925 g013b
Table 1. Levels of parameters.
LevelsA—Cylinder Rotational Speed/(r·min−1)B—Clearance between Concave and Cylinder/(mm)C—Feed Amount/(kg·s−1)
−1275306
0315358
13554010
Table 2. Test result of the multiple-factor test.
Test NumberA/(r·min−1)B/(mm)C/(kg·s−1)BGR/(%)UGR/(%)
1−1−102.746.18
21−105.012.26
3−1101.145.08
41103.764.10
5−10−11.174.03
610−14.770.98
7−1012.094.04
81015.122.15
90−1−12.790.84
1001−11.982.47
110−113.422.66
120112.773.14
130002.211.35
140001.671.05
150001.331.86
160001.621.10
170001.851.54
Table 3. Parameters of materials.
AttributesEar of Corn50 Mn Structural Steel
Poisson’s ratio0.40.28
Shear modulus/MPa1.37 × 1023.50 × 104
Density/(g·m−3)1.1977850
Table 4. Parameters of mutual materials.
Contact FormCorn–CornCorn–50 Mn Structural Steel
Restitution coefficient0.1820.60
Static friction coefficient0.0340.3
Dynamic friction coefficient0.0020.01
Table 5. ANOVA analysis for the rate of broken grain (BGR).
Variance SourceSum of Squares of DeviationsFreedom fF Valuep-ValueSignificance Marker
Model26.81919.990.0003***
A16.591111.32<0.0001***
B2.32115.580.0055**
C0.9016.070.0432*
AB0.03110.210.6640
AC0.08110.550.4843
BC0.006410.0430.8417
A24.10127.530.0012***
B20.8115.460.0521
C21.3419.000.0199*
Residual1.047
Lack of Fit0.6231.980.2598
Pure Error0.424
Cor Total27.8516
Note: A is cylinder rotational speed/(r·min−1); B is clearance between concave and cylinder/mm; C is feed amount/(kg·s−1); * is significant (p < 0.05); ** is very significant (p < 0.01); *** is extremely significant (p < 0.001); F is Fischer’s variance ratio; p is probability value.
Table 6. ANOVA analysis for the rate of uncleared grain (UGR).
Variance SourceSum of Squares of DeviationsFreedom fF Valuep-ValueSignificance Marker
Model38.66933.65<0.0001**
A12.10194.82<0.0001***
B1.0217.950.0258*
C1.68113.190.0084**
AB2.16116.930.0045**
AC0.3412.640.1485
BC0.3312.590.1516
A213.251103.78<0.0001***
B26.59151.640.0002***
C20.5314.130.0817
Residual0.897
Lack of Fit0.4531.350.3775
Pure Error0.444
Cor Total39.5516
Note: A is cylinder rotational speed/(r·min−1); B is clearance between concave and cylinder/mm; C is feed amount/(kg·s−1); * is significant (p < 0.05); ** is very significant (p < 0.01); *** is extremely significant (p < 0.001); F is Fischer’s variance ratio; p is probability value.
Table 7. Results of posthoc tests of ANOVA.
IndexesProjectsSignificant of Main FactorsLevelsp Values
BGRA–cylinder rotational speed/(r·min−1)0.000−100.081
10.000
0−10.081
10.000
1−10.000
00.000
B–clearance between concave and cylinder/mm0.001−100.000
10.001
0−10.000
10.950
1−10.001
00.950
C–feed amount/(kg·s−1)0.005−100.164
10.019
0−10.164
10.001
1−10.019
00.001
UGRA–cylinder rotational speed/(r·min−1)0.000−100.000
10.000
0−10.000
10.136
1−10.000
00.136
B–clearance between concave and cylinder/mm0.004−100.024
10.130
0−10.024
10.001
1−10.130
00.001
C–feed amount/(kg·s−1)0.097−100.109
10.059
0−10.109
10.473
1−10.059
00.473
Table 8. Verification experiment results.
Indexes123Average Values
BGR/%1.121.341.271.24
UGR/%1.261.421.311.33