Featured Application
Microencapsulation is a method for stabilizing vitamins, and the absorption and bioavailability of microencapsulated vitamins have not been evaluated for pigs. The current study shows that microencapsulation technology can improve the bioavailability of vitamins. This study confirmed that the National Research Council (NRC) recommendations for vitamins are insufficient to meet the pigs’ needs during fast growth, as additional vitamins are apparently necessary. Higher concentrations of vitamins in the pig diets improved the growth performance of the piglets. A withdrawal of 25% of the vitamins in commercial vitamin formulations for post-weanling pigs did not produce any deleterious effects on performance.
Abstract
The objective of this study was to quantify the relative bioavailability of microencapsulated vitamins A and E in nursery pigs and compare the effects of vitamin forms and vitamin levels on the plasma vitamin content and growth performance of weaned piglets. In experiment (Exp.) 1, 12 nursery pigs (fitted with jugular catheters) were supplied at 0 h with non-microencapsulated or microencapsulated vitamin A and E. Blood samples were collected at 1, 3, 6, 9, 12, 16, 18, 21, 24, 27, 30, 36, 48, and 72 h after feeding to compare the bioavailability of oral vitamins A and E. In Exp. 2, a total of 216 crossbred weaned piglets were assigned to six treatments. This experiment was a 2 × 3 factorial arrangement, with two factors for vitamin forms (non-microencapsulated and microencapsulated) and three factors for vitamin levels (the National Research Council level of vitamins, 75% commercial recommendations of vitamins (CRV) level, and a 100% CVR level). In Exp. 1, the relative bioavailability of microencapsulated vitamin E was significantly greater than that of non-microencapsulated vitamin E. In Exp. 2, the pigs fed diets containing 75% or 100% CRV levels of vitamins increased their growth performance and plasma vitamin concentrations compared to the control group. In conclusion, microencapsulation can improve the bioavailability of vitamins, and supplementation with high levels of vitamins was able to improve the growth performance of the piglets.
1. Introduction
In the 21st century, microencapsulation technology has been extensively applied to nutrients delivery. Microencapsulation is a process that involves the entrapment of a substance within a continuous film of a polymeric material [1]. Microencapsulation provides a physical barrier to protect substances that are vulnerable to external environments, e.g., acidity, alkalinity, heat, oxidation, or moisture, before nutrient release to improve the stability of the nutrients [2]. Vitamins are a large class of drugs in this group and have received much attention [3,4,5]. Microencapsulated vitamins are now available as vitamin sources for feed plants, and microencapsulated vitamins have greater stability during storage and processing [3,4,5]. Moreover, microencapsulated vitamins target their release in the small intestine to improve absorption efficiency [6] and regulate vitamin concentrations in the blood through a slow and controlled release in the gastrointestinal tract [6,7]. However, there is a lack of information on the absorption and bioavailability of microencapsulated vitamins in pigs. There are numerous publications related to microencapsulation, but these studies are limited for real industrial applications. This is mostly due to the cost and the feasibility of the process on a large scale. The variety of suitable encapsulants has been even further restricted by their composition and regulations. For these reasons, evaluating the bioavailability of commercially available microencapsulated vitamins for pigs is extremely urgent.
Vitamins play many essential roles in the normal metabolism and maintenance of body tissue. Vitamin A is essential for the protection and regeneration of mucous membranes; protection of the epithelium, ovulation, and implantation; embryonic and fetal development; and resistance against infection [3,8,9]. The main function of vitamin D is the regulation of calcium and phosphorus absorption; thus, vitamin D is important for bone mineralization [8]. Vitamin E is a biological fat-soluble antioxidant at the cellular membrane level, and vitamin K contributes to blood clotting and coagulation [6,8]. T Water-soluble vitamins are generally required as co-enzymes and are involved in the metabolism of energy (e.g., vitamin B2 and niacin), amino acid (e.g., vitamin B6 and folic acid), carbohydrates (e.g., vitamin B1), and fat (e.g., biotin and pantothenate) [8], whereas vitamin B12, as a coenzyme, is involved in the de novo synthesis of labile methyl groups and their transfer to homocysteine to form methionine. This vitamin is also important in the methylation of uracil to form thymine, which is converted into thymidine and used for the synthesis of DNA [8]. The National Research Council (NRC) has established the recommended requirements of vitamins for pigs, but over time, the NRC requirements of vitamins for pig have not changed much [10]. However, pigs have the potential to grow rapidly and may need more vitamins. Therefore, the concentration of vitamins in pig diets has generally been fortified far beyond NRC recommendations. Adding some vitamins beyond NRC levels in the diet has increased the average daily gain and feed intake of nursery pigs [10,11].
We hypothesized that microencapsulation technology can improve the bioavailability of vitamins and that increasing dietary vitamin levels would improve the performance and plasma vitamin concentrations in piglets. Therefore, the objectives of this study were to quantify the relative bioavailability of microencapsulated vitamin A and E in nursery pigs and determine the effects of vitamin form and level on the growth performance and plasma vitamin concentration of weaned piglets.
2. Materials and Methods
The present experiments were reviewed and approved by the institution of Animal Experimental Ethical Inspection Committee of the China Agricultural University (AW19050202–3). These studies were conducted in the Metabolism Laboratory of the Ministry of Agriculture and Rural Affairs Feed Industry Centre (China Agricultural University, Beijing, China), and the Fengning Swine Research Unit of Academician Workstation at Chengdejiuyun Agricultural & Livestock Co., Ltd., Chengde, China.
2.1. Animals, Housing, and Sample Collection
The swine in the present study were selected from the herd at the Swine Research Unit of China Agricultural University. The pigs were housed indoors throughout the study. In experiment 1 (Exp. 1) a total of twelve healthy castrated male piglets (from 3 litters, Duroc × Landrace × Yorkshire) were selected one week after weaning (weaned at 28 d of age). These pigs subsequently adapted to a specific diet (Table 1), which did not contain vitamin A (retinyl acetate) and vitamin E (D, L-α-tocopherol acetate). Seven days before the start of the experiment (48 d of age for the pig), the piglets were individually housed in stainless steel metabolism crates (cage size: 1.4 × 0.7 × 0.6 m) and adapted to twice daily meal feeding based on 4% of their body weight (BW). Seven days before the beginning of the experiment, the pigs were catheterized in the jugular vein by inserting a needle into the vein, and then inserting the catheter through the needle. Once the catheter was in place, the needle was withdrawn, and the catheter was taped to the pig’s neck. This procedure was modified from that of van Kempen et al. [12]. The piglets were anesthetized using Zoletil (6 mg/kg BW; Virbac Laboratories, Nice, France), and Butorphanol (200 μg/kg BW; Intervet International, Boxmeer, The Netherlands). After catheterization, Butorphanol was administered once as a painkiller, and Depocillin (0.05 mL/kg BW; MSD Animal Health, Wellington, New Zealand) was intramuscularly administered for 3 consecutive days to prevent infections. Catheters were flushed daily with heparinized sterile saline (Sinopharm Chemical Reagent Co., Ltd., Shanghai, China). Before the beginning of the experiment, all pigs were fasted for 12 h to assure that the pigs would be hungry, allowing the test meal to be consumed within a shorter period. The average BW of the pigs was 20 ± 1 kg at the beginning of the experiment.

Table 1.
Composition of the diet in the experimental 1 (as-fed basis).
Twelve pigs with a starting age of 56 d were allocated into 2 groups. Pigs in the non-microencapsulated group received a diet with non-microencapsulated 13,500 IU/kg retinyl acetate and 30 mg/kg D, L-α-tocopherol acetate. The pigs in the microencapsulated group received a diet with microencapsulated 13,500 IU/kg retinyl acetate and 30 mg/kg D, L-α-tocopherol acetate. These vitamins were provided by Wellroad Animal Health Co. Ltd., Taiyuan, China. Immediately before feeding of the test meal, the blood sample at 0 h was obtained from all pigs in the experiment. The time when providing vitamins A and E was set as time 0. Subsequently, blood samples were taken via the jugular catheters from all individuals at 1, 3, 6, 9, 12, 16, 18, 21, 24, 27, 30, 36, 48, and 72 h. These blood samples (approximately 8 mL) were collected in 10-mL EDTA-containing tubes (Becton Dickinson Vacutainer Systems, Franklin Lakes, NJ, USA).
In experiment 2 (Exp. 2), a total of 216 weaned piglets (Duroc × Landrace × Yorkshire) with an average BW of 7.04 ± 0.34 kg were assigned to 6 treatments with 6 replicate pens (3 barrows and 3 gilts per pen) per treatment according to sex and BW in a randomized complete block design. The dietary treatments included the basal diet with the NRC level of vitamins, a diet with 75% the commercial recommendation of vitamins (CRV) level of vitamins, one with a 100% CRV level of vitamins, one with a NRC level of microencapsulated vitamins, one with a 75% CRV level of microencapsulated vitamins, and one with a 100% CRV level of microencapsulated vitamins. The CRV level was chosen based on the vitamin recommendation for pigs provided by the DSM Nutritional Products and Trouw Nutrition company [13,14]. The six vitamin premixes formulations are presented in Table 2 and were designed to comprise at 0.03% of the diets. All dietary treatments were formulated using similar concentrations of metabolized energy, standardized ileal digestible amino acids (lysine, methionine, threonine, tryptophan, and valine), calcium, standardized total tract digestible phosphorus, and trace minerals (Table 3). These nutrients met the NRC requirement estimates for weaned piglets [15]. The experiment lasted 28 d. The pigs were housed in a nursery pen equipped with a nipple waterer and a 3-hole plastic and metal feeder. Pigs were given ad libitum access to feed and water during the whole trial period. All pigs had their weights recorded at the beginning, middle, and end of the trial. We recorded the amount of feed offered to each pen and the amount of feed left in the feeder. The average daily gain (ADG), average daily feed intake (ADFI), and gain:feed (G:F) ratio were calculated. On day 29 after the pigs has fasted for 12 h, one pig/per pen close to the average group BW was selected to collect a blood sample. All blood samples (collected from Exp. 1 and 2) were allowed to clot at room temperature for 20 min and were centrifuged at 3000× g at 4 °C for 10 min. Plasma subsamples were then removed to new a PE tube, and stored at −80 °C until the pending vitamin analysis.
Table 2.
The composition of vitamin premixes used in each treatment for experimental 2 1.
Table 3.
Composition of the basal diet in experimental 2 (as-fed basis).
2.2. Vitamin Analysis
To determine the concentration of plasma vitamin A (retinol), a plasma sample (1 mL) was prepared. Proteins were denatured with 500 μL pure ethanol followed by brief mixing with a vortex (15 s); then the sample was extracted twice with 500 μL of n-hexane. The organic layers were pooled and dried under nitrogen. The dried sample was reconstituted with 100 μL of methanol, vortexed, and centrifuged briefly at 1380× g for 30 s before 35 μL of subsample was injected into an HPLC system (Agilent Technologies Inc., Santa Clara, CA, USA). Absorbance was monitored at 350 nm to maximize the detection of retinol, and a mobile phase of 98:2 methanol:water was run at a flow rate of 1 mL/min. To extract vitamin E (α-tocopherol) from the plasma, the procedure of van Kempen was used [12]. In brief, plasma samples (1 mL) were extracted by adding 1 mL ethanol containing 0.15% butylated hydroxytoluene. Subsequently, 3 mL n-hexane containing 0.025% butylated hydroxytoluene was added into the extraction. After vortex and centrifuging (180× g for 5 min at 20 °C), 2 mL of the n-hexane layer was collected, dried using N2, and resuspended in 200 μL methanol. This extract was analyzed using an Agilent Plastisil C18 ODS, 250 × 4.6 μm column (Agilent Technologies Inc., Santa Clara, CA, USA) on an HPLC (Agilent 1200 Series; Agilent Technologies Inc., Santa Clara, CA, USA). The identification and quantification of α-tocopherol were based on the retention time and peak area of the authentic standards. Plasma 25-hydroxyvitamin D3 (25(OH)D3) concentrations in the blood were determined following the protocol of commercially available ELISA kits (Immunodiagnostic Systems Holdings PLC, London, UK). Vitamin K3 (Menadione) in blood was determined by LC-MS (DIONEX Ultimate 3000 and Thermo Q EXACTIVE). Next, 50 μL of plasma was added to 2 volumes of methanol-precipitated protein and centrifuged at 13,200 rpm for 4 min; then, the supernatant was taken into a new tube, 450 uL of n-hexane was added into this tube to vortex for 1 min, and then the tube was centrifuged at 13,200 rpm for 8 min. The upper organic phase was placed in a new PE tube and concentrated with N2. After concentration and drying, this mixture was reconstituted by adding 100 μL of methanol, and 50 μL of the mixture was taken for detection. Plasma thiamine, riboflavin, vitamin B6, niacin, folic acid, biotin, and pantothenate concentrations were determined by LC–MS (Shimadzu LC20AD–API 3200MD TRAP). we next took 50 μL of the plasma sample directly, added 150 μL of acetonitrile to precipitate the protein, and shook the mixture for centrifugation. Then, 50 μL of the mixture was taken for detection. Concentrations of plasma vitamin B12 (VB12) were measured by LC/MS/MS (Agilent 1260 Series; Agilent Technologies Inc., Santa Clara, CA, USA). In brief, a 200 μL blood sample was prepared, 100 μL of 5% trichloroacetic acid was added, and the mixture was vortexed for 5 min prior to centrifugation for 10 min at 13,000 rpm. Next, 25 μL of 1 N sodium hydroxide was added, and the supernatant was transferred to MS vials for analysis.
2.3. Pharmacokinetic Calculation
Pharmacokinetic curves for the oral non-microencapsulated and microencapsulated vitamins were visualized using GraphPad Prism version 5.01 (GraphPad Software, San Diego, CA, USA) and Microsoft Office 365 Excel (Microsoft Corporation, Redmond, WA, USA). The plasma vitamin concentration at the initial time (0 h) was used as the baseline for the kinetic data. The time–plasma concentration profiles of retinol and α-tocopherol were analyzed with the 1–compartment model. The absorption and elimination of retinol and α-tocopherol were determined by the half-life of the absorption rate (ta1/2, h) and the half-life of the elimination rate (tel1/2, h) in an application program (WinNonlin, version 5.2.1; Pharsight, CA, USA). The time to reach the maximum concentration (Tmax, h) was calculated, and the maximum concentration (Cmax, ng/mL for retinol and μg/mL for α-tocopherol) was determined by the concentration at Tmax. The area under the plasma concentration–time curve (AUC) was calculated using the trapezoidal rule with extrapolation to infinity. The relative bioavailability was determined by comparing the AUC after the administration of two different forms of vitamins.
2.4. Statistical Analysis
Pharmacokinetic parameters were analyzed as a t-test. Growth parameters (ADG, ADFI, and G:F) were analyzed statistically as a randomized complete block design using the PROC GLIMMIX procedure with repeated measurements in SAS 9.4 (SAS Inst. Inc., Cary, NC, USA). For growth performance, vitamin forms, vitamin levels, and their associated interactions were included in the model as fixed effects. Each pen was used as the experimental unit. A random effect of the BW block was included in the model for all measure of growth performance. Only the main effects were discussed for responses whose interactions were not significant. The LSMEANS statement was used to calculate the treatment means, and significantly different means were separated using Tukey’s test. Statistical significance and tendency were determined at p < 0.05 and 0.05 ≤ p < 0.10, respectively.
3. Results
3.1. Effect of the Microencapsulation on the Pharmacokinetics of Vitamin for Pigs
The pharmacokinetic parameters were obtained based on the time-dependent plasma concentration profiles for retinol (Figure 1a and Table 4). There was no difference in the pharmacokinetics of retinol between non-microencapsulated vitamin A and microencapsulated vitamin A. Plasma retinol concentrations among treatments increased immediately, peaked at 10 h after oral vitamin A administration, and gradually decreased until reaching 72 h. The relative bioavailability was determined by comparing the AUC after feeding with vitamin A. The relative bioavailability of oral microencapsulated vitamin A had a mean of 89.85% compared to non-microencapsulated vitamin A. The effects of microencapsulation on the pharmacokinetic parameters of α-tocopherol are presented in Table 4. The AUC and Cmax of α-tocopherol in oral microencapsulated vitamin E were significantly higher than those in oral non-microencapsulated vitamin E (p < 0.05), but there were no significant differences in the rate of absorption (ta1/2) and elimination (te1/2) between treatments. The oral microencapsulated vitamin E had a greater plasma α-tocopherol concentration than that of the non-microencapsulated treatment during the whole monitored period (Figure 1b). Plasma α-tocopherol concentrations among treatments increased immediately and peaked at 12 h after oral vitamin E; then, they decreased continuously until 72 h. The relative bioavailability of oral microencapsulated vitamin E had a mean of 161.14% compared to oral non-microencapsulated vitamin E.
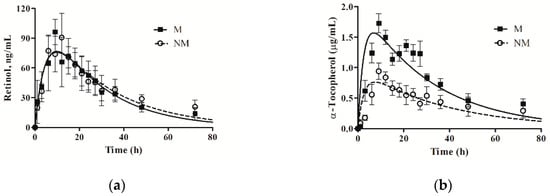
Figure 1.
Values are the means ± SEM. (a) The plasma concentration–time profile of retinol concentrations for pigs. The M means oral microencapsulated vitamin A as retinyl acetate, and the NM means oral non-microencapsulated vitamin A as retinyl acetate; (b) The plasma concentration–time profile of α-tocopherol concentrations for pigs. The M means oral microencapsulated vitamin E as D, L-α-tocopherol acetate, and the NM means oral non-microencapsulated vitamin E as D, L-α-tocopherol acetate.
Table 4.
Pharmacokinetics of plasma retinol and α-tocopherol concentrations for nursery pigs.
3.2. Effects of Vitamin Form and Level on the Growth Performance of Piglets
The effects of the vitamin form, vitamin level, and their interactions on pig growth parameters are presented in Table 5. Interactions between the vitamin form and vitamin level were not observed during phase 1 (d 0 to 14), phase 2 (d 14 to 28), and the whole experimental period. Further, the main effect of vitamin form on the growth parameters was no significant in any experimental period. In phase 1 (d 0 to 14), there was no significant difference in the grow performance among treatments. In phase 2 (d 14 to 28) and during the whole 28-d period, pigs fed diets containing 75% and 100% CRV levels of vitamins had greater ADG and G:F than pigs fed a diet with the NRC level of vitamins (p < 0.05). Further, pig fed diets containing a 75% CRV level of vitamins had similar growth performance compared to pigs fed diets containing a 100% CRV level of vitamins.
Table 5.
Effects of vitamin forms and levels on growth performance for weaned piglets.
3.3. Effects of Vitamin Form and Level on Plasma Vitamin Concentration for Piglets
There were no significant interactive effects of vitamin form and level on plasma vitamins, and the initial plasma vitamin concentrations of piglets were not different among treatments (Table 6), but differences in plasma vitamin concentration between dietary treatments were observed on d 14 and 28 (Table 7 and Table 8). There was no significant interactive effect of vitamin form and level on plasma retinol, 25(OH)D3, α-tocopherol, menadione, thiamine, riboflavin, niacin, pantothenate, vitamin B6, biotin, folic acid, or vitamin B12 concentration. The supplementation of vitamin level significantly affected menadione and pantothenate concentrations in the blood of the pigs (p < 0.05). In phase 1 (d 0 to 14), pigs fed 75% or 100% CRV levels of vitamins had higher plasma menadione and pantothenate concentrations than pigs that received a diet with the NRC level of vitamins (p < 0.05). Further, pigs fed with 75% or 100% CRV vitamin level diets tended to have increased α-tocopherol content in their blood on d 14 (p = 0.077). On d 28, the interactions between vitamin form and vitamin level were still not significant (Table 8). The vitamin forms did not affect the concentration of plasma vitamins, but the vitamin level significantly influenced plasma α-tocopherol, menadione, pantothenate, folic acid, and vitamin B12 concentrations in the piglets. In phase 2 (d 14 to 28), pigs fed 75% or 100% CRV levels of vitamins had higher plasma α-tocopherol, menadione, pantothenate, folic acid, and vitamin B12 level than pigs fed diets containing NRC levels of vitamins (p < 0.05). Further, the pigs fed diets containing a 75% CRV level of vitamins had similar plasma α-tocopherol, menadione, pantothenate, folic acid, and vitamin B12 concentrations to pigs fed a diet containing a 100% CRV level of vitamins.
Table 6.
Effects of vitamin forms and levels on plasma content of vitamins (d 0) 1.
Table 7.
Effects of vitamin forms and levels on plasma content of vitamins (d 14) 1.
Table 8.
Effects of vitamin forms and levels on plasma content of vitamins (d 28) 1.
4. Discussion
4.1. Plasma Kinetic Behavior of Different Forms of Vitamin A
The compartmental model used in the present study fits the plasma kinetic data well. Regarding the implication of the image, the curves had an upswing mostly representing absorption, and a downswing mostly representing equilibration of plasma vitamin A (retinol) with the tissue pools. The plasma kinetics of retinol after feeding with non-microencapsulated or microencapsulated vitamin A showed very similar characteristics to thus prolonged period. The plasma concentration of retinol reached its peak at approximately 10 h after feeding. After the peak, the plasma levels of retinol decreased gradually. Our result reveal the slow distribution of vitamin A, which is responsible for the long terminal half-life of vitamin A. Vitamin A is administered orally and enters the bloodstream rapidly, where it is distributed to the peripheral compartment slowly [16]. Based on current knowledge of the many parallels in gastrointestinal tract function between pigs and humans, it is unsurprising that the plasma retinol responses obtained in this study are similar to the kinetic parameters found in humans (9.8 h) [17]. When providing a single oral dosage of 3,000 IU/kg of vitamin A for dogs, the peak plasma vitamin A concentration was observed at 8 h after feeding; then, the blood vitamin A content decreased to the baseline by 72 h after oral administration [18]. The different responses of plasma vitamin A may have resulted from species differences, and the vitamin’s form and dose may have potential effects on vitamin absorption. In addition, Jang et al. reported that the plasma retinol value after feeding is associated with the relative growth rate and physiological status [19,20].
Another objective of this study was to investigate the relative bioavailability of microencapsulated vitamin A compared to non-microencapsulated vitamin A. Bioavailability is determined by comparing the AUC. We observed a similar AUC for retinol from both non-microencapsulated vitamin A and microencapsulated vitamin A. This observation implies that microencapsulated vitamin A is equally as effective as non-microencapsulated vitamin A, which is contrary to our hypothesis. He et al. performed in vitro and in vivo studies [21] and revealed a prolonged ocular retention time and improved bioavailability of microencapsulated vitamin A compared with non-microencapsulated vitamin A. In our study, there was no significant improvement in the bioavailability of microencapsulated vitamin A, because the designed release mechanism for microencapsulation was not suitable for swine digestion in this case. Moreover, the release mechanisms vary with the type of encapsulating agent used to insert or encapsulate the active ingredient, the method of preparation, and the environment where the release occurs. The encapsulating agent is very important because it influences the microencapsulation efficiency and stability of the finial product. The main mechanisms involved in the core release are diffusion, degradation, and pH release [22]. In addition, the same bioavailability of two forms of vitamin A was recorded in the present study, which may indicate an absorption interaction between vitamins A and E. Isabel et al. indicated that dietary vitamin A supplementation could be responsible for affecting α-tocopherol accumulation, and vitamin A withdrawal for pigs increased the α-tocopherol concentration in the body [23]. In addition, the metabolism of vitamin A is complex, involving the digestion of retinol esters and provitamin A (carotenoids) in the gut lumen, the absorption of retinol and conversion to retinyl esters in the gut mucosa, and the subsequent release into the lymph bound to chylomicrons postprandially or to other lipoproteins at different times. Therefore, even though the plasma retinol contents increased after feeding, these plasma retinol contents may be regulated by the retinol pool in the body resulting in no effect from vitamin A’s form.
4.2. Plasma Kinetic Behavior of Different Forms of Vitamin E
In the current study, two treatment groups also displayed typical pharmacokinetic profiles for vitamin E. Plasma vitamin E (α-tocopherol) concentrations peaked at approximately 12 h after administration. After this peak, the plasma concentration of α-tocopherol decreased gradually and was followed by a typical appearance–elimination profile. The slow appearance of the peak value was likely the result of the digestion process of the diet and absorption from the chyme through the lymph, which is consistent with published literature on vitamin E absorption [12,24]. The half-lives of the elimination rates for the two forms of vitamin E were compared with those of humans. Half-lives of vitamin E around 13 to 48 h [25] or even longer [26] are common. Because synthetic vitamin E (D, L-α-tocopherol) features a combination of stereoisomers, the stereoisomers of α-tocopherol have various biological activities (from 21% to 100%) [27]. Further, vitamin E absorption is similar to fat metabolism, but its uptake in the small intestine can be enhanced by simultaneous fat consumption. In addition, Leonard et al. observed that human plasma α-tocopherol reached its maximum concentrations at 12 h [28], which is similar to our results. This similarity in kinetics may indicate a parallel between pigs and humans related to the morphological functions of the gut.
Both the AUC and Cmax values of the microencapsulated vitamin E were markedly higher than those of the non-microencapsulated vitamin E. This study demonstrates that microencapsulated vitamin E has a dramatic and rapid effect in increasing the α-tocopherol mass in plasma. In an initial 3 h experiment, the plasma concentration–time profiles of vitamin E in both groups were similar. However, at approximately 12 h, both groups reached their respective maximum concentrations of α-tocopherol. Prévéraud et al. revealed the relationship between vitamin E concentration in the pig diet and blood vitamin E concentrations [29]. This dose–response relationship shows that the vitamin E level in the diet is the main factor that modulates blood α-tocopherol concentrations; over 95% of the maximal blood α-tocopherol concentration is reached when the dietary dosage is 30 mg/kg. In the present study, oral administration of a dietary dose of 30 mg/kg microencapsulated vitamin E efficiently increased vitamin E bioavailability compared to the same dose of non-microencapsulated vitamin E. Cross-linked or matrix materials are essential factors in controlling the release of vitamins. Many candidates for microencapsulation, such as polysaccharides (alginate xanthan gum and chitosan), proteins (whey protein and gelatin), and lipids (milk fat and hydrogenated fat), have been used to encapsulate vitamins to protect those vitamins during storage and promote effective delivery to the gut. The microencapsulated vitamin used in this study was coated with hydrogenated fat via the spray-drying technique. A previous study reported the slow release of the vitamin in the digestion process when encapsulating the vitamin with hydrogenated fat [30], As well as high stability during storage and processing [4,5]. According to these authors, solid lipid-based vitamin E is more susceptible to enzymatic digestion and breakdown.
4.3. Influence of Vitamin Form and Vitamin Level on the Growth Performance of Piglets
To our knowledge, this study is the first to compare vitamin forms (non-microencapsulated vs. microencapsulated) and vitamin levels (NRC, 75% CRV, and 100% CRV) under commercial feeding condition. Such a study is critical to determine the optimum combination of vitamin forms and levels to optimize pig growth, feed efficiency, and ultimately profitability in commercial pig production. The results here could be utilized by commercial pig producers to inform investment decisions. Our results suggest that high level of vitamins in the diet is the preferred feeding strategy. However, the form of supplemental vitamins (non-microencapsulated vs. microencapsulated) did not influence the growth performance.
The results of our study agree with those of previous studies related to the effects of vitamins on the growth performance of pigs. Lindemann et al. fed weaned piglets a control diet (basal diet without vitamins) or diets containing 0.5, 1, 2.5, or 5 times the NRC requirements for vitamin A, vitamin D, vitamin E, vitamin K, niacin, pantothenic acid, riboflavin, and vitamin B12 [31]. Pigs fed the control diet or the basal diet with 0.5 times the NRC requirements of vitamins had lower growth performance than the other groups, whereas the pigs fed five times the requirements of vitamins had the highest ADG and ADFI. Cho et al. fed weaned piglets a control diet (a basal diet without vitamins) or diets containing 0.05%, 0.10%, 0.25%, or 0.50% commercial vitamin premix with 11 vitamins at levels of 73–640%, 147–1280%, 367–3200%, and 733–6400% of NRC requirement estimates [32], respectively. In the overall experimental period, increasing the supplementation of vitamins resulted in linear increases of ADFI and ADG. In our study, increasing the vitamin level did not affect the growth performance of weaned piglets in phase 1 (d 0 to 14). These results suggest that the indigenous vitamins in natural feed ingredients or in tissue reserves can provide adequate amounts of vitamins for only a short period of time after weanling. Moreover, regarding the missed effects of vitamin on growth performance during phase 1 (d 0 to 14), Mahan et al. speculated that indigenous vitamins in the feedstuff, tissue reserves in the pigs during weanling, or the lower growth rate of the pigs immediately postweaning could provide an adequate supply of vitamins for a short period postweaning, resulting in no performance response due to the supplementation of vitamins [33]. However, during phase 2 (14 to 28 d), and for the entire 28 d period, ADG increased with an increase in dietary vitamin concentration. Commercial vitamin recommendations for piglets improve feed efficiency and ADG, reducing this amount to 25% of the commercially recommended vitamin level is enough to optimize performance. Our results suggest that the commercial vitamin recommendation level can maximize pig growth performance, but this level far exceeds the threshold for best performance. This may result from the addition of vitamins in commercial vitamin premixes to prevent vitamin loss during storage, thereby ensuring optimal animal performance, and maximizing marginal utility for profit. Due to the limitations in the present study, we could not determine the specific quantity of vitamins for optimal performance and whether the responses were due to a single vitamin or a combination.
4.4. Influence of Vitamin Form and Vitamin Level on Plasma Vitamins Concentration
This study suggests that vitamin forms have no effect on plasma vitamins. This lack of effect is possibly because microencapsulation modified the physical structure of vitamins; i.e., the two forms of vitamins still had the same chemical structures, thus producing the same biological activity for the body. For the main effect of vitamin level, our results revealed that the amounts of plasma vitamin E, vitamin K3, pantothenate, folic acid, and vitamin B12 increases as the increase as the dietary level of vitamins increases. Previous studies reported the dose-response relationship of these vitamins in the blood [34,35,36,37,38,39]. However, the seven other vitamins (vitamins A, D, B1, B2, B6, niacin, and biotin) in the plasma were not influenced by the supplementation of vitamins. We speculate that the indigenous vitamins in feed grains and tissue reserves are enough to satisfy the pig’s needs. A previous study suggested that supplementation of vitamins A and D may be diluted faster in newborn piglets than other weight phases [19]. In this period, piglets experience rapid growth related to an increase in blood volume [19]. In addition, previous studies reported that the indigenous dietary levels of vitamin B1, vitamin B6, and biotin are enough for pig’s needs; moreover, these vitamins may not have nutritional limitations [33]. In addition, the majority of B vitamins are provided from their indigenous levels in feedstuff or from microbiological synthesis in the gut. Chen et al. reported than the feed ingredients commonly used in pig diets are rich in vitamins [40]. In addition, we speculate that the plasma vitamin reaction could be quantified in a deficient state, as there is a compensatory increase in absorption in the presence of specific vitamin deficiencies.
Consequently, combining plasma vitamin reactions and growth performance results will yield new insights into these specific vitamins, which may play important roles as growth promoters by maintaining and boosting bodily functions. Moreover, this differential response between plasma vitamin concentrations may be attributable to the metabolism (absorption/clearance) of each vitamin in the animal body. Vitamin E is a peroxyl radical scavenger and can suppress lipid peroxidation of the cell membrane, which protects the membrane from damage [41,42]. Vitamin E has an important role in protein kinase C regulation [41], which is a key signaling molecule involved in the regulation of growth and differentiation. Based on the above, we expected that the addition of vitamin E would potentially increase the performance of the piglets. Interestingly, we noticed that the pigs had the highest plasma vitamin K levels at the beginning of the experiment compared to d 14 and d 28. This observation could be newborn piglets ingested enough vitamin K from their milk and creep feed, while their bodies stored rich menadione. Shahrook et al. employed a meta-analysis to investigate the outcomes of vitamin K supplementation on pregnancy [43]. The author found that the antenatal vitamin K increased neonatal plasma vitamin K and breast milk vitamin K [43]. The concentration of plasma vitamin K3 increases when the dietary level of vitamins increases, which suggests that an improved vitamin K status may enhance alternative metabolic pathways through mechanisms beyond vitamin K’s classic role as an enzyme cofactor. Furthermore, a previous study showed vitamin K has a potential protective role in insulin resistance and that vitamin K may influence glucose homeostasis by suppressing inflammatory reactions [44].
However, the vitamin B6 in blood was undetectable in weanling. This suggests that the stored vitamin B6 in piglets after weanling is inadequate. Vitamin B6 serves as a coenzyme and plays many critical roles in several aspects of metabolism, giving vitamin B6 importance in such diverse areas as growth, immune function, and steroid hormone activity [8]. In amino acid metabolism, vitamin B6 is involved in practically all reactions involved in metabolism, biosynthesis, as well as catabolism [45]. From d 0 to d 28, we observed that plasma vitamin B6 was increased by extending time. Further. we surmise that dietary vitamin B6 plays a partial role in promoting the growth of piglets.
Pigs from group with the high concentrations of vitamins had significantly greater plasma levels of pantothenic acid, folic acid, and vitamin B12 than pigs from the NRC levels group. Pantothenic acid is active in oxidation and acetylation reactions, as well as in the citric acid cycle, fatty acid synthesis, and cholesterol synthesis in the form of coenzyme A and the acyl carrier protein [8]. These processes are essential for maximizing weight gain and efficiency. In addition, the metabolic roles played by folic acid are closely linked to those of vitamin B12. This vitamin is critical for the transfer of single-carbon units, which is fundamental for the synthesis of purine and pyrimidine bases and for the re-methylation pathway (methionine cycle). Therefore, folic acid plays a crucial role in protein deposition and tissue synthesis. In the re-methylation pathway of homocysteine to methionine, folic acid is a precursor providing a methyl group, with vitamin B12 as the enzymatic co-factor [46]. The effect of the dietary methionine supply on growth performance has been associated with the balance between the positive effects of methionine and the negative effects of homocysteine, this balance is also modulated by folic acid and vitamin B12 [46]. Because growing processes comprise a larger proportion of the metabolic demands in rapidly growing animals, their proportional needs for methyl groups (i.e., methionine synthesis, intestinal cell turnover, and muscle cell proliferation), as well as de novo synthesized nucleic acids, must support bodily maintenance and immune system functions [34,38,46]. Thus, the metabolic requirement for vitamin B12 and folic acid could be increased in rapidly growing animals due to the potentially large amount of nucleotide synthesis in proliferating muscle and bone cells. In addition, the positive role of supplementation with a high concentration of vitamins for piglets may come from the interactions of different vitamins. Further studies are required to determine the mechanisms and interactions of vitamins during the fast-growing phase.
5. Conclusions
The current study shows that microencapsulation technology can improve vitamin utilization and bioavailability. Our results clearly confirmed that the NRC level of vitamins was insufficient to meet the pig’s requirements for fast growth, so additional vitamins are apparently necessary. Vitamin supplements at higher concentrations of vitamins than NRC recommendations could improve the growth performance of piglets. A withdrawal of 25% of vitamins in commercial vitamin formulation for post-weanling pigs did not produce any deleterious effects on their performance. Therefore, we suggest that the NRC estimated requirements of vitamins are inadequate during the fast growth period, and that the requirements for the weanling period need to be further examined.
Author Contributions
P.Y. and Y.M. were responsible for the entire trial; P.Y., analyzed raw data and wrote draft manuscript; P.Y. and H.W. for animal experiments and sample collection; P.Y. and L.L. for vitamin analysis; J.Z. and Y.M. for reviewing and giving critical comments for P.Y.; funding support for Y.M. All authors have read and agreed to the published version of the manuscript.
Funding
This research was funded by the China Agricultural University Research Funding (grant number 201705510410056) and the Ministry of Agriculture and Rural Affairs Funding (grant number 21178259).
Acknowledgments
We thank the support of this work by the China Agricultural University and Ministry of Agriculture and Rural Affairs as well as Ministry of Agriculture and Rural Affairs Feed Efficacy and Safety Evaluation Center.
Conflicts of Interest
There are no conflicts of interest.
References
- Bansode, S.S.; Banarjee, S.K.; Gaikwad, D.D.; Jadhav, S.L.; Thorat, R.M. Microencapsulation: A review. Int. J. Pharm. Sci. Rev. Res. 2010, 1, 38–43. [Google Scholar]
- Lam, P.L.; Gambari, R. Advanced progress of microencapsulation technologies: In vivo and in vitro models for studying oral and transdermal drug deliveries. J. Control. Release 2014, 178, 25–45. [Google Scholar] [CrossRef]
- Gonçalves, A.; Estevinho, B.N.; Rocha, F. Microencapsulation of vitamin A: A review. Trends Food Sci. Technol. 2016, 51, 76–87. [Google Scholar] [CrossRef]
- Yang, P.; Wang, H.; Zhu, M.; Ma, Y. Evaluation of extrusion temperatures, pelleting parameters, and vitamin forms on vitamin stability in feed. Animals 2020, 10, 894. [Google Scholar] [CrossRef] [PubMed]
- Yang, P.; Wang, H.; Zhu, M.; Ma, Y. Effects of choline chloride, copper sulfate and zinc oxide on long-term stabilization of microencapsulated vitamins in premixes for weanling piglets. Animals 2019, 9, 1154. [Google Scholar] [CrossRef] [PubMed]
- Teleki, A.; Hitzfeld, A.; Eggersdorfer, M. 100 years of vitamins: The science of formulation is the key to functionality. Kona Powder Part. J. 2013, 30, 144–163. [Google Scholar] [CrossRef]
- Rejinold, N.S.; Kim, H.K.; Isakovic, A.F.; Gater, D.L.; Kim, Y.C. Therapeutic vitamin delivery: Chemical and physical methods with future directions. J. Control. Release 2019, 298, 83–98. [Google Scholar] [CrossRef]
- Combs, G.F., Jr. The Vitamins—Fundamental Aspects in Nutrition and Health, 4th ed.; Academic Press: Cambridge, MA, USA, 2016; p. 1570. [Google Scholar]
- Cappai, M.G.; Lunesu, M.G.A.; Accioni, F.; Liscia, M.; Pusceddu, M.; Burrai, L.; Nieddu, M.; Dimauro, C.; Boatto, G.; Pinna, W. Blood serum retinol levels in Asinara white donkeys reflect albinism-induced metabolic adaptation to photoperiod at Mediterranean latitudes. Ecol. Evol. 2017, 7, 390–398. [Google Scholar] [CrossRef]
- Kim, B.G.; Lindemann, M.D. An overview of mineral and vitamin requirements of swine in the national research council (1944 to 1998) publications. Prof. Anim. Sci. 2007, 23, 584–596. [Google Scholar] [CrossRef]
- Stahly, T.S.; Williams, N.H.; Lutz, T.R.; Ewan, R.C.; Swenson, S.G. Dietary B vitamin needs of strains of pigs with high and moderate lean growth. J. Anim. Sci. 2007, 85, 188–195. [Google Scholar] [CrossRef]
- Van Kempen, T.A.T.G.; Reijersen, M.H.; De Bruijn, C.; De Smet, S.; Michiels, J.; Traber, M.G.; Lauridsen, C. Vitamin E plasma kinetics in swine show low bioavailability and short half-life of all-rac-α-tocopheryl acetate. J. Anim. Sci. 2016, 94, 4188–4195. [Google Scholar] [CrossRef] [PubMed]
- DSM Vitamin Supplementation Guidelines 2016 for Animal Nutrition. Available online: https://www.dsm.com/markets/anh/en_US/generic/download-registration-vitamin-supplementation-guidelines-in-animal-nutrition-2016.html?assetPath=/content/dam/dsm/anh/en_US/documents/Vitamin_Supp_Guidelines.pdf (accessed on 8 June 2020).
- Trouw Nutrition China Vitamins and Minerals Recommendation. Available online: https://www.trouwnutrition.com.cn/Products_overview/Service-Overview/Technical-article/Recommendatiom/ (accessed on 8 June 2020).
- National Research Council. Nutrient Requirements of Swine, 11th ed.; National Research Council of the National Academies: Washington, DC, USA, 2012. [Google Scholar]
- Blomhoff, R.U.N.E.; Green, M.H.; Green, J.B.; Berg, T.R.O.N.D.; Norum, K.R. Vitamin A metabolism: New perspectives on absorption, transport, and storage. Physiol. Rev. 1991, 71, 951–990. [Google Scholar] [CrossRef] [PubMed]
- Reinersdorff, D.V.; Bush, E.; Liberato, D.J. 1996. Plasma kinetics of vitamin A in humans after a single oral dose of [8,9,19-13C] retinyl palmitate. J. Lipid Res. 1996, 37, 1875–1885. [Google Scholar]
- Raila, J.; Radon, R.; Trüpschuch, A.; Schweigert, F.J. Retinol and retinyl ester responses in the blood plasma and urine of dogs after a single oral dose of vitamin A. J. Nutr. 2002, 132, 1673S–1675S. [Google Scholar] [CrossRef] [PubMed]
- Jang, Y.D.; Ma, J.Y.; Monegue, J.S.; Monegue, H.J.; Stuart, R.L.; Lindemann, M.D. Temporal plasma vitamin concentrations are altered by fat-soluble vitamin administration in suckling pigs. J. Anim. Sci. 2015, 93, 5273–5282. [Google Scholar] [CrossRef] [PubMed]
- Jang, Y.D.; Rotering, M.J.; Isensee, P.K.; Rinholen, K.A.; Boston-Denton, C.J.; Kelley, P.G.; Stuart, R.L. Distribution of injected fat-soluble vitamins in plasma and tissues of nursery pigs. Asian Australas. J. Anim. Sci. 2020, in press. [Google Scholar] [CrossRef] [PubMed]
- He, W.; Guo, X.; Feng, M.; Mao, N. In vitro and in vivo studies on ocular vitamin A palmitate cationic liposomal in situ gels. Int. J Pharm. 2013, 458, 305–314. [Google Scholar] [CrossRef]
- Estevinho, B.N.; Rocha, F.; Santos, L.; Alves, A. Microencapsulation with chitosan by spray drying for industry applications—A review. Trends Food Sci. Technol. 2013, 31, 138–155. [Google Scholar] [CrossRef]
- Isabel, B.; Daza, A.; Ayuso, M.; Óvilo, C.; Fernández, A.; Nu, Y.; Rey, A.I. Effects of dietary vitamin A supplementation or restriction and its timing on retinol and α-tocopherol accumulation and gene expression in heavy pigs. Anim. Feed Sci. Technol. 2015, 202, 62–74. [Google Scholar]
- Van Kempen, T.A.T.G.; de Bruijn, C.; Reijersen, M.H.; Traber, M.G. Water-soluble all-rac-α-tocopheryl-phosphate and fat-soluble all-rac-α-tocopheryl-acetate are comparable vitamin E sources for swine. J. Anim. Sci. 2018, 96, 3330–3336. [Google Scholar] [CrossRef]
- Traber, M.G.; Ramakrishnan, R.; Kayden, H.J. Human plasma vitamin E kinetics demonstrate rapid recycling of plasma RRR- α-tocopherol. Proc. Natl. Acad. Sci. USA 1994, 91, 10005–10008. [Google Scholar] [CrossRef]
- Humans, R.; Chuang, J.C.; Matel, H.D.; Nambiar, K.P.; Kim, S.; Fadel, J.G.; Holstege, D.M.; Clifford, A.J. Quantitation of [5-14CH3]-(2R, 4’R, 8’R)-a-tocopherol in humans. J. Nutr. 2011, 141, 1482–1488. [Google Scholar]
- Weiser, H.; Riss, G.; Kormann, A.W. Biodiscrimination of the eight α-tocopherol stereoisomers results in preferential accumulation of the four 2R forms in tissues and plasma of rats. J. Nutr. 1996, 126, 2539–2549. [Google Scholar] [CrossRef]
- Leonard, S.W.; Paterson, E.; Atkinson, J.K.; Ramakrishnan, R.; Cross, C.E.; Traber, M.G. Studies in humans using deuterium-labeled α- and γ-tocopherols demonstrate faster plasma γ-tocopherol disappearance and greater γ-metabolite production. Free Radic. Biol. Med. 2005, 38, 857–866. [Google Scholar] [CrossRef] [PubMed]
- Prévéraud, D.P.; Desmarchelier, C.; Rouffineau, F.; Devillard, E.; Borel, P. A meta-analysis to assess the effect of the consumption of dietary fat on α-tocopherol blood and tissue concentration in pigs. J. Anim. Sci. 2015, 93, 1177–1186. [Google Scholar] [CrossRef] [PubMed]
- Baldi, A.; Bontempo, V.; Cheli, F.; Carli, S.; Rossi, C.S.; Dell’Orto, V. Relative bioavailability of vitamin E in dairy cows following intraruminal administration of three different preparations of DL-α-tocopheryl acetate. Vet. Res. 1997, 28, 517–524. [Google Scholar] [PubMed]
- Lindemann, M.D.; Cromwell, G.L.; Monegue, H.J. Effects of inadequate and high levels of vitamin fortification on performance of weanling pigs. J. Anim. Sci. 1995, 73 (Suppl. 1), 16. [Google Scholar]
- Cho, J.H.; Lu, N.; Lindemann, M.D. Effects of vitamin supplementation on growth performance and carcass characteristics in pigs. Livest. Sci. 2017, 204, 25–32. [Google Scholar] [CrossRef]
- Mahan, D.C.; Carter, S.D.; Cline, T.R.; Hill, G.M.; Kim, S.W.; Miller, P.S.; Nelssen, J.L.; Stein, H.H.; Veum, T.L.; Cromwell, G.L.; et al. Evaluating the effects of supplemental B vitamins in practical swine diets during the starter and grower-finisher periods—A regional study. J. Anim. Sci. 2007, 85, 2190–2197. [Google Scholar]
- Guay, F.; Matte, J.J.; Girard, C.L.; Palin, M.F.; Giguère, A.; Laforest, J.P. Effects of folic acid and vitamin B12 supplements on folate and homocysteine metabolism in pigs during early pregnancy. Br. J. Nutr. 2002, 88, 253–263. [Google Scholar] [CrossRef][Green Version]
- Moreira, I.; Mahan, D.C. Effect of dietary levels of vitamin E (all-rac-tocopheryl acetate) with or without added fat on weanling pig performance and tissue α-tocopherol concentration. J. Anim. Sci. 2002, 80, 663–669. [Google Scholar] [CrossRef] [PubMed]
- Audet, I.; Laforest, J.P.; Martineau, G.P.; Matte, J.J. Effect of vitamin supplements on some aspects of performance, vitamin status, and semen quality in boars. J. Anim. Sci. 2004, 82, 626–633. [Google Scholar] [CrossRef] [PubMed]
- Molina, V.; Medici, M.; Taranto, M.P.; De Valdez, G.F. Effects of maternal vitamin B12 deficiency from end of gestation to weaning on the growth and haematological and immunological parameters in mouse dams and offspring. Arch. Anim. Nutr. 2008, 62, 162–168. [Google Scholar] [CrossRef] [PubMed]
- Matte, J.J.; Guay, F.; le Floc’h, N.; Girard, C.L. Bioavailability of dietary cyanocobalamin (vitamin B12) in growing pigs. J. Anim. Sci. 2010, 88, 3936–3944. [Google Scholar] [CrossRef]
- Demirkaya-Miloglu, F.; Kadioglu, Y.; Bilici, M.; Tekin, S.B.; Ozturk, M. Levels of vitamin K3 in healthy volunteers and in patients with different types of stomach cancer after a single vitamin K3 administration. J. Liq. Chromatogr. Relat. Technol. 2013, 36, 1467–1477. [Google Scholar] [CrossRef]
- Chen, Y.F.; Huang, C.F.; Liu, L.; Lai, C.H.; Wang, F.L. Concentration of vitamins in the 13 feed ingredients commonly used in pig diets. Anim. Feed Sci. Technol. 2019, 247, 1–8. [Google Scholar] [CrossRef]
- Traber, M.G.; Atkinson, J. Vitamin E, antioxidant and nothing more. Free Radic. Biol. Med. 2007, 43, 4–15. [Google Scholar] [CrossRef]
- Niki, E.; Traber, M.G. A history of vitamin E. Ann. Nutr. Metab. 2012, 61, 207–212. [Google Scholar] [CrossRef]
- Shahrook, S.; Ota, E.; Hanada, N.; Sawada, K.; Mori, R. Vitamin K supplementation during pregnancy for improving outcomes: A systematic review and meta-analysis. Sci. Rep. 2018, 8, 1–11. [Google Scholar] [CrossRef]
- Booth, S.L. Roles for vitamin K beyond coagulation. Annu. Rev. Nutr. 2009, 29, 89–110. [Google Scholar] [CrossRef]
- Matte, J.J.; LeFloc’h, N.; Primot, Y.; Lessard, M. Interaction between dietary tryptophan and pyridoxine on tryptophan metabolism, immune responses and growth performance in post-weaning pigs. Anim. Feed Sci. Technol. 2011, 170, 256–264. [Google Scholar] [CrossRef]
- Giguère, A.; Girard, C.L.; Matte, J.J. Methionine, folic acid and vitamin B12 in growing-finishing pigs: Impact on growth performance and meat quality. Arch. Anim. Nutr. 2008, 62, 193–206. [Google Scholar] [CrossRef] [PubMed]
© 2020 by the authors. Licensee MDPI, Basel, Switzerland. This article is an open access article distributed under the terms and conditions of the Creative Commons Attribution (CC BY) license (http://creativecommons.org/licenses/by/4.0/).