Article

New Indices for Evaluating Vibration Characteristics of Flexible-Joint Robots

1
Shanghai Key Laboratory of Intelligent Manufacturing and Robotics, School of Mechatronic Engineering and Automation, Shanghai University, Shanghai 201900, China
2
Shanghai Robot Industrial Technology Research Institute, Shanghai 200062, China
*
Author to whom correspondence should be addressed.
Appl. Sci. 2020, 10(14), 4895; https://doi.org/10.3390/app10144895
Submission received: 19 June 2020 / Revised: 8 July 2020 / Accepted: 13 July 2020 / Published: 16 July 2020
(This article belongs to the Section Mechanical Engineering)

Abstract

:
Structural vibration is a significant consideration for robotic applications such as machining where the robot is subject to large dynamic loading. Aiming at providing an efficient means to evaluating the vibration characteristics of industrial robots for these applications, this work proposes two new indices to quantify the elastic displacement of the tool mounted on the robot caused by the vibrations induced by external process loading for flexible-joint robots. For this purpose, a structural dynamic model is first developed to derive the frequency responses of the tool displacement. Then, the displacement-force and displacement-torque frequency response ratios are defined, which represent the mapping from the amplitudes of an external harmonic force and torque to the amplitude of tool displacement respectively. The upper bounds of the two ratios are used as evaluation indices for the vibration characteristics of the robot, which represent the worst situation of the tool displacement due to harmonic excitation with amplitude of unit force and unit torque respectively. With these indices, an efficient method is provided to predict whether the tool misalignment caused by periodic loading is acceptable for process quality requirement. Numerical simulation demonstrates the effectiveness of the proposed method for a robotic riveting system being developed for aerospace assembly.

1. Introduction

Although industrial robots have been successfully used in production automation for a wide range of tasks including painting, welding, packaging, and material handling [1], they still face challenges for more complex and dynamic applications like machining that involve large time-varying loading during the processes and require high positioning accuracy. Recent development of these robotic applications include the European projects HEPHESTOS and COMET that aimed at developing robotic systems for small-batch machining [2,3] and Boeing’s initiative to use robots for automatic drilling and riveting in aircraft assembly [4]. The challenges for these robotic processes result from inherent disadvantages of industrial robots compared with machine tools, such as low positioning accuracy and being prone to vibrations [5]. Modern metrology techniques such as laser tracking [6,7] and photogrammetry based measurement [8,9] can be adopted to improve the accuracy of industrial robots through kinematic calibration [10,11] and positioning error compensation [12,13,14]. However, the influence of robot vibration on the processes is difficult to mitigate by these metrology techniques.
These robotic applications involve dynamic loading in a way that the process generates force and torque acting on the robot whose magnitudes and directions dramatically change with time. The process force and torque can excite vibrations into robot structure and lead to much more complicated dynamics than conventional robotic tasks like welding and material handling where only static or low contact forces act on the robot. Since the natural frequencies of an industrial robot strongly depend on its configuration [15] and its stiffness varies significantly in different directions [16,17], the vibration characteristics depend on the robot configuration and the direction of external force. It has been found that structural vibrations of the robot can cause tool misalignment [18], damage the surface quality [19], and reduce the fatigue lives of the tool and the robot [20,21]. Furthermore, the system can become instable due to the interaction between the robot vibrations and the process forces [22,23] and the stability condition can be affected by some process parameters such as feed rate and spindle speed [24,25]. All these have indicated the complexity of vibration characteristics of robots under dynamic loading and the possible serious effect on process quality. A first question for developing an automation system for such processes is whether to use and how to select a robot so that the forced vibrations excited by the process are acceptable for quality requirement. This brings the need for an efficient means to evaluating the vibration characteristics of robots, which, however, is usually not provided by robot manufacturers.
A variety of indices can be found in literature to evaluate robot performance [26]. For instance, the condition number of Jacobian matrix has been proposed to measure the robot dexterity [27], and the manipulating force ellipsoid can quantify the static torque-force transmission from robot joints to its end-effector [28]. The dynamic manipulability ellipsoid and the radius of acceleration have been derived for evaluating robots’ acceleration performance respectively. The former represents the achievable end-effector accelerations in a configuration for given joint torque limits [29], and the latter is a global performance measure of the achievable acceleration from any joint position and velocity in the operating region [30]. The inertial matching ellipsoid is a performance index combining dynamic manipulability and manipulating force ellipsoids which represents the dynamic torque-force transmission efficiency between the joint torque and the static force applied to a part mounted on the robot end-effector [31]. These performance indices are derived based on the assumption that the robot is rigid and are usually proposed for dimensional synthesis. Stiffness is an important structural consideration for robotic applications and represents the effect of applied static forces and torques on the end-effector deformation. Similar to the dexterity index, Liu et al. [32] used the condition number of the stiffness matrix to evaluate the stiffness of 3-DOF (degrees of freedom) spherical parallel robots. Courteille et al. [33] chose the maximum and minimum eigenvalues of stiffness matrix to calculate the upper and lower bounds of the robot stiffness which occurs in the corresponding eigenvector directions. However, none of the aforementioned indices can be used to evaluate the structural vibration characteristics when the robot end-effector affords dynamic loading. Aiming at addressing this issue, the main contribution of this work is to derive two indices which can be used for efficient evaluation of the vibration characteristics of flexible-joint robots under a dynamic force and torque, respectively.
For typical industrial articulated robots, the joints have been considered as most significant flexible components, due to the deformations of transmission components such as gears, shafts, belts and harmonic drives [1,26]. Therefore, we limit our scope to the robots with rigid links and flexible joints in this work. It is also assumed that the influence of the robot deformation on the external force and torque can be neglected. Two indices are defined for evaluating the vibration characteristics of robots under a dynamic force and torque, respectively. To this end, a structural dynamic model is first established for flexible-joint robots that undergo forced vibrations, and obtain the frequency response of the tool displacement due to the process excitation. Then, the displacement-force and displacement-torque frequency response ratios are derived from the frequency-domain analysis, which represent the mapping from the amplitudes of external force and torque to the amplitude of tool displacement due to forced vibrations, respectively. The upper bounds of the two ratios are used as indices to describe the worst situation of robot vibrations under a harmonic excitation with an amplitude of unit force and unit torque, respectively. The development leads to an efficient method to evaluate the tool misalignment caused by periodic process excitation.

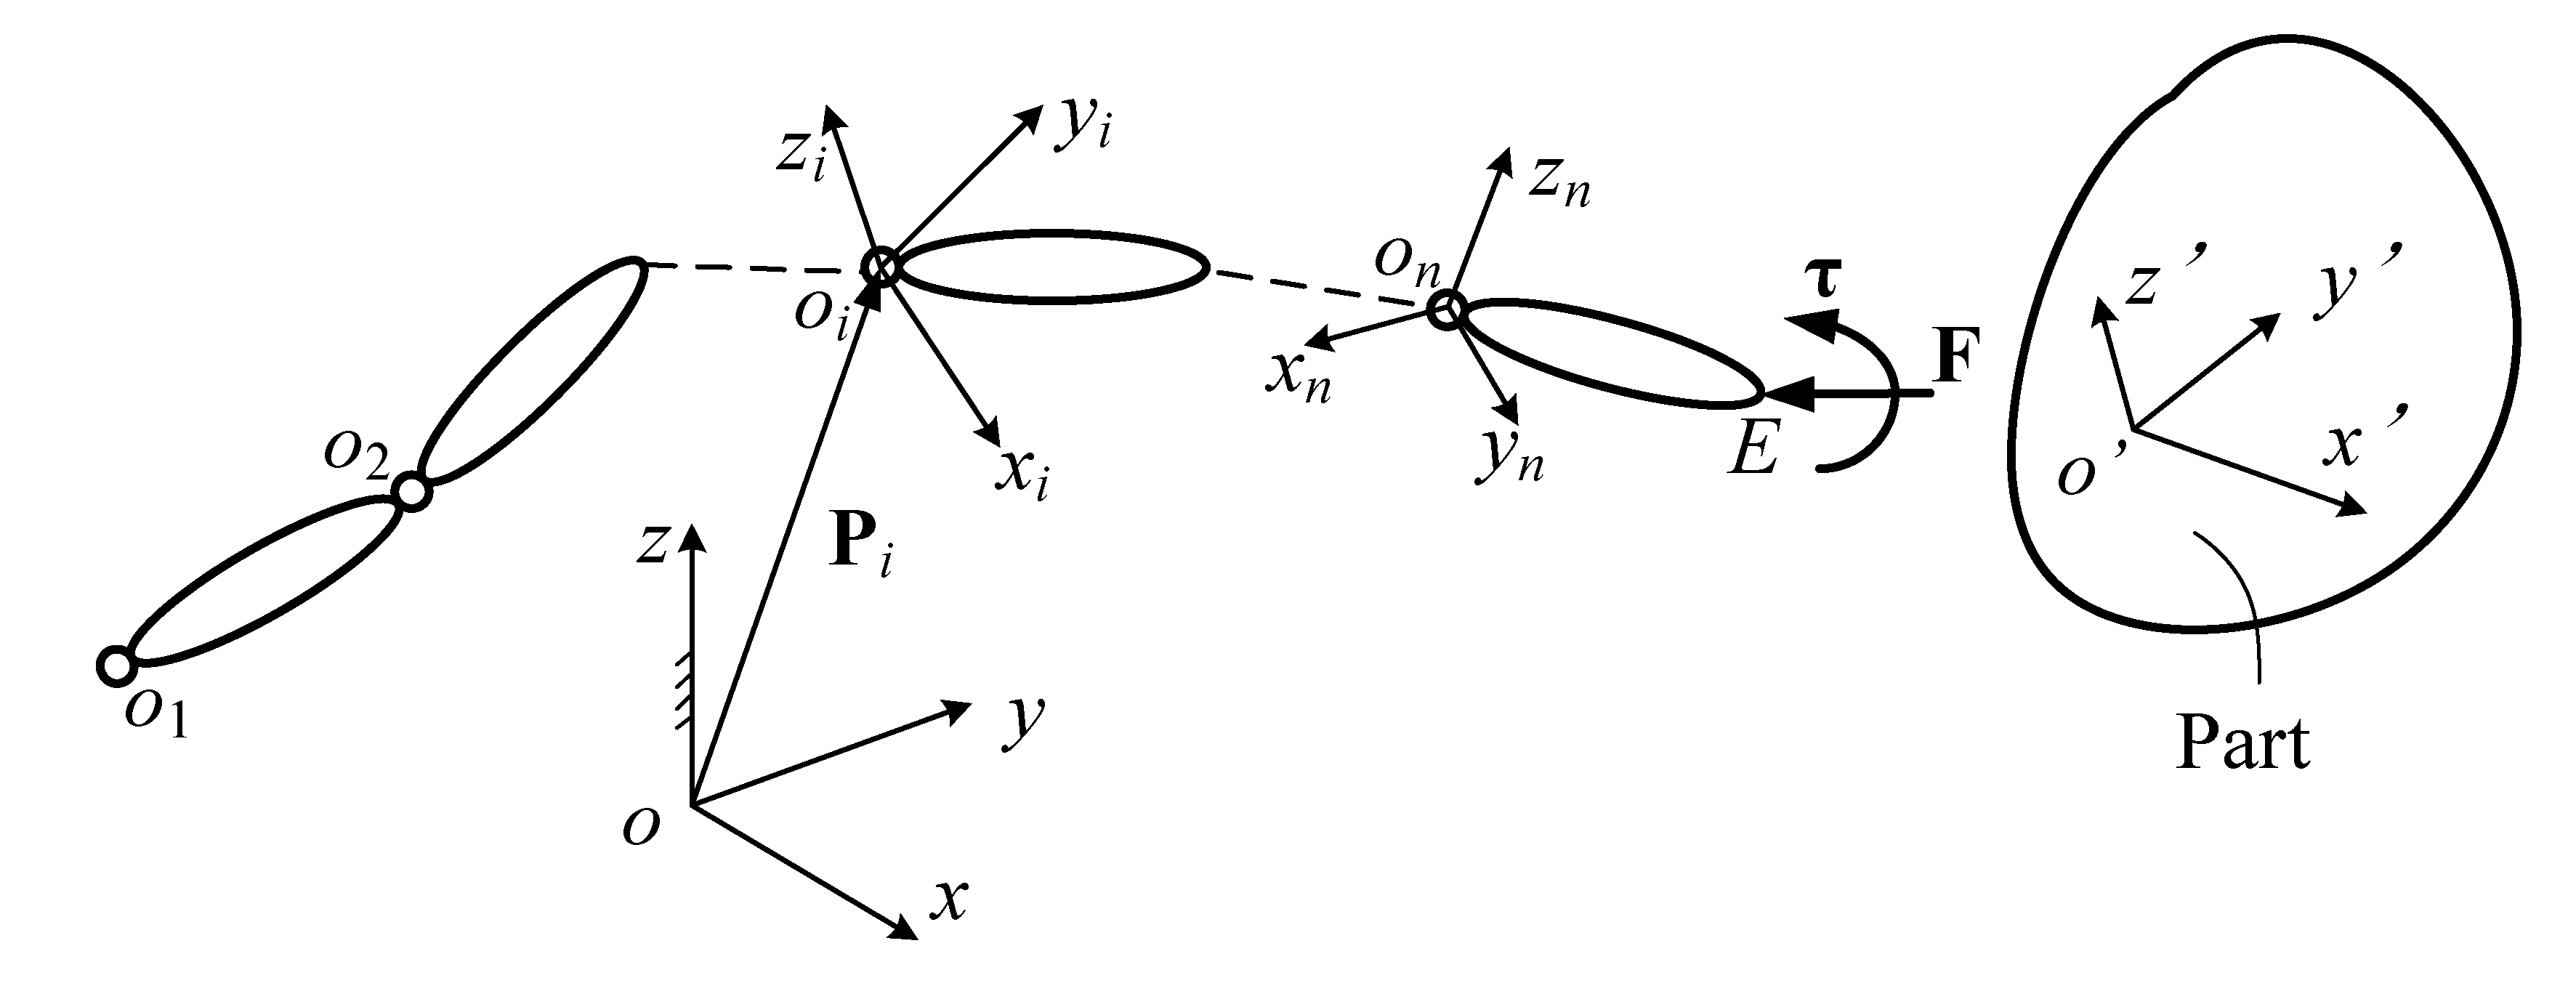
2. System Description

A prototype mobile robotic assembly riveting system at Shanghai University for the milling, drilling and percussive riveting of sheet metals for aerospace assembly. As displayed in Figure 1, an M-20iA industrial robot from Fanuc China in Shanghai with six revolute joints is mounted on a mobile platform driven by four Mecanum wheels. The platform can move in an arbitrary direction on the ground, and the base of the robot can also move vertically for tasks at different heights. Time-varying machining forces and torques act on the machining robot in different directions during the processes. In addition, the excitation frequencies can be as low as 5 Hz for percussive riveting and as high as 50 Hz for drilling and milling. Thus, the problem under study can be stated as to evaluate whether the elastic displacement of tool due to the forced vibrations during these processes is within certain tolerance to guarantee the process quality.

3. Theoretical Development

3.1. Equations of Motion

The kinematic scheme of a robot with n links and n revolute joints is plotted in Figure 2. The position vector of the ith joint in the inertial frame {OXYZ} is denoted by Pi. A local body frame {oixiyizi} is established on each of the links with the origin at the ith joint. A tool is mounted on the robot’s end-effector to complete the process and the tool tip is denoted as E, with its position vector written in the inertial frame as E. Then the external force and torque acting on the tool from the workpiece are denoted as F and τ respectively. Additionally, to describe the process force and torque, a work frame {o’x’y’z’} is established and fixed on the part.
In this work, it is assumed that the robot links are rigid and that the joints can be modeled as linearly elastic torsional springs with small deformations in series with the joint actuators [34]. To evaluate the elastic displacement of the tool, we develop a structural model of the robot to analyze the forced vibrations of the joints in a given configuration denoted by the input joint angles as q = [θ1, θ2, …, θn]T as follows [28]:
M ( q ) Δ q ¨ + C ( q ) Δ q ˙ + K Δ q = J v T F + J w T τ
where Δq is the elastic joint deflection from their equilibrium values qe and represents the torsional deflections of the joints, M(q) is the n × n symmetric generalized inertial matrix and is configuration dependent, K is the diagonal stiffness matrix with the diagonal entries equal to the torsional stiffness of the corresponding joints, and C is a damping matrix. For a complete formulation, matrix C should include the effect of the Coriolis and centrifugal terms related to the rigid-body motion on the elastic deformations. But this work is mainly focused on the robotic percussive riveting operations where the robot moves to a required spot and then stops there during the riveting. In other words, the robot has no rigid-body motion when its end-effector is subject to dynamic loading. Thus, it can be assumed that the coupling between the vibration and the rigid-body motion can be neglected, and then matrix C here only includes the structural damping. The 3 × n matrices Jv and Jw can be obtained from the Jacobian matrix J that describes the mapping from joint rates to the twist of the end-effector as below:
J = [ J v J w ]
where J v = v q ˙ , J w = ω q ˙ in which q ˙ is the joint rates, v is the velocity of the tool tip, and ω is the angular velocity of the tool. We assume that the joint deflections are small, then the linear displacement of the tool tip can be obtained as:
Δ E = J v Δ q
From the perspective of process analysis, Equation (3) gives the tool misalignment due to the structural deformation caused by the process force and torque acting on the robot.

3.2. Frequency Response Functions

We first analyze the frequency response of the displacement of the tool tip due to an external force. To do this, we assume that the end-effector is subject to a simple harmonic force with a frequency ω which can be written in vector form as:
F = F ¯ e j ω t
where F ¯ is a 3 × 1 complex vector whose norm and phase angle of each component represent the amplitude and phase of the force in the corresponding direction. Then the steady-state response of the joint deflection Δq can be expressed as:
Δ q = Δ q v e j ω t
where Δqv is an n ×1 complex vector which contains the amplitude and phase of the steady-state response of the joint deflections. Substituting (4) and (5) into (1) leads to:
Δ q v = ( ω 2 M + j ω C + K ) 1 J v T F ¯
The steady-state response of the tool displacement due to the harmonic force F is then computed from (3) as below:
Δ E v = H v ( ω ) F ¯
where Hv(ω) is the 3 × 3 displacement-force frequency response function as follows:
H v ( ω ) = J v ( ω 2 M + j ω C + K ) 1 J v T
Similarly, when the end-effector is subject to a simple harmonic torque with a frequency ω as:
τ = τ ¯ e j ω t
where τ ¯ is a 3 × 1 complex vector which contains the amplitudes and phases of the three torque components, then the steady-state response of joint deflection can be written as:
Δ q w = ( ω 2 M + j ω C + K ) 1 J w T τ ¯
Now, the steady-state response of the tool displacement due to the harmonic torque τ can be computed as:
Δ E w = H w ( ω ) τ ¯
where Hw(ω) is the 3 × 3 displacement-torque frequency response function as follows:
H w ( ω ) = J v ( ω 2 M + j ω C + K ) 1 J w T
The frequency response functions Hv(ω) and Hw(ω) represent the elastodynamic compliance of the robot under simple harmonic force and torque, respectively. They not only depend on the robot configuration, but also depend on the excitation frequency. When ω is equal to zero, i.e., the robot is subject to a static force or torque, then (8) and (12) are reduced to:
H v = J v K 1 J v T , H w = J v K 1 J w T
which represent the elastostatic compliance of the robot under static force and torque respectively.

3.3. Frequency Response Ratios

Now we investigate the forced vibration characteristics of the robot under a harmonic force. From (7), we have:
Δ E v H Δ E v = F ¯ H H v H ( ω ) H v ( ω ) F ¯
where the superscript H represents the conjugate transpose of a complex matrix. Then we define the displacement-force frequency response ratio as:
η v = Δ E v H Δ E v F ¯ H F ¯ = F ¯ H A v ( ω ) F ¯ F ¯ H F ¯
where A v ( ω ) = H v H ( ω ) H v ( ω ) is a 3 × 3 Hermitian matrix. The ratio ηv represents the mapping from the amplitude of external force to the amplitude of tool displacement due to structural vibration, and ηv depends on the robot configuration and the force frequency. Furthermore, the ratio is related to the amplitudes and phases of the three force components in the complex vector F ¯ . When the robot configuration and force frequency are given, the upper and lower bounds of ηv with different F ¯ can be computed as [35]:
η v min = λ v min , η v max = λ v max
where λvmin and λvmax are the minimum and maximum eigenvalues of the Hermitian matrix Av, respectively. The force vector F ¯ corresponding to the upper and lower bounds of ηv are:
F ¯ min = e v min , F ¯ max = e v max
where evmin and evmax are the eigenvectors of Av corresponding to λvmin and λvmax respectively. Equations (16) and (17) give the range of the displacement-force frequency response ratio ηv and the amplitudes and phases of the force components for the boundary values of ηv.
Similar analysis can be carried out on the forced vibration characteristics of the robot under a simple harmonic torque. We define the displacement-torque frequency response ratio as:
η w = Δ E w H Δ E w τ ¯ H τ ¯ = τ ¯ H A w ( ω ) τ ¯ τ ¯ H τ ¯
where A w ( ω ) = H w H ( ω ) H w ( ω ) is also a 3 × 3 Hermitian matrix. The ratio ηw represents the mapping from the amplitude of external torque to the amplitude of tool displacement due to structural vibration. When the robot configuration and torque frequency are given, the upper and lower bounds of ηw with different τ ¯ can be obtained as [34]:
η w min = λ w min , η w max = λ w max
where λwmin and λwmax are the minimum and maximum eigenvalues of the Hermitian matrix Aw respectively, and the corresponding torque vector are given as:
τ ¯ min = e w min , τ ¯ max = e w max
where ewmin and ewmax are the eigenvectors of Aw corresponding to λwmin and λwmax respectively. Equations (19) and (20) give the range of the displacement-torque frequency response ratio ηw and the amplitudes and phases of the torque components for the boundary values of ηw.
The maximum frequency response ratios ηvmax and ηwmax provide a measure of the maximum amplitudes of tool displacement due to harmonic loading with an amplitude of unit force and unit torque respectively, and the corresponding eigenvectors represent the amplitudes and phases of the force and torque components under which the worst vibration situation occurs. The ratios ηvmax and ηwmax are inherent characteristics of the robot and independent of the application processes, therefore they can be used as indices to evaluate the vibration characteristics of the robot under harmonic excitation.
More importantly, the eigenvectors evmax and ewmax represents the amplitudes and phases of the force and torque components corresponding to ηvmax and ηwmax. The two indices can be used to predict the worst situation of forced vibrations of the robot for given processes. If the rotation matrix from the work frame (see Figure 2) to the inertial frame is written as R, then the force and torque acting on the tool can be written as:
F = R F , τ = R τ
where F’ and τ’ are the process-dependent force and torque written in the work frame. In the case of machining, when the effect of robot deformation on F’ and τ’ can be neglected, these force and torque can be predicted via machining force modeling or via machining tests on Computer Numerical Control (CNC) machines. Usually, the process force and torque are periodic functions about time and can be approximated as an expansion of 2N + 1 Fourier series as follows:
F k = - N N F k e j k ω v t , τ k = - N N τ k e j k ω w t
where ωv and ωw are the force and torque frequencies, Fk and τk are complex vectors containing the Fourier coefficients and:
F - k = F k * , τ - k = τ k *
where F k * and τ k * are the conjugates of Fk and τk respectively. Then, the maximum amplitude of tool displacement due to the kth Fourier series in F and τ are respectively computed as:
Δ E v max , k = η v max | F k | , Δ E w max , k = η w max | τ k |
In (24), the Fourier coefficients Fk and τk are process dependent and the indices ηvmax and ηwmax are robot dependent. Then, once ηvmax and ηwmax had been provided, for example, by robot manufacturers and Fk and τk are modeled or measured by robot users, the largest tool misalignment due to each Fourier series can be easily evaluated using (24).

4. Numerical Simulation

4.1. System Parameters

In this case study, the Fanuc M-20iA robot for machining and assembly shown in Figure 1 is simulated. The reference frames of the robot are drawn in Figure 3. Only the deflections of the first three joints are considered since the moment arms for the external force acting at the Tool Center Point (TCP) about the last three joints are much shorter than those about the first three joints. Note that the modeling approach presented in Section III is generic and can be adopted to robots with over three flexible revolute joints. The inertial frame {oxyz} is established at the robot base with its positive Z axis vertically upward and its Y axis perpendicular to the plane containing the second and third links. The z i axes of the local frames are in the rotation directions of the ith joints; when the robot is stationary, the x 1 axis is parallel to the X axis, and the x 2 and x 3 axes are along the link length directions. The directions of other reference axes can be determined by the right-hand rule.
The link length vectors of o1o2, o2o3, and o3oE can be written in the local frames as l 1 b = [ 0 ,   0 ,   l 1 ] T , l 2 b = [ 0 ,   0 ,   l 2 ] T and l 3 b = [ 0 ,   0 ,   l 3 ] T , where the link lengths are l 1 = 0.2 m and l 2 = l 3 = 0.8 m. The masses, position vectors of the centers of gravity (CG), and inertia tensors of the links written in the corresponding local frames are listed in Table 1. The torsional stiffness of the joints is given as: k = 2.4 × 10 5 N-m/rad, k 2 = k 3 = 10 5 N-m/rad. A damping ratio of 0.06 is used to compute the damping matrix in this simulation based on the modal test data for industrial robots given in [36]. The ranges of the joint angles are θ 1 [ π ,   π ] , θ 2 [ π / 2 ,   π / 2 ] , and θ 3 [ π / 3 ,   π / 3 ] . For this assembly application, the robot moves within a cuboid shaped operating workspace that can be represented by the width a = 1.8 m, the height h = 0.8 m, and the depth b = 0.5 m shown in Figure 3. The coordinates of the center of the operating workspace in the inertial frame are x = 0.75 m, y = 0 m, and z = 0.65 m. The Denavit–Hartenberg parameters of the robot are listed in Table 2. Lastly, the mass of the rivet gun is 5.8 kg. More information about this robotic application can be in [37].

4.2. Performance Indices for Given Positions

The proposed evaluation model has been implemented in the MATLAB environment. We first investigate the variation of performance indices ηvmax and ηwmax with different frequencies when the robot moves to given positions. As an example, the values of ηvmax and ηwmax with frequencies from 0 to 200 Hz at Point A (x = 0.1 m, y = 0, and z = 1 m) and Point B (x = 1 m, y = 0, and z = 1 m) are compared in Figure 4 and Figure 5 respectively. It is seen that when the amplitude of external force/torque is equal to unit force/torque, the maximum amplitude of TCP displacement strongly depends on the excitation frequency and can be much higher than the largest static displacement when a unit static force/torque acts on the end-effector (represented by the values of ηvmax or ηwmax when the frequency is equal to zero). This implies that only considering the elastostatic performance is insufficient for dynamic robotic processes.
At Point A, it is found that the first two modes of the robot have natural frequencies of 54 rad/s and 103 rad/s respectively, and both mode shapes are related to the deflections of Joint 2 and Joint 3. The third mode of the robot has a natural frequency of 155 rad/s, and its mode shape is related to the deflection of Joint 1. From Figure 4 and Figure 5, we observe two peak values of ηυmax and ηwmax at frequencies close to the first two natural frequencies. As the moment arm about Joint 1 is small at Point A, we do not observe a third peak value related to the third mode on both curves of ηυmax and ηwmax, which indicates that the TCP vibration in the y direction is less obvious than those in the o x z plane. We further investigate the eigenvectors of matrices Av and Aw corresponding to ηυmax and ηwmax at different frequencies. For example, the eigenvector for ηυmax is evmax = [−0.91−0.38i, 0, 0.18]T (in N) at 54 rad/s and evmax= [−0.36−0.02i, 0, 0.93]T (in N) at 103 rad/s for the two peak values. These vectors represent the amplitudes and phases of the three force components under which the two peak values of ηυmax occur at these frequencies. The eigenvectors for ηwmax are ewmax = [0, 1, 0]T (in N-m) for both peak values of ηwmax, therefore, the worst cases of the TCP vibrations due to a harmonic torque at 54 rad/s and 103 rad/s occur when the torque is in the y direction.
At Point B, the first and third modes of the robot are related to the deflections of Joint 2 and Joint 3, and their natural frequencies are about 39 rad/s and 132 rad/s respectively. The second mode is related to Joint 1 deflection with a natural frequency of 103 rad/s. Compared with Point A, the moment arm about Joint 1 is large at Point B, thus we observe three peak values of ηυmax and ηwmax at frequencies close to the natural frequencies. Furthermore, we find that the eigenvectors of matrices Av and Aw corresponding to the first and third peak values of ηυmax are evmax = [−0.55−0.01i, 0, 0.83]T (in N) at 35 rad/s and evmax = [−0.32−0.04i, 0, 0.95]T (in N) at 132 rad/s, respectively. Again, the eigenvectors for ηwmax are ewmax = [0, 1, 0]T (in N-m) at the first and third peak values. All these eigenvectors indicate that the worst cases of the TCP vibrations due to a harmonic force or torque at 39 rad/s and 132 rad/s occurs in the o x z plane. At 103 rad/s, the eigenvectors for ηυmax is evmax = [0, 1, 0]T (in N) and that for ηwmax is ewmax = [0, 0, 1]T (in N-m). Both indicate that the worst case of the TCP vibration due to a harmonic force or torque with this frequency is caused by the deflection of Joint 1.
The above eigenvalue and eigenvector analysis procedure can be used to analyze the worst situation of forced vibrations of the robot in other positions and at other frequencies.

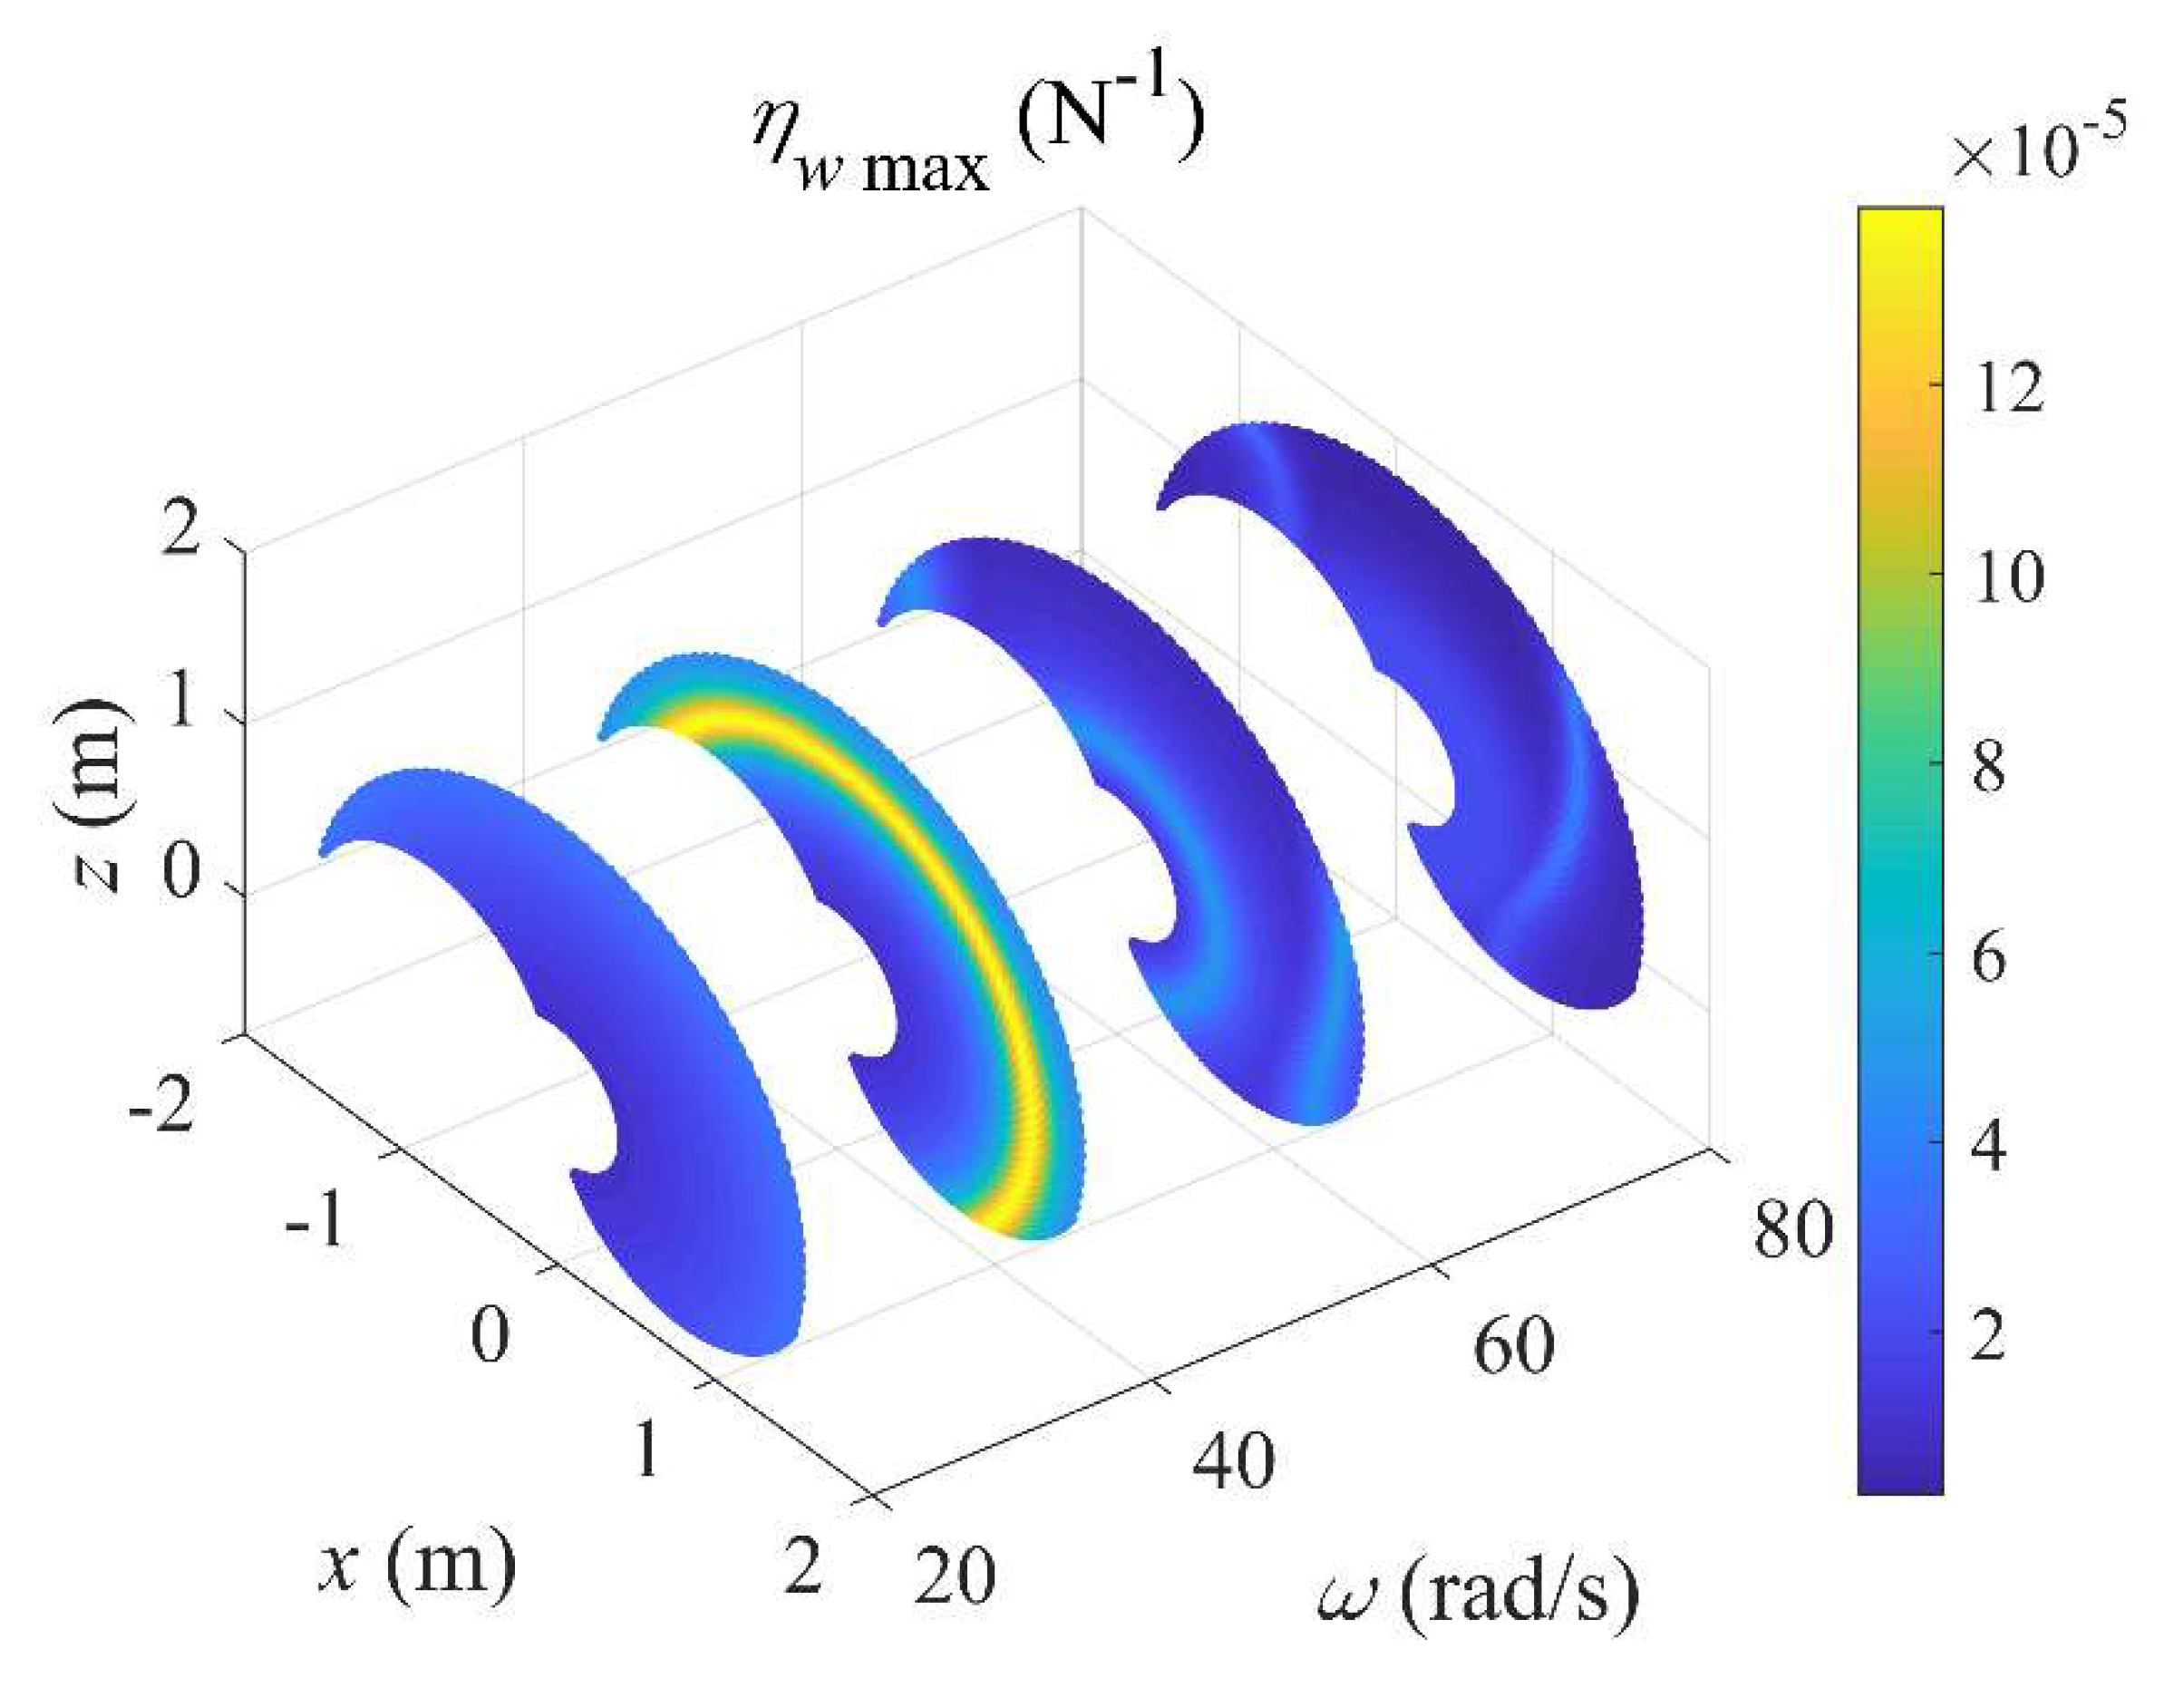
4.3. Distributions of Performance Indices

Now we analyze the distributions of the two performance indices ηυmax and ηwmax over the robot workspace. As shown in Figure 6 and Figure 7, these distributions are plotted in the oxz plane due to the symmetry about Joint 1, with force and torque frequencies of 20, 40, 60, and 80 rad/s. It is found that these dynamics performance indices dramatically change with the excitation frequencies. Generally speaking, the structural dynamics performance at 40 rad/s is lower than those at other three frequencies. Moreover, at each frequency, the maximum frequency response ratios ηυmax and ηwmax in certain positions are significantly higher than those in other positions, and a further observation finds that the natural frequencies in these positions are close to the excitation frequency. A detailed investigation on the eigenvectors can give the amplitude and phase of each force/torque component under which ηυmax and ηwmax occurs.
The mean value and maximum value ηυmax and ηwmax of over the robot workspace with different excitation frequencies are also listed in Table 3. Again, it is seen that both indices strongly depend on the frequencies of the external force or moment, and that the worst structural dynamics performance occurs with an excitation frequency of about 40 rad/s.

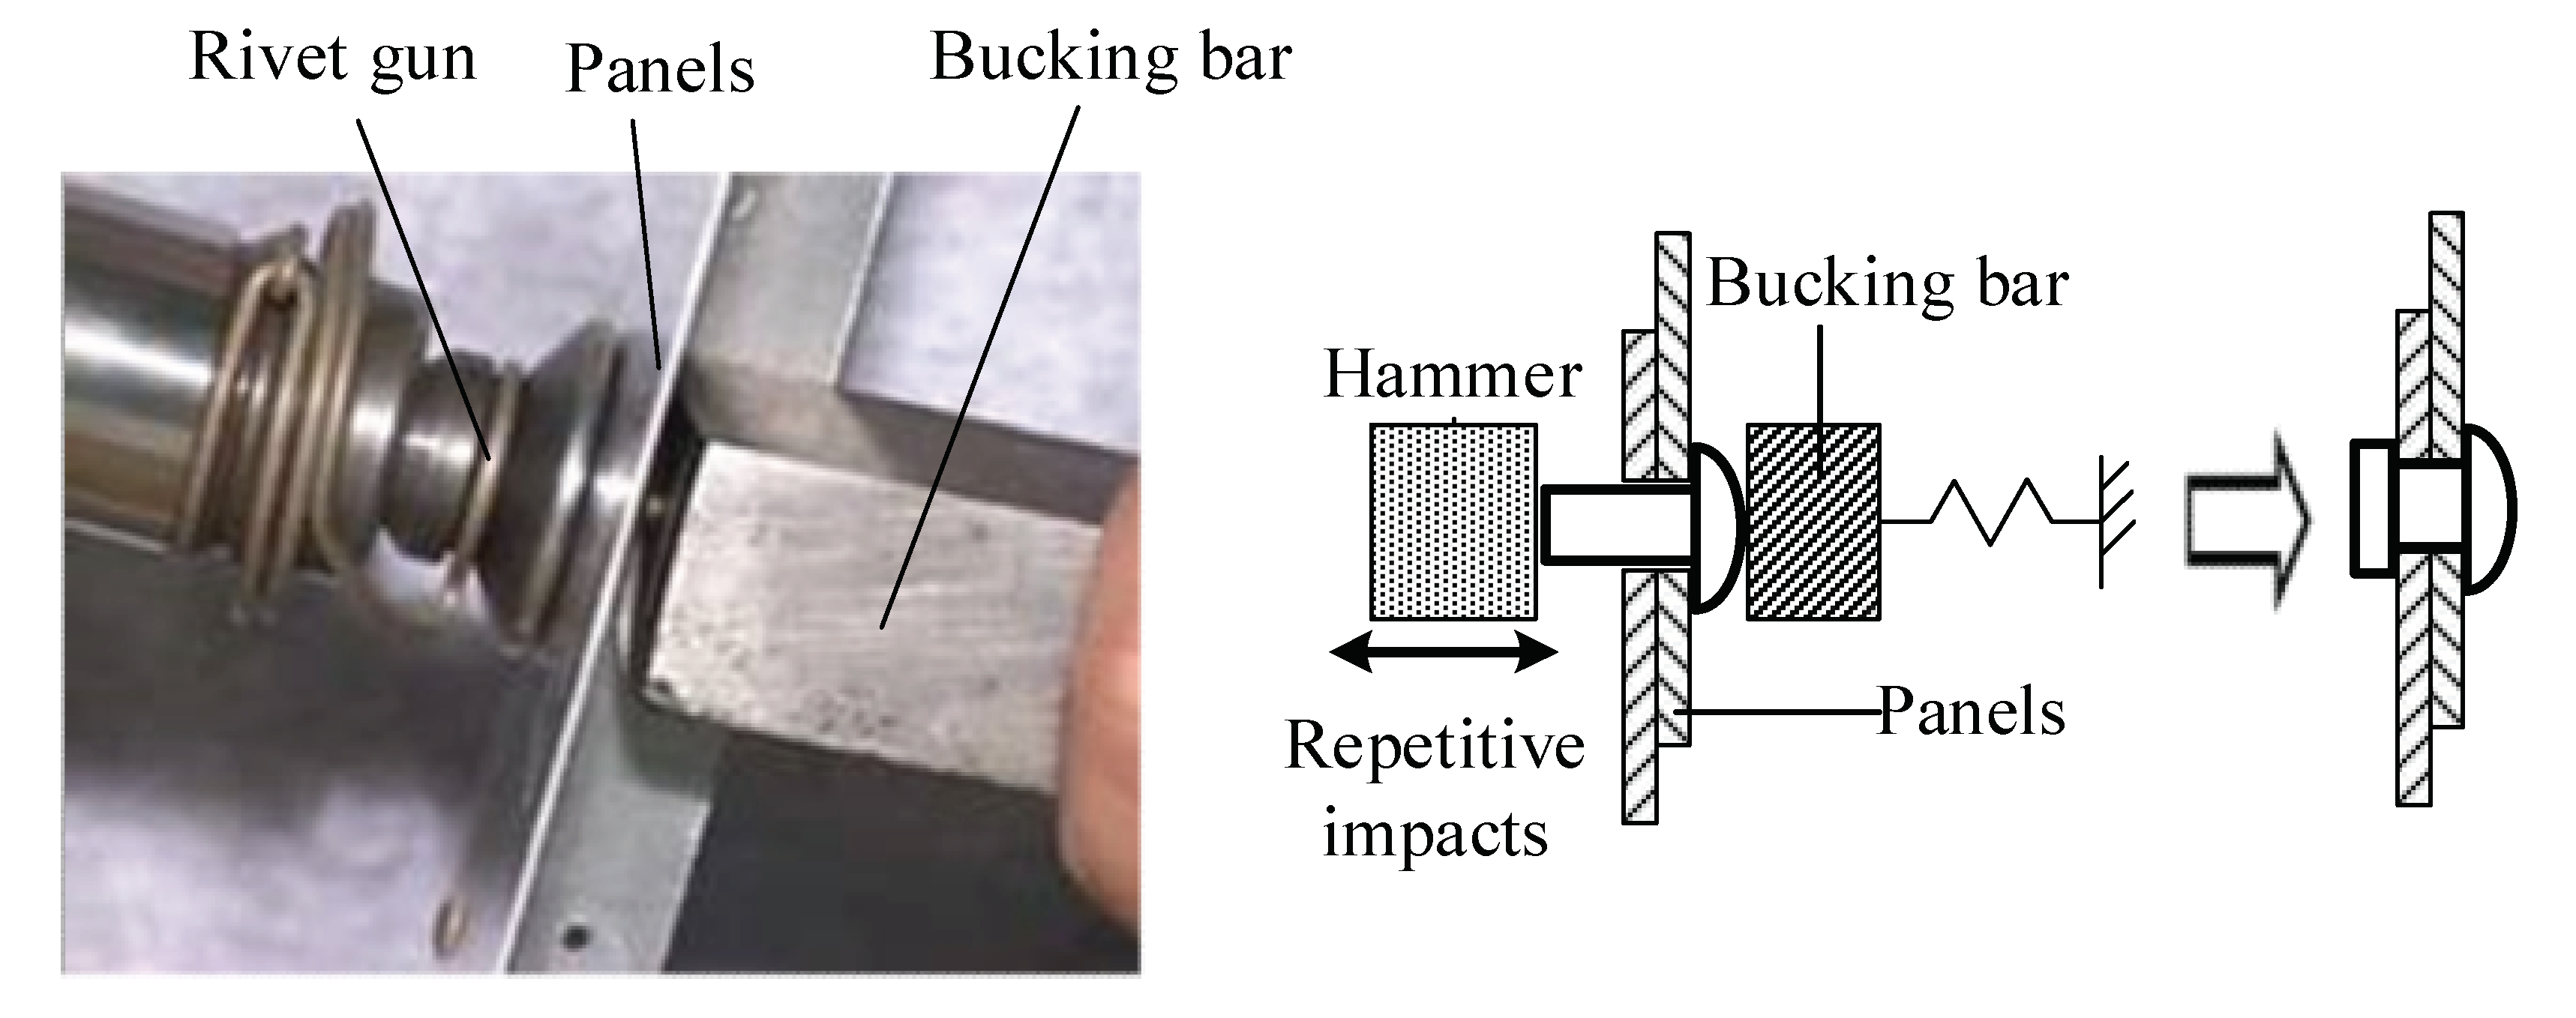
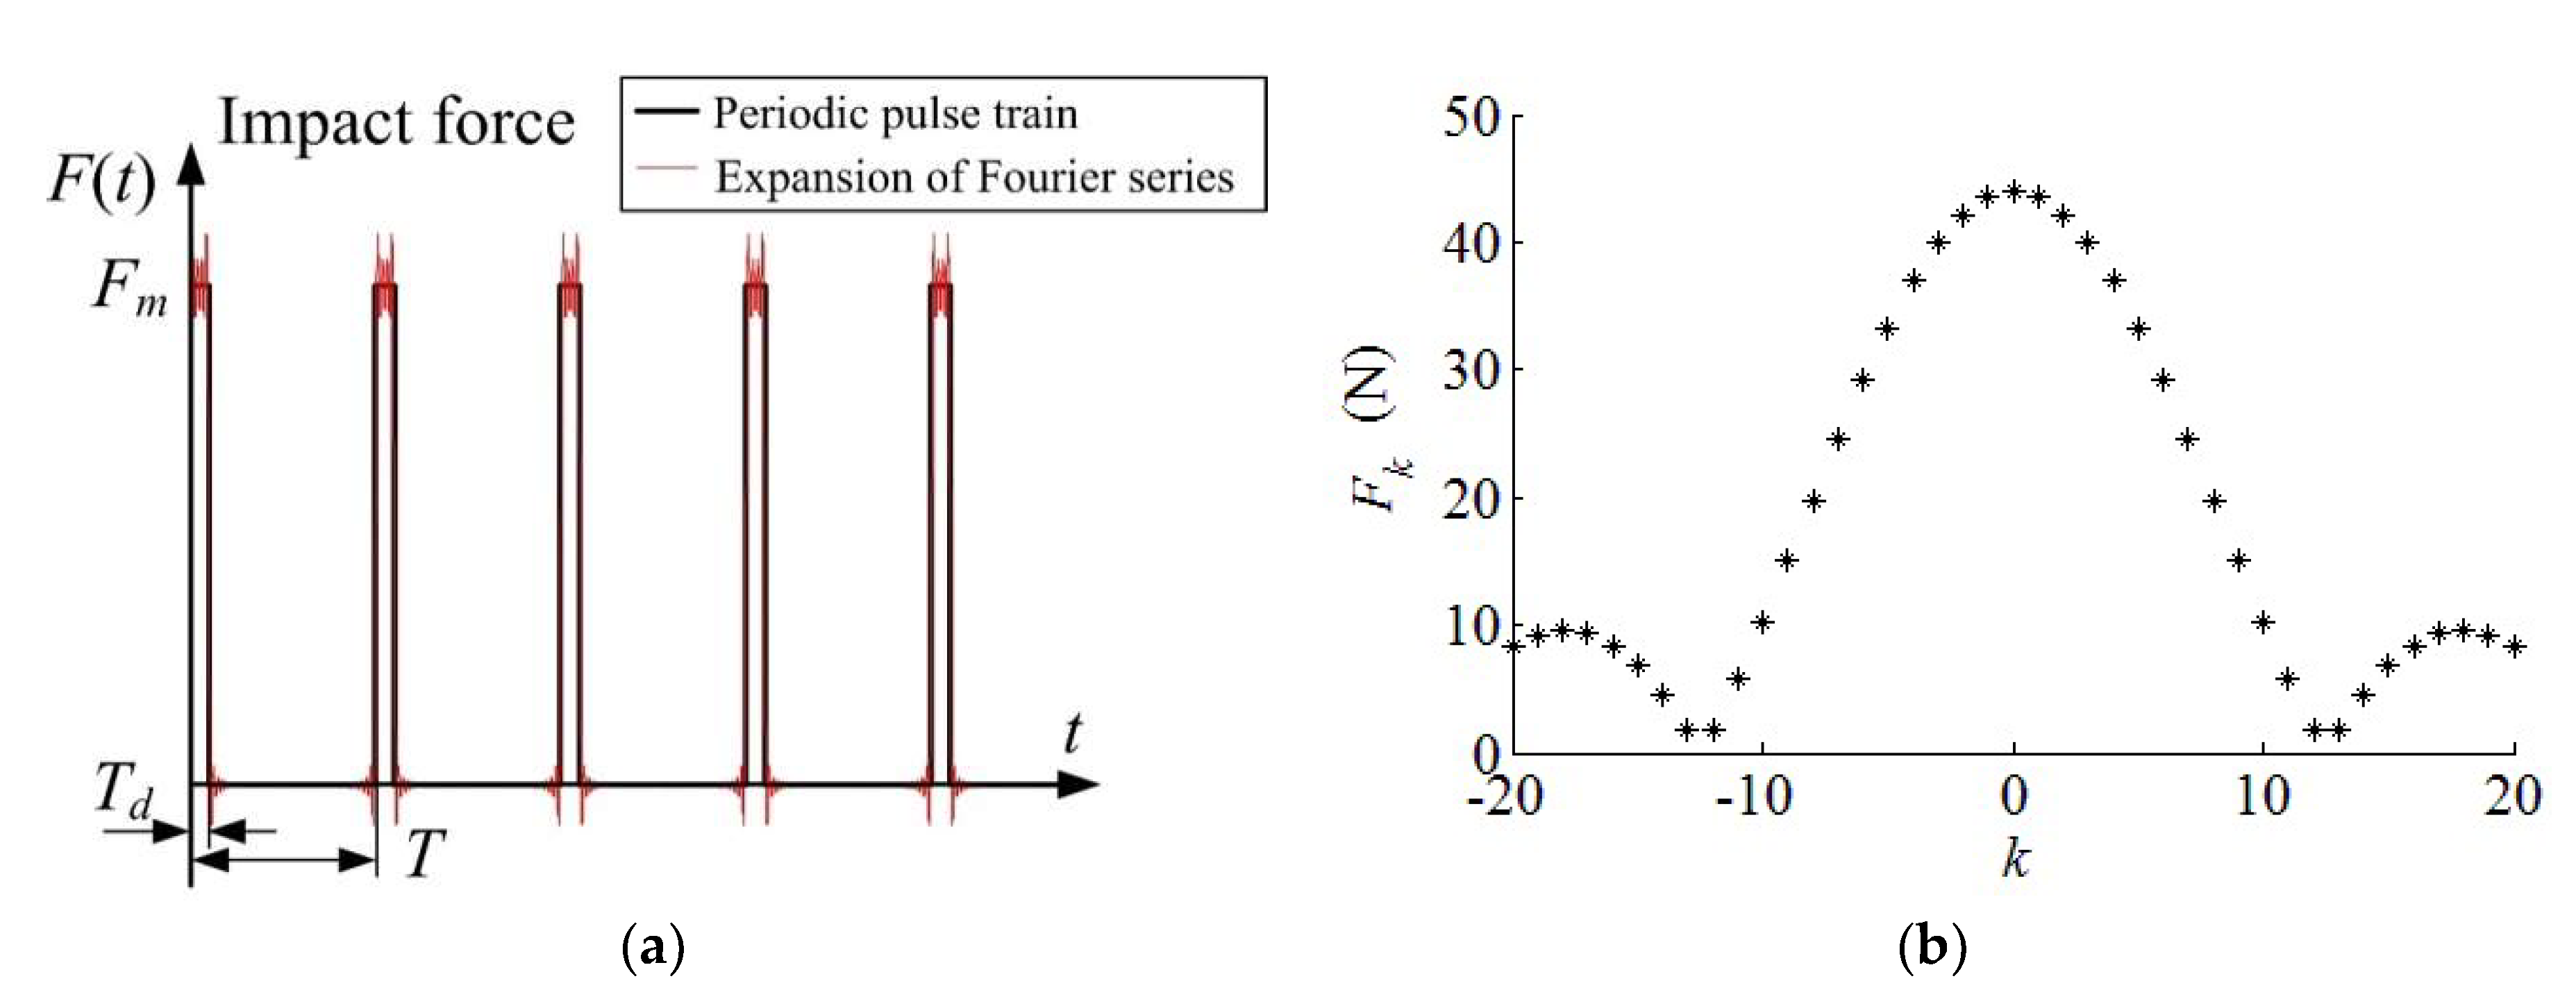
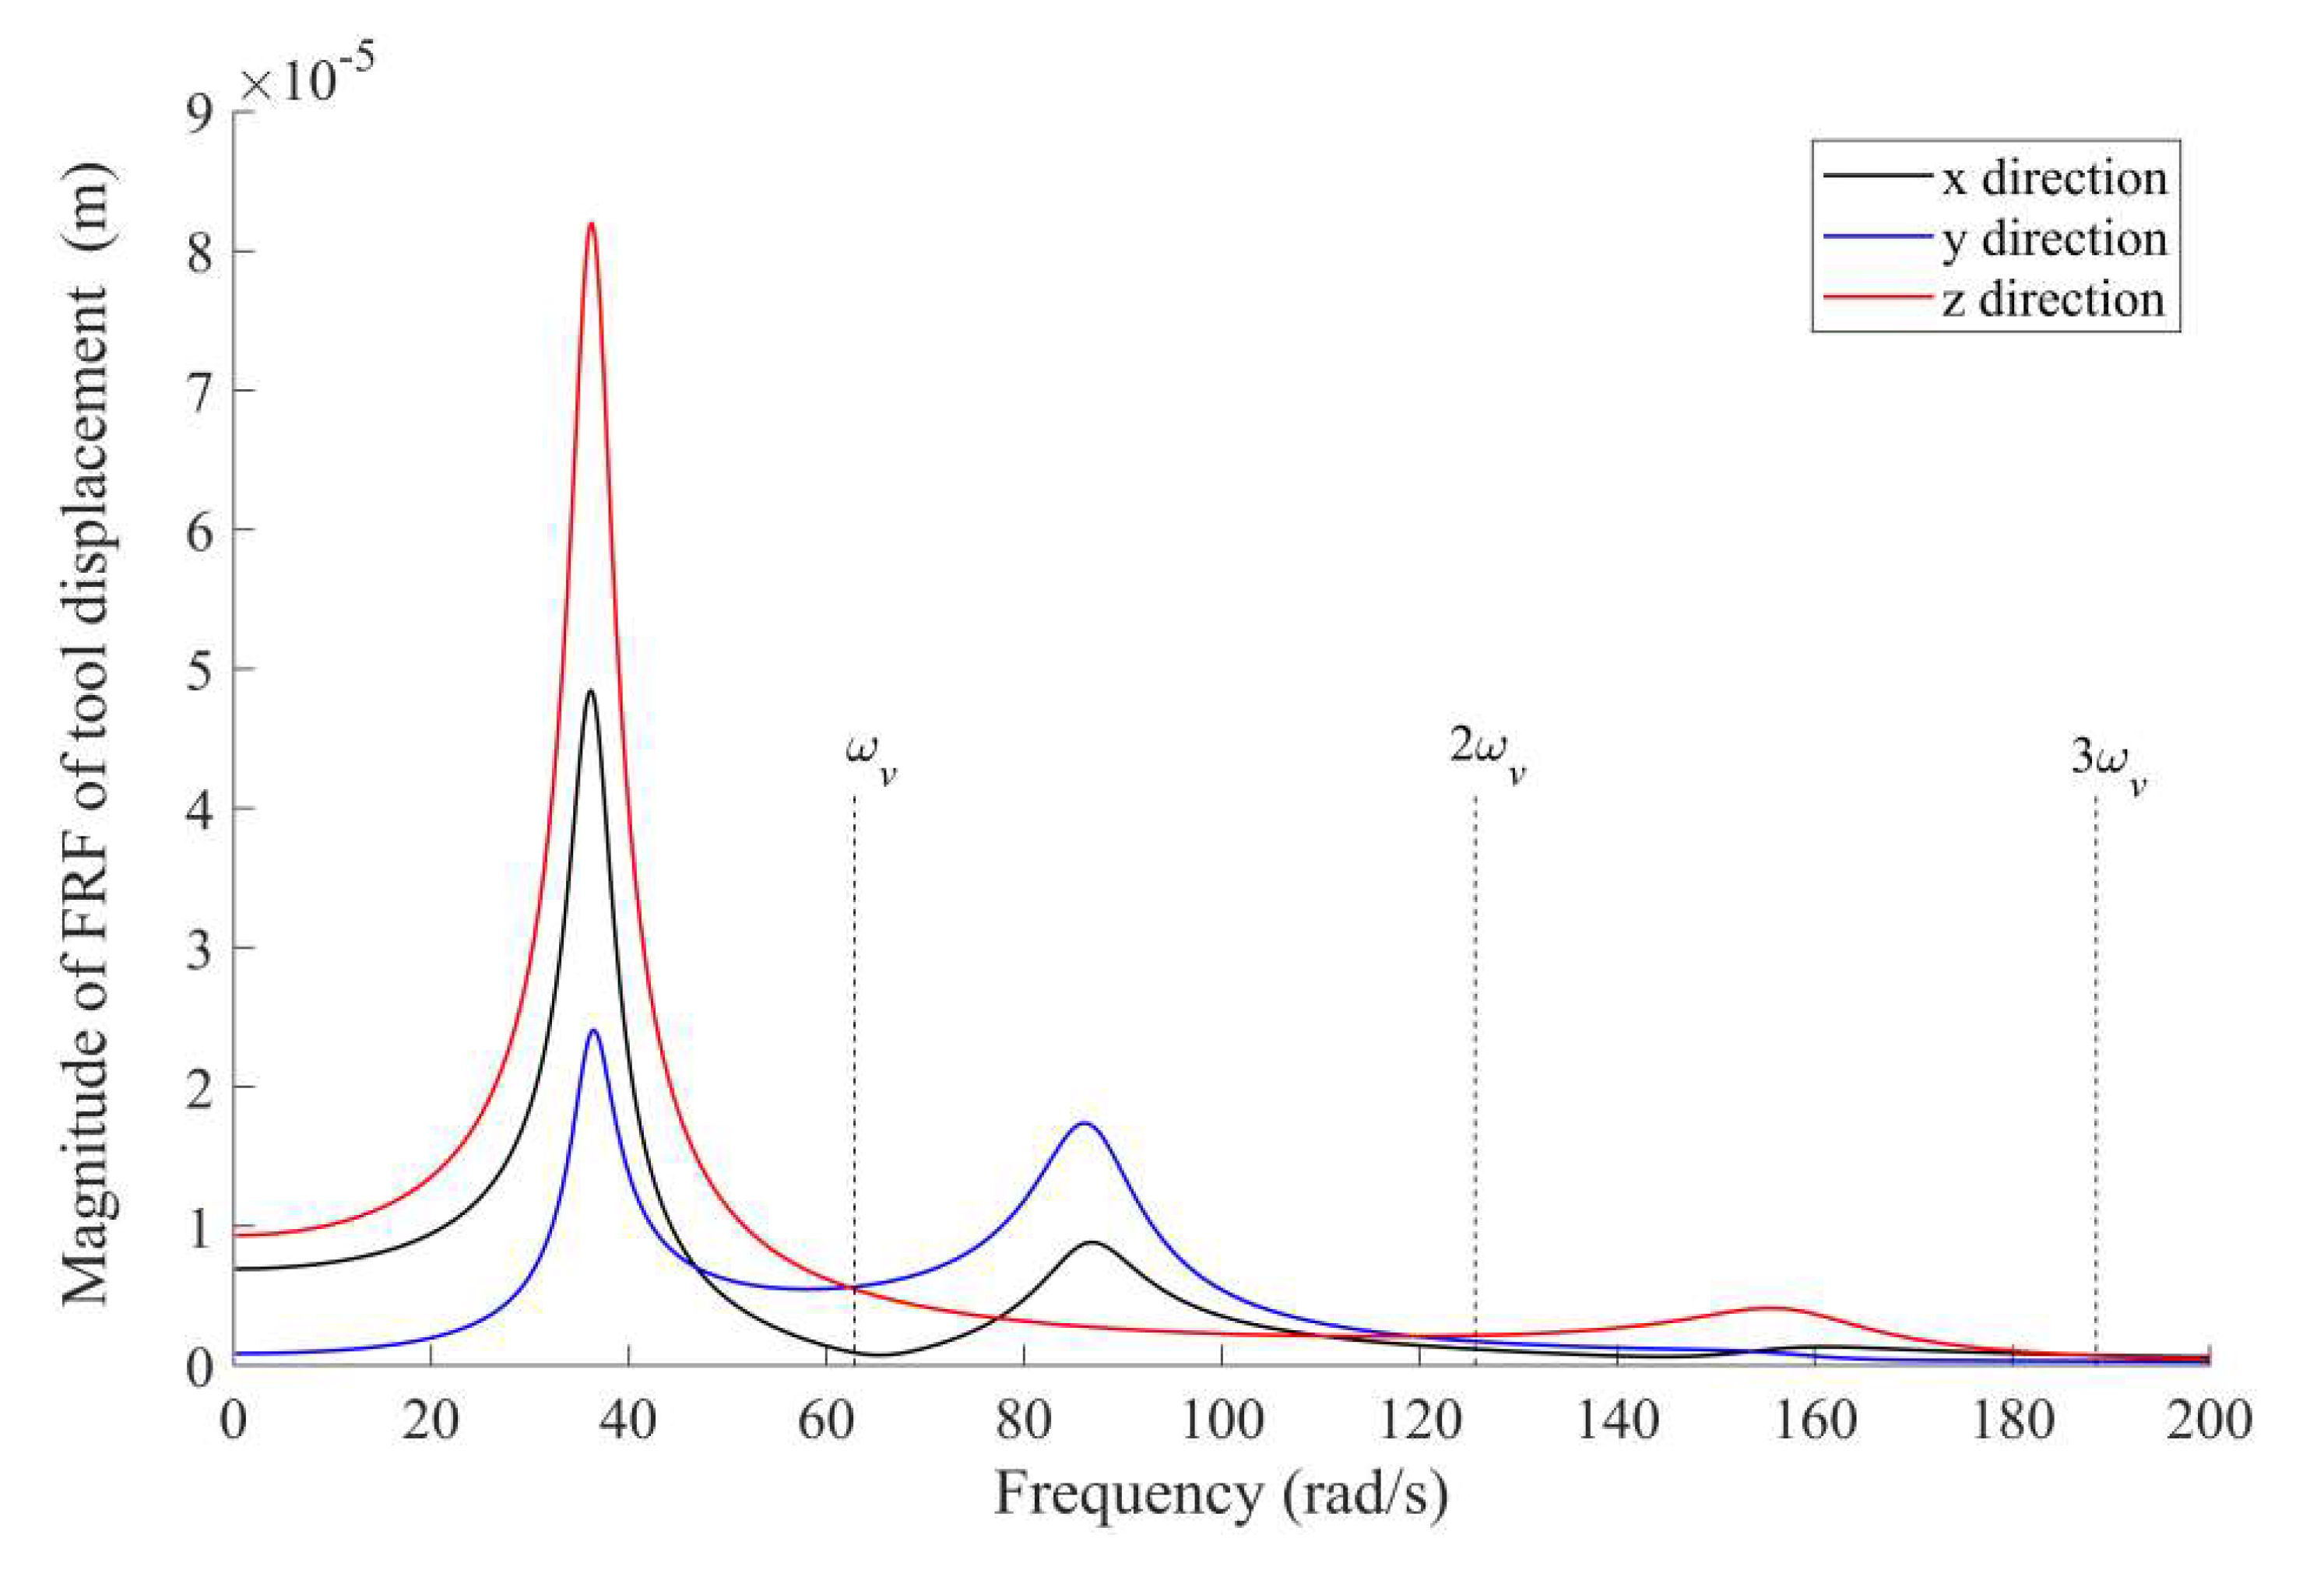
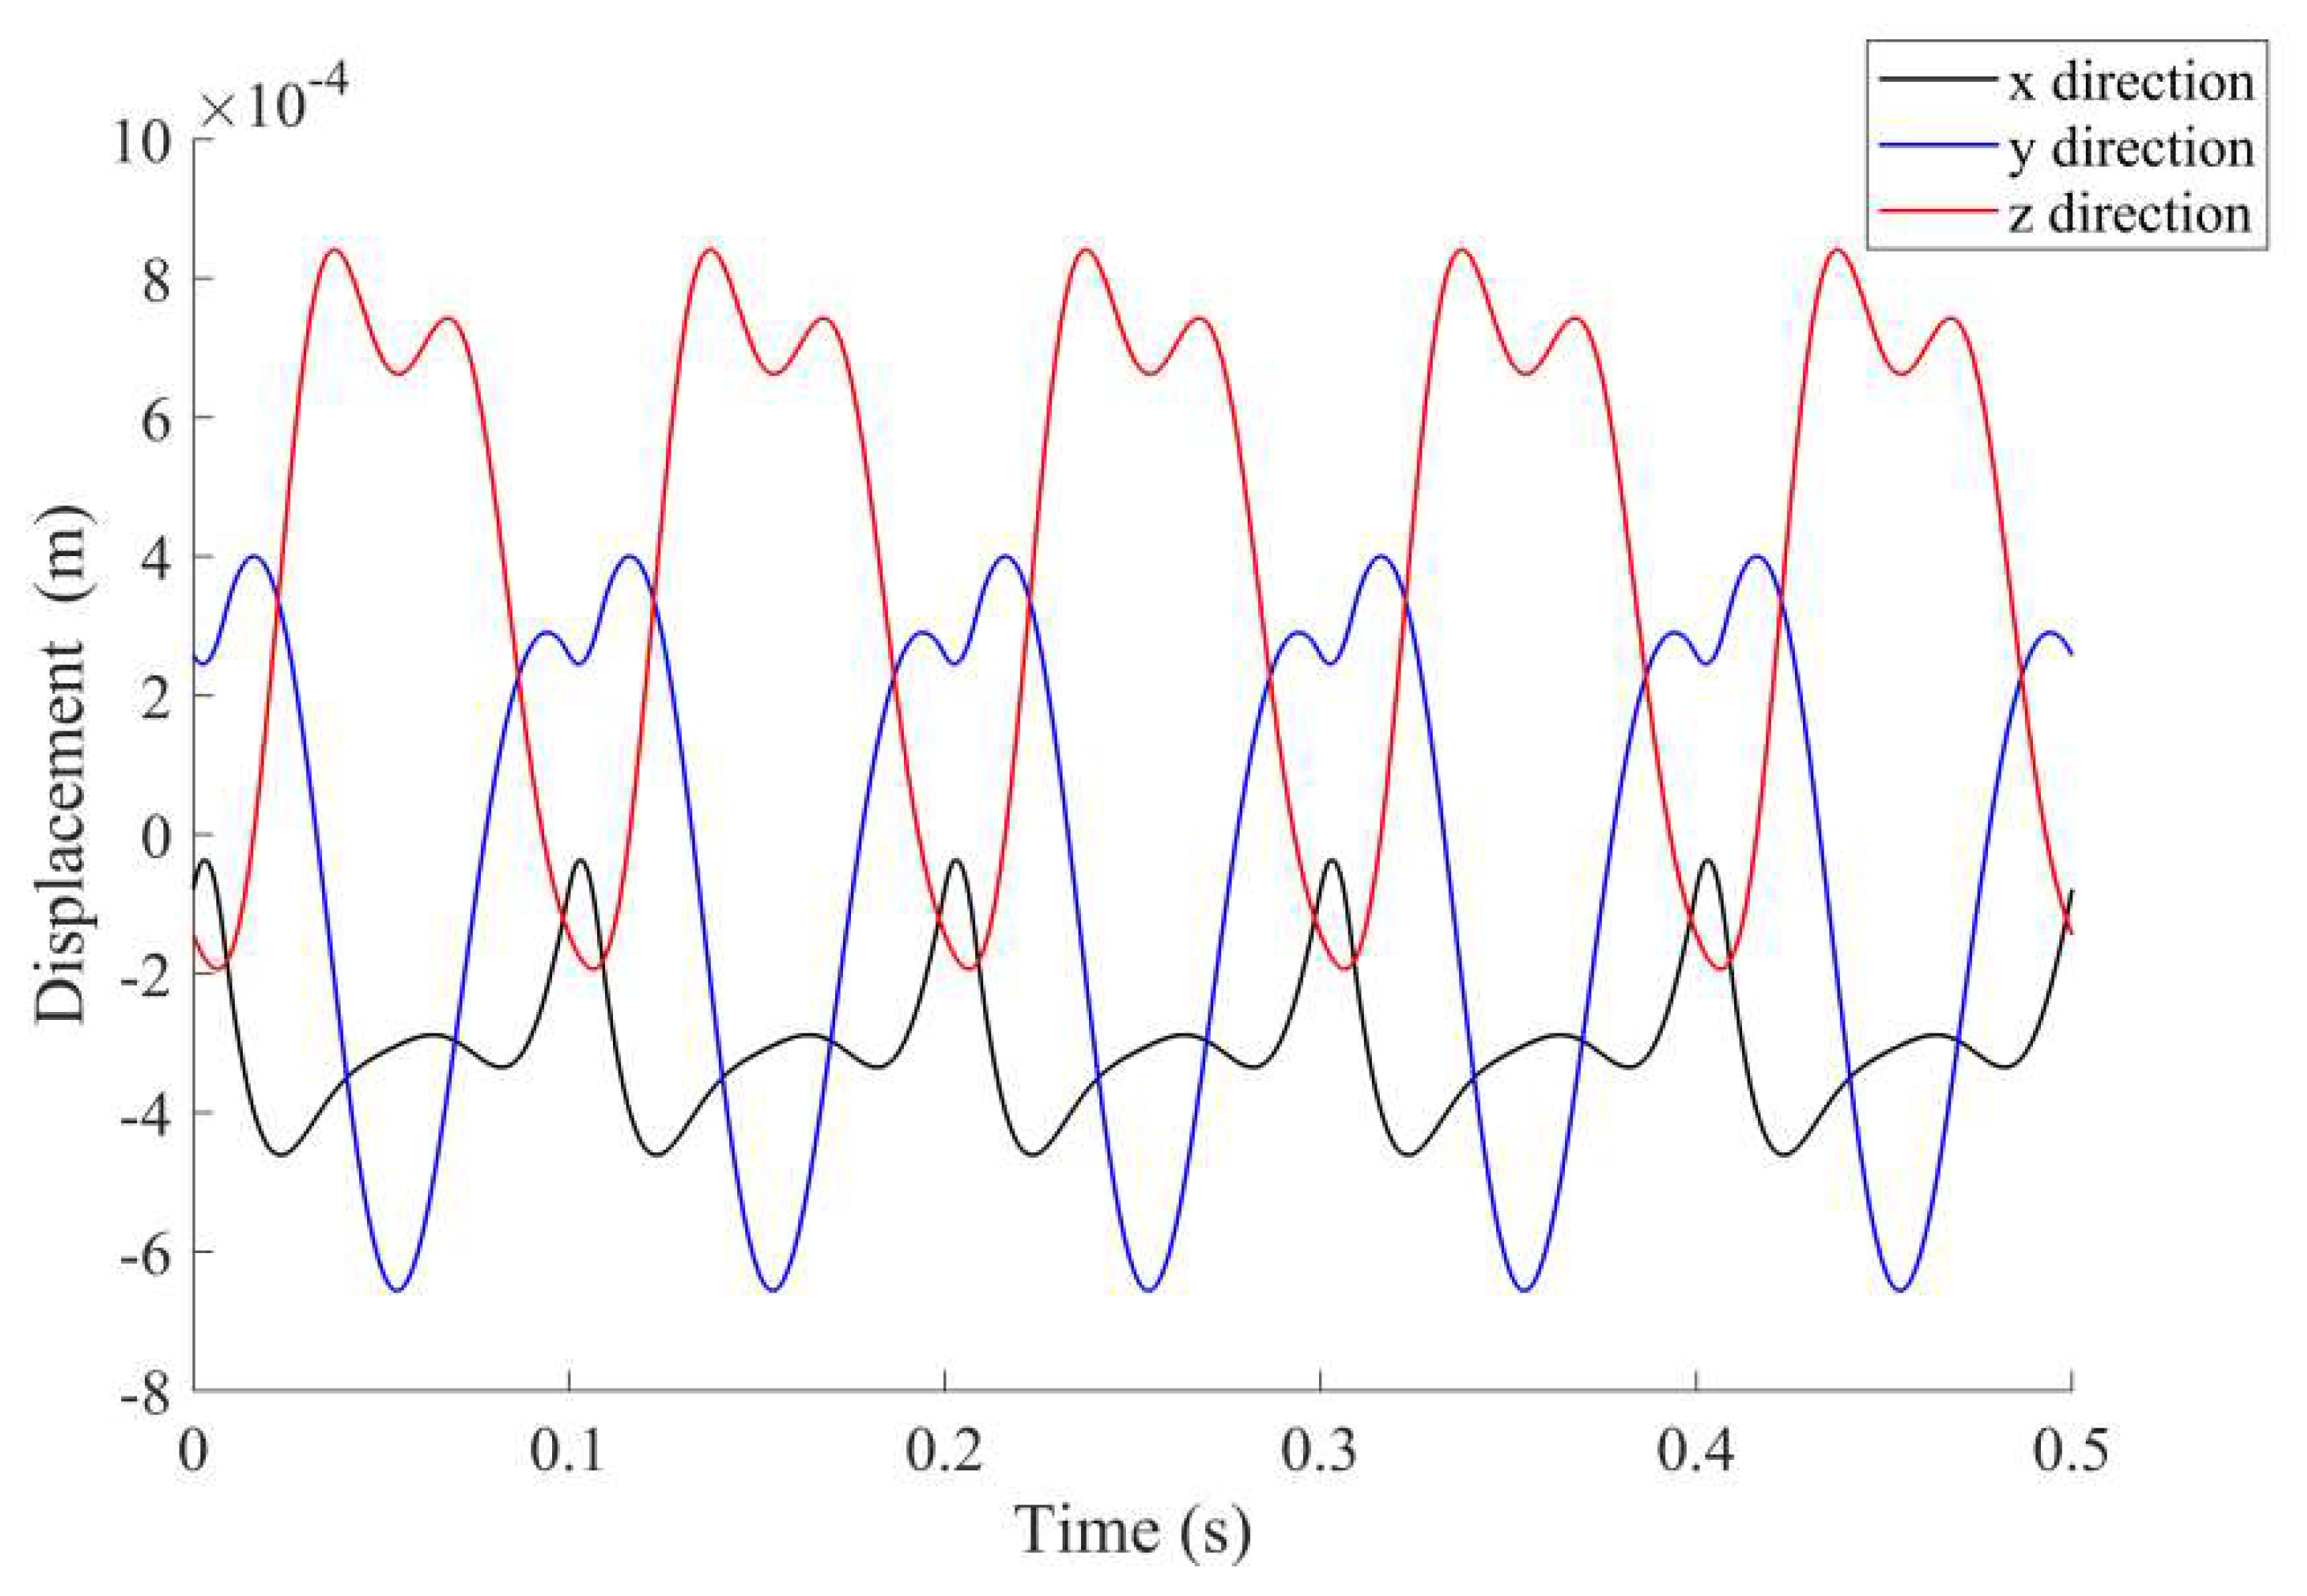
4.4. Performance Evaluation for Percussive Riveting

For the application scenario as illustrated in Figure 1, the robot can be subject to forces and torques in different directions and due to different processes within its operating workspace. As an example, we demonstrate the evaluation of vibration characteristics for robotic percussive riveting. This operation is completed by the robot with a percussive rivet gun and the principle of percussive riveting is illustrated in Figure 8. A rivet is first inserted into pre-drilled mating holes on the panels. Then the simulated robot drives a percussive rivet gun and another supporting robot (see Figure 8) drives a bucking bar to the riveting spot. Once the rivet gun and the bucking bar are aligned to the normal direction of the panels, the robot stops and activates the gun, and then the hammer of the gun repeatedly hits the rivet head. The impact forces cause the rivet to deform. When the diameter of the rivet becomes equal to the diameter of the pre-drilled holes, the panels are joined. For motion planning of the robotic riveting operations, operational space trajectory planning is used to avoid interference during the motion. Note that since the robot is stationary when its end-effector is subject to dynamic loading during its riveting operations, the trajectory between every two riveting spots does not affect the vibration characteristics if the forced vibration can be damped out during the motion from one spot to the next.
During percussive riveting, the end-effector is subject to repetitive impact forces normal to the panel. If the work frame is established on the panel at the riveting spot and with the z axis normal to the panel, then the process force and torque can be written in the work frame as below:
F = [ 0 , 0 , F ( t ) ] T τ = 0
The percussive impact force F(t) is plotted in Figure 9a, where the amplitude Fm is 550 N, the force frequency ων is about 62.8 rad/s (10 Hz), and Td/T is 0.08. The force F(t) is approximated by Fourier expansion using (22), with the Fourier coefficients drawn in Figure 9b for k = 0 ,   ± 1 ,   ± 2 ,   ,   ± 20 , i.e.,
F ( t ) k = 20 20 F k e j k w v t
Note that the force in (26) can be in different directions relative to the inertial frame for different parts with transformation (21).
The robot is used for the assembly in a cuboid-shaped operation workspace as drawn in Figure 10. The operation workspace can be determined by Points Pk with k from 1 to 8. The coordinates of P1 is [1, 0.5, 1]T (in m) and the length, height, and width of the operation workspace are P1 P2 = 1 m, P1 P4 = 0.8 m and P1 P5 = 0.5 m, respectively. The robot configurations corresponding to Points P1 to P4 are also plotted in Figure 10. To demonstrate the vibration of the robot joints due to the percussive impact force, the time and frequency responses of the tool displacement are analyzed for Point P1 when the percussive impact is along the –X direction (see Figure 10). The frequency response function for the tool displacement due to a force along the—X direction can be obtained from (7), and the magnitude of the frequency response function with different frequencies are plotted in Figure 11. If the dynamic loading is approximated as an expansion of Fourier series as (26). Then, the amplitude of the tool vibration depends on the Fourier coefficients and the frequency response function at the corresponding frequencies ( ω v , 2 ω v , 3 ω v as shown in Figure 11). It can be seen that the first two Fourier series have larger influence on the tool vibration than the other Fourier series. In addition, although the riveting force is along the –X direction, the tool displacement in the Z direction has a larger amplitude than those in the other two directions. Furthermore, the time response of the tool displacement can be computed by solving (1) and (3). The resulting tool displacement along different directions are plotted in Figure 12 for five periods of the external force (about 0.5 s). Again, the tool displacement in the Z direction has the largest amplitude among the three directions.
Now, we proceed to analyze the potential risk of the tool vibration when the percussive force acts in different directions on the robot end-effector. Once the maximum displacement-force frequency response ratio η vmax is given, then the maximum amplitude of TCP displacement due to the kth Fourier series of the periodic impact force Δ E v m a x , k can be easily calculated using (24). For example, the values of Δ E v m a x , k are plotted over the potential workspace when x is 0.5, 0.6, 0.7, 0.8, 0.9 and 1 m in Figure 13a,b, for k = ± 1 and ± 2 respectively. It can be found that the distributions of Δ E v m a x , k are symmetric about the o x z plane. When only considering the Fourier series with k = ± 1 , the amplitude of the TCP displacement can be as high as 2 × 10⁻³ m in certain positions where the first natural frequency of the robot (related to deflections of Joint 2 and Joint 3) is close to ω v . When only considering the Fourier series with k = ± 2 , the amplitude of the TCP displacement can be as high as 2.3 × 10⁻³ m in the positions where the second natural frequency (related to the deflection of Joint 1) is close to 2 ω v . It is also observed that when k > 4 , k ω v is beyond the robot’s natural frequencies, and the values of Δ E v m a x , k are much smaller than those for k = ± 1 , ± 2 , ± 3 and ± 4 .
A detailed investigation on the eigenvectors of matrix A v ( k ω v ) can give force components under which the maximum amplitude of TCP displacement due to the kth Fourier series occurs. The evaluation of Δ E v m a x , k calculated from (24) is conservative in this case, since the three force components in the riveting force (25) have identical phases which can be insufficient to meet the requirement for the phases of the components in the eigenvectors of A v ( k ω v ) . Note that the kth Fourier series cannot excite multiple vibration modes simultaneously since different mode shapes are orthogonal to each other, therefore. As a result, the maximum values of Δ E v m a x , k for k = ± 1 ,   ± 2 , , ± 20 are drawn over the operating workspace in Figure 14. This gives an efficient evaluation of the maximum amplitudes of TCP displacement due to the periodic impact force in (25). The robot users should consider whether the resulting tool misalignment is acceptable for process quality requirement within the operating workspace when developing the robotic system.

5. Conclusions

In this paper, displacement-force and displacement-torque frequency response ratios are defined for flexible-joint robots, which represent the mapping from the amplitudes of external harmonic force and torque to the amplitude of tool displacement respectively. The upper bounds of these ratios are used as indices for structural dynamics performance of the robot. These indices give the worst situation of the tool displacement due to harmonic excitation with amplitude of unit force and unit torque respectively. The development leads to an efficient method to evaluate the maximum tool misalignment due to periodic external force and torque.
Numerical simulation is carried out for a robotic system for aerospace assembly with large dynamic loading. It is found that the dynamics performance indices dramatically change with the excitation frequencies for a given robot configuration. They reach peak values at frequencies close to the natural frequencies of the robot. These peak values show that only considering the elastostatic performance is insufficient for dynamic processes. An eigenvector analysis can provide the amplitudes and phases of the force and torque components under which the worst situation of the tool vibration occurs. For a given process, the maximum tool misalignment can be easily evaluated by combining the robot-dependent indices and the process-dependent Fourier series, so that the robot users can consider whether the forced vibration behavior of the robot is acceptable for process quality requirement when developing the robotic system.
Although the structural dynamics model in this work is derived for flexible-joint robots and the case study is given for manufacturing applications, the two performance indices are applicable for other robots and other applications, once the frequency response functions are available, for example, through vibration tests. Therefore, a future research topic is the validation experiments for the proposed method on a real prototype.

Author Contributions

Conceptualization and methodology, Y.L. and P.Z.; simulation, P.Z.; validation and investigation, P.Z. and Y.L.; writing—original draft preparation, P.Z.; writing—review and editing, Y.L.; supervision, Y.L.; funding acquisition, Y.L. All authors have read and agreed to the published version of the manuscript.

Funding

This research was funded by the National Natural Science Foundation of China under Grant 51775322 and 61803251 and by Shanghai Robot Functional Platform.

Conflicts of Interest

The authors declare no conflicts of interest.

References

  1. Nof, S.Y. Handbook of Industrial Robotics, 2nd ed.; Wiley: New York, NY, USA, 1999. [Google Scholar]
  2. Lehmann, C.; Pellicciari, M.; Drust, M.; Gunnink, J.W. Machining with industrial robots: The COMET project approach. Robot. Smart Manuf. 2013, 371, 27–36. [Google Scholar]
  3. Brunete, A.; Gambao, E.; Koskinen, J.; Heikkilä, T.; Kaldestad, K.B.; Tyapin, I.; Hovland, G.; Surdilovic, D.; Hernando, M.; Bottero, A.; et al. Hard material small-batch industrial machining robot. Robot. Comput. Manuf. 2018, 54, 185–199. [Google Scholar] [CrossRef]
  4. Boeing: A Futuristic View of the 777 Fuselage Build. The Boeing Company: Chicago. Available online: http://www.boeing.com/features/2014/07/bca-777-fuselage-07-14-14.page (accessed on 20 May 2020).
  5. Chen, Y.H.; Dong, F.H. Robot machining: Recent development and future research issues. Int. J. Adv. Manuf. Tech. 2013, 66, 1489–1497. [Google Scholar] [CrossRef] [Green Version]
  6. Barnfather, J.D.; Goodfellow, M.J.; Abram, T. Achievable tolerances in robotic feature machining operations using a low-cost hexapod. Int. J. Adv. Manuf. Tech. 2017, 95, 1–16. [Google Scholar] [CrossRef] [Green Version]
  7. Schneider, U.; Drust, M.; Ansaloni, M. Improving robotic machining accuracy through experimental error investigation and modular compensation. Int. J. Adv. Manuf. Technol. 2016, 85, 1–13. [Google Scholar] [CrossRef]
  8. Barnfather, J.D.; Goodfellow, M.J.; Abram, T. Development and testing of an error compensation algorithm for photogrammetry assisted robotic machining. Measurement 2016, 94, 561–577. [Google Scholar] [CrossRef]
  9. Barnfather, J.D.; Goodfellow, M.J.; Abram, T. Photogrammetric measurement process capability for metrology assisted robotic machining. Measurement 2016, 78, 29–41. [Google Scholar] [CrossRef]
  10. Leali, F.; Vergnano, A.; Pini, F.; Pellicciari, M.; Berselli, G. A workcell calibration method for enhancing accuracy in robot machining of aerospace parts. Int. J. Adv. Manuf. Technol. 2016, 85, 47–55. [Google Scholar] [CrossRef] [Green Version]
  11. Marie, S.; Courteille, E.; Maurine, P. Elasto-geometrical modeling and calibration of robot manipulators: Application to machining and forming applications. Mech. Mach. Theory 2013, 69, 13–43. [Google Scholar] [CrossRef] [Green Version]
  12. Barnfather, J.D.; Abram, T. Efficient compensation of dimensional errors in robotic machining using imperfect point cloud part inspection data. Measurement 2018, 117, 176–185. [Google Scholar] [CrossRef]
  13. Slavkovic, N.R.; Milutinovic, D.S.; Glavonjic, M.M. A method for off-line compensation of cutting force-induced errors in robotic machining by tool path modification. Int. J. Adv. Manuf. Technol. 2014, 70, 2083–2096. [Google Scholar] [CrossRef]
  14. Belchior, J.; Guillo, M.; Courteille, E.; Maurine, P.; Leotoing, L.; Guines, D. Off-line compensation of the tool path deviations on robotic machining: Application to incremental sheet forming. Robot. Comput. Manuf. 2013, 29, 58–69. [Google Scholar] [CrossRef] [Green Version]
  15. Mejri, S.; Gagnol, V.; Le, T.; Sabourin, P.L.; Ray, P.; Paultre, P. Dynamic characterization of machining robot and stability analysis. Int. J. Adv. Manuf. Technol. 2016, 82, 351–359. [Google Scholar] [CrossRef]
  16. Tian, Y.; Wang, B.; Liu, J.; Chen, F.; Yang, S.; Wang, W.; Li, L. Research on layout and operational pose optimization of robot grinding system based on optimal stiffness performance. J. Adv. Mech. Des. Syst. 2017, 11. [Google Scholar] [CrossRef] [Green Version]
  17. Guo, Y.; Dong, H.; Ke, Y. Stiffness-oriented posture optimization in robotic machining applications. Robot. Comput. Manuf. 2015, 35, 69–76. [Google Scholar] [CrossRef]
  18. Li, Y.; Ji, J.; Guo, S.; Xi, F. Process parameter optimization of a mobile robotic percussive riveting system with flexible joints. J. Comput. Nonlin. Dyn. 2017, 12, 061005. [Google Scholar] [CrossRef]
  19. Zaghbani, I.; Songmene, V.; Bonev, I. An experimental study on the vibration response of a robotic machining system. Proc. Inst. Mech. Eng. Part B J. Eng. Manuf. 2013, 227, 866–880. [Google Scholar] [CrossRef]
  20. Tratar, J.; Pusavec, F.; Kopac, J. Tool wear in terms of vibration effects in milling medium-density fibreboard with an industrial robot. J. Mech. Sci. Technol. 2014, 28, 4421–4429. [Google Scholar] [CrossRef]
  21. Nie, S.; Li, Y.; Shuai, G.; Tao, S.; Xi, F. Modeling and simulation for fatigue life analysis of robots with flexible joints under percussive impact forces. Robot. Comput. Manuf. 2016, 37, 292–301. [Google Scholar] [CrossRef]
  22. Mousavi, S.; Gagnol, V.; Bouzgarrou, B.C.; Ray, P. Model-based stability prediction of a machining robot. In New Advances in Mechanisms, Mechanical Transmissions and Robotics; Corves, B., Lovasz, E.-C., Husing, M., Maniu, I., Gruescu, C., Eds.; Springer: Berlin, Germany, 2017; Volume 46, pp. 379–387. [Google Scholar]
  23. Wang, G.; Dong, H.; Guo, Y.; Ke, Y. Chatter mechanism and stability analysis of robotic boring. Int. J. Adv. Manuf. Technol. 2017, 91, 411–421. [Google Scholar] [CrossRef]
  24. Li, J.; Li, B.; Shen, N.; Qian, Y.H.; Guo, Z.M. Effect of the cutter path and the workpiece clamping position on the stability of the robotic milling system. Int. J. Adv. Manuf. Technol. 2016, 89, 2919–2933. [Google Scholar] [CrossRef]
  25. Tunc, L.T.; Stoddart, D. Tool path pattern and feed direction selection in robotic milling for increased chatter-free material removal rate. Int. J. Adv. Manuf. Technol. 2017, 89, 2907–2918. [Google Scholar] [CrossRef] [Green Version]
  26. Siciliano, B.; Khatib, O. Springer Handbook of Robotics; Springer: Berlin, Germany, 2008; pp. 987–1008. [Google Scholar]
  27. Gosselin, C.M.; Angeles, J. A global performance index for the kinematic optimization of robotic manipulators. ASME J. Mech. Des. 1991, 113, 220–226. [Google Scholar] [CrossRef]
  28. Koeppe, R.; Yoshikawa, T. Dynamic manipulability analysis of compliant motion. In Proceedings of the IEEE International Conference on Intelligent Robots and Systems, Grenoble, France, 8–12 September 1997. [Google Scholar]
  29. Chiacchio, P. Dynamic manipulability ellipsoid for redundant manipulators. Robotica 2000, 18, 381–387. [Google Scholar] [CrossRef]
  30. Graettinger, T.J.; Krogh, B.H. The acceleration radius: A global performance measure for robotic manipulators. Int. J. Robot. Autom. 1988, 4, 60–69. [Google Scholar] [CrossRef]
  31. Kurazume, R.; Hasegawa, T. A new index of serial-link manipulator performance combining dynamic manipulability and manipulating force ellipsoids. IEEE Trans. Robot. 2006, 22, 1022–1028. [Google Scholar] [CrossRef]
  32. Liu, X.J.; Jin, Z.L.; Gao, F. Optimum design of 3-DOF spherical parallel manipulators with respect to the conditioning and stiffness indices. Mech. Mach. Theory 2000, 35, 1257–1267. [Google Scholar] [CrossRef]
  33. Courteille, E.; Deblaise, D.; Maurine, P. Design optimization of a delta-like parallel robot through global stiffness performance evaluation. In Proceedings of the IEEE/RSJ International Conference on Intelligent Robots and Systems, St. Louis, MO, USA, 15 November 2009. [Google Scholar]
  34. Scalera, L.; Palomba, I.; Wehrle, E.; Gasparetto, A.; Vidoni, R. Natural motion for energy saving in robotic and mechatronic systems. Appl. Sci. 2019, 9, 3516. [Google Scholar] [CrossRef] [Green Version]
  35. Zhang, F. Matrix Theory: Basic Results and Techniques, 2nd ed.; Springer: New York, NY, USA, 2011; pp. 253–292. [Google Scholar]
  36. Behi, F.; Tesar, D. Parametric identification for industrial manipulators using experimental modal analysis. IEEE Trans. Robot. Autom. 1991, 7, 642–652. [Google Scholar] [CrossRef]
  37. Zhang, D.; Wei, B. Novel Design and Applications of Robotics Technologies; IGI Global: Hershey, PA, USA, 2019; pp. 26–65. [Google Scholar]
Figure 1. Mobile robotic assembly system.
Applsci 10 04895 g001
Figure 2. Kinematic scheme.
Applsci 10 04895 g002
Figure 3. Reference frames for simulated robot.
Applsci 10 04895 g003
Figure 4. ηυmax with different force and torque frequencies at two points.
Applsci 10 04895 g004
Figure 5. ηwmax with different force and torque frequencies at two points.
Applsci 10 04895 g005
Figure 6. Distribution of ηυmax over robot workspace.
Applsci 10 04895 g006
Figure 7. Distribution of ηwmax over robot workspace.
Applsci 10 04895 g007
Figure 8. Principle of percussive riveting.
Applsci 10 04895 g008
Figure 9. Periodic impact force: (a) time history; (b) Fourier coefficients
Applsci 10 04895 g009
Figure 10. Potential operation workspace (in red).
Applsci 10 04895 g010
Figure 11. Frequency response function of tool displacement at P1 under a force along—X direction.
Applsci 10 04895 g011
Figure 12. Time responses of tool displacement at P1 under a percussive force along—X direction.
Applsci 10 04895 g012
Figure 13. Maximum amplitudes of TCP displacement due to the kth Fourier series: (a) k = ± 1 ; (b) k = ± 2 .
Applsci 10 04895 g013
Figure 14. Maximum value of Δ E v m a x , k over the operating workspace.
Applsci 10 04895 g014
Table 1. Inertial properties of links.
LinkMasses (kg)Position Vector of CG (m)Inertia Tensors (kg-m2)
180(0, 0, 0.1)diag(0.9, 1, 1)
240(0.4, 0, 0)diag(0.6, 6.5, 6.5)
355(0.4, 0, 0)diag(0.8, 9.5, 9.5)
Table 2. The Denavit–Hartenberg parameters of the links.
i α i   ( rad ) a i   ( m ) d i   ( m ) θ i   ( rad )
1000.20
2 π / 2 00 π / 2
300.800
Table 3. Mean and maximum values of both indices over workspace with different excitation frequencies.
Indicesω = 20 Hzω = 30 Hzω = 40 Hzω = 50 Hzω = 60 Hzω = 70 Hzω = 80 Hz
Mean value of ηυmax (10−5 m/N)2.27864.38756.36163.28732.22361.43211.2691
Maximum value of ηυmax (10−5 m/N)4.585013.10015.7708.06137.28065.84104.7531
Mean value of ηwmax (10−5/N)2.21453.91725.74683.32862.23131.51491.4133
Maximum value of ηwmax (10−5/N)3.49369.723813.8699.05985.03084.48934.0502

