Pedestrian Attribute Analysis Using Agent-Based Modeling


Abstract
1. Introduction
2. Methods
2.1. Data Collection
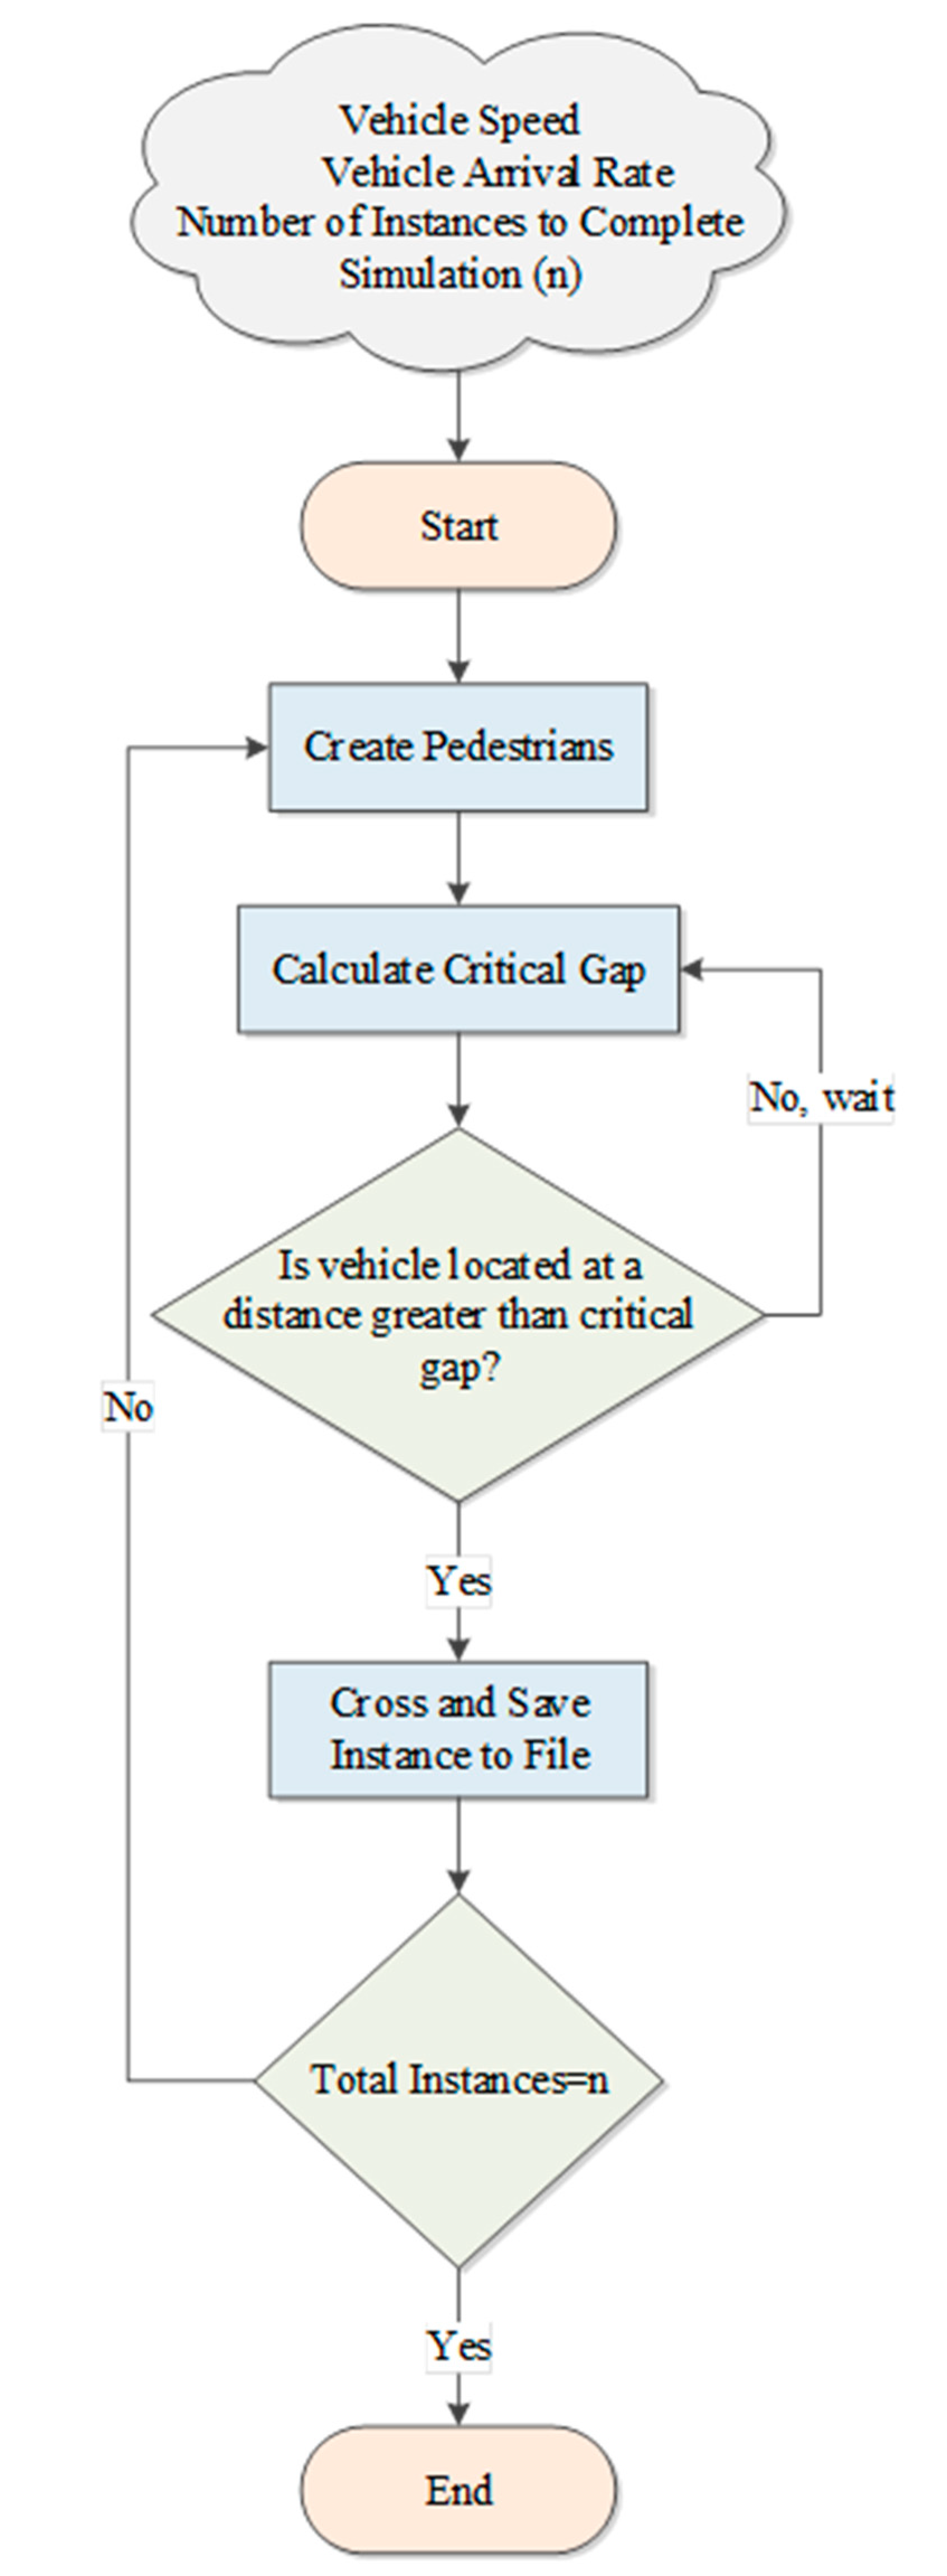
2.2. Agent-Based Pedestrian Model
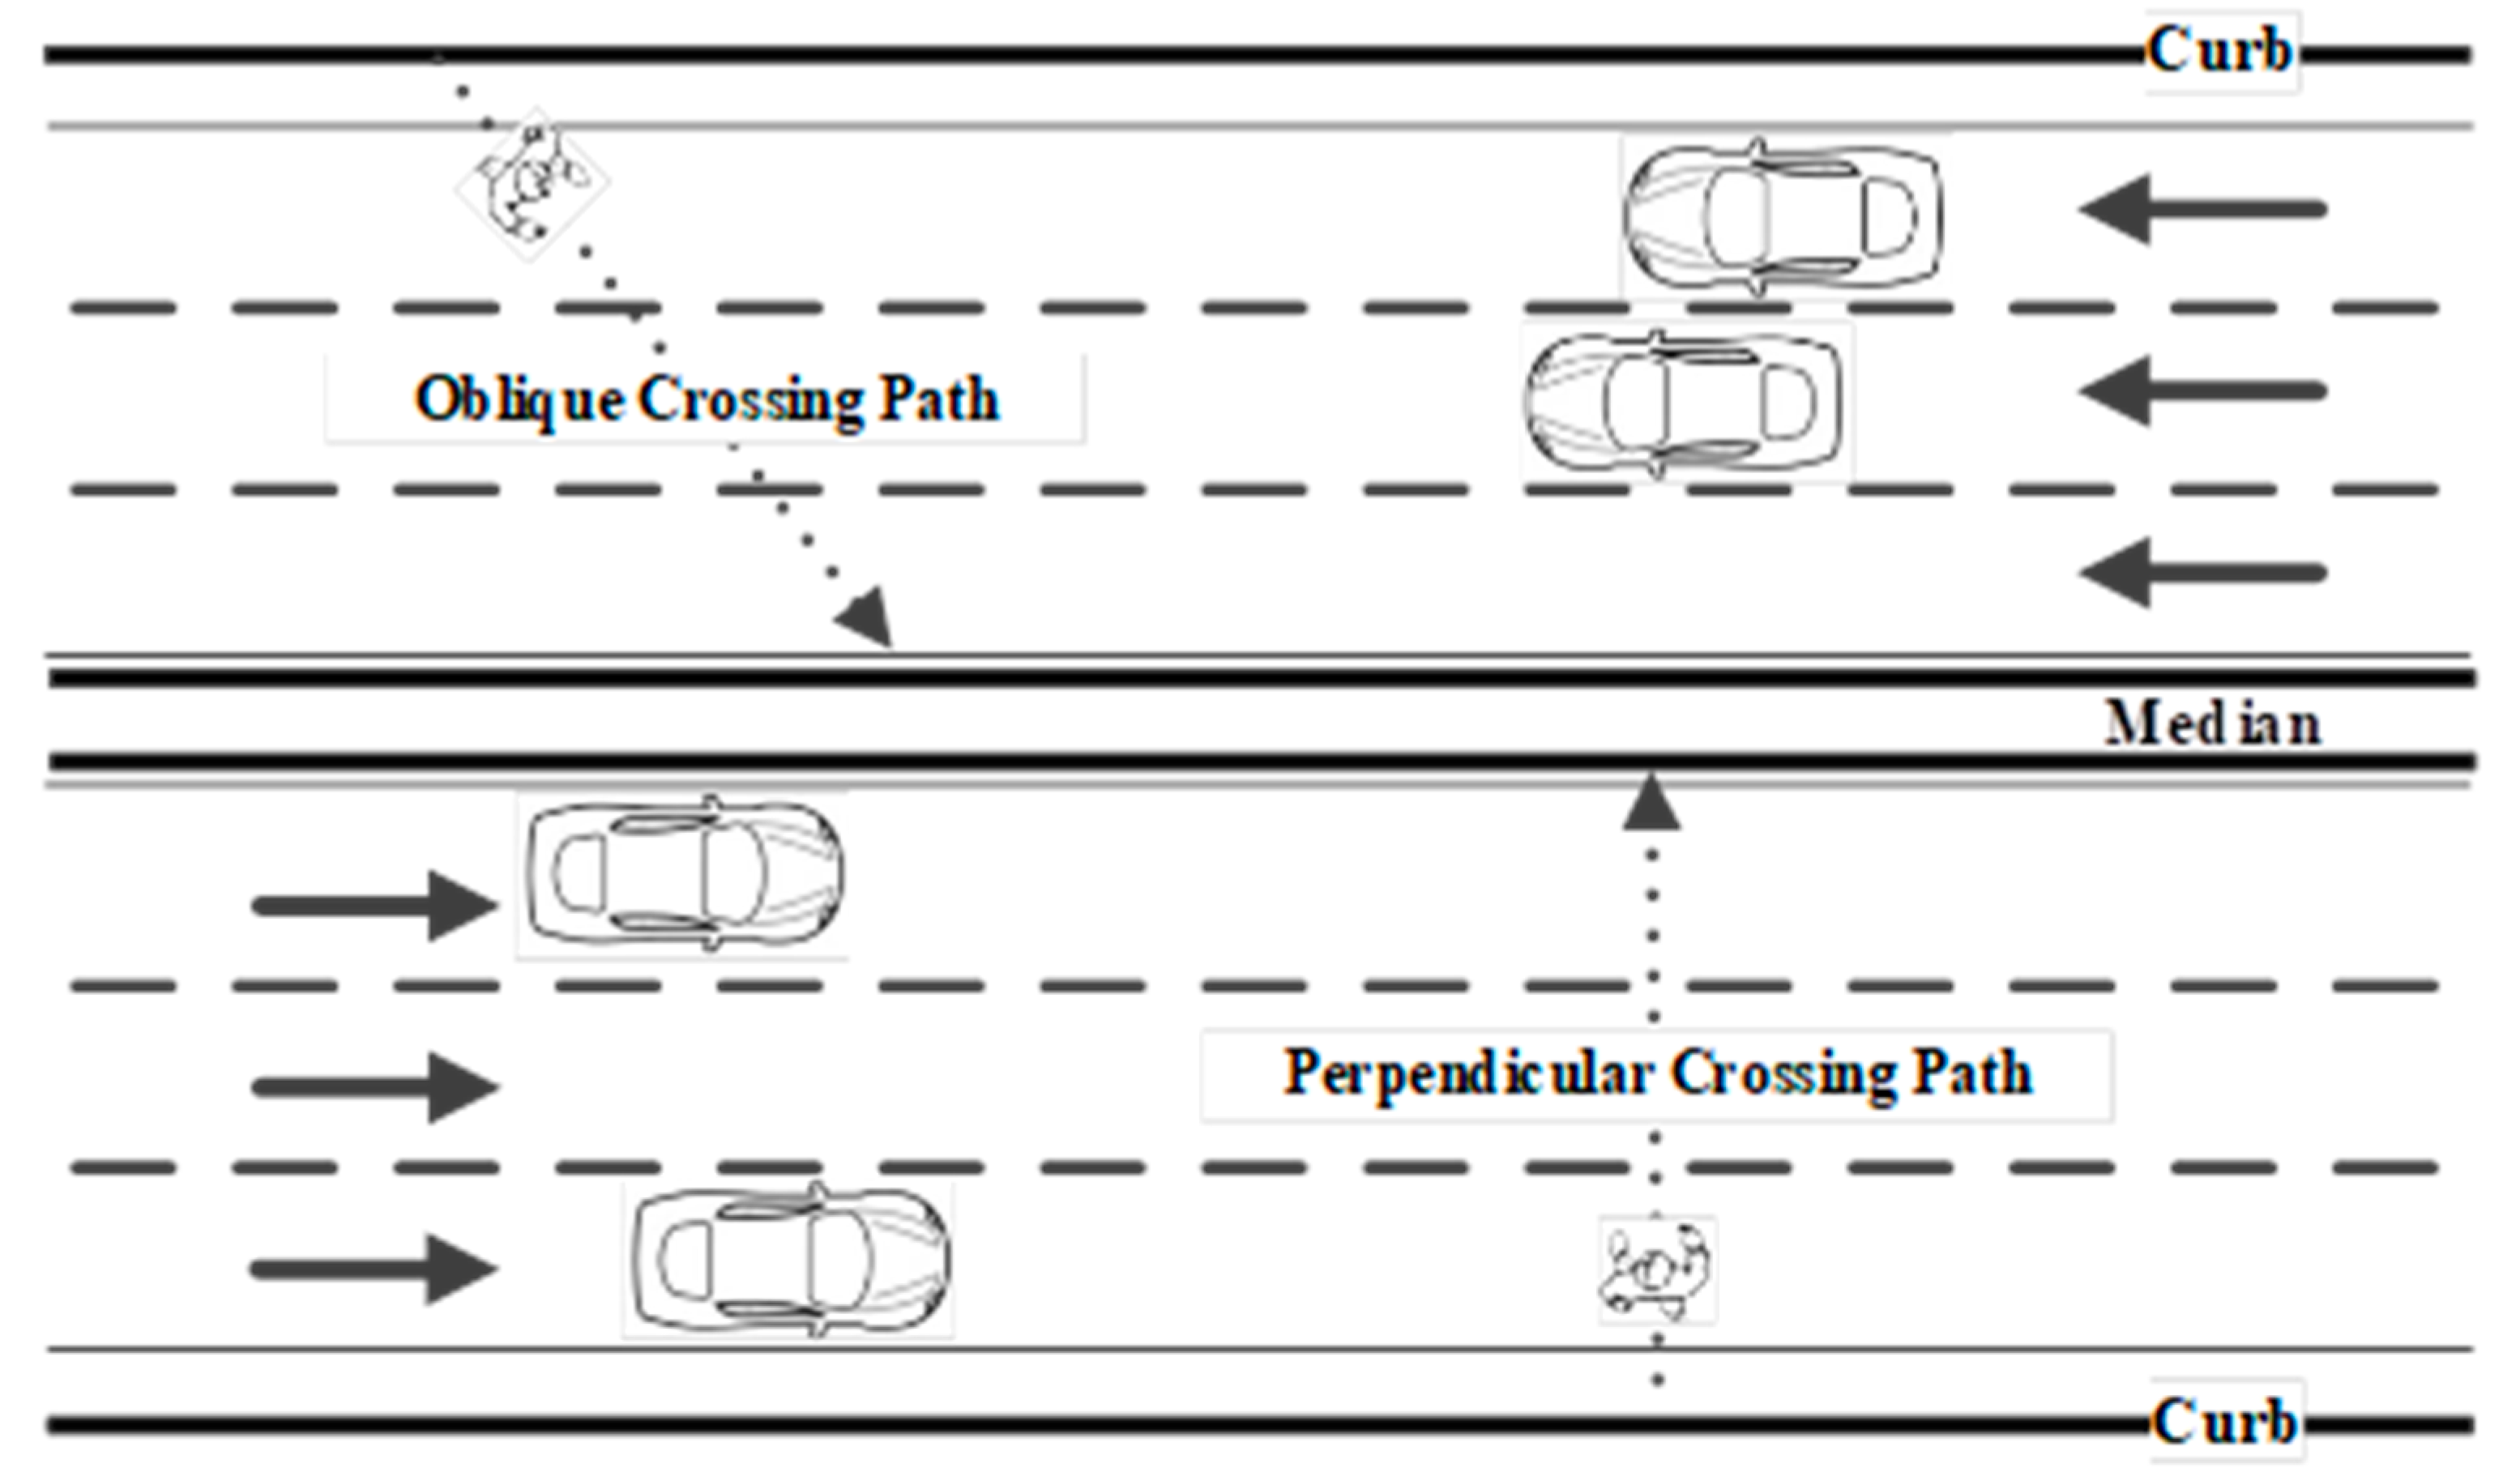
2.3. Environment Module
2.4. Agent Module
2.5. Critical Gap Computation Module
- Dm is the minimum critical gap distance necessary for crossing safely,
- Dl is the width that needs to be crossed (3.65 m if the critical vehicle is located in the near lane, 7.30 m in the middle lane, and 10.95 m in the far lane),
- Sv is the speed of the vehicle,
- Sp is the pedestrian speed of 1.73 m/s as calculated from the pedestrian speed data.
2.6. Graphical Interface
3. Analysis
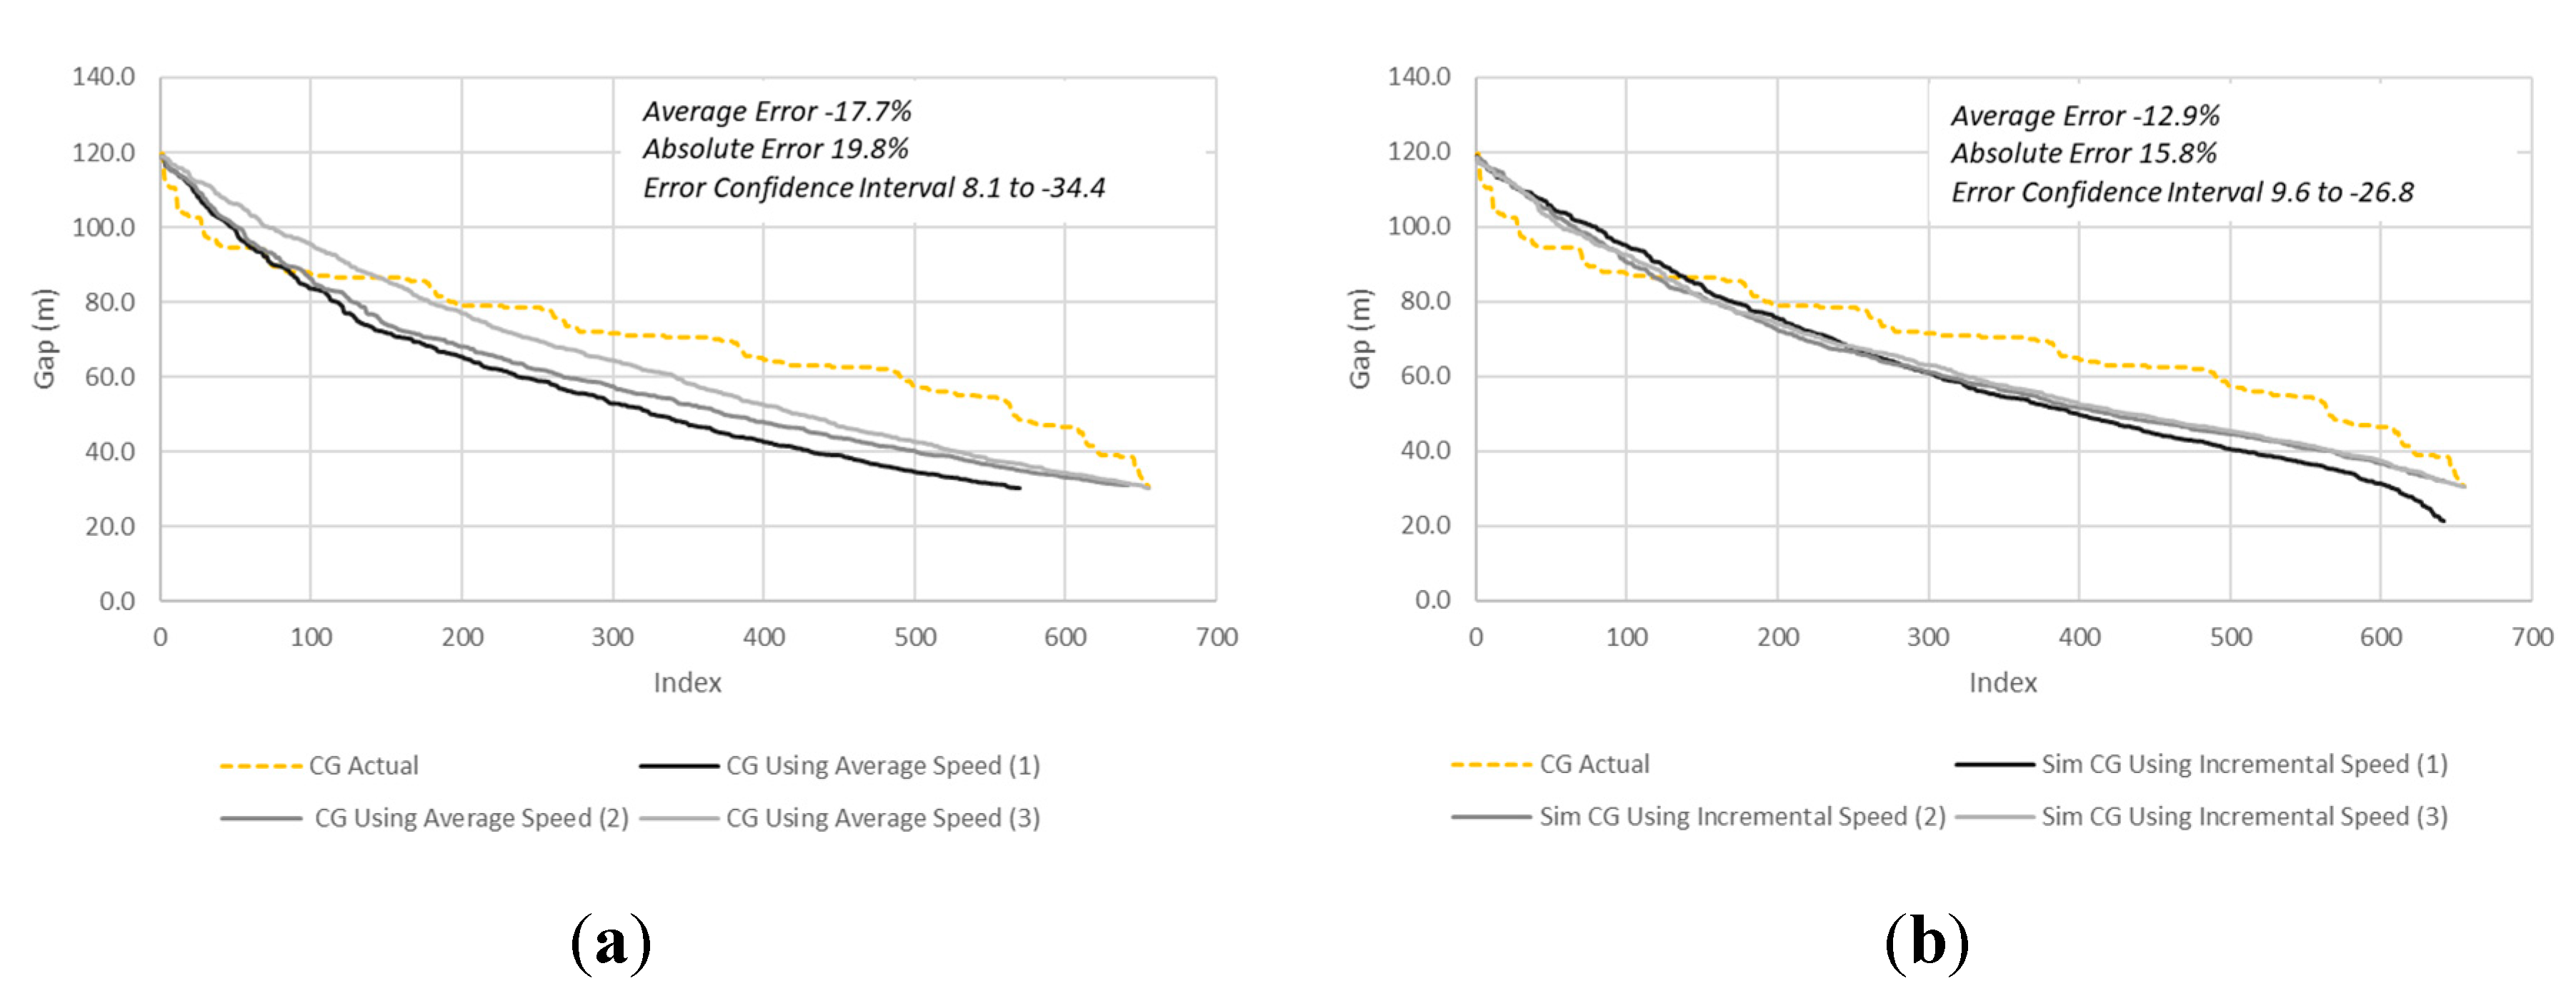
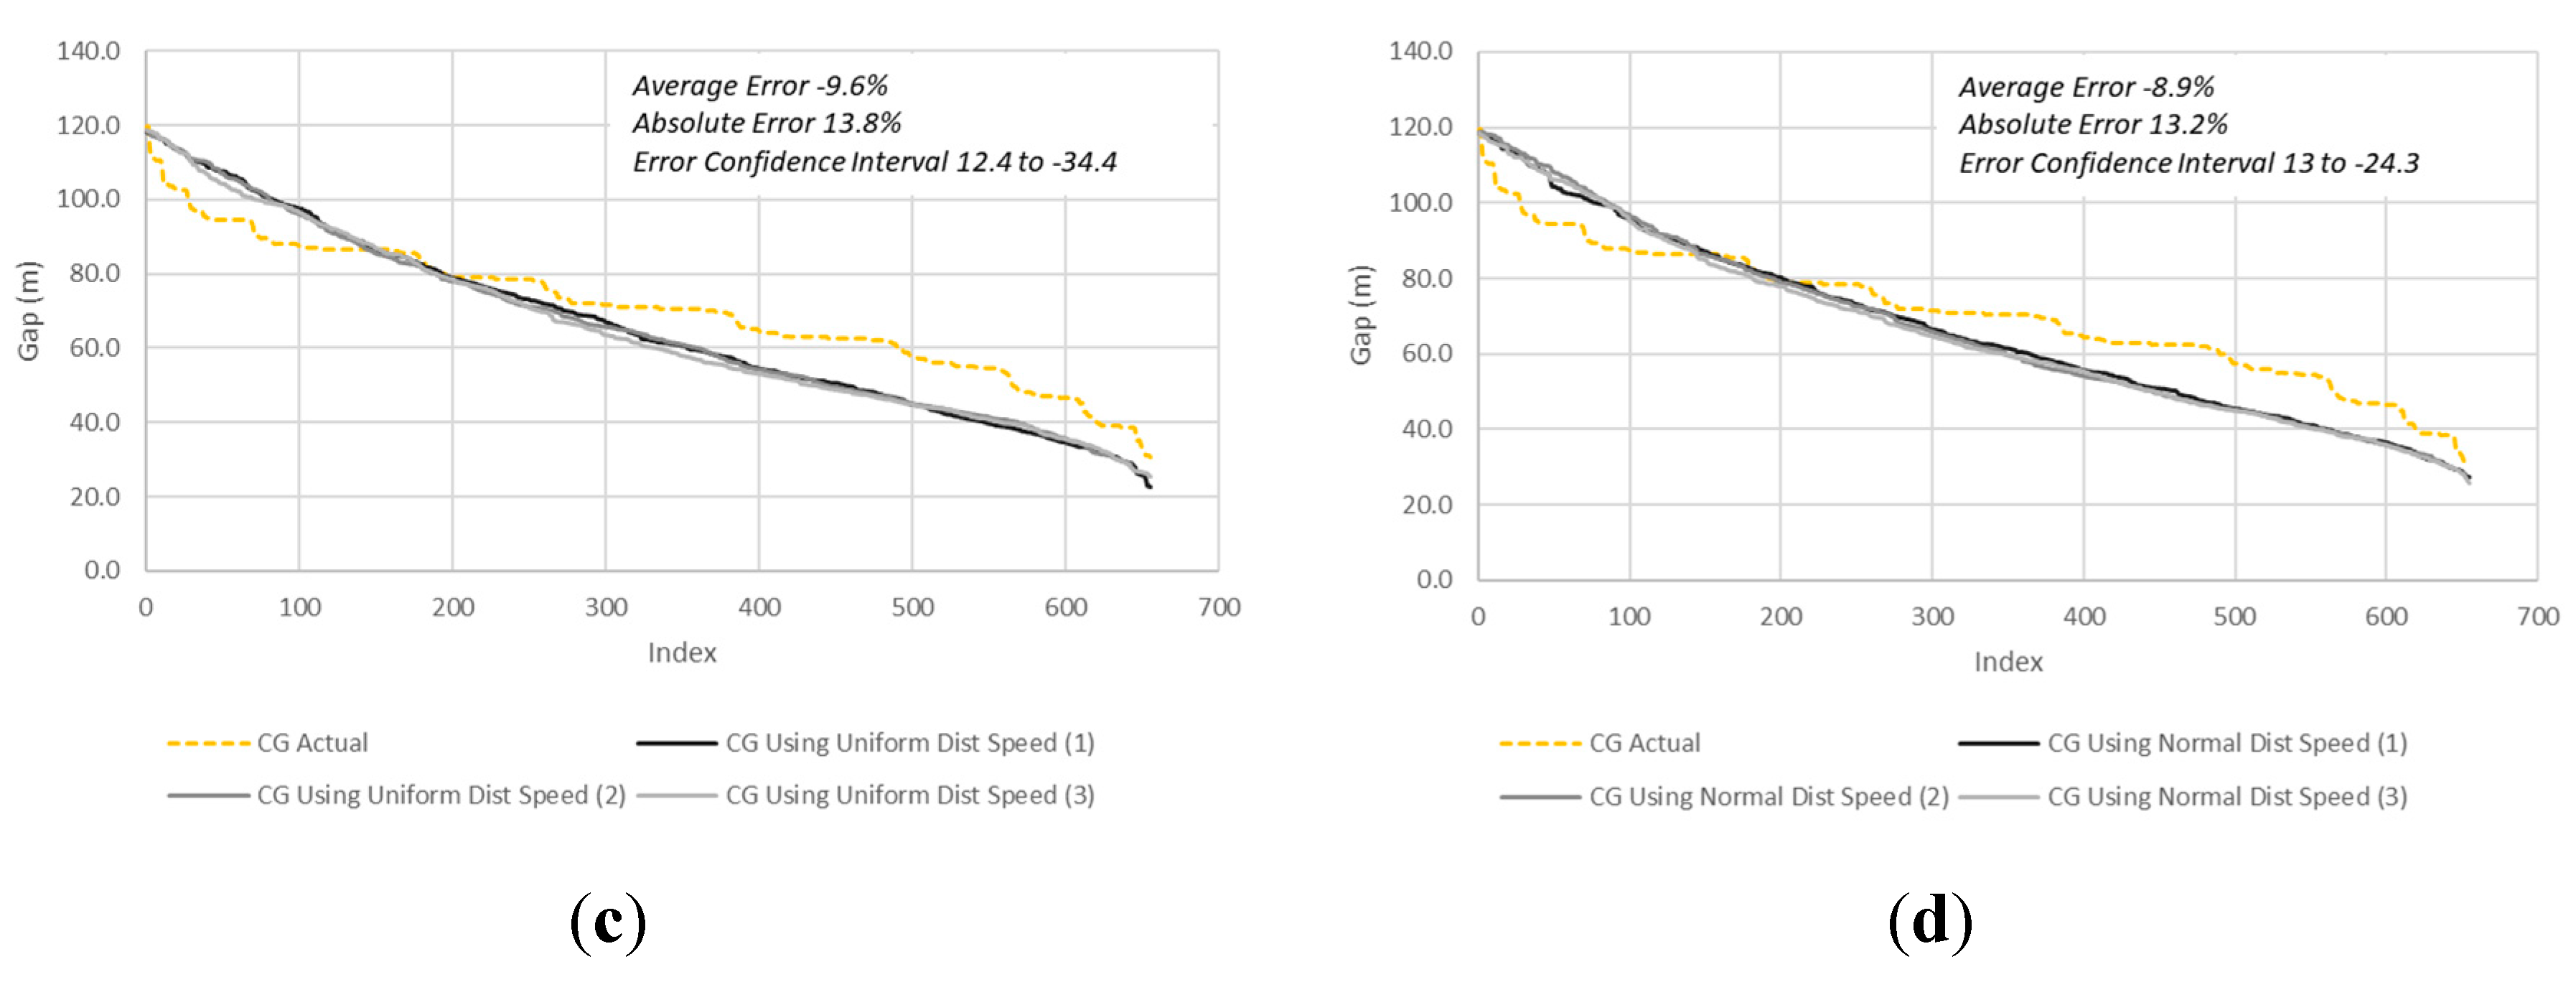
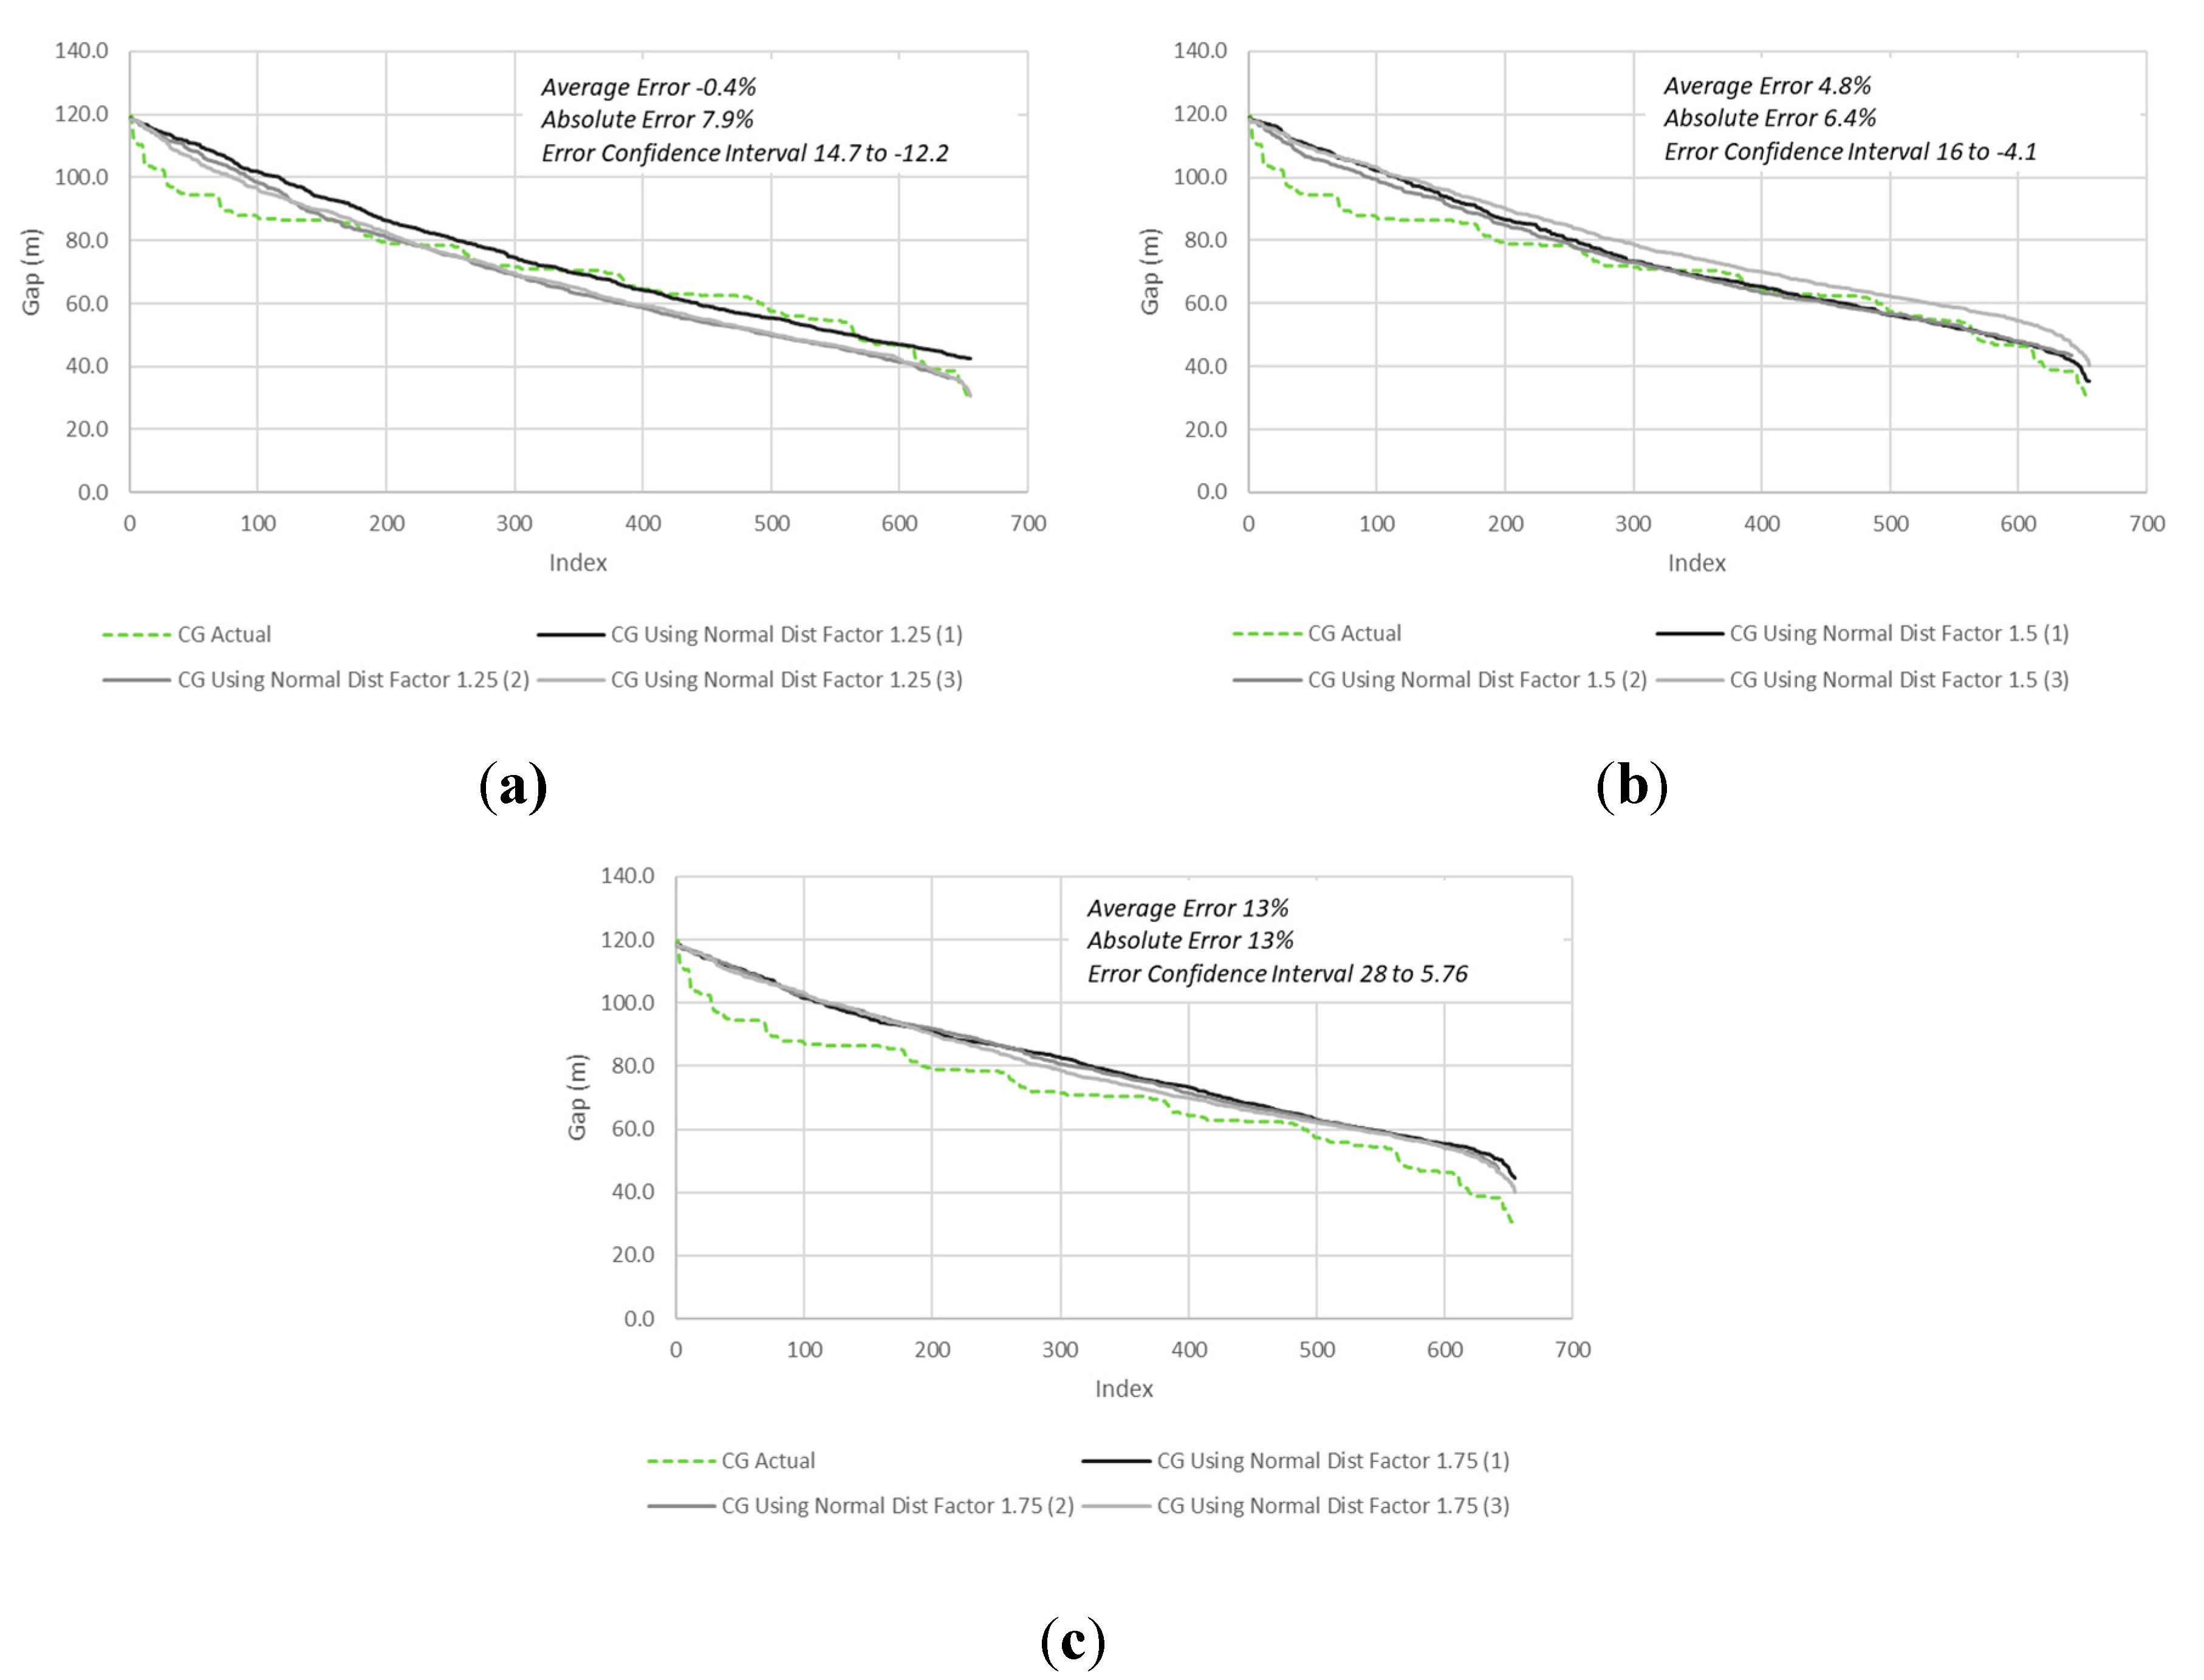
3.1. Model Calibration
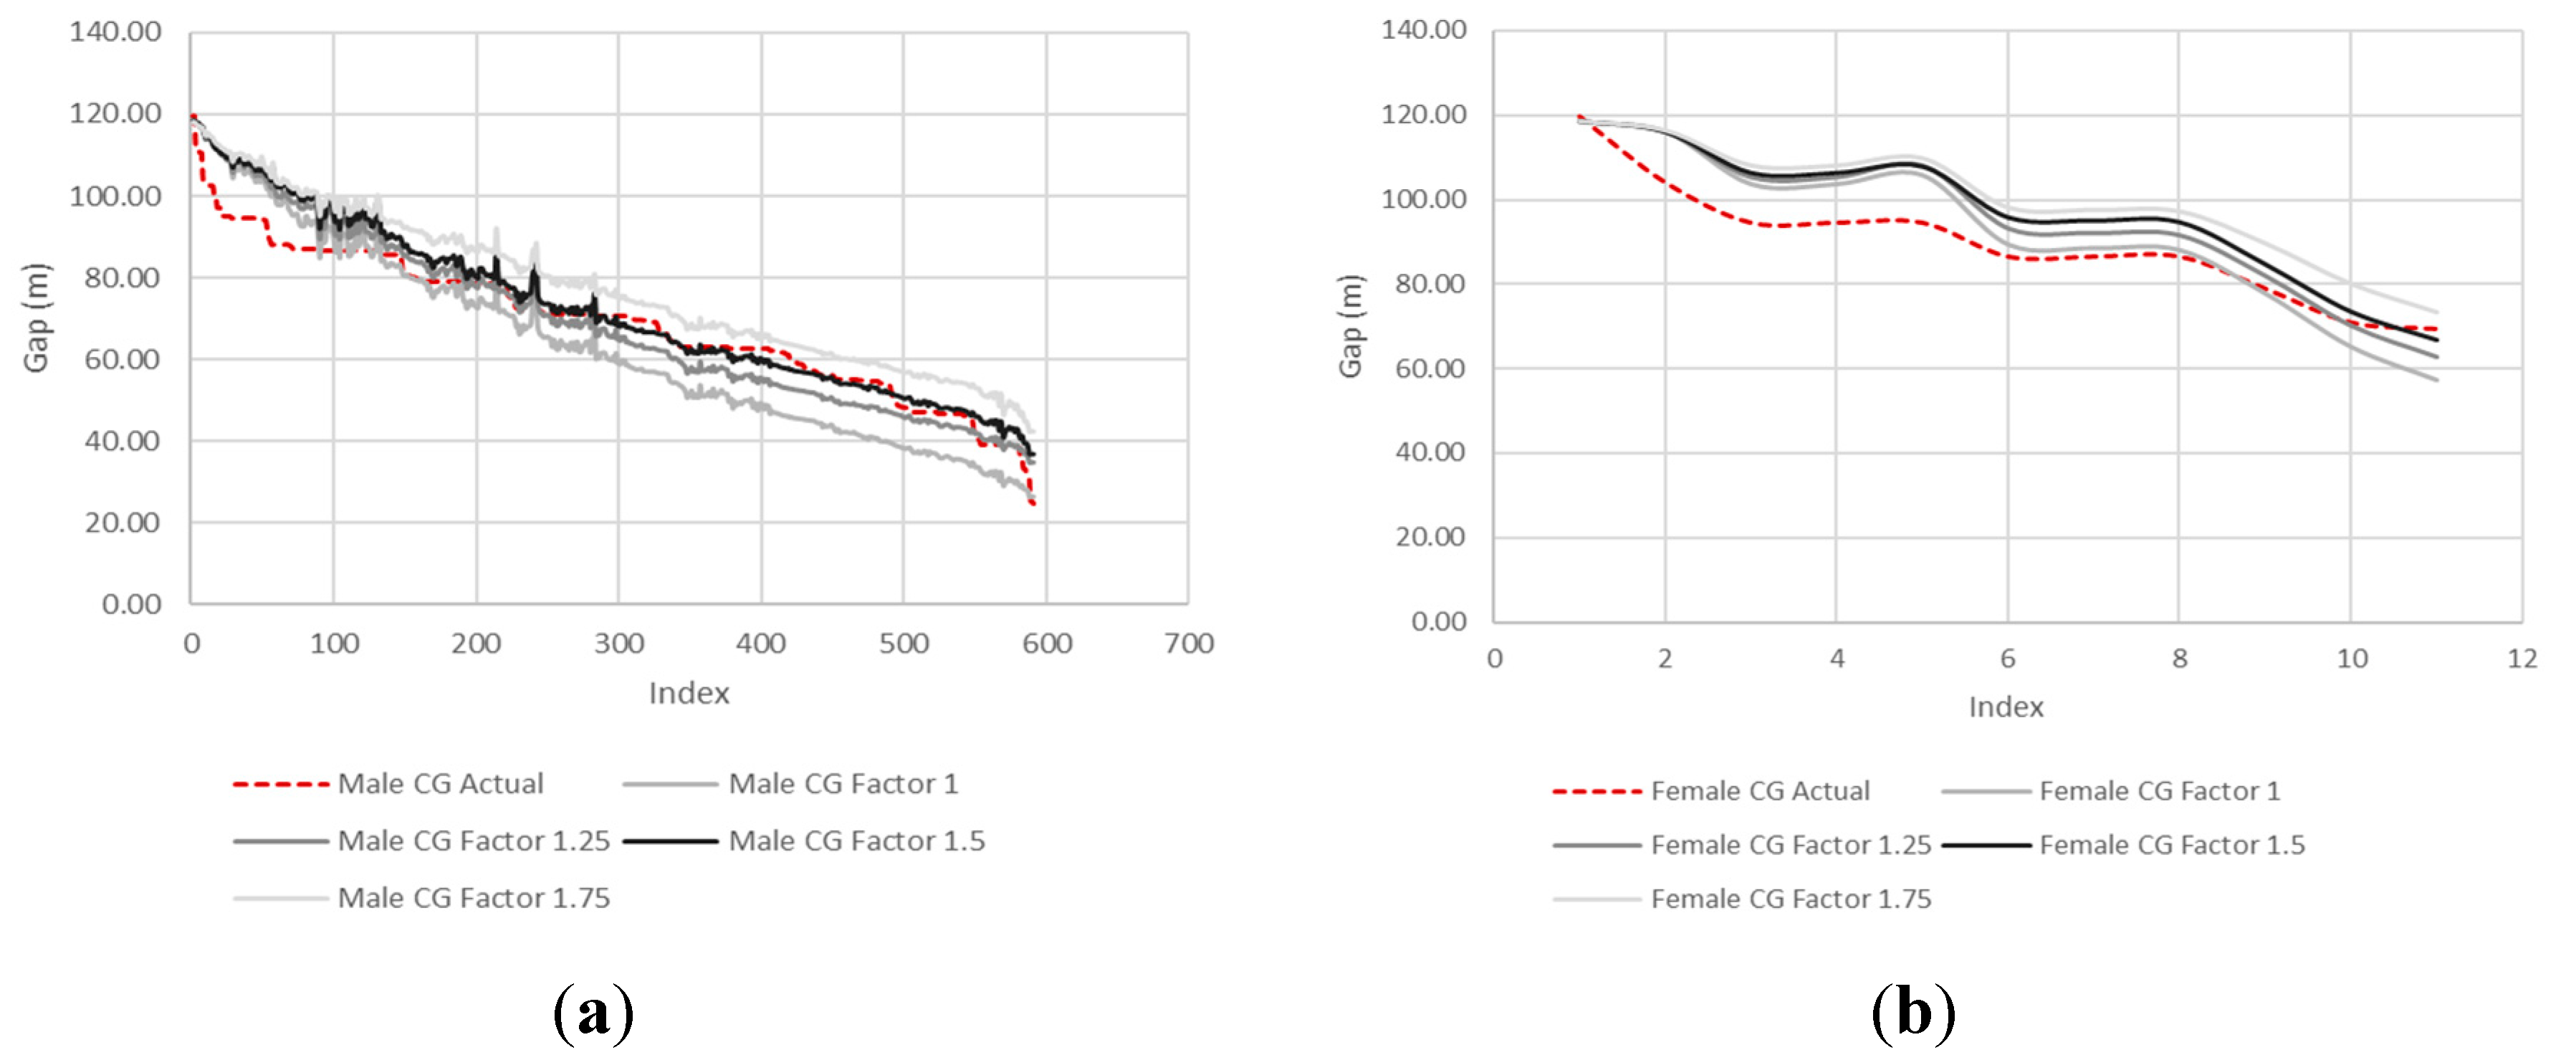
3.2. Gender
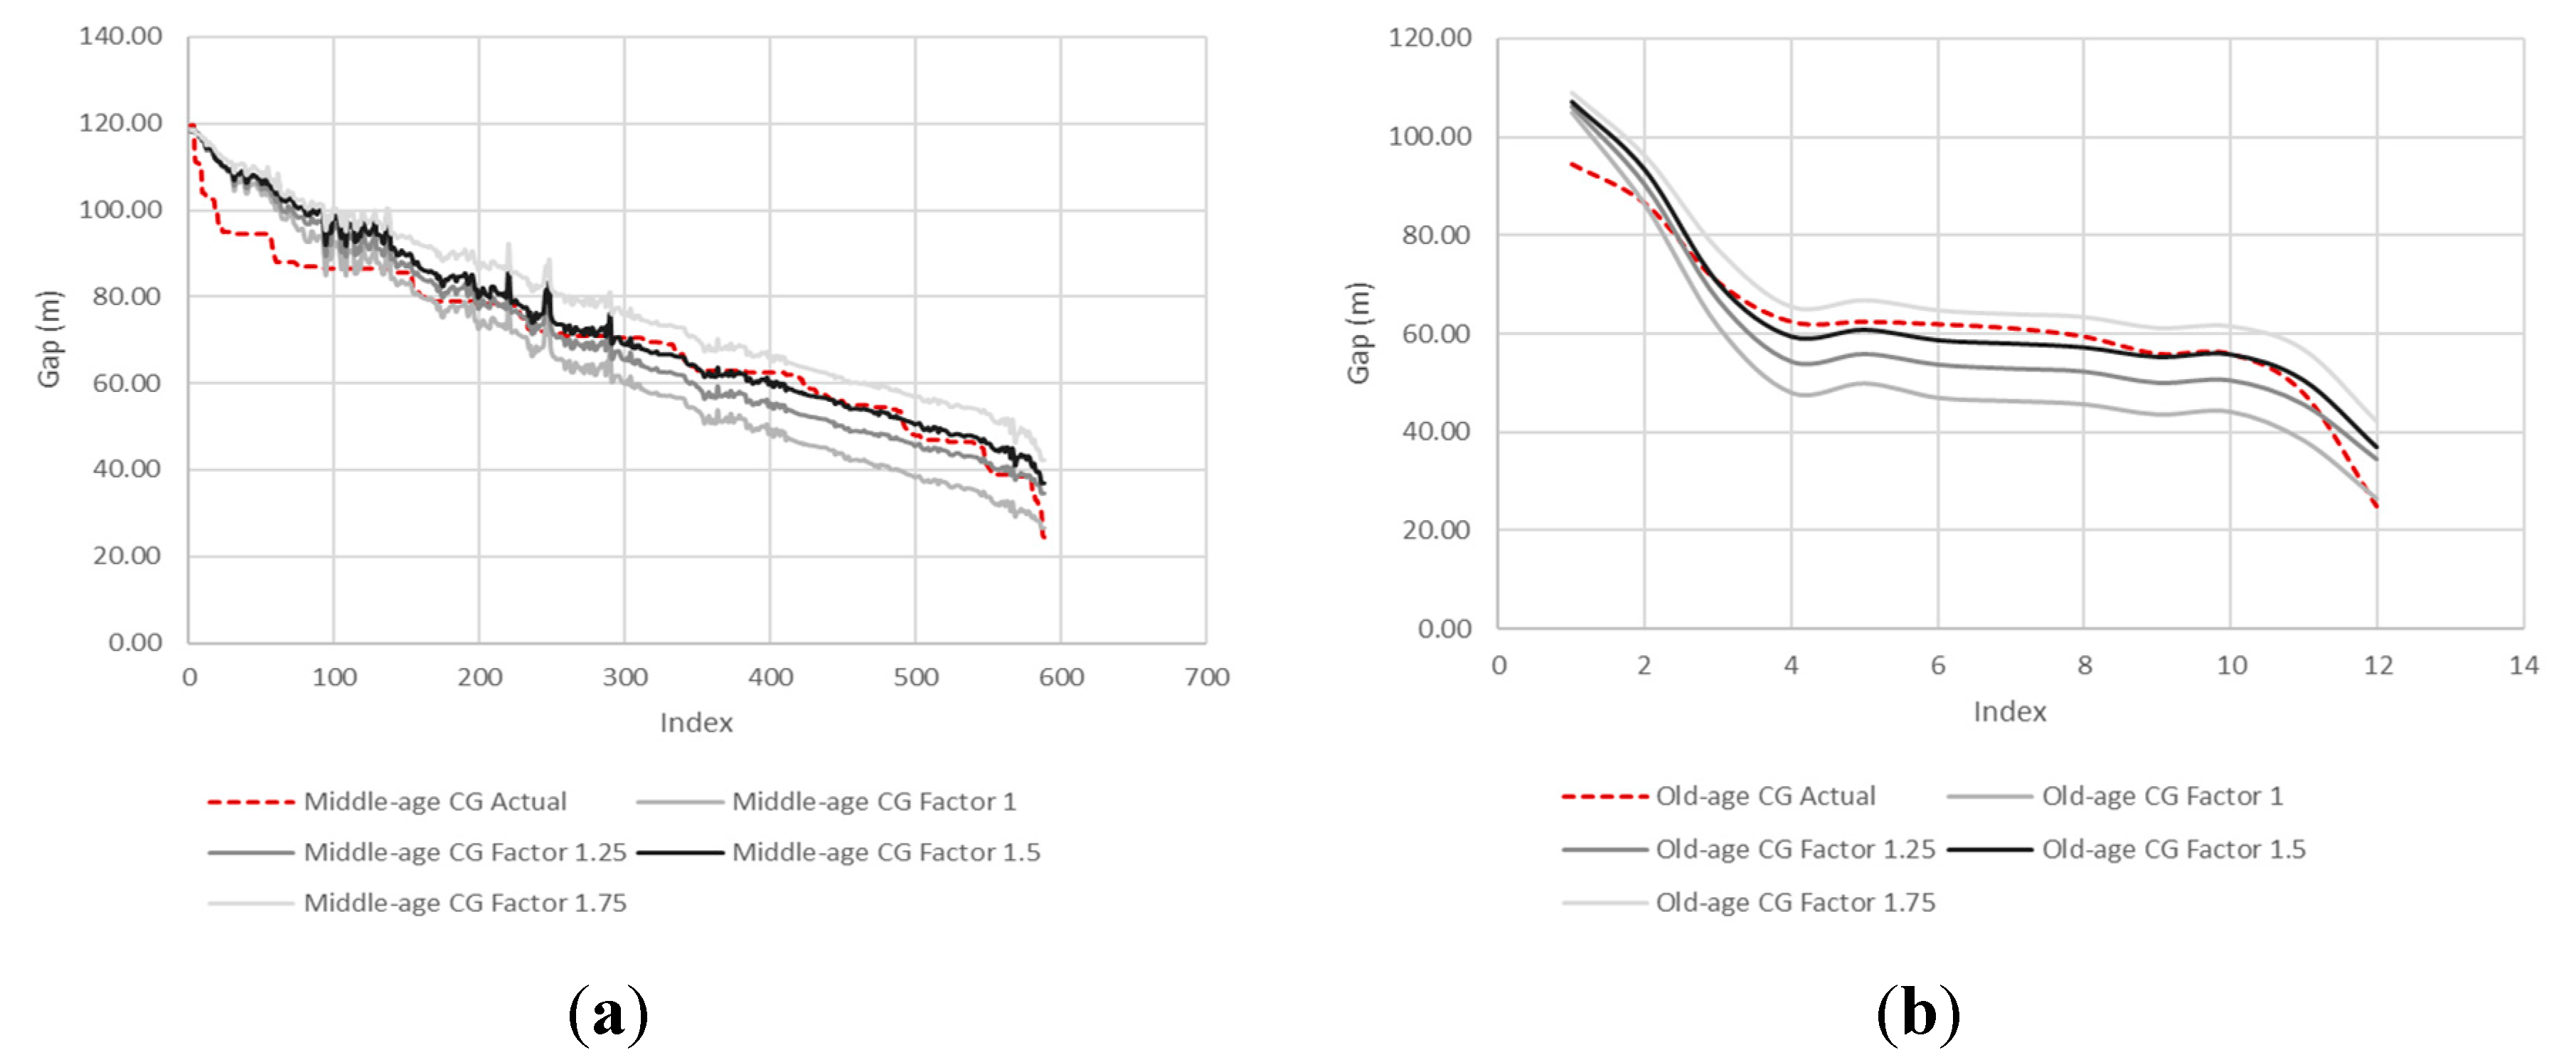
3.3. Age
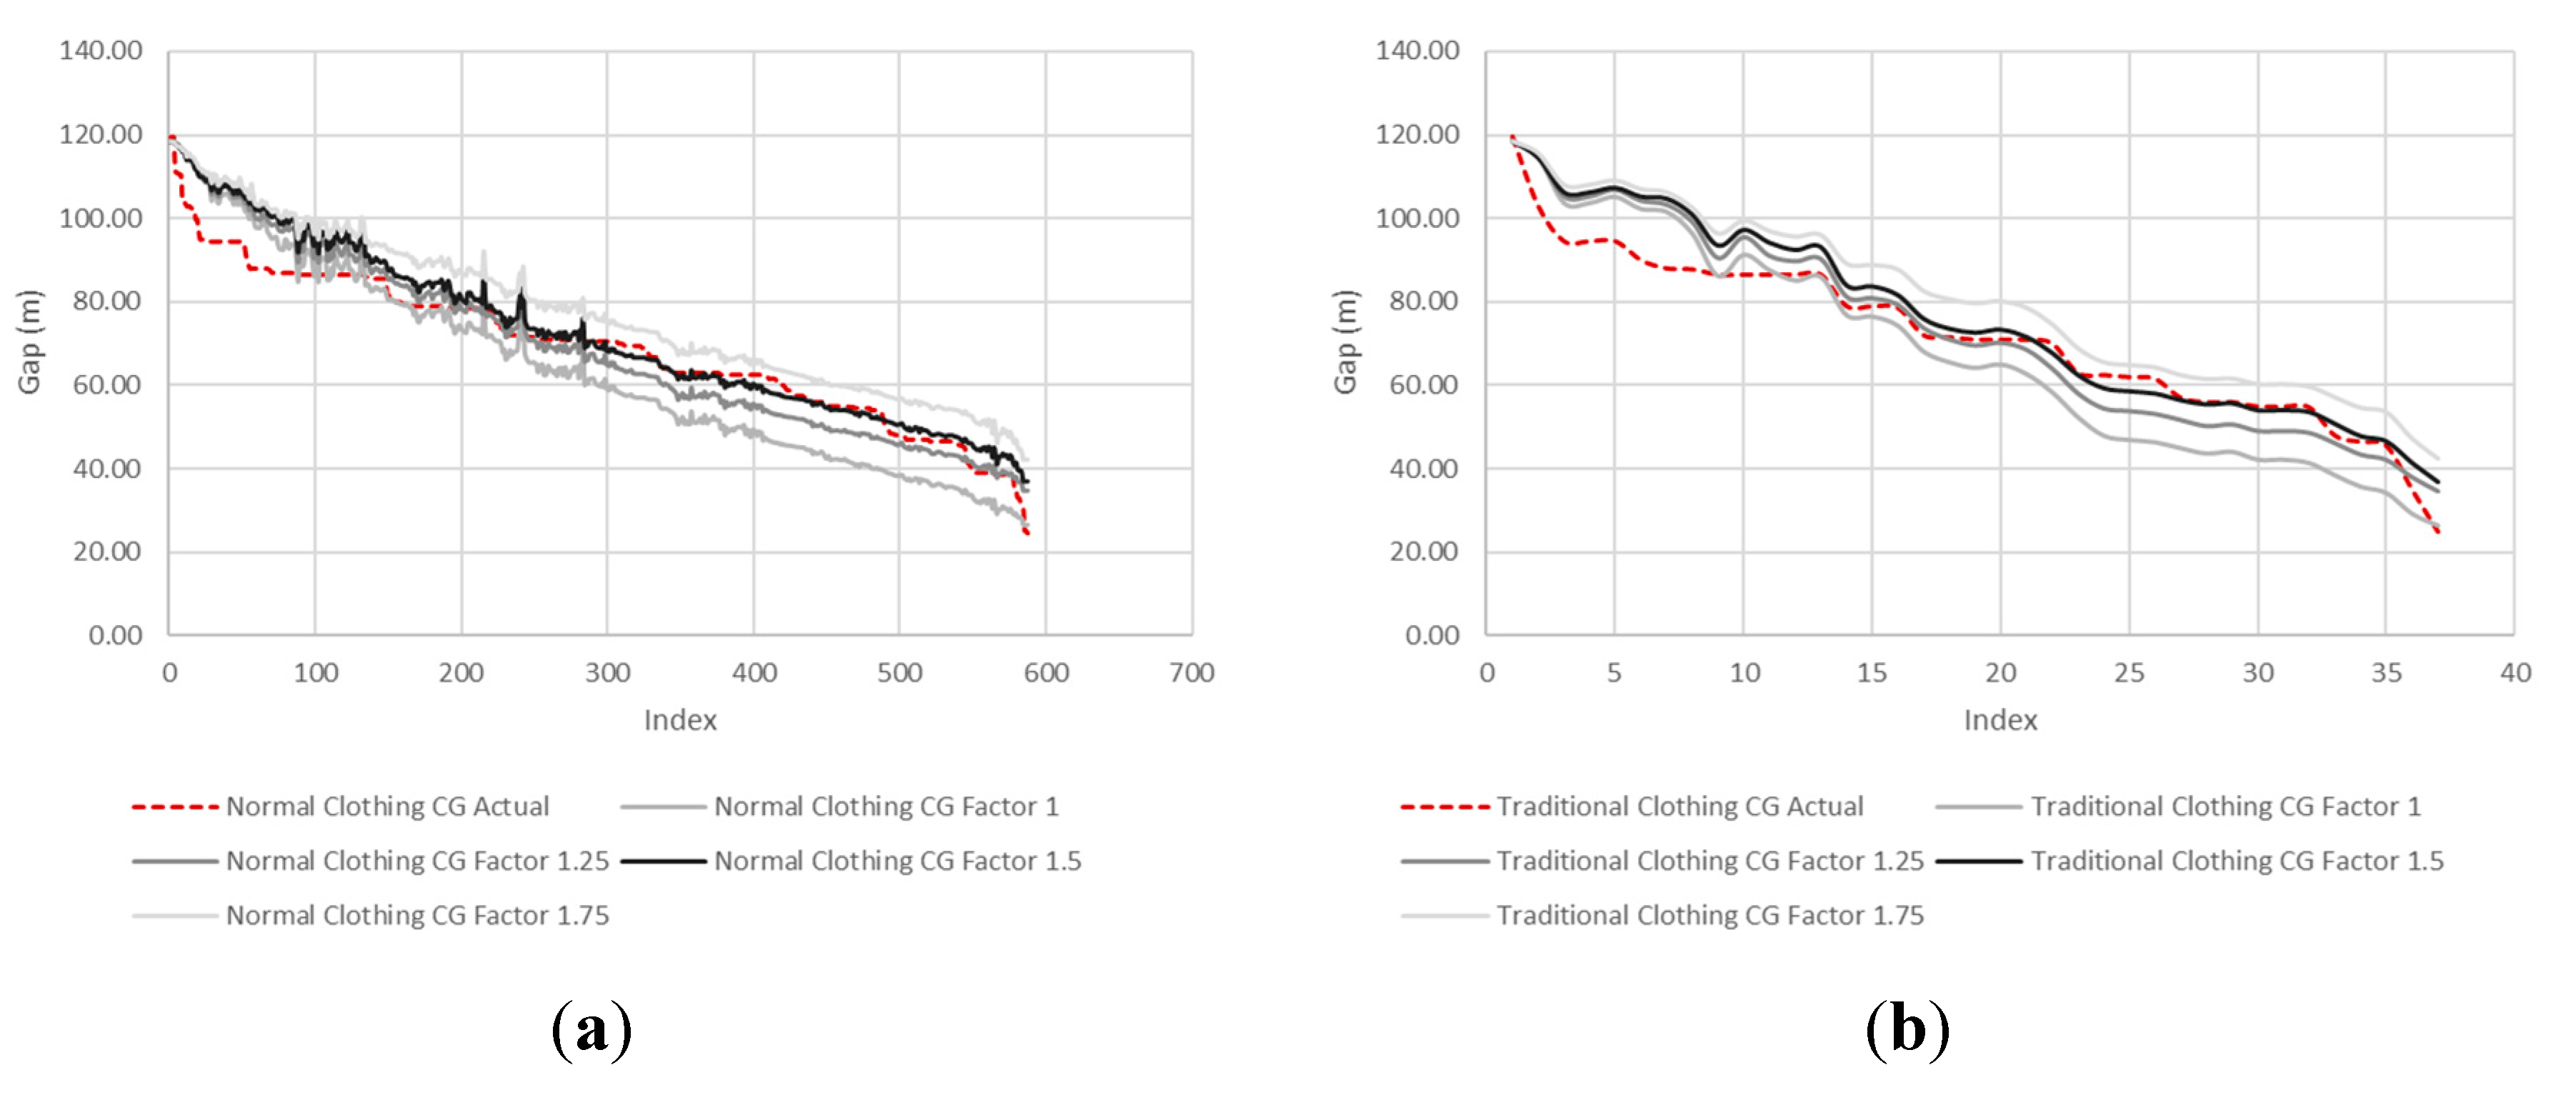
3.4. Type of Clothing
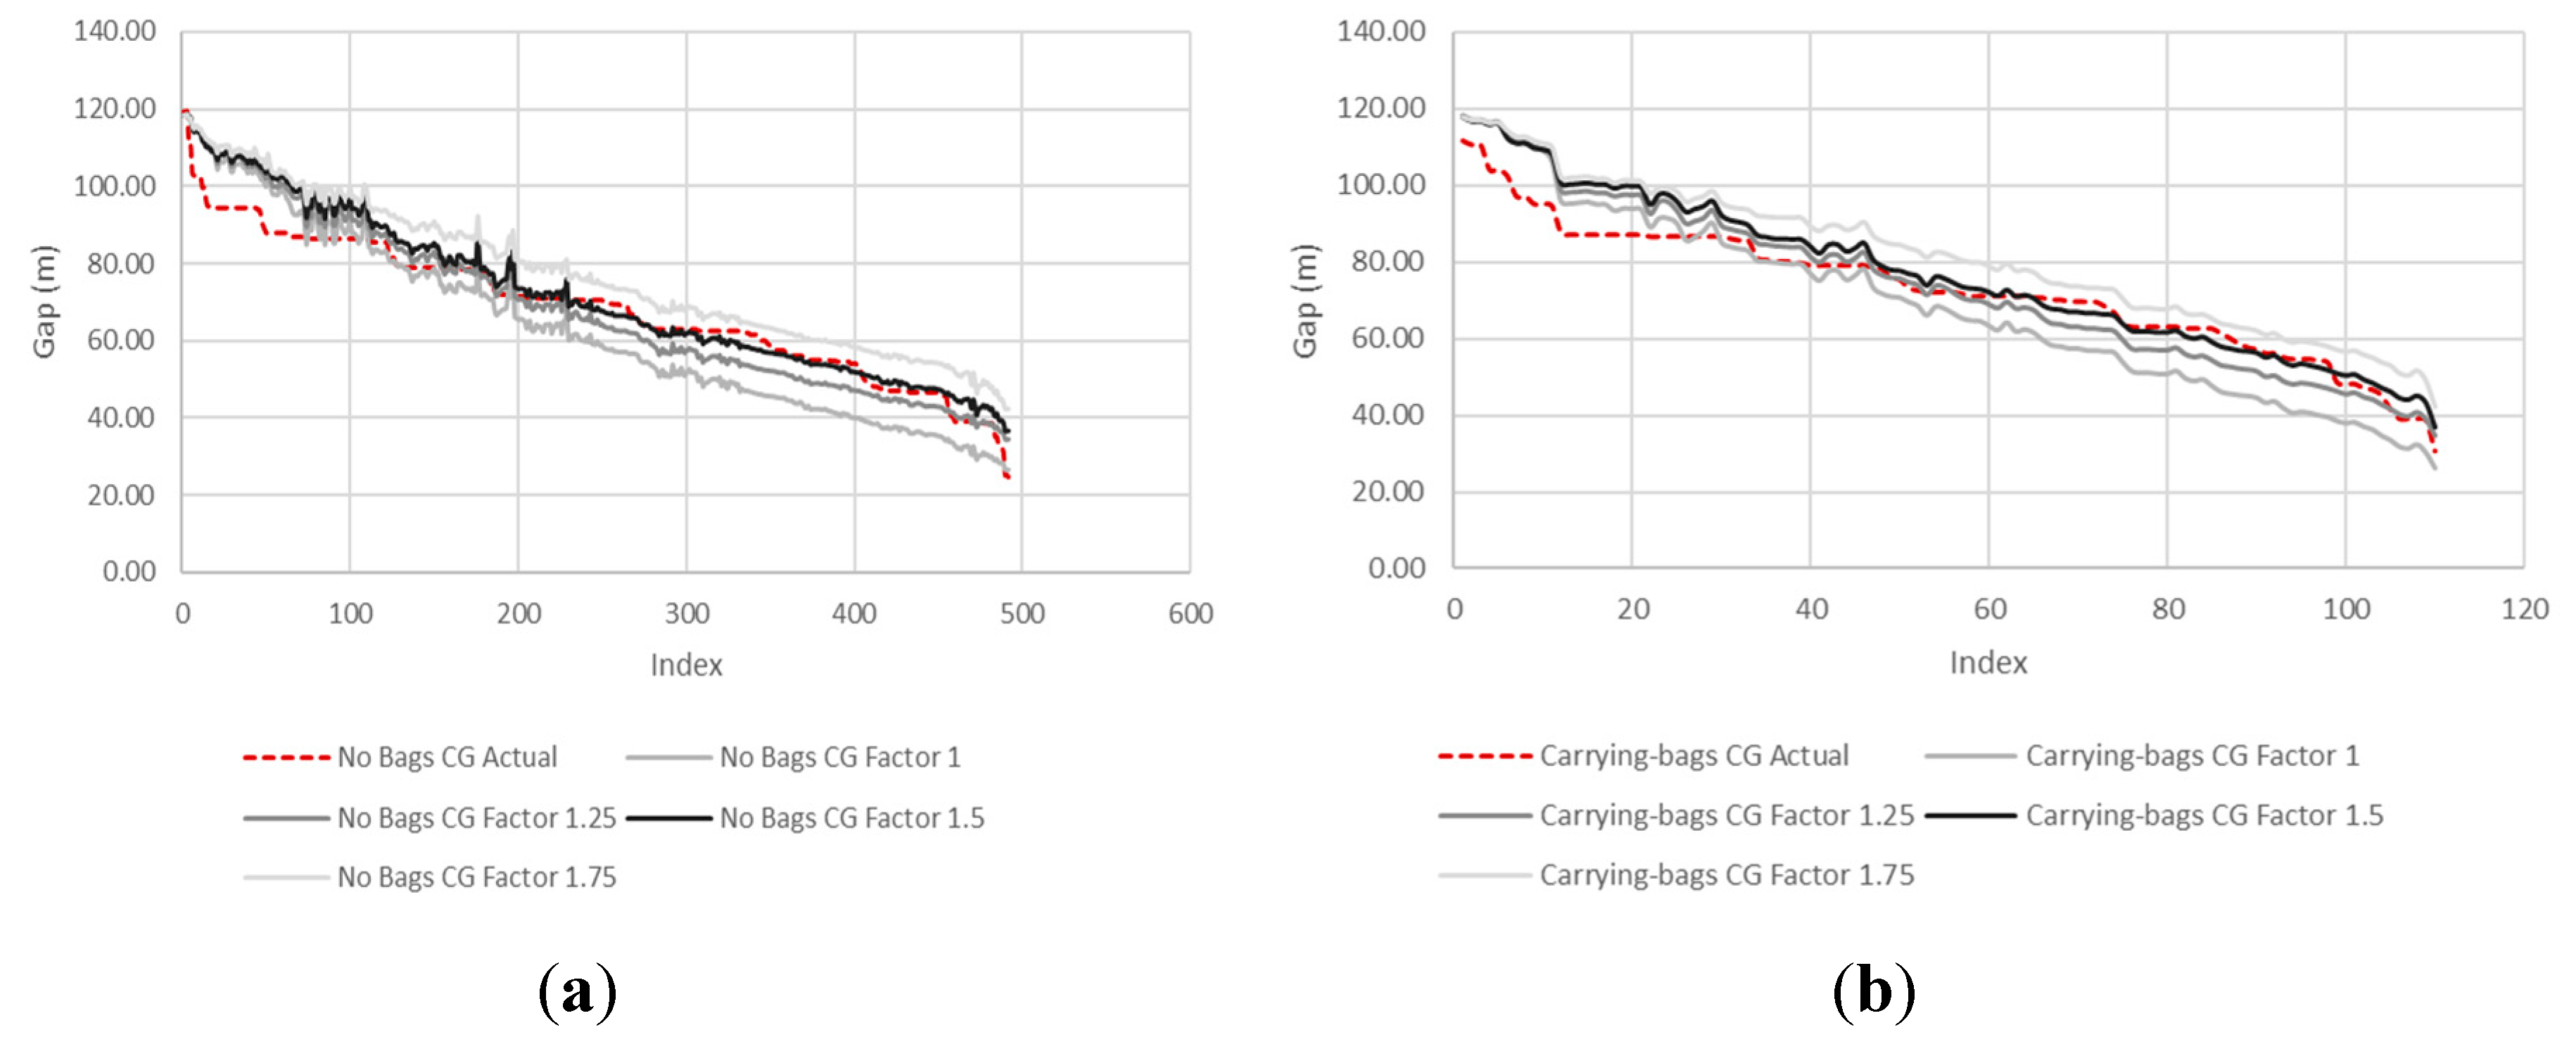
3.5. Carrying Bags
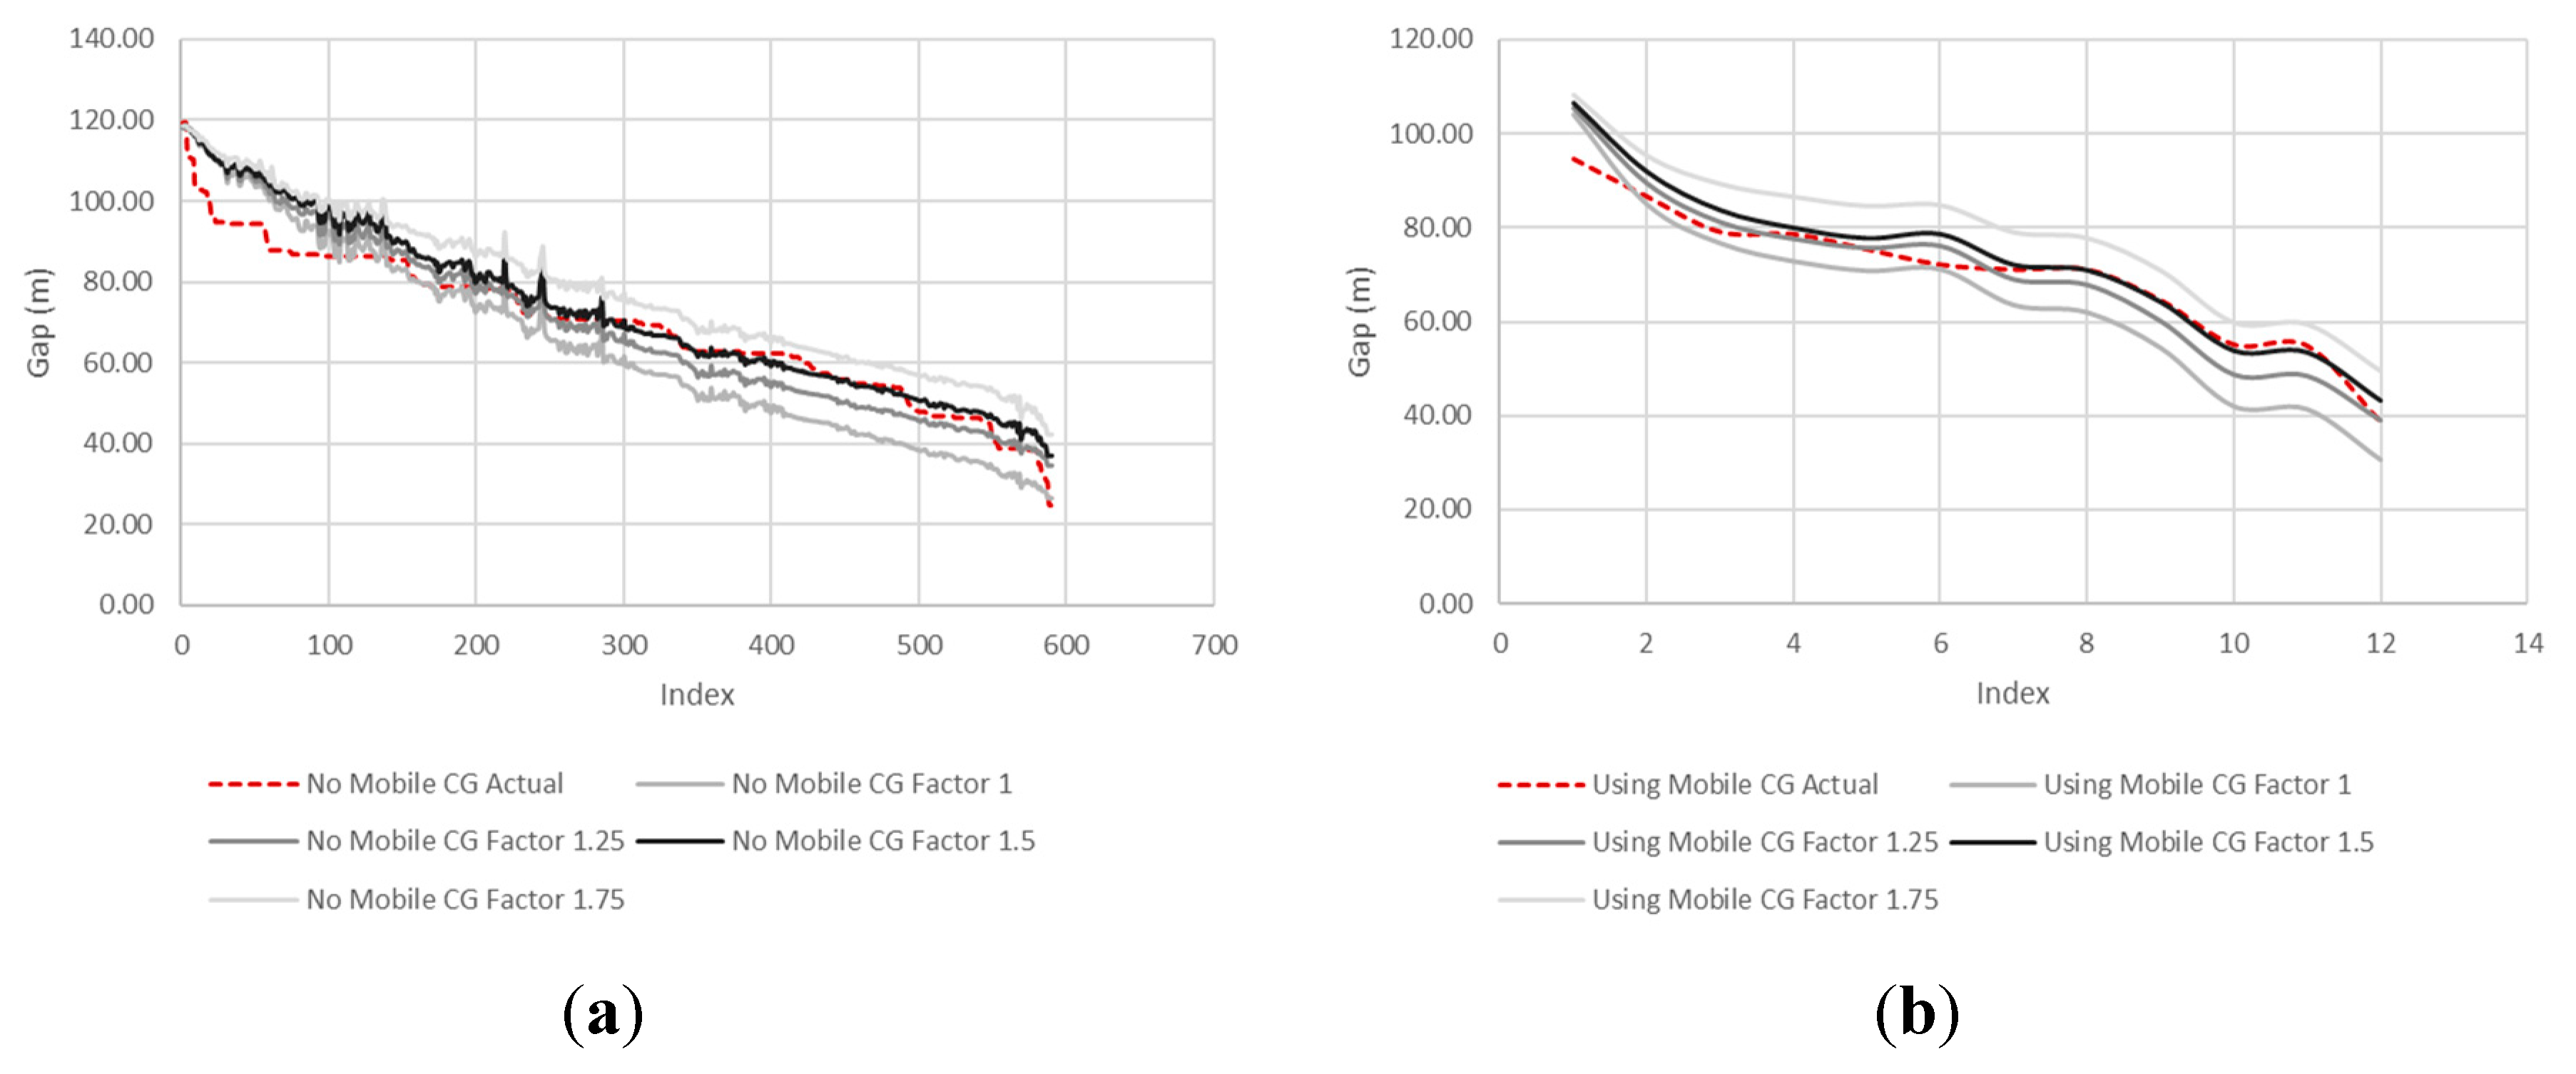
3.6. Using Mobile Phones
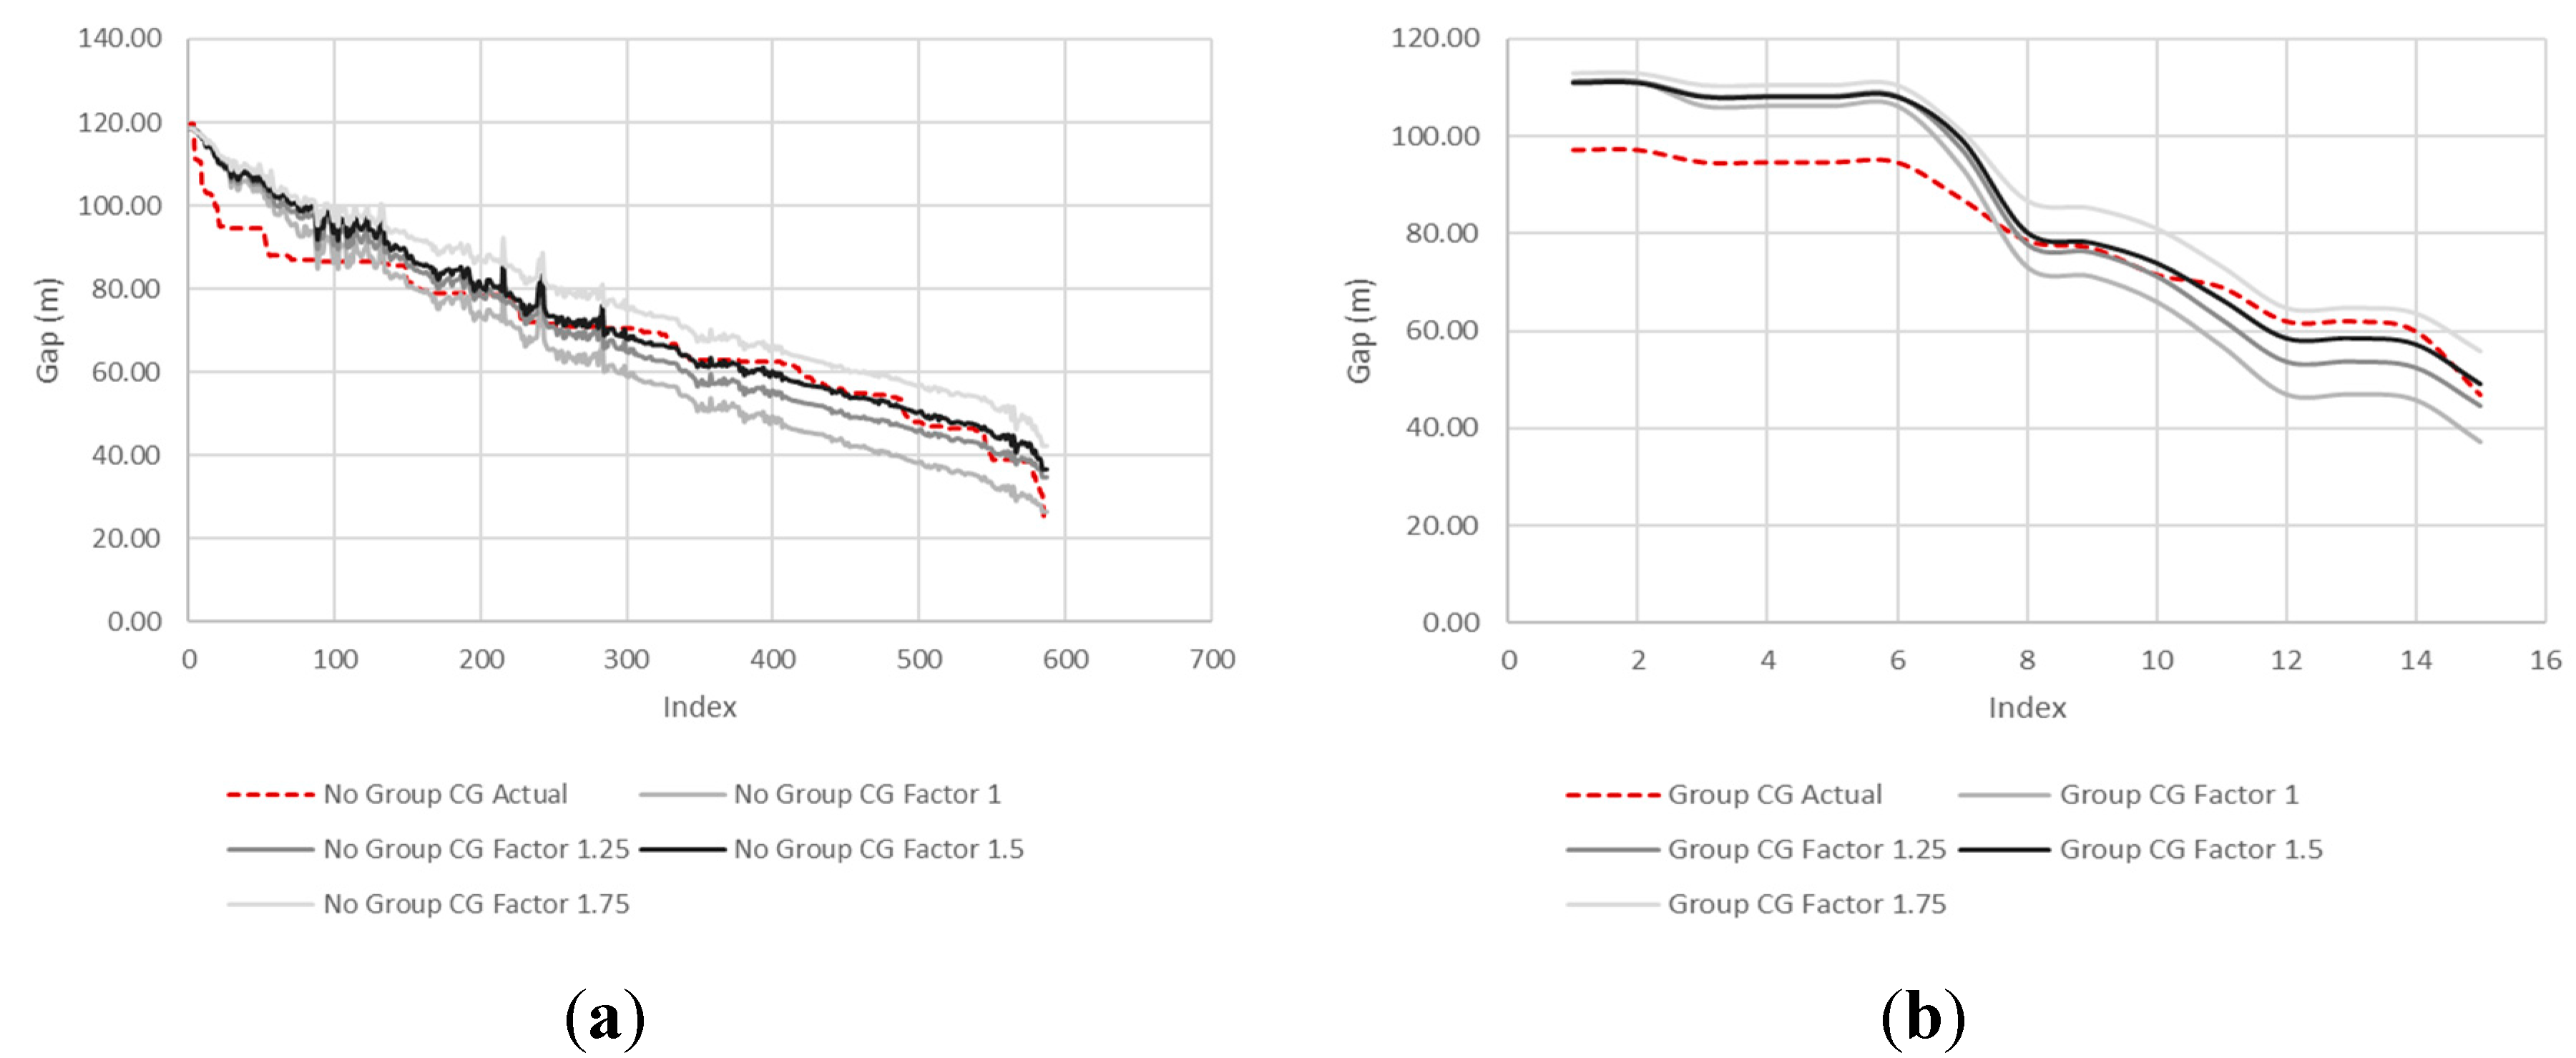
3.7. Crossing in a Group
3.8. Kolmogorov–Smirnov Test
- S(D) = level of significance,
- Ne = effective number of data points,
- N1, N2 = number of data points in the two distributions, and
- QKS = monotonic function for computing significance level.
4. Conclusions
Author Contributions
Funding
Acknowledgments
Conflicts of Interest
References
- Piccoli, B.; Tosin, A. Time-evolving measures and macroscopic modeling of pedestrian flow. Arch. Ration. Mech. Anal. 2011, 199, 707–738. [Google Scholar] [CrossRef]
- Amoh-Gyimah, R.; Saberi, M.; Sarvi, M. Macroscopic modeling of pedestrian and bicycle crashes: A cross-comparison of estimation methods. Accid. Anal. Prev. 2016, 93, 147–159. [Google Scholar] [CrossRef] [PubMed]
- Desyllas, J.; Duxbury, E.; Ward, J.; Smith, A. Pedestrian Demand Modelling of Large Cities: An Applied Example from London; Centre for Advanced Spatial Analysis (UCL): London, UK, 2003. [Google Scholar]
- Penn, A.; Hillier, B.; Banister, D.; Xu, J. Configurational modelling of urban movement networks. Environ. Plan. B Plan. Des. 1998, 25, 59–84. [Google Scholar] [CrossRef]
- Henderson, L.F. On the fluid mechanics of human crowd motion. Transp. Res. 1974, 8, 509–515. [Google Scholar] [CrossRef]
- Teknomo, K. Application of microscopic pedestrian simulation model. Transp. Res. Part F Traffic Psychol. Behav. 2006, 9, 15–27. [Google Scholar] [CrossRef]
- Antoniou, C.; Barcelò, J.; Brackstone, M.; Celikoglu, H.; Ciuffo, B.; Punzo, V.; Sykes, P.; Toledo, T.; Vortisch, P.; Wagner, P. Traffic simulation: Case for guidelines. In Scientific and Technical Research Series; Joint Reserch Centre: Luxembourg, 2014. [Google Scholar]
- Spitz, G.M.; Niles, F.L.; Adler, T.J. TCRP Synthesis 69: Web-Based Survey Techniques. A Synthesis of Transit Practice. Transportation Research Board, National Research Council: Washington, DC, USA, 2006. [Google Scholar]
- Flötteröd, G.; Lämmel, G. Bidirectional pedestrian fundamental diagram. Transp. Res. Part B Methodol. 2015, 71, 194–212. [Google Scholar] [CrossRef]
- Chraibi, M.; Seyfried, A.; Schadschneider, A. Generalized centrifugal-force model for pedestrian dynamics. Phys. Rev. E 2010, 82, 046111. [Google Scholar] [CrossRef] [PubMed]
- Moussaïd, M.; Perozo, N.; Garnier, S.; Helbing, D.; Theraulaz, G. The walking behaviour of pedestrian social groups and its impact on crowd dynamics. PLoS ONE 2010, 5, e10047. [Google Scholar] [CrossRef]
- Turner, A.; Penn, A. Encoding natural movement as an agent-based system: An investigation into human pedestrian behaviour in the built environment. Environ. Plan. B Plan. Des. 2002, 29, 473–490. [Google Scholar] [CrossRef]
- Kerridge, J.; Hine, J.; Wigan, M. Agent-based modelling of pedestrian movements: The questions that need to be asked and answered. Environ. Plan. B Plan. Des. 2001, 28, 327–341. [Google Scholar] [CrossRef]
- Zhang, S.; Luo, Y.; Chen, B.; Bao, X. Progress of Simulation Studies of Pedestrian Traffic. In Proceedings of the International Conference on Transportation Engineering 2009, Chengdu, China, 25–27 July 2009. [Google Scholar]
- Wan, H.; Xiao, Z.-N. Simulation and analysis of self-organized pedestrian phenomena based on social force model. Fire Sci. Technol. 2010, 9, 745–748. [Google Scholar]
- Jin, Z.; Chen, L. The Study for the Emergency Management of Evacuation Imitation along the Commercial Pedestrian Street. J. Appl. Sci. 2013, 13, 3104–3109. [Google Scholar] [CrossRef]
- Hong-xu, L.; Hai-ying, L.; Xiao, F.; Xin-yue1, X. Anylogic-based simulation analysis and evaluation of subway stations assemble capacity. Railw. Comput. Appl. 2012, 21, 48–50. [Google Scholar]
- Merkuryeva, G.; Bolshakovs, V. Vehicle Schedule Simulation with AnyLogic. In Proceedings of the 2010 IEEE 12th International Conference on Computer Modelling and Simulation (UKSim), Cambridge, UK, 24–26 March 2010; pp. 169–174. [Google Scholar]
- Shaaban, K.; Muley, D.; Mohammed, A. Analysis of illegal pedestrian crossing behavior on a major divided arterial road. Transp. Res. Part. F 2018, 54, 124–137. [Google Scholar] [CrossRef]
- Yannis, G.; Papadimitriou, E.; Theofilatos, A. Pedestrian gap acceptance for mid-block street crossing. Transp. Plan. Technol. 2013, 36, 450–462. [Google Scholar] [CrossRef]
- Serag, M. Modelling pedestrian road crossing at uncontrolled mid-block locations in developing countries. Int. J. Civ. Struct. Eng. 2014, 4, 274–285. [Google Scholar]
- Kadali, B.R.; Perumal, V. Pedestrians’ Gap Acceptance Behavior at Mid Block Location. Int. J. Eng. Technol. 2012, 4, 158. [Google Scholar] [CrossRef]
- Kadali, B.R.; Vedagiri, P. Modelling pedestrian road crossing behaviour under mixed traffic condition. Eur. Transp. 2013, 55, 1–17. [Google Scholar]
- Saleh, W.S.; Lashin, M. Investigation of Critical Gap for Pedestrian Crossing Using Fuzzy Logic System. Appl. Sci. 2020, 10, 3653. [Google Scholar] [CrossRef]
- Cherry, C.; Donlon, B.; Yan, X.; Moore, S.E.; Xiong, J. Illegal mid-block pedestrian crossings in China: Gap acceptance, conflict and crossing path analysis. Int. J. Inj. Control. Saf. Promot. 2012, 19, 320–330. [Google Scholar] [CrossRef]
- Mamidipalli, S.V.; Sisiopiku, V.P.; Schroeder, B.J.; Elefteriadou, L.; Salamati, K.; Rouphail, N.M. Probit-Based Pedestrian Gap Acceptance Model for Midblock Crossing Locations. Transp. Res. Rec. 2015, 2519, 128–136. [Google Scholar] [CrossRef]
- Macal, C.M.; North, M.J. Agent-Based Modeling and Simulation. In Proceedings of the 2009 IEEE Winter Simulation Conference (WSC), Austin, TX, USA, 13–16 December 2009. [Google Scholar]
- Shaaban, K.; Abdel-Warith, K. Agent-based Modeling of Pedestrian Behavior at an Unmarked Midblock Crossing. Proc. Comput. Sci. 2017, 109, 26–33. [Google Scholar] [CrossRef]
- Shaaban, K.; Muley, D.; Elnashar, D. Temporal variation in walking behavior: An empirical study. Case Stud. Transp. Policy 2017, 5, 671–680. [Google Scholar] [CrossRef]
- Shaaban, K.; Wood, J.S.; Gayah, V.V. Investigating driver behavior at minor-street stop-controlled intersections in Qatar. Transp. Res. Rec. 2017, 2663, 109–116. [Google Scholar] [CrossRef]
- Shaaban, K. Analysis of Pedestrian Crossing Speeds at Signalized Intersections in Qatar. Arab. J. Sci. Eng. 2019, 44, 4467–4476. [Google Scholar] [CrossRef]
- Sobh, R.; Belk, R.; Gressell, J. The scented winds of change: Conflicting notions of modesty and vanity among young Qatari and Emirati women. ACR North. Am. Adv. 2010, 37. [Google Scholar]
- O’Connor, P.; Kleyner, A. Practical Reliability Engineering; John Wiley & Sons: New York, NY, USA, 2012. [Google Scholar]
- Press, W.; Flannery, B.; Teukolsky, S. TVW: Numerical Recipes in C: The Art of Scientific Computing; Cambridge University Press: New York, NY, USA, 2002. [Google Scholar]
- Shaaban, K. Assessing Sidewalk and Corridor Walkability in Developing Countries. Sustainability 2019, 11, 3865. [Google Scholar] [CrossRef]
- Shaaban, K. Why Don’t People Ride Bicycles in High-Income Developing Countries, and Can Bike-Sharing Be the Solution? The Case of Qatar. Sustainability 2020, 12, 1693. [Google Scholar] [CrossRef]
- Hong, J.; Shankar, V.N.; Venkataraman, N. A spatially autoregressive and heteroskedastic space-time pedestrian exposure modeling framework with spatial lags and endogenous network topologies. Anal. Methods Accid. Res. 2016, 10, 26–46. [Google Scholar] [CrossRef]
- Iryo-Asano, M.; Alhajyaseen, W.K. Modeling pedestrian crossing speed profiles considering speed change behavior for the safety assessment of signalized intersections. Accid. Anal. Prev. 2017, 108, 332–342. [Google Scholar] [CrossRef]


| Characteristic | Frequency | Percent |
|---|---|---|
| Gender | ||
| Male | 591 | 98.2 |
| Female | 11 | 1.8 |
| Age | ||
| Children | 1 | 0.2 |
| Middle-age | 589 | 97.8 |
| Old-age | 12 | 2.0 |
| Type of clothing | ||
| Normal | 565 | 93.9 |
| Traditional | 37 | 6.1 |
| Carrying bags | ||
| No | 492 | 81.7 |
| Yes | 110 | 18.3 |
| Using mobile phones | ||
| No | 590 | 98.0 |
| Yes | 12 | 2.0 |
| Crossing in a group | ||
| No | 484 | 80.4 |
| Yes | 118 | 19.6 |
| Total | 602 | 100.0 |
| Actual Speed (kph) | Simulation | |||||
|---|---|---|---|---|---|---|
| Average Speed (kph) | Incremental Speed (kph) | Uniform Speed Distribution (kph) | Normal Speed Distribution (kph) | |||
| Gap Distance (m) | Mean | 70.9 | 60.0 | 63.4 | 66.0 | 66.4 |
| Std. Deviation | 17.2 | 23.5 | 23.5 | 24.4 | 24.2 | |
| Minimum | 30.5 | 30.1 | 28.4 | 23.4 | 26.5 | |
| Maximum | 119.6 | 118.7 | 118.6 | 118.5 | 118.6 | |
| Observations | D | p-Value | ||
|---|---|---|---|---|
| Gender | Male | 591 | 0.477 | 0.015 |
| Female | 11 | |||
| Age | Middle-age | 589 | 0.325 | 0.166 |
| Old-age | 12 | |||
| Type of clothing | Normal | 565 | 0.147 | 0.442 |
| Traditional | 37 | |||
| Carrying bags | No | 492 | 0.128 | 0.105 |
| Yes | 110 | |||
| Using mobile phones | No | 590 | 0.187 | 0.805 |
| Yes | 12 | |||
| Crossing in a group | No | 484 | 0.273 | <0.001 |
| Yes | 118 |
© 2020 by the authors. Licensee MDPI, Basel, Switzerland. This article is an open access article distributed under the terms and conditions of the Creative Commons Attribution (CC BY) license (http://creativecommons.org/licenses/by/4.0/).
Share and Cite
Shaaban, K.; Abdelwarith, K. Pedestrian Attribute Analysis Using Agent-Based Modeling. Appl. Sci. 2020, 10, 4882. https://doi.org/10.3390/app10144882
Shaaban K, Abdelwarith K. Pedestrian Attribute Analysis Using Agent-Based Modeling. Applied Sciences. 2020; 10(14):4882. https://doi.org/10.3390/app10144882
Chicago/Turabian StyleShaaban, Khaled, and Karim Abdelwarith. 2020. "Pedestrian Attribute Analysis Using Agent-Based Modeling" Applied Sciences 10, no. 14: 4882. https://doi.org/10.3390/app10144882
APA StyleShaaban, K., & Abdelwarith, K. (2020). Pedestrian Attribute Analysis Using Agent-Based Modeling. Applied Sciences, 10(14), 4882. https://doi.org/10.3390/app10144882