Article

The Impact of Surface Scattering on Reverberation Time in Differently Shaped Spaces

1
School of Architecture, Tianjin University, Weijin road 92, Tianjin 300072, China
2
UCL Institute for Environmental Design and Engineering, The Bartlett, University College London (UCL), London WC1H 0NN, UK
*
Author to whom correspondence should be addressed.
Appl. Sci. 2020, 10(14), 4880; https://doi.org/10.3390/app10144880
Submission received: 29 May 2020 / Revised: 27 June 2020 / Accepted: 2 July 2020 / Published: 16 July 2020
(This article belongs to the Section Acoustics and Vibrations)

Abstract

:
In terms of the overall diffusion sound field, the inherent diffusion state of the space and the scattering coefficient of indoor surfaces work jointly to diffuse sound energy. This study has investigated the impact of surface scattering on reverberation time in differently shaped spaces. First, 10 spaces with the same volume but different shapes were calculated using a computer simulation; Next, two typical spaces were selected to calculate 10 states, in which the volume was multiplied. The calculations results show that the impact of surface scattering on reverberation time in differently shaped spaces follows three laws: in a group of spaces with the same variation pattern, T20 varies with scattering coefficients at a similar rate. In a group of spaces with different variation patterns, there is a difference of more than 5% in the change rate of T20 with scattering coefficients; in imperfect diffusion spaces, decay curves vary in accordance with scattering coefficients. If the scattering coefficients are the same, T20 varies with spatial shapes; when the volume of rectangular spaces and trapezoidal space ranges from 3000 to 30,000 m3, the change rate of T20 is less than 5%. In the present study, spaces were classified by the position combination of shape surfaces. On this basis, we proposed and then graded the concept of “morphology diffusivity”.

1. Introduction

In the acoustic design of performance buildings, walls and ceilings are usually fitted with diffusion devices to diffuse indoor sound fields. The acoustic reflection, which results from the tilt or concave/convex shape of surfaces, changes the transmission direction of sound energy and the distribution of resonance frequency in indoor spaces. The diffusion of indoor sound fields is considered a very important method of improving acoustic quality [1].
Two parameters describe the reflection state of sound on surfaces, the diffusion coefficients and scattering coefficients. The scattering coefficient refers to the ratio of the non-specular reflection energy to the total reflection energy, while the diffusion coefficient is used to describe the spatial polar distribution of non-specular reflection sound energy [2,3]. The difference between diffusion coefficient and scattering coefficient is that diffusion coefficient describes the spatial distribution of non-specular sound energy, while scattering coefficient describes the energy proportion of non-specular sound energy. Cox et al. [4] found that using the diffusion coefficients in geometric room acoustic models is likely to produce incorrect results. In this paper, the scattering coefficient was used. To evaluate the effect of diffusion and scattering, a key room acoustics parameter is reverberation time (RT), determined by 20 dB decay or 30 dB decay, specifically referred to as T20 and T30, respectively in this paper, whereas RT refers to general concept of reverberation time.
Previous studies have investigated the impact of surface scattering on the acoustic quality of performance buildings using three methods: subjective surveys, computer simulations, and scale-model tests. By assigning values to the concavity or convexity of the walls and ceilings of concert halls, Haan [5] conducted a subjective survey, concluding that the scattering state of walls and ceilings was highly correlated (or to be more specific, positively correlated) with concert-hall evaluation scores. However, high acoustic quality was not analyzed in detail in these evaluations. In terms of the overall diffusion sound field of each space, the inherent diffusivity of the space and the scattering coefficient of the indoor surface work jointly to diffuse sound energy. In the acoustic design of concert halls, numerous decorative “shoeboxes” and irregularly shaped “vineyards” in the walls and ceilings are thought to play an important role in diffusing sound fields [6]. The recognition of sound scattering by human ears is a very important index for acoustic design; during the process of constructing performance buildings, the design pattern of surface scattering affects the architectural design, decoration design, and construction cost. Vitale [7] and Seo et al. [8] studied surface diffusion through computer simulations and scale-model tests. Using a computer simulation of Dortmund Concert Hall, Vitale [7] found that the average scattering coefficient variation perceived by listeners was 0.6. However, Vitale did not further investigate the relationship between scattering and acoustic parameters.
In terms of the study of objective parameters, Seo et al. [8] found that RT decreased by 0.1 s when diffusers were added to the side walls of Miral Concert Hall. Using the scale-model method, Jeon and Sakurai studied the impact of side wall scattering. Based on a 1/10 scale model and also a real performance hall, Jeon et al. [9] compared two states (diffusion and reflection) of wall surfaces; they found that adding diffusers reduced the standard error of early decay time, and increased the quantity of high-frequency reflected sound peaks. Using a 1/10 scale model, Sakurai [10] compared acoustic parameters before and after adding cylindrical diffusers in a leaf-shaped concert hall, finding that the difference in sound pressure level of the 1/3 octave (1000 Hz) between seats increased from 5 to 7 dB after diffusers were added to the walls. For seats close to the walls, the initial delay increased from 9 to 37 ms. Using the scale-model method, Ryu and Jeon [11] carried out a comparative study before and after adding diffusers to nearby side walls of the Gold Sea Art Gallery multifunctional hall; the diffusers reduced the initial delay, the energy intensity of first-order reflected sound, the sound pressure level, RT, and early decay time (EDT). Based on a scale model, Jeon [12] used reflecting materials to block the diffusers on nearby side walls, finding that the diffusers served to reduce the standard errors of interaural cross-correlation coefficient (IACC) and early decay time (EDT). All of the aforementioned studies examined a single space and made no comparisons between multiple spaces.
In an article on scattering, Hodgson [13] argued that, in a room with specular reflection, sound decay would not be linear and the slope of time-decaying sound energy would be lower than predicted by Eyring. In a room with high diffusivity, however, the slope of time-decaying sound energy would present more linear characteristics. In a space with uniform acoustic absorption, the proportion of three dimensions would affect the decay of sound energy; specifically, the effect of surface scattering on the decay of sound energy would vary in accordance with the relative proportions of three dimensions. The diffusion effect of the sound field would be affected by spatial shape, as well as the shape of the diffuser. Yokota et al. [14] added diffusers to same-area surfaces in three spaces (the first rectangular, the second sectorial, and the third elliptical); the calculation results confirmed the above arguments. Kuttruff [15] investigated the relationship between diffused reflection and T30 in a sound ray tracing model; they found that when wall surfaces were tilted, linear decay was caused by a low scattering coefficient. However, tilted wall surfaces alone do not diffuse indoor sound fields. Sakurai’s [10] findings show that the impact on sound fields varies in accordance with the position and quantity of diffusers. Wang [16] conducted a comparative study before and after increasing the diffusion of the concert hall’s side wall using the scale model test method and found that when the side wall increases sound diffusion, the room’s T30 decreases. Using a 1/50 scale model, Kim et al. [17] found that, in both shoebox-shaped and sectorial performance spaces, the RT decreased as the diffusivity increased. These studies show that spatial shape and surface scattering coefficients work together to affect acoustic parameters. However, none of these studies investigated the relationship between spatial shape and surface scattering, or between spatial volume and surface scattering.
It can be seen from the above research that the influence of surface scattering change on the RT is different in different shapes of space. It can be concluded that different spatial forms can “diffuse” the energy of sound field to a certain extent, and the diffusion of sound field is affected by both spatial forms and surface scattering.
Both the scale model test and computer simulation can be used to study scattering. Using the scale model method, although the results can be close to real situations, the number of cases that can be studied is limited due to the modelling complexity. All of the studies mentioned above pertained to a single space, in which there were scattering sources or not; none compared multiple spaces of different shapes. Currently, no existing study on surface scattering has investigated the sensitivity of RT to surface scattering in differently shaped spaces and the extent to which RT varies in accordance with spatial volume.
The present study thus aims to investigate the impact of scattering on RT in differently shaped spaces. Under the conditions of a constant absorption coefficient, RT is also affected by spatial volume.
This study has mainly conducted analyses relating to the following topics:
(1) In spaces of different shapes, the way in which RT varies with an increase in the surface scattering coefficient;
(2) Under the same surface scattering coefficient, different spatial shape will have different RT;
(3) In spaces with different volumes, the way in which RT varies with an increase in the surface scattering coefficient.

2. Study Methodology

2.1. General Settings

Kuttruff’s [18] study found that in the frequency bands higher than the Schroeder frequency, geometric acoustics can be used to calculate the indoor sound field. In geometric acoustics, the reflection and scattering of sound rays are used to simulate the sound propagation process. This method has a high accuracy at high frequencies where the surface size is much larger than the wavelength.
Billon et al. [19] reported the calculation results of the Eyring formula after adding scattering in different space shapes. The CATT calculation results when the scattering coefficient was set to 0.4 were compared with the measured results. The RT results using the three methods were in good agreement. Both the RT and Sound Pressure Level (SPL) were investigated in cubic rooms by Jing and Xiang [20]. For uniformly distributed absorption coefficients, both the Eyring diffusion and modified diffusion models demonstrated good agreement with the CATT model.
These research results indicated that the computer simulation can to a certain extent reflect the influence of surface scattering on the RT in real space. It has a good reliability to explore the influence of surface scattering on the RT in ordinary spaces using the sound ray method.
Using Odeon, CATT, and Raven software, Shtrepi and Astolfi [21] performed computer simulations of 480 rectangular concert halls and analyzed the relationship between T30 and scattering. They found that T30 tended to decrease after diffusers were added to the walls and ceilings. Shtrepi et al. [22] indicated that the input modes of scattering parameters are different in CATT and Odeon. If the same frequency dependent scattering value assumed automatically in Odeon is applied to CATT for simulation with the same surface absorption coefficients, the T30 value obtained is consistent with Odeon’s calculation result. In this study, we used this method to compare the CATT and Odeon in a rectangular space and a specially shaped space (through the inclined surface to eliminate the parallel planes). It is found that with the same absorption coefficient and scattering coefficient, the difference in T30 calculated by the two software packages is less than 5%. Referring to the international itinerant comparison of computer simulations, Vorländer [23] and Bork [24,25] used 5% as the subjective threshold of relative difference in T30. Therefore, the calculation results of the two software packages are consistent.
CATT Acoustic v9 is a room acoustic simulation software package that offers three different cone-tracing algorithms for source-receiver echograms and impulse responses and one audience area mapping algorithm. When the order ≤ n, diffuse and specular reflections are deterministic (n = max split order) and the diffuse reflections are created by actual diffuse ray separation. The n + 1 order reflections are randomly determined by the scattering coefficient. Diffuse reflection is frequency dependent, individually tracing for each 1/1-octave 125–16 kHz [26,27].
In CATT, the sound absorption and scattering coefficients are set for the six octave bands from 125 Hz to 4 kHz. For example, “ABS ceiling = < α125 α250 α500 α1k α2k α4k > L < s125 s250 s500 s1k s2k s4k >”. The sound absorption and scattering coefficients are expressed by 1%–99%. The scattering coefficients of different surfaces can be set directly according to the test data or as suggested by the CATT user manual [26,27]. Since the scattering coefficient in the CATT can be set separately for each frequency band, the CATT was used as the calculation tool in this study.
In the simulated calculation, a shoebox-shaped small theater was used as the basic model for calculation and analysis. Its three-dimensional size was 25 × 16 × 7.5 m (L × W × H), and its indoor volume was 3000 m3. CATT was used to carry out simulated calculations and to analyze the results. Based on this model, the spatial shape was changed, while the variation in indoor volume was controlled to the extent of ±1%. In this study, the interfacial acoustic absorption coefficient was uniformly distributed. Considering the impact of acoustic absorption on RT, medium acoustic absorption settings were adopted; specifically, the interfacial acoustic absorption coefficient was set to 0.5.
For each space, all of the surfaces’ scattering coefficients were simultaneously changed from 1% and 10% to 30%, 50%, 70%, 90%, and 99% at intervals of 20%. However, since the scattering coefficient cannot be 0 and 100% in CATT, the scattering coefficient’s minimum value was set to 1% and its maximum value was set to 99%. The purpose of continuous coefficient variation is to cover the possibility of coefficient variations to the maximum extent. This method was used in prior scattering studies [7,28]. During each calculation, the seam scattering coefficients are provided for all of the octave bands. The CATT user manual states that a scattering coefficient of 20% is suitable for a smooth surface, and a scattering coefficient of 90% is suitable for a rough surface [26,27]. Percentages are replaced by decimals in the following text.

2.2. Spatial Shape

Based on previous research, spatial diffusion can be increased by tilted walls, but the diffusion field cannot be achieved only by tilted walls. Therefore, in this study, the spatial shape was adjusted by tilting different surfaces in a rectangular space. The decay curves in the different spaces varied according to the different tilting wall methods [15]. The RT transformed with the changes in the decay curve caused by the modification of the spatial shape.
A computer simulation was performed on nine spaces with the same volume but adjusted shapes. The adjusted shapes included the tilt of a single surface and a combination of the tilts of multiple surfaces (as listed in Table 1). Different adjustment methods could be combined to produce eight spatial shapes. In the simulated calculation, a reverberation chamber was added to stand in for a perfect-diffusion space [29].
As the human ear is most sensitive to sound at a frequency of 2000—4000 Hz, the average RT change rate of the octave (2000 Hz) was used as the evaluation standard in this study [30].
According to the Schroeder frequency formula, the frequency of the rectangular space in this study is 100 Hz; therefore, 2000 Hz was selected as 20 times this value, which was within the geometric acoustics application range [18].
One sound source point and six receiving points were set up in each space. Figure 1 shows the positions of the sound source point and receiving points in each space. The average calculated values of the six receiving points were compared [31,32].

2.3. Indoor Volume

Volume is a major factor affecting RT. The studies of Ryu [10], Shtrepi [21], Kuttruff [15], Wang [28], Schroeder [33], all pertain to a single space; no studies have been conducted to investigate spaces with the same shape but different volumes. When spatial volume increases and the acoustic absorption coefficient is constant, indoor RT also increases. In this case, the impact of spatial scattering on RT remains unclear. Here, the same space was scaled up to calculate the impact of the surface scattering coefficient on RT when the spatial volume ranged from 3000 to 30,000 m3. A spatial volume of 3000 m3 was used as the reference volume; this was then amplified by a factor of n (n = 1, 2, 3……10). The aim was to calculate the impact of the scattering coefficient on RT under different volume conditions.

2.4. Steps

In the present study, selected spaces were used in a comparative analysis of decay curve and RT. As no threshold standards have been established to judge whether there is any difference in decay curve and RT, it is impossible to assess the relationship between spatial shapes and surface scattering coefficients.
After a space of constant volume is changed, its total surface area and total indoor acoustic absorption also change. According to the Eyring equation, this directly changes RT. A comparison of calculated RT values between different spaces is therefore affected by the change in both spatial shapes and total acoustic absorption. This study used the RT change rate to conduct a comparative analysis of different spaces, eliminating the impact of acoustic absorption.
All of the samples used a scattering coefficient of 0.01 (equal to 1% above) as a reference stage to calculate the RT’s change rate when the scattering coefficient was 0.1, 0.3, 0.5, 0.7, 0.9, and 0.99. The influence of the scattering coefficient on the RT was analyzed using the RT’s rate. The RT’s change rate was calculated using Equation (1).
τ = 100 × ( R T s R T 0.01 ) R T 0.01
where,
  • τ denotes the change rate of RT (%);
  • RTs denotes the RT value when the scattering coefficient is s.
  • RT(0.01) denotes the RT value when the scattering coefficient is 0.01.
The threshold of relative difference in RT was used as a standard to evaluate whether there was any impact on RT. A survey of Western music and language, carried out with Western respondents, showed that the threshold of relative difference in RT was 5–10% [34,35,36]. A survey of Chinese folk music, conducted with Chinese respondents, showed that the threshold of relative difference in RT was 25–30% [37]. In an international itinerant comparison of computer simulations, Vorländer [23] and Bork [24,25] used 5% as the subjective threshold of relative difference in T30. The 5% threshold of relative difference in RT was used to judge whether the scattering coefficient affected RT significantly.

2.5. Calculation Parameters

In previous studies, T30 has been used as the subject of study [8,11,14,15,21], although T20 was used in the actual performance space test. Three typical spaces were selected to calculate T20 and T30 through CATT. A comparative analysis showed that, in relation to the same space, the trend and quantity of variation with the scattering coefficient were both less than 5% (as shown in Figure 2. Hence, their change rates could be considered the same. To compare the simulated values with measured values in the future, T20 was used as the subject of this study.

3. The Decay Curve of Sound Energy

The RT was calculated using the sound energy decay curves. In this section, two spatial shapes (a rectangular space and a reverberation chamber: six faces of the rectangular space were parallel to each other and there was no parallel plane in the reverberation chamber) were used to calculate the RT. Specifically, the RT was calculated when the surface scattering coefficient was 0.01, 0.3, and 0.7. Figure 3 shows the decay curve related to the rectangular space. The decay curve changed (specifically, the slope of the curve increased) as the surface scattering coefficient increased. This indicates that RT was shortened with the increase in the surface scattering coefficient. The decay curve related to the reverberation chamber shows that the slope of the curve remained unchanged under different values of the surface scattering coefficient (as shown in Figure 4). Evidently, variations in the surface scattering coefficient did not affect the RT variation trend in the reverberation chamber. The reverberation chamber’s surface was covered by arc diffusers that effectively diffused the reverberation chamber’s sound field. Therefore, the decay curve did not change when the surface scattering coefficient increased.

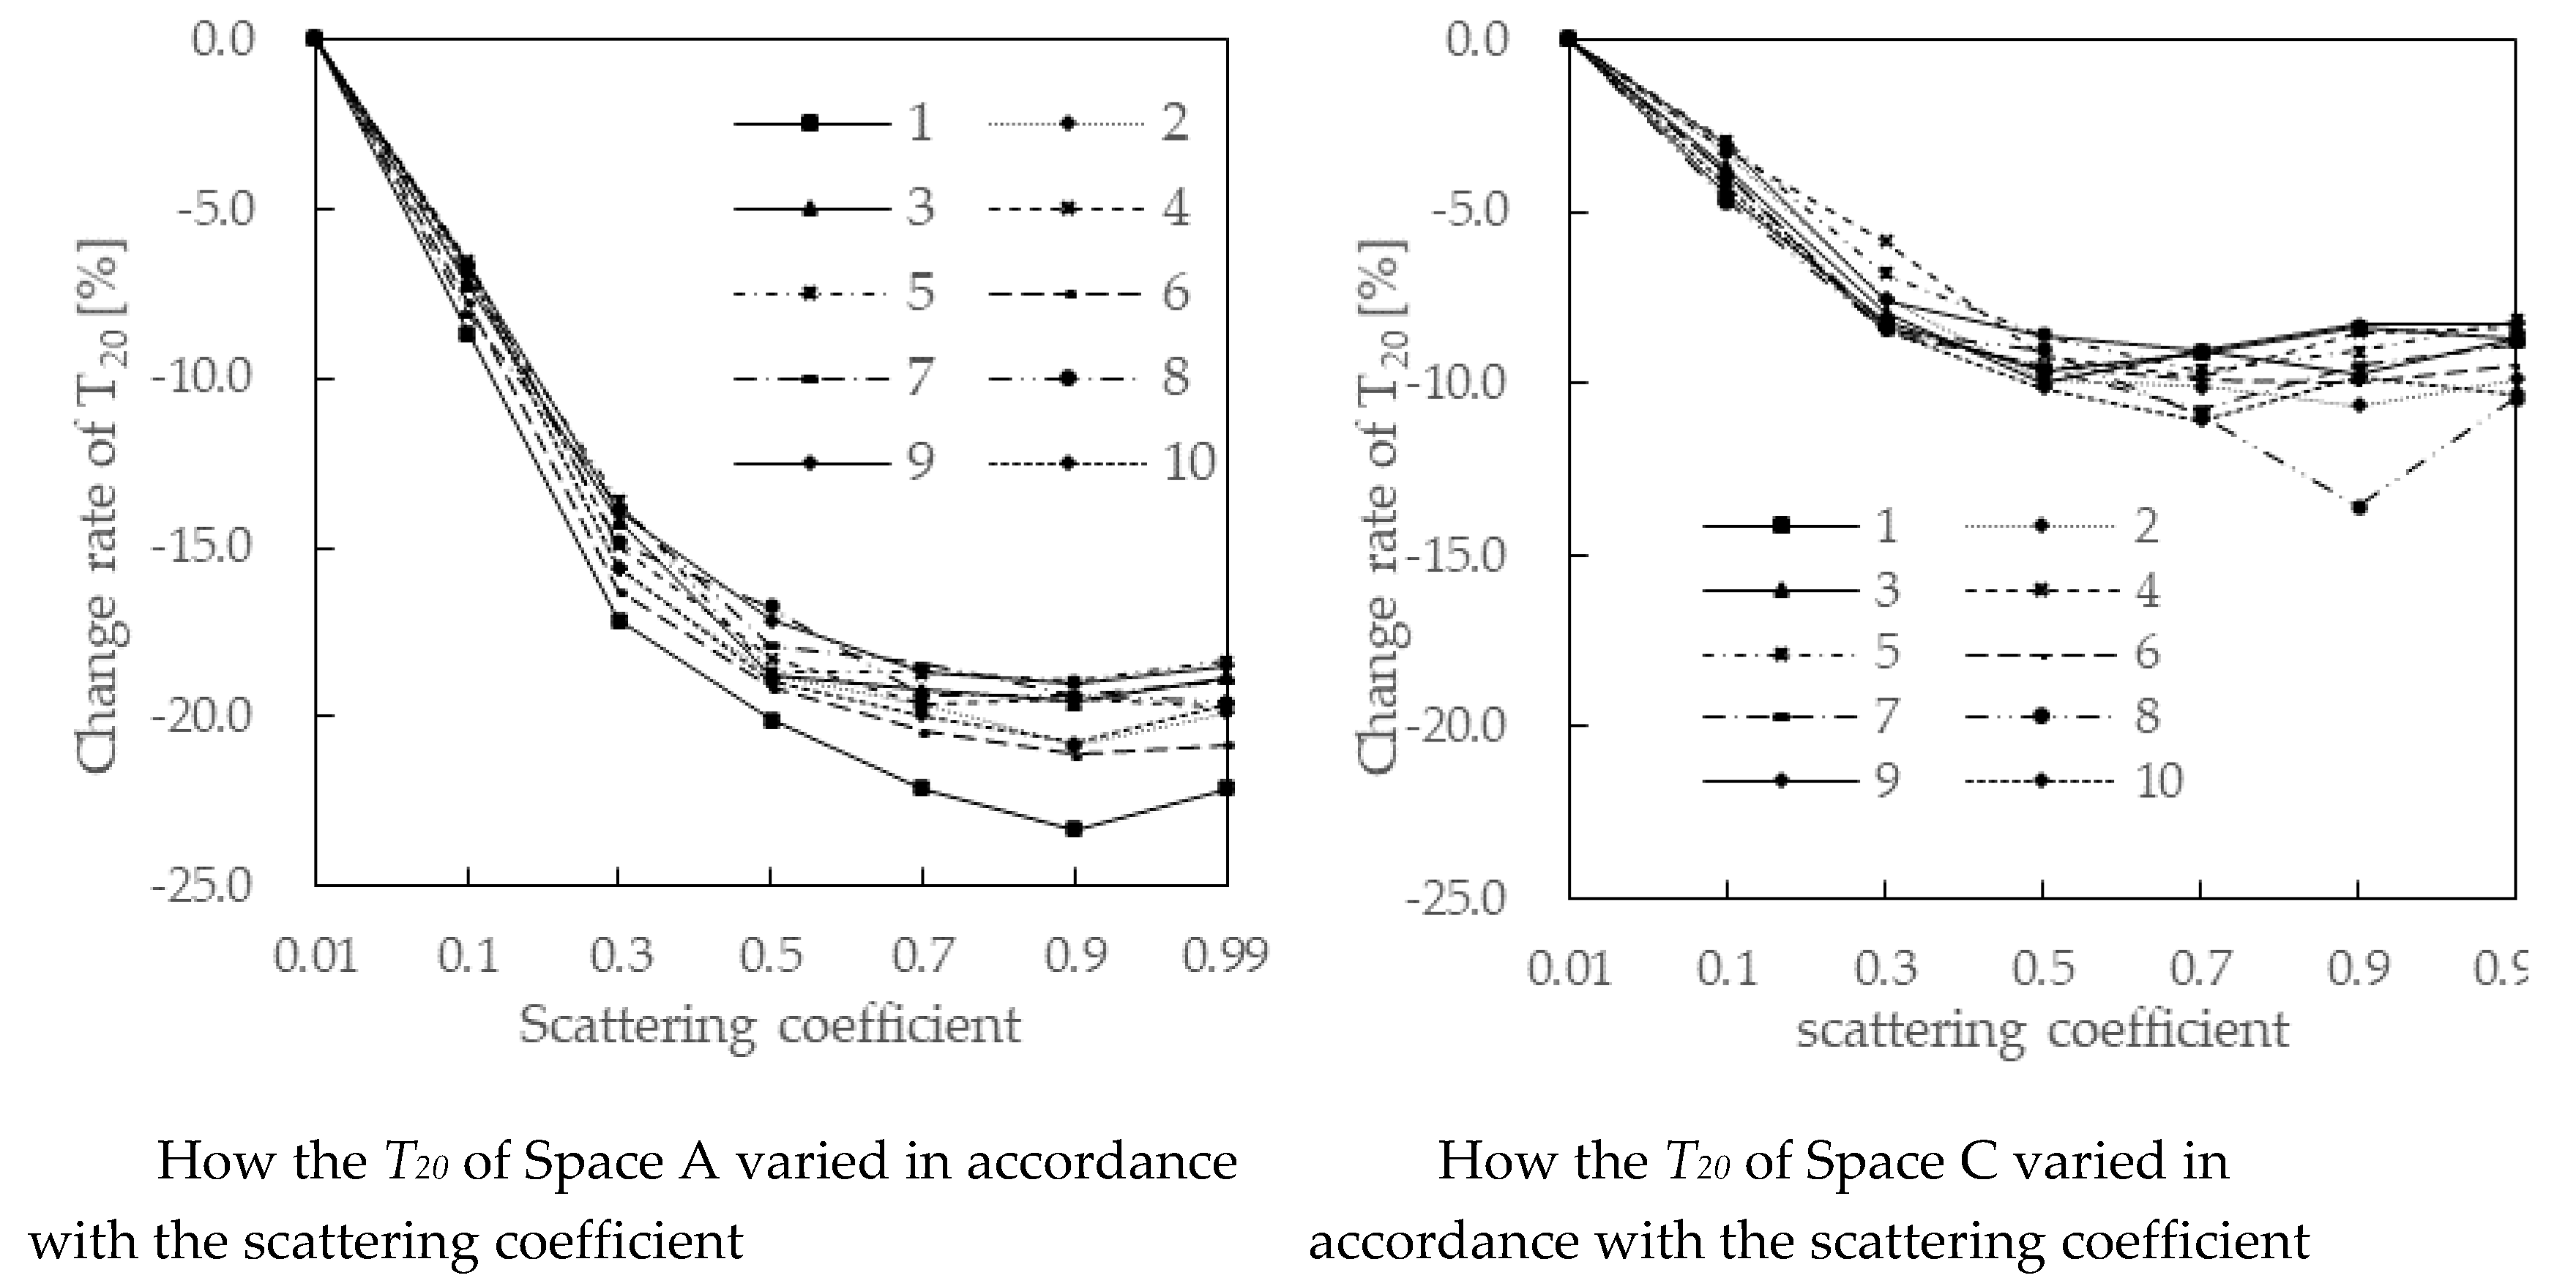
4. The Impact of Spatial Shape on the T20 Change Rate

Figure 5 presents the calculation results, with the abscissa indicating the surface scattering coefficient and the ordinate indicating the T20 change rate. The curve in Figure 5 shows how the T20 change rate varied as the surface scattering coefficient increased. The ordinate value was consistent with the just noticeable difference (JND) value of T20 at a regular interval of 5% [23,24,25,30]. As shown in Figure 5, T20 tended to decrease as the scattering coefficient increased in differently shaped spaces. This variation trend is consistent with existing study results [8,11,14,16,21]. However, the decreasing trend was different across different spatial shapes.
The T20 decay curves in Figure 5 can be roughly classified into four groups. Within each group, the decay curves shared a similar variation trend; the variation trend of the decay curves was obviously different across groups. The more surfaces were spatially changed, the lower the RT change rate from increased surface scattering became.
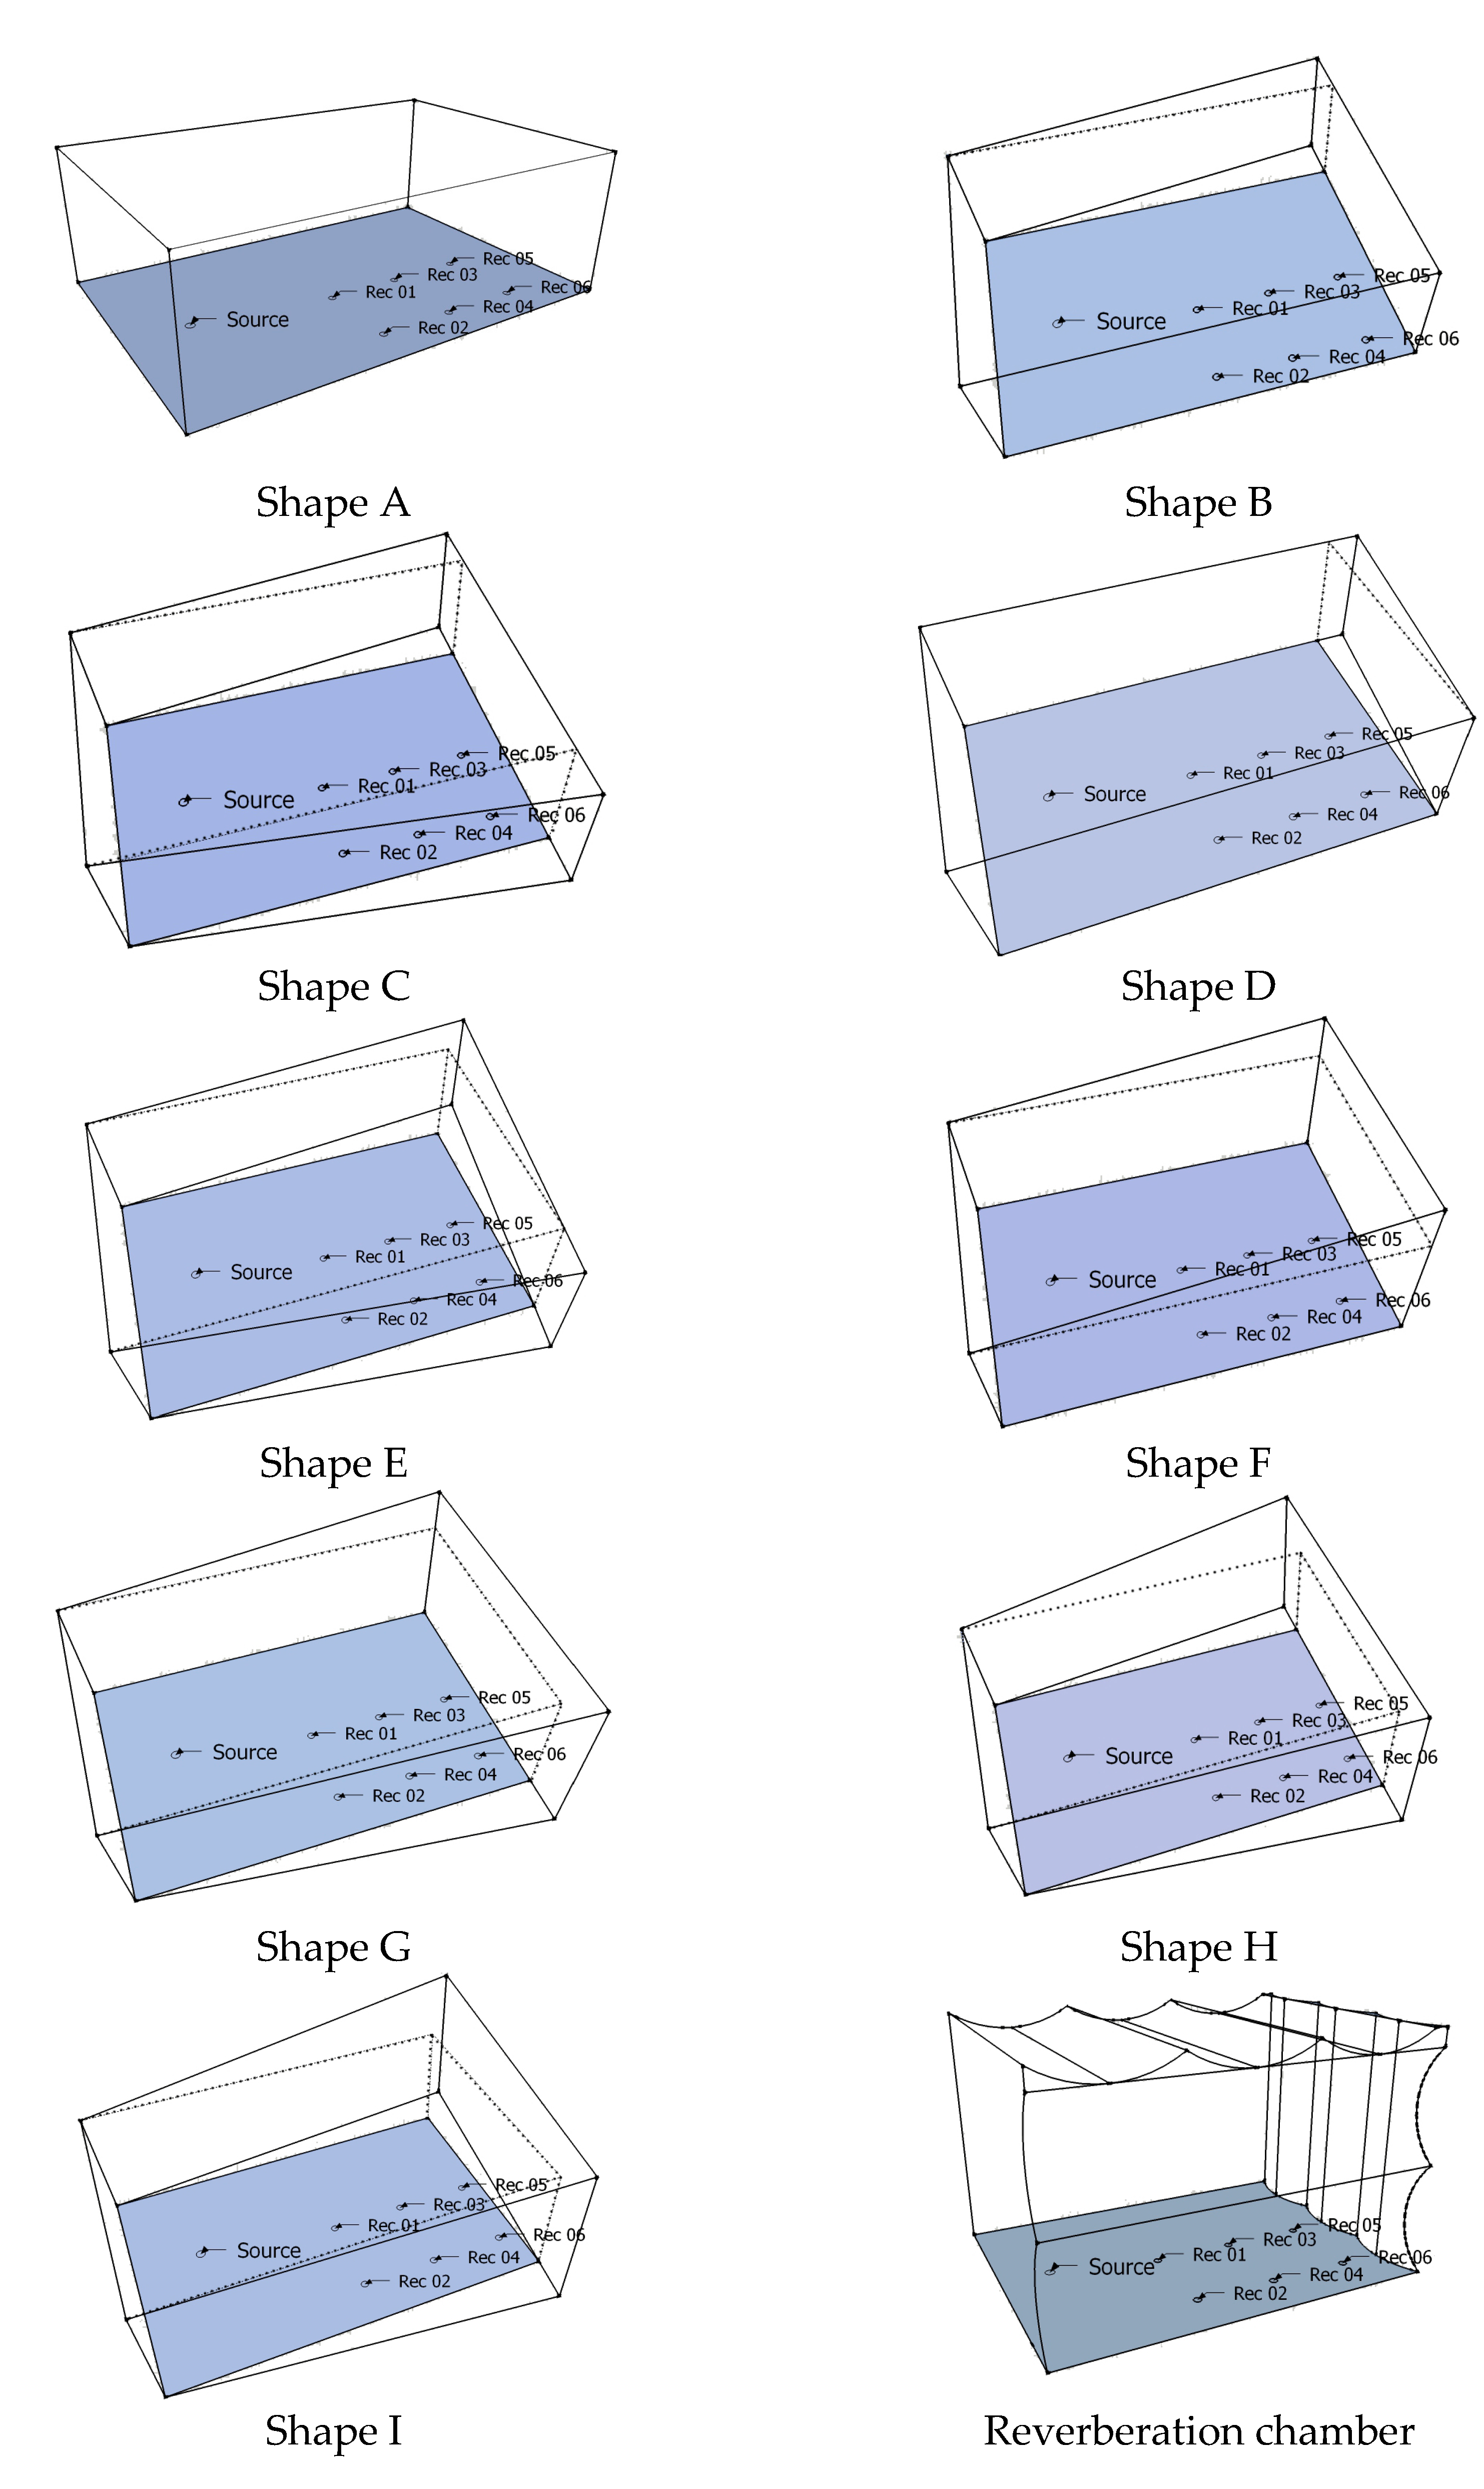
In accordance with the space adjustment described above, the rectangular space was adjusted in three ways. First, the rectangular space remained unchanged, and was marked Space A. Second, the walls or ceiling were tilted separately; specifically, a single side wall was tilted, both side walls were tilted, the rear wall was tilted, and the ceiling was tilted. Spaces B, C, D, E, and F were obtained in this way. Third, both walls and the ceiling were adjusted at same time. Specifically, a single side wall and the ceiling were adjusted; both side walls and the ceiling were adjusted; and rear walls and a ceiling were added to both side walls. Spaces G, H, and I were obtained in this way. In each group of spaces, the curves of the T20 change rate shared a similar trend; the maximum difference in the change rate was less than 3% and the difference in the change rate between groups was approximately 5%. Evidently, each group of spaces shared a consistent change-rate trend, while the change-rate trend was obviously different across groups.
T20 varied most significantly in relation to the scattering coefficient in Space A. T20 change rate tended to decrease evenly; it decreased most significantly (by 25%) when the scattering coefficient was 0.9. In Spaces B, C, E, and F, the T20 change rate was approximately the same under four states, and the maximum decrease in the T20 change rate was approximately 20%. In Spaces D, G, H, and I, the T20 change rate was approximately the same under three states, and the maximum decrease in the T20 change rate was approximately 20%. In the reverberation chamber, the T20 change rate with the scattering coefficient was less than 3%.
The curves of the T20 change rate shown in Figure 5 presented a dual-slope trend, with 0.3 as the demarcation point. When the scattering coefficient ranged between 0.01 and 0.3, T20 presented a stage of rapid decrease; the maximum change to T20 (17%) occurred in the rectangular space. The minimum change to T20 was 8%. Both were greater than 5%. When the scattering coefficient ranged between 0.3 and 0.99, the T20 change tended to be smooth, while the T20 change rate was always lower than 5%.

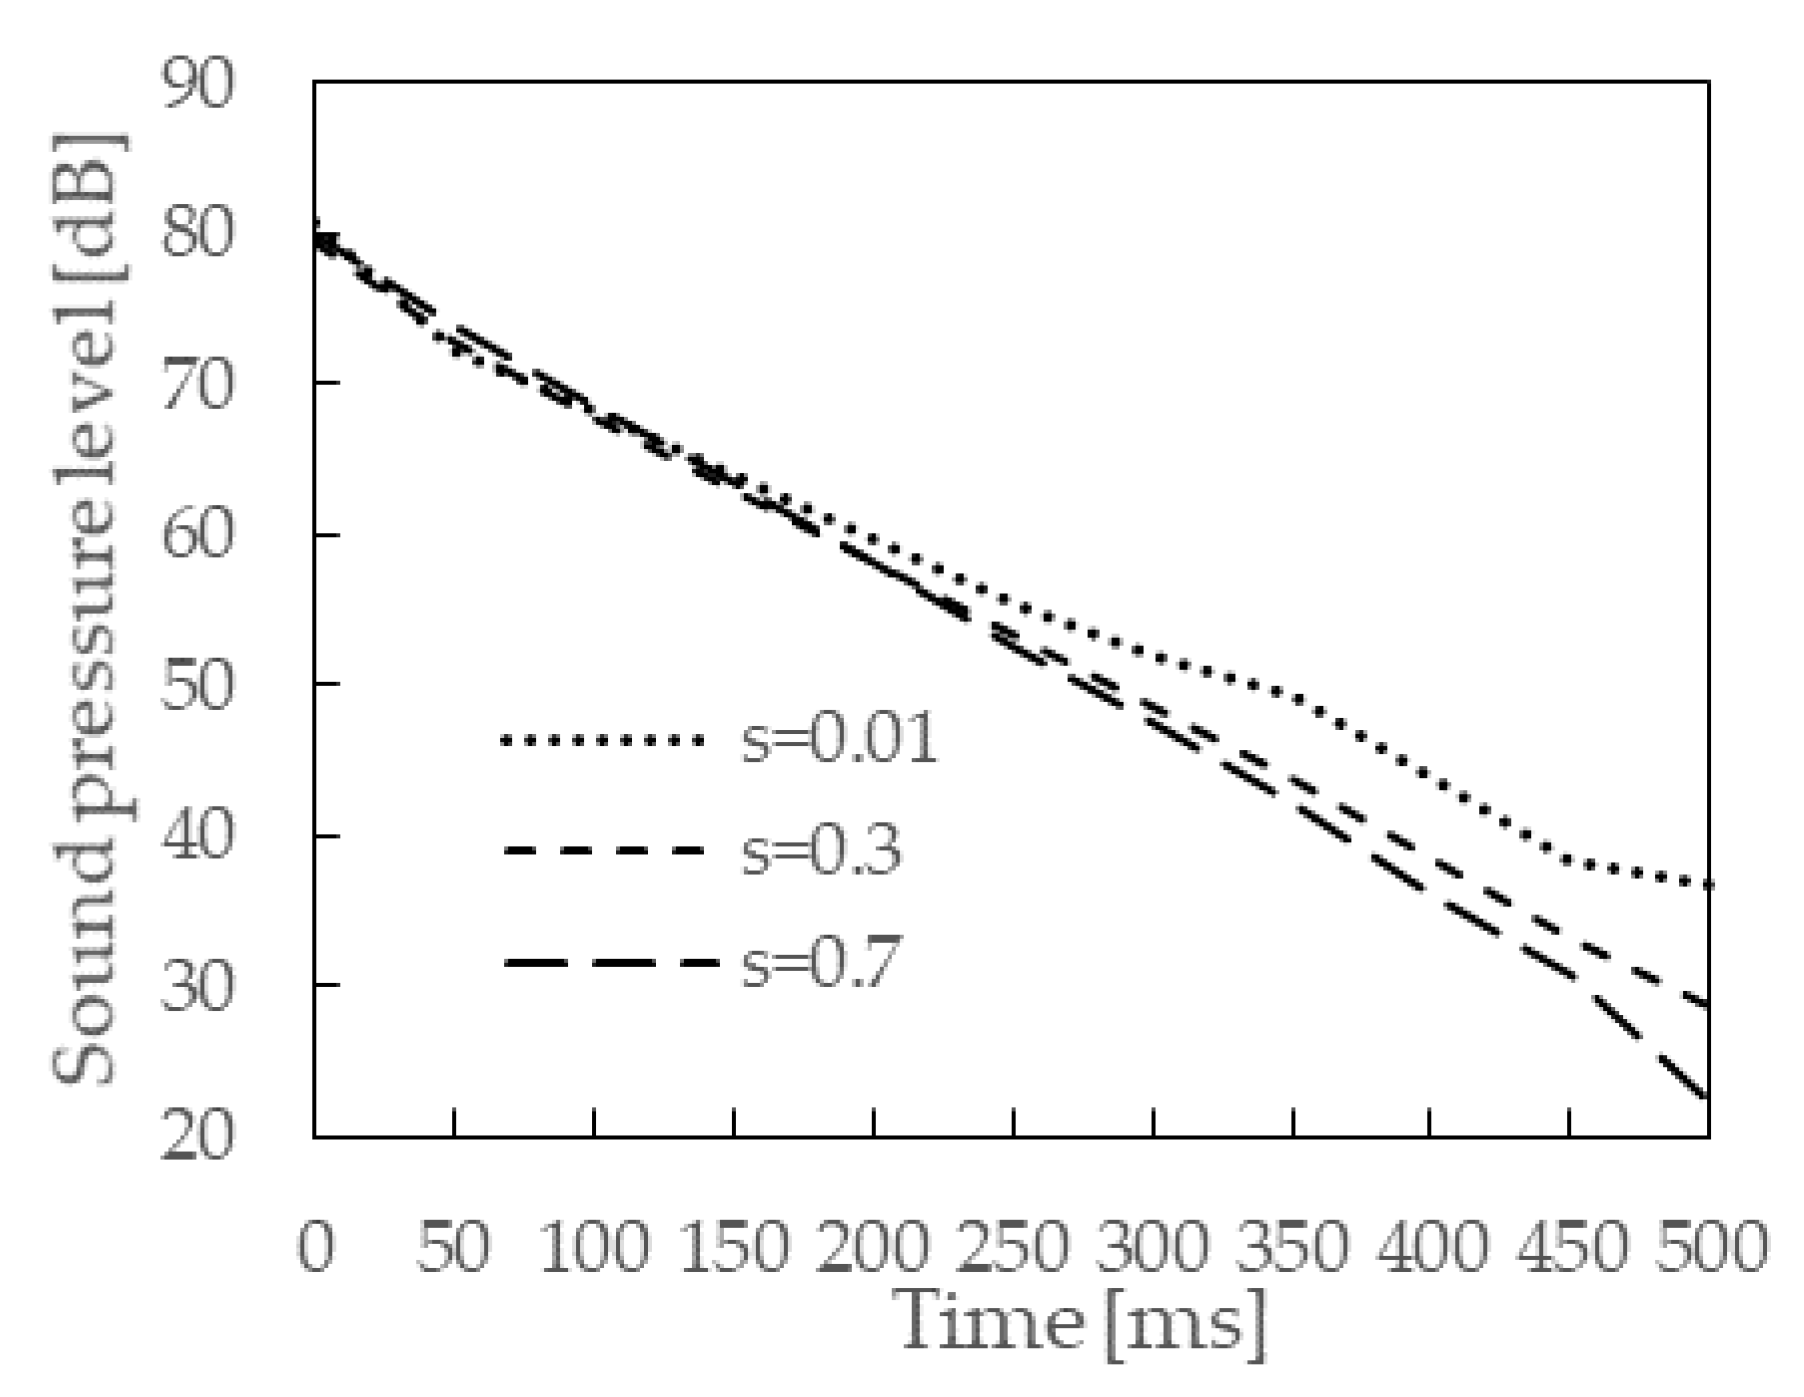
5. Impact of the Scattering Coefficient on T20

Four spaces were selected to compare T20 values. The selected spaces included the perfect diffusion reverberation chamber, the rectangular space, a space with adjusted walls, and a space with adjustments to both walls and ceiling. In the four spaces, the surface scattering had three states (the surface scattering coefficient was 0.01, 0.3 and 0.7). Figure 6 shows the calculation results.
As shown in Figure 6, the T20 varied in accordance with the scattering coefficient across the four spaces. As the scattering coefficient increased, the T20 decreased in three spaces (apart from the reverberation chamber); the T20 change range was different across the four spaces. Space A had the largest change range. The change ranges of Spaces B and G were smaller than Space A. When the scattering coefficient was low (0.01), the T20 differed most among the four spaces. Specifically, the T20 in Space A was approximately 1.23 times that in the reverberation chamber, while the T20 in Spaces B and G were approximately 1.17 times that in the reverberation chamber. As the scattering coefficient increased, the difference in T20 across the four spaces gradually decreased. When the scattering coefficient was 0.3, the T20 in Spaces A, B and G were approximately 1.05 times that in the reverberation chamber. When the scattering coefficient increased to 0.7, the T20 was basically the same across the four spaces.
The above analysis shows that, under the same surface scattering coefficient, T20 varied in accordance with spatial shapes. When the surface scattering coefficient was low, the T20 varied significantly. The inherent diffusivity of each space obviously affected the T20. The more parallel surfaces existed within a space, the lower the diffusivity of that space, and the more significantly the T20 varied. As the surface scattering coefficient increased, the inherent diffusivity of each space affected the T20 less significantly, and the T20 in all other spaces tended to be consistent with that in the reverberation chamber.

6. The Impact of Spatial Volume on the T20 Change Rate

Typical Spaces A and C were selected to be scaled up. While their spatial shapes remained unchanged, their volume gradually increased by a factor of 1.0, 2.0, 3.0, 4.0, 5.0, 6.0, 7.0, 8.0, 9.0, and 10.0, thus ranging from 3000 to 30,000 m3. During the calculation process, the average acoustic absorption coefficient was 0.5.
The T20 change curve related to Space A basically coincided with that related to Space C. The maximum T20 change rate related to Space A was 0.23, and the difference in the maximum T20 change rate was 4% between different volumes. The maximum T20 change rate related to Space C was 13.5%. Except for one or two numerical values, the difference in the maximum T20 change rate was 4% between different volumes. Evidently, the impact of the surface scattering coefficient on T20 was weakly correlated with spatial volume when the spatial volume ranged between 3000 and 30,000 m3 (as shown in Figure 7).

7. Definition of Morphology Diffusivity

Figure 2, Figure 3, Figure 4, Figure 5, Figure 6 and Figure 7 show that as the surface scattering coefficient increased, the T20 tended to decrease. During this process, the slope of the curve changed constantly until the curve became horizontal, presenting a dual-slope trend overall. However, the sensitivity of T20 to the surface scattering coefficient varied across different spatial shapes. The maximum decay decreased as the tilt area increased. For the standard reverberation chamber, the surface scattering coefficient had almost no effect on T20. As yet, no standard has been established to measure spatial diffusivity. For this reason, it is necessary to introduce the concept of “Morphology Diffusivity”.
Kuttruff [15] calculated RT by increasing the scattering coefficient, showing that, as the scattering coefficient increased, the decay of sound energy was approximated to the linear decay assumed by the Eyring equation. In a single space study, Wang [28] calculated T30 under a scattering coefficient of 0; the difference between this T30 and the T30 calculated using the Eyring equation became the sensitivity index of the scattering coefficient.
For spaces with the same volume but different shapes, the variation trend of T20 with the scattering coefficient was different if the acoustic absorption coefficient remained the same. The difference in the variation of T20 may have been due to differences in the diffusivity of spatial shapes. The results in Figure 6 show that the T20 change rate was associated with the composition of surface tilt. Spatial surfaces were divided into two groups, including walls and ceilings. When a single group of surfaces changed (e.g., walls only or ceilings only were adjusted), the T20 change rate was the same, and no perfect diffusion sound fields were generated. When both groups of surfaces changed, the T20 change rate was the same, but differed significantly from the T20 change rate for the first group of surfaces. Likewise, no perfect diffusion sound fields were generated. When both walls and ceilings were tilted, and diffusion shapes were added to their surfaces, perfect diffusion sound fields were generated in the spaces. When only spatial volume was changed, the T20 variation trend remained unchanged. Hence, morphology diffusivity can be defined as the inherent degree of diffusion of different spatial shapes.
Morphology diffusivity can be divided into four grades by the change amplitude of T20 (as listed in Table 2). Grade I stands for the morphology diffusivity of rectangular spaces. Rectangular spaces are reference spaces. However, the six planes of each rectangular space are three groups of parallel planes, so rectangular spaces are imperfect diffusion spaces. After the walls or ceilings of rectangular spaces were tilted, the morphology diffusivity of the new spaces became superior to that of the original rectangular spaces. The morphology diffusivity of such spaces was defined as Grade II. After both the walls and ceilings of rectangular spaces were tilted, the morphology diffusivity of the new spaces was further improved. The morphology diffusivity of such spaces was defined as Grade III. After diffusers were added to both the walls and the ceilings of reverberation chambers, perfect diffusion sound fields were generated. The morphology diffusivity of the reverberation chambers was then defined as Grade IV, and the reverberation chambers were perfect diffusion spaces.
Morphology diffusivity was classified into four grades, ranging from I to IV. Grade I represented the lowest level of morphology diffusivity, while IV indicated the highest level of morphology diffusivity.
While T20 decreased as the scattering coefficient increased, there were two sections of different slopes in the change rate curve. As the scattering coefficient increased, T20 first decreased rapidly, with a change rate greater than 5%; then, T20 varied smoothly, with a change rate less than 5%. Hence, the inflection point of the slope was determined to be the critical scattering coefficient. For the samples used in this study, the critical scattering coefficient of the reverberation chamber was 0.01, and the critical scattering coefficients of the other spaces were 0.3. This confirmed the results of an earlier investigation by Wang [28] and Lam [38].

8. Conclusions

This study investigated the impact of surface scattering on T20 in differently shaped spaces. A rectangular space was used as the reference space model. On this basis, spatial shapes were adjusted.
The T20 was affected by both the inherent morphology diffusivity and surface scattering coefficient. When the morphology diffusivity was high, reflections were reflected in different ways, and the surface scattering coefficient only slightly affected the T20. For example, the T20 in the reverberation chamber did not vary with the surface scattering coefficient due to the complex shape. However, the surface scattering coefficient significantly affected the T20 when the morphology diffusivity was low. For example, in the rectangular space, the T20 change rate was 25% when the surface scattering coefficient changed. The morphology diffusivity could be re-graded by adjusting the quantity and positions of the tilted walls and ceilings. Therefore, the morphology diffusivity grades accurately described the aforementioned analysis.
For imperfect diffusion spaces, such as a rectangular space, there is a turning point in each curve of the change rate of the T20. The scattering coefficient at the inflection point is the critical scattering coefficient. For spaces such as the rectangular space, the critical scattering coefficients were all 0.3; in the reverberation chamber, the critical scattering coefficient was 0.01. Evidently, no critical scattering coefficients exist in perfect diffusion spaces, although they do exist in imperfect diffusion spaces. The results of this study show that the critical scattering coefficients of imperfect diffusion spaces are approximately 0.3.
The morphology diffusivity of space is proposed. The morphology diffusivity of space can be assigned according to the combination of different surfaces in space. Each morphology diffusivity value corresponds to a diffusion degree level, and different levels correspond to different maximum change rates of the T20. For example, when the wall or ceiling is inclined separately, it corresponds to Grade II; when the wall and ceiling are inclined at the same time, it corresponds to Grade III. The RT’s accuracy can be improved according to the morphology diffusivity and the scattering coefficient in the RT calculations of performance spaces.
In spaces with different volumes, the impact of the surface scattering coefficient on T20 is unaffected by the size of spatial volume; specifically, inherent morphology diffusivity is not affected when spatial volume ranges between 3000 and 30,000 m3.
In this study, only the uniform arrangement of sound absorption coefficients was assessed; the uneven distribution of sound absorption coefficients will be researched in the future.

Author Contributions

The individual contributions of authors are as follows: calculation model, data curation and writing, X.Z.; supervision and review, J.K. and H.M. All authors have read and agreed to the published version of the manuscript.

Funding

The support from the UKRI (EP/X123456/1) is acknowledged.

Conflicts of Interest

The authors declare no conflict of interest.

References

  1. Haan, C.H.; Fricke, F.R. Surface Diffusivity as a Measure of the Acoustic Quality of Concert Halls. In Proceedings of the Conference of the Australia and New Zealand architectural Science Association, Sydney, Austrilia, 30 November–3 December 1994. [Google Scholar]
  2. International Standards Organization. ISO 17497-1. Acoustics-Measurement of Sound Scattering Properties of Surfaces. Part 1: Measurement of the Random Incidence Scattering Coefficient in a Reverberation Room; International Standards Organization: Geneve, Switzerland, 2004. [Google Scholar]
  3. D’Antonio, P.; Cox, T. AES-4id-2001(r2007): AES information document for room acoustics and sound reinforcement systems characterization and measurement of surface scattering uniformity. J. Audio Eng. Soc. 2001, 4, 149–165. [Google Scholar]
  4. Cox, T.J.; Dalenbäck, B.I.; Antonio, P.D.; Embrechts, J.J.; Jeon, J.Y.; Mommertz, E.; Vorländer, M. A tutorial on scattering and diffusion coefficients for room acoustic surfaces. Acta Acust. 2006, 92, 1–15. [Google Scholar]
  5. Haan, C.H.; Fricke, F.R. An evaluation of the importance of Surface Diffusivity in Concert Halls. Appl. Acoust. 1997, 51, 53–69. [Google Scholar] [CrossRef]
  6. Bradley, J.S. A comparison of three classical concert halls. J. Acoust. Soc. Am. 1991, 89, 1176–1192. [Google Scholar] [CrossRef]
  7. Vitale, R. Perceptual Aspects of Sound Scattering in Concert Halls. Ph.D. Thesis, RWTH Aachen University, Aachen, Germany, 2015. [Google Scholar]
  8. Seo, C.K.; Kim, Y.H.; Lee, P.J.; Jeon, J.Y. Acoustical renovation of small auditoria using sound diffusers. In Proceedings of the International Symposium on Room Acoustics, ISRA 2010, Melbourne, Australia, 29–31 August 2010. [Google Scholar]
  9. Jeon, J.Y.; Jang, H.S.; Kim, Y.H. Influence of wall scattering on the early fine structures of measured room impulse responses. J. Acoust. Soc. Am. 2015, 137, 1108–1116. [Google Scholar] [CrossRef]
  10. Sakurai, M.; Ando, Y.; Yamamoto, I.; Iizuka, T.; Oowaki, M. An evaluation of the effects of scattered refections in a sound field. J. Sound Vib. 2000, 232, 303–308. [Google Scholar]
  11. Ryu, J.K.; Jeon, J.Y. Subjective and objective evaluation of a scattered sound field in a scale model opera house. J. Acoust. Soc. Am. 2008, 124, 1528–1549. [Google Scholar] [CrossRef] [PubMed]
  12. Jeon, J.Y.; Seo, C.K.; Kim, Y.H.; Lee, P.J. Wall diffuser designs for acoustical renovation of small performing spaces. Appl. Acoust. 2012, 73, 828–835. [Google Scholar] [CrossRef]
  13. Hodgso, M. Evidence of diffuse surface reflections in rooms. J. Acoust. Soc. Am. 1991, 89, 765–771. [Google Scholar] [CrossRef]
  14. Yokota, T.; Seimiya, T.; Sakamoto, S.; Tachibana, H. Difference in acoustic effect of sound diffusers due to room shapes. J. Acoust. Soc. Jpn. 2000, 21, 283–285. [Google Scholar] [CrossRef] [Green Version]
  15. Kuttruff, H.; Strassen, T. Zur Abhängigkeit des Raumnachhalls von der Wanddiffusitat und von der Raumf orm. Acustica 1980, 45, 246–255. (In German) [Google Scholar]
  16. Wang, Y.Y. An Initial Study of the Effect of Surface Scattering on Concert Hall Acoustics. Master’s Thesis, South China University of Technology, Guangzhou, China, 2013. (In Chinese). [Google Scholar]
  17. Kim, Y.H.; Jang, H.S.; Jeon, J.Y. Characterizing diffusive surfaces using scattering and diffusion coefficients. Appl. Acoust. 2011, 72, 899–905. [Google Scholar] [CrossRef]
  18. Kuttruff, H. Room Acoustics, 5th ed.; Spon Press: London, UK, 2009; pp. 101–102. [Google Scholar]
  19. Billon, A.; Picaut, J.; Sakout, A. Prediction of the reverberation time in high absorbent room using a modified-diffusion model. Appl. Acoust. 2008, 69, 68–74. [Google Scholar] [CrossRef]
  20. Yun, J.; Xiang, N. On boundary conditions for the diffusion equation in room-acoustic prediction: Theory, simulations, and experiments. J. Acoust. Soc. Am. 2008, 123, 145–153. [Google Scholar]
  21. Shtrepi, L.; Astolfi, A. Objective and perceptual assessment of the scattered sound field in a simulated concert hall. J. Acoust. Soc. Am. 2015, 138, 1458–1497. [Google Scholar] [CrossRef]
  22. Shtrepi, L.; Astolfi, A.; Rychtarikova, M. The influence of a volume scale-factor on scattering coefficient effects in room acoustics. Build. Acoust. 2014, 21, 153–166. [Google Scholar] [CrossRef]
  23. Vorländer, M. International Round Robin on Room Acoustical Computer Simulations. In Proceedings of the 15th ICA, Trondheim, Norway, 26–30 June 1995; pp. 689–692. [Google Scholar]
  24. Bork, I. A Comparison of Room Simulation Software. The 2nd Round Robin on Room Acoustical Computer Simulation. Acta Acust. United Acust. 2000, 86, 943–956. [Google Scholar]
  25. Bork, I. Report on the 3rd round robin on room acoustical computer simulation—Part II: Calculations. Acta Acust. United Acust. 2005, 91, 753–763. [Google Scholar]
  26. Dalenbäck, B.I. CATT-Acoustic v9.0 User’s Manual; CATT-Acoustic: Gothenburg, Sweden, June 2011.
  27. Dalenbäck, B.I. TUCTTM v1.0g User’s Manual; CATT-Acoustic: Gothenburg, Sweden, June 2011. [Google Scholar]
  28. Wang, L.M.; Rathsam, J. The influence of absorption factors on the sensitivity of a virtual room’s sound field to scattering coefficients. Appl. Acoust. 2008, 69, 1249–1257. [Google Scholar] [CrossRef]
  29. GB/T 6881.1-2002. Acoustics—Determination of Sound Power Levels of Noise Sources Using Sound Pressure—Precision Methods for Reverberation Rooms Appendix, D; General Administration of Quality Supervision, Inspection and Quarantine of the People’s Republic of China: Beijing, China, 2002. (In Chinese) [Google Scholar]
  30. Gao, Y.L. The definition of the dividing frequency between large and small rooms in the sense of acoustics. Entertain. Technol. 2016, 3, 15–26. (In Chinese) [Google Scholar]
  31. ISO 3382-1:2009. Acoustics—Measurement of Room Acoustic Parameters—Part 1: Performance Spaces; International Organization for Standardization: Geneva, Switzerland, 2009. [Google Scholar]
  32. GB/T 36075.1-2018. Acoustics—Measurement of Room Acoustic Parameter—Part 1: Performance Spaces; General Administration of Quality Supervision, Inspection and Quarantine of the People’s Republic of China: Beijing, China, 2018. (In Chinese) [Google Scholar]
  33. Schroeder, M.R.; Hackman, D. Iterative calculation of reverberation time. Acustica 1980, 45, 269–273. [Google Scholar]
  34. Seraphim, H.P. Untersuchungen iiber die Unterschiedsschwelle exponentiellen Abklingens von Rauschbandimpulsen. Acustica 1958, 8, 280–284. (In German) [Google Scholar]
  35. Karjalaninen, M.; Jarvelainen, H. More about this reverberation science: Perceptually good late reverberation. Presented at the 111th AES Convention, New York, NY, USA, 21–24 September 2001; Volume 5415. [Google Scholar]
  36. Niaounakis, T.I.; Davies, W.J. Perception of reverberation time in small listening rooms. J. Audio Eng. Soc. 2002, 50, 343–350. [Google Scholar]
  37. Zhao, F.J.; Meng, Z.H.; Sheng, S.W. The measurement of the gap between the subjective reverberation of national instrumental music. Acta Acoust. 2008, 33, 498–503. [Google Scholar]
  38. Lam, Y.W. The dependence of diffusion parameters in a room acoustics prediction model on auditorium sizes and shapes. J. Acoust. Soc. Am. 1996, 100, 2193–2203. [Google Scholar] [CrossRef]
Figure 1. Ten spaces used for simulated calculations. The blue area is the bottom of the reference rectangle. The dotted and solid lines represent the rectangular and adjusted spatial shapes, respectively.
Applsci 10 04880 g001
Figure 2. Comparison of the T20 and T30 change rates in Spaces A, B, and H at 2000 Hz. Note: A: rectangular space, B: single sidewall tilted, and H: both sidewalls and ceiling are tilted at the same time.
Applsci 10 04880 g002
Figure 3. Decay curves related to the rectangular space under surface scattering coefficients of different values.
Applsci 10 04880 g003
Figure 4. Decay curves related to the reverberation chamber under surface scattering coefficients of different values.
Applsci 10 04880 g004
Figure 5. The impact of the scattering coefficient on the T20 change rate under the same volume and different shapes Note: A—rectangular space, B—single sidewall tilted, C—both sidewall tilted, D—backwall tilted, E—both sidewalls and backwall are tilted at the same time, F—ceiling tilted, G—single sidewall tilted, H—both sidewalls and ceiling are tilted at the same time, I—all sidewalls and ceiling are tilted at the same time, Re Chamber—reverberation chamber.
Applsci 10 04880 g005
Figure 6. Variations in T20 with a scattering coefficient in different spaces Note: A—rectangular space, B—single sidewall tilted, G—single sidewall and ceiling tilted, Re Chamber—reverberation chamber.
Applsci 10 04880 g006
Figure 7. T20 change rate with scattering coefficient: the same shape but different volumes Note: A—rectangular space, C—both sidewalls tilted. The 1.2–10 are represents amplifications.
Applsci 10 04880 g007
Table 1. The adjustment of spatial shape.
CaseABCDEFGHI
Combination——sdbd × rcs × cd × cd × r × c
Note: Capital letters denote different cases, and lower-case letters denote position changes. s is the single abbreviation, which means that only one right or left side wall is inclined. d is the double abbreviation, which means that both the right and left side walls are inclined. r is the rear wall abbreviation, which means that the rear wall is inclined. c is the ceiling abbreviation, which means that the ceiling is inclined. Thus, d × r × c means that the side walls, rear wall, and ceiling are inclined simultaneously.
Table 2. Classification of morphology diffusivity.
Diffusivity Grade Representative Space Characteristic of Spatial Variation Maximum Change Rate Critical Scattering Coefficient
Grade IARectangular space 25%0.3
Grade IIB/C/D/E/FTilt of wall or ceiling 20%0.3
Grade IIIG/H/ITilt of wall and ceiling 15%0.3
Grade IV——Reverberation chamber 0%0.0

