Methods of Predicting the Effectiveness of Hydrochloric Acid Treatment Using Hydrodynamic Simulation


Abstract
:1. Introduction
2. Materials and Methods
3. Research Results and Obtained Factual Findings on the Predicted Effectiveness Evaluation of Hydrochloric Acid Treatment at the Fields of Perm Krai
4. Conclusions
Author Contributions
Funding
Conflicts of Interest
Nomenclature
| S | skin factor |
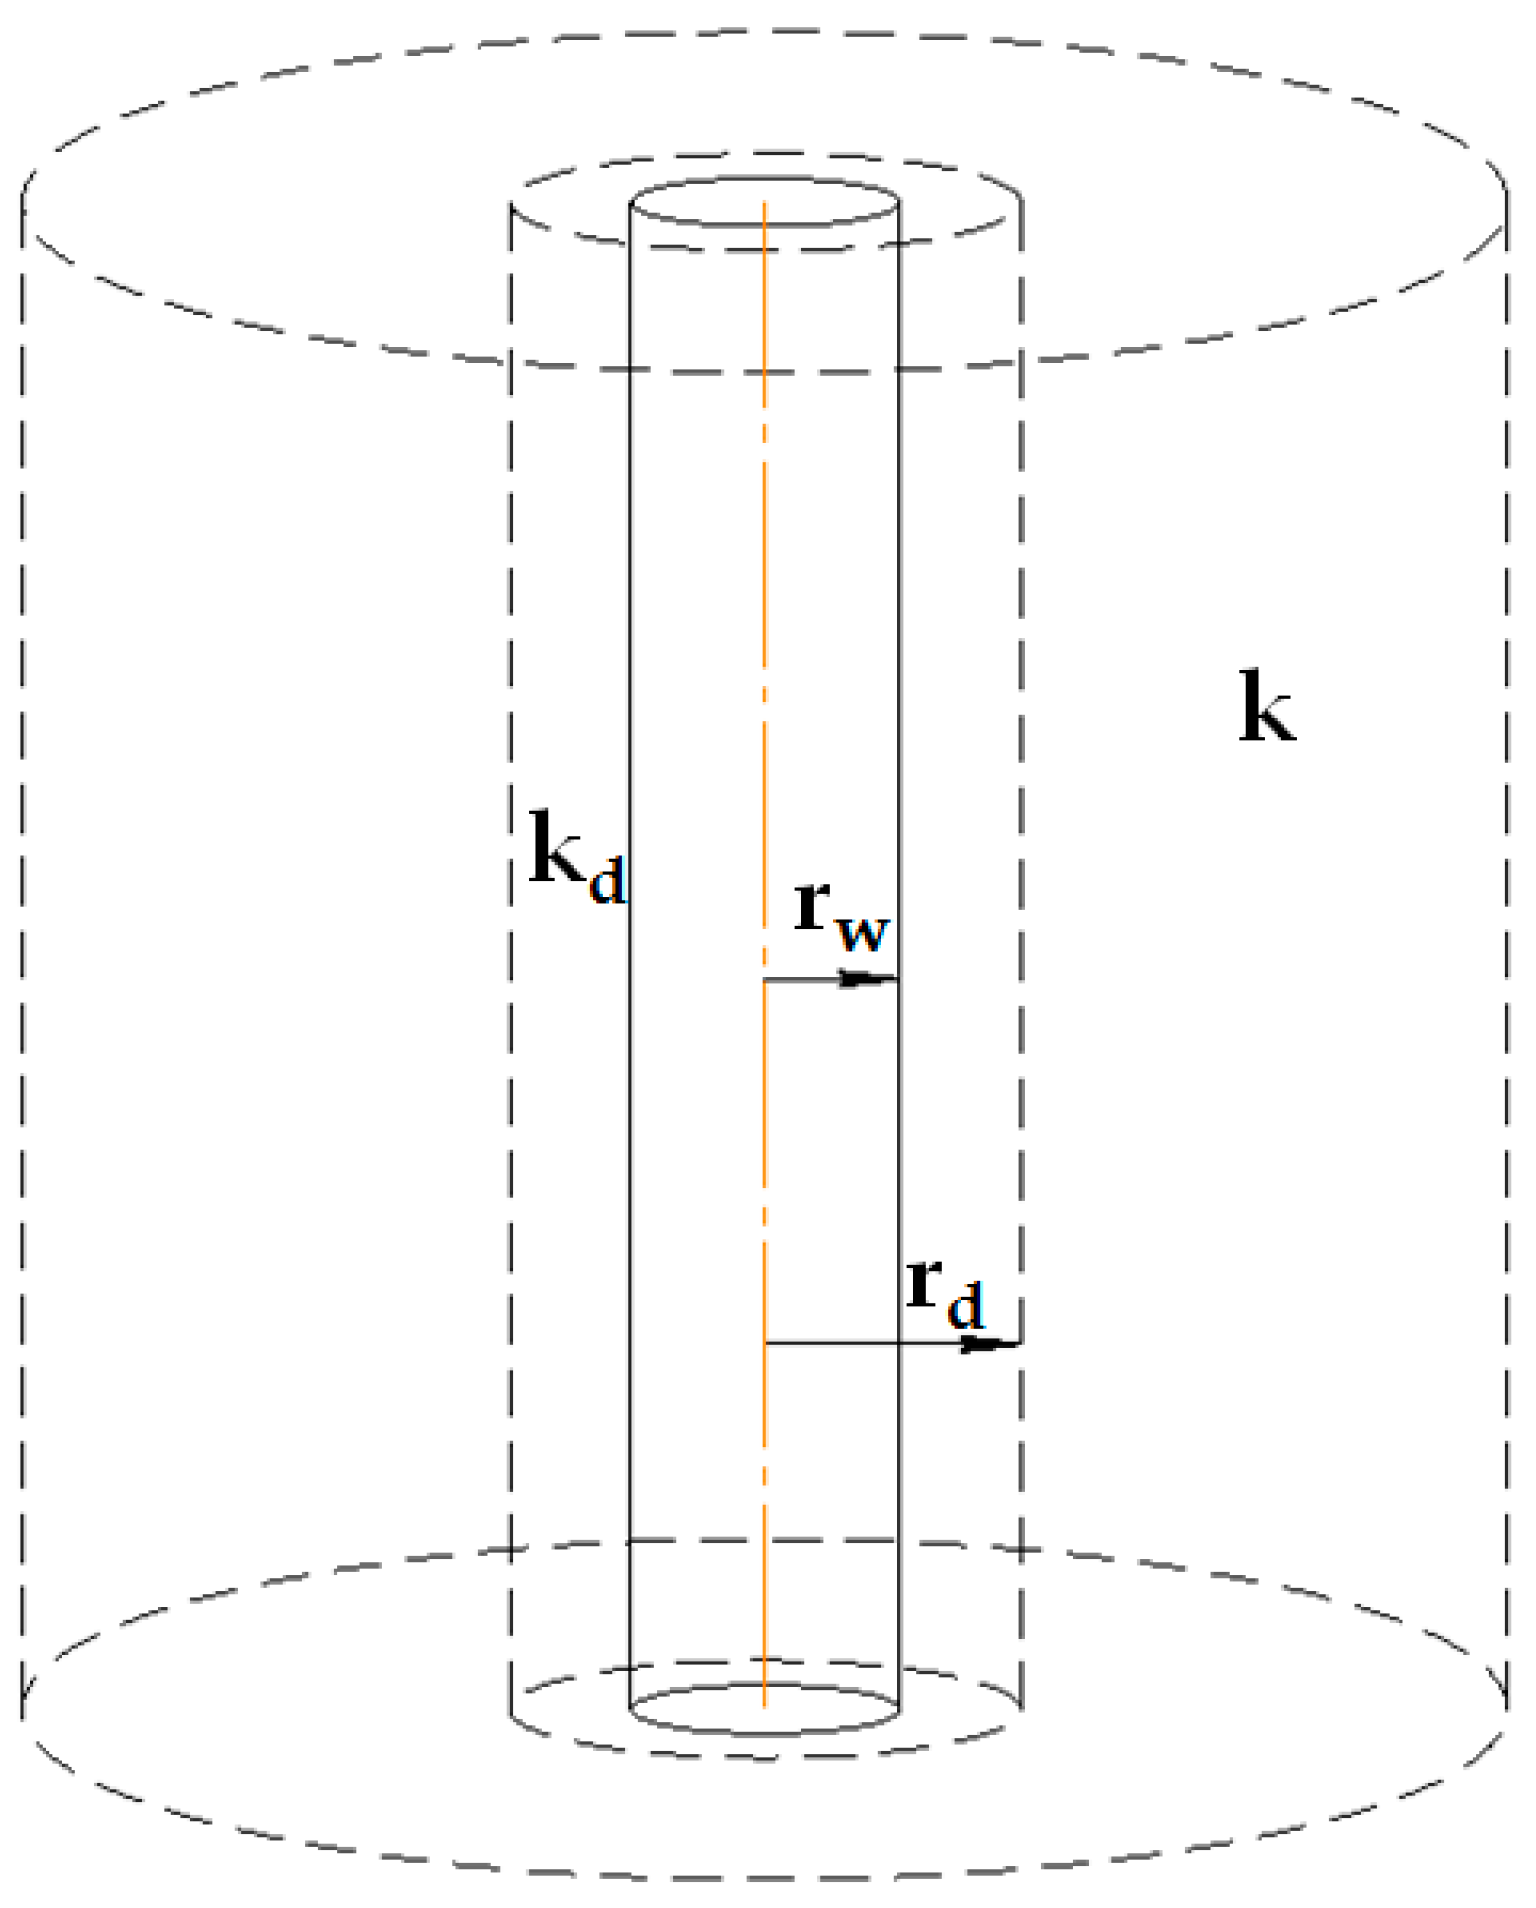
| k | permeability coefficient of far field zone, μM; |
| kd | permeability coefficient of near-wellbore zone, μm2 |
| rd | drainage area radius, m |
| rw | well radius, m |
| d | fractal dimension of pore space structure in bottom-hole zone |
| Ac | acid value |
| q | rate of acid composition injection, m3/s |
| D | diffusion coefficient, m2/s |
| h | perforated thickness of formation, m |
| b | a constant taken as equal to 1.7∙104 md−2 |
| V | volume of injected acid composition, m3; |
| m | porosity, %; |
| x | limestone content in rock, % |
| y | dolomite content in rock, % |
| C | molar concentration, mol/L |
| ϑ | stoichiometric coefficient |
| ρ | density, g/L |
| M | molecular mass, g/moL |
| kB | Boltzmann constant, J/K |
| T | absolute reservoir temperature, K |
| μ | dynamic viscosity of acid composition, Pa∙s |
| r | diffusing particle radius, m |
| S1 | skin factor before HAT |
| Q1 | well oil flow rate before HAT, m3/day |
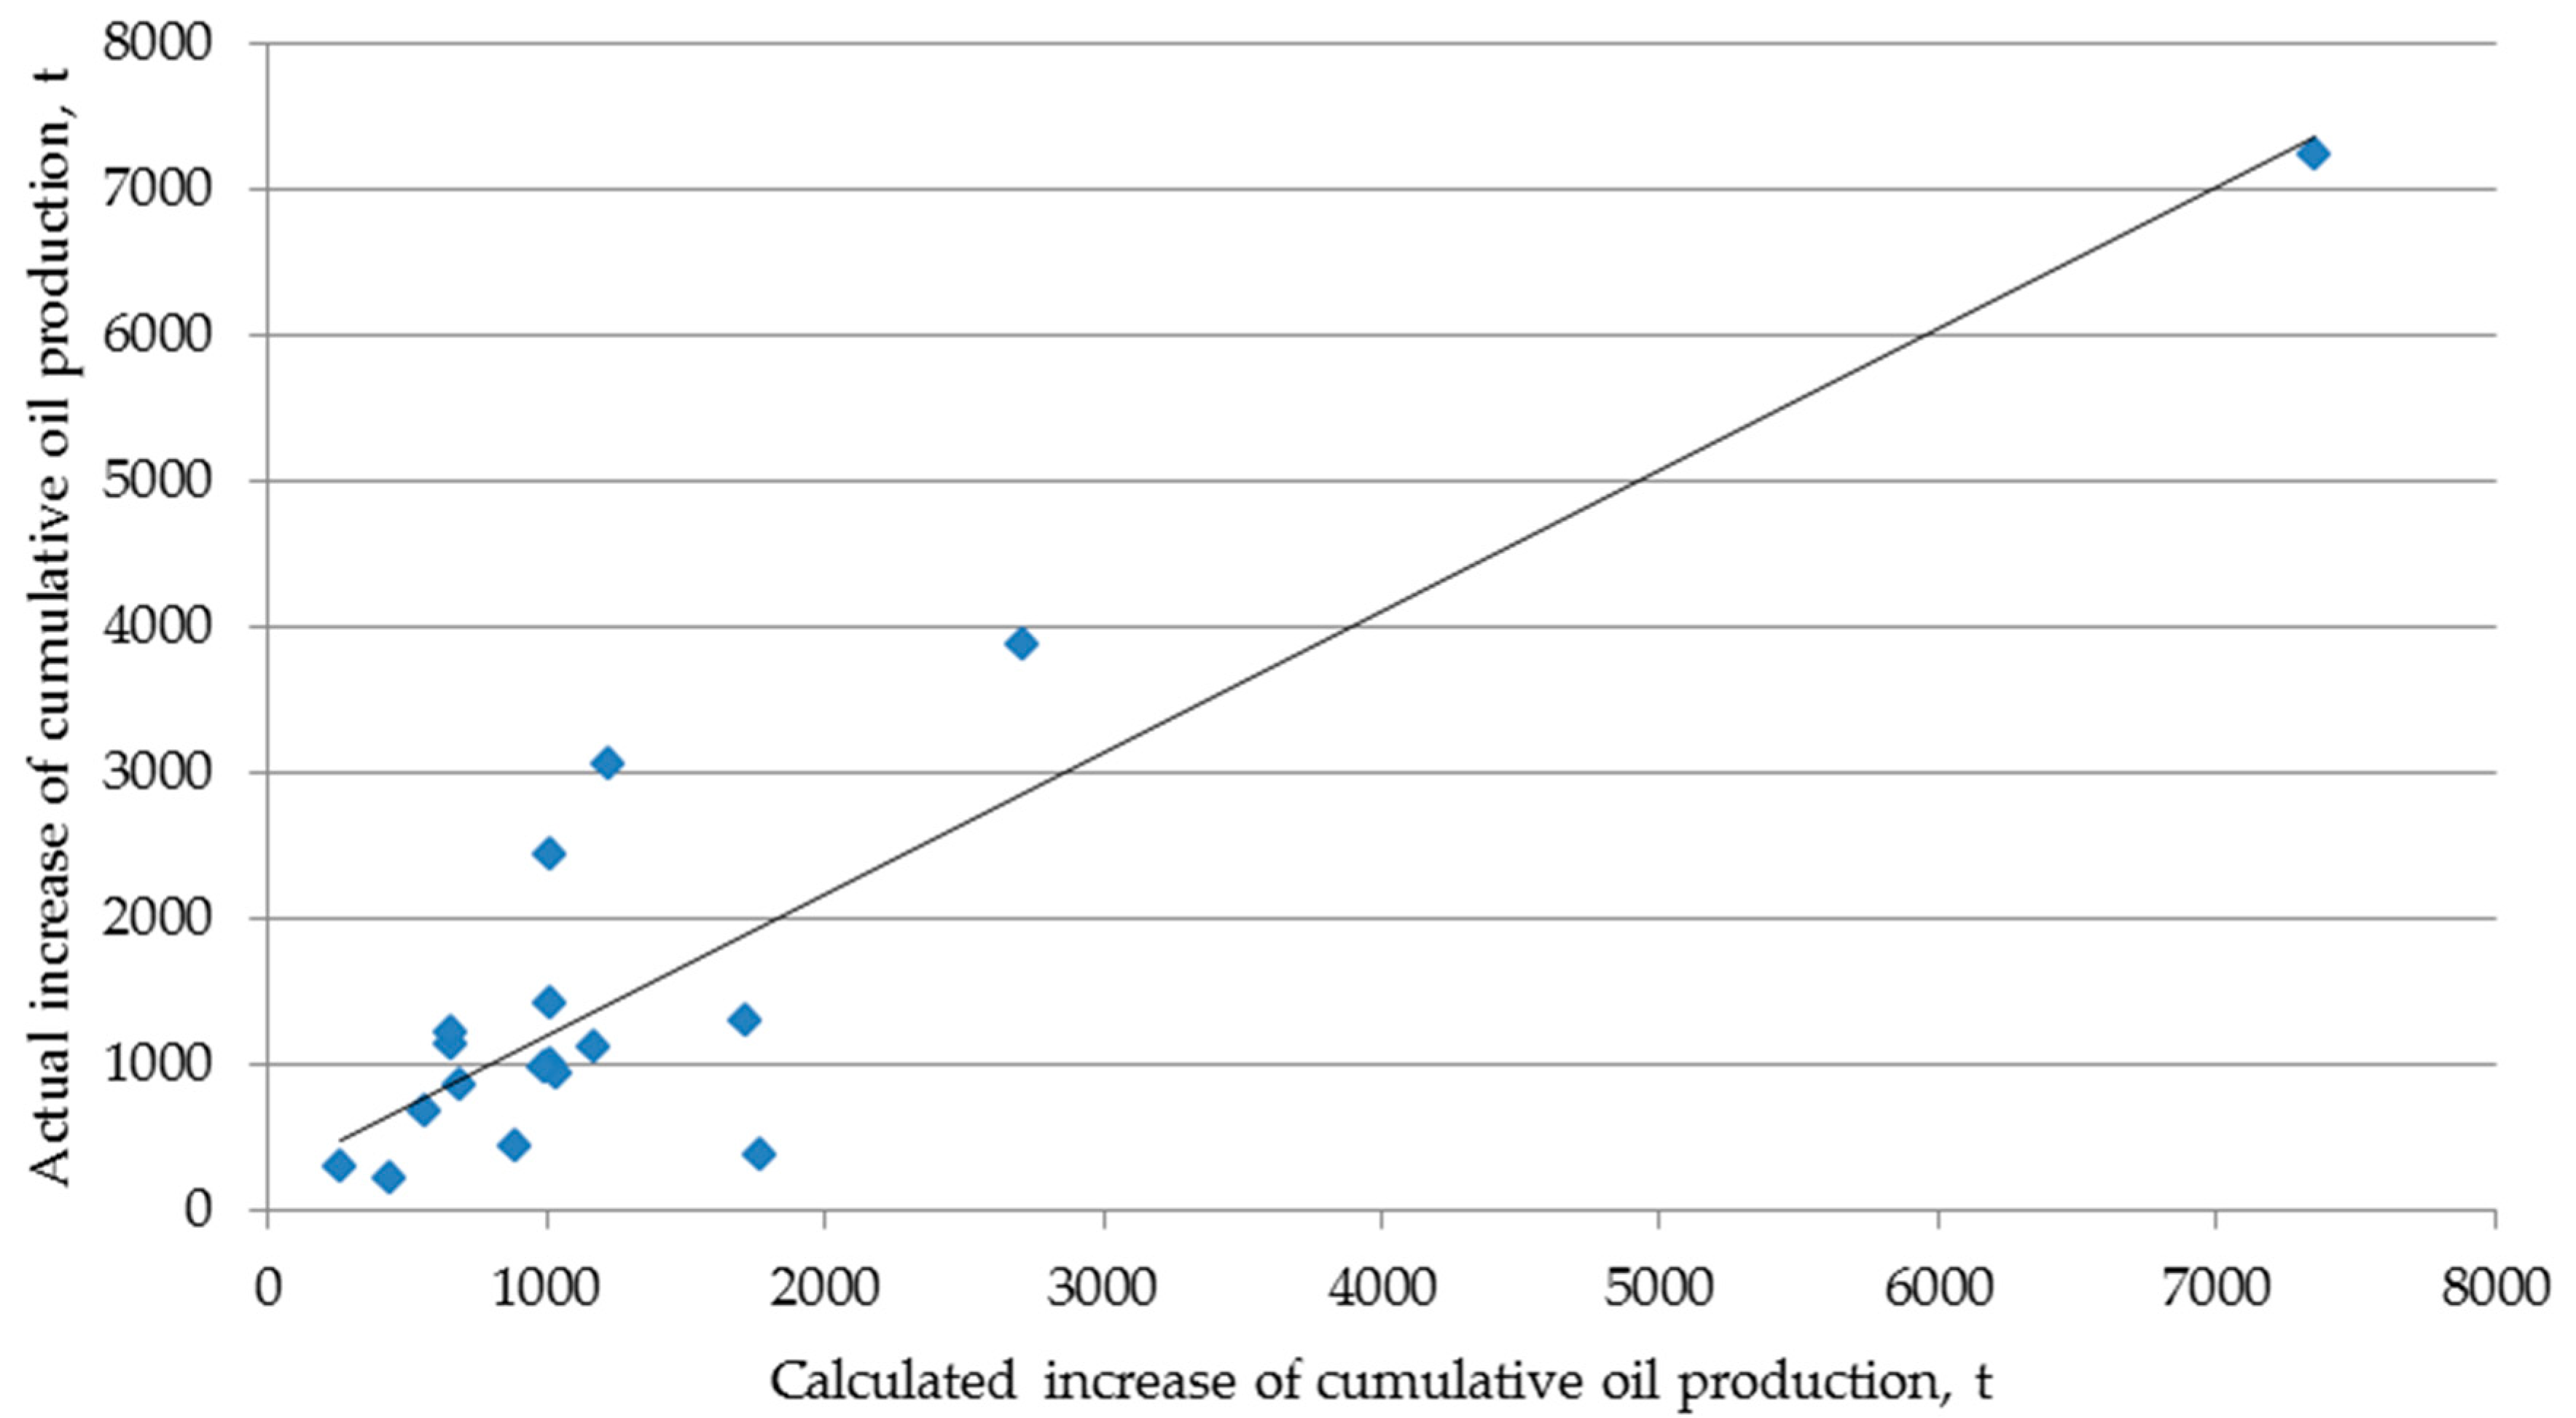
| ∆Qcum | increase in cumulative oil production, t |
References
- Khizhnyak, G.P.; Amirov, A.M.; Gladkikh, E.A.; Kolesov, V.A.; Zakharyan, A.G.; Chikin, A.E.; Harris, R. Study of Acid-Generating Composition Impact on Core Samples of Productive Sediments of Kuyumbinsky License Block. Oil Ind. 2015, 3, 31–35. [Google Scholar]
- Aidagulov, G.; Gwaba, D.; Kayumov, R.; Sultan, A.; Aly, M.; Qiu, X.; Almajed, H.; Abbad, M. Effects of Pre-Existing Fractures on Carbonate Matrix Stimulation Studied by Large-Scale Radial Acidizing Experiments. In Proceedings of the SPE Middle East Oil and Gas Show and Conference, Manama, Bahrain, 18–21 March 2019. [Google Scholar]
- Moid, F.; Rodoplu, R.; Nutaifi, A.M.; Kayumov, R. Acid Stimulation Improvement with the Use of New Particulate Base Diverter to Improve Zonal Coverage in HPHT Carbonate Reservoirs. In Proceedings of the International Petroleum Technology Conference, Dhahran, Saudi Arabia, 13–15 January 2020. [Google Scholar]
- Ridner, D.; Frick, T.; Zhu, D.; Hill, A.D.; Angeles, R.; Vishnumolakala, N.; Shuchart, C.E. Influence of Transport Conditions on Optimal Injection Rate for Acid Jetting in Carbonate Reservoirs. SPE Prod. Oper. 2019, 35, 137–146. [Google Scholar]
- Sarmah, A.; Farid Ibrahim, A.; Nasr-El-Din, H.A.; Jackson, J. A Novel Cationic Polymer System That Improves Acid Diversion in Heterogeneous Carbonate Reservoirs. In Proceedings of the SPE Oil and Gas India Conference and Exhibition, Mumbai, India, 9–11 April 2019. [Google Scholar]
- Singh, R.; Tong, S.; Panthi, K.; Mohanty, K. Stimulation of Calcite-Rich Shales Using Nanoparticle-Microencapsulated Acids. SPE J. 2019, 24, 2671–2680. [Google Scholar] [CrossRef]
- Hawkins, M.F. A note on the skin effect. J. Pet. Technol. 1956, 8, 65–66. [Google Scholar] [CrossRef]
- Ali, M.T.; Ezzat, A.A.; Nasr-El-Din, H.A. A Model to Simulate Matrix-Acid Stimulation for Wells in Dolomite Reservoirs with Vugs and Natural Fractures. SPE J. 2019, 25. [Google Scholar] [CrossRef]
- Abdrazakov, D.; Ziauddin, M.; Vernigora, D.; Beletskaya, A.; Yakimchuk, I.; Olennikova, O.; Usoltsev, D.; Nikolaev, M.; Panga, M.; Burlibayev, A. Integration of Latest Laboratory, Software and Retarded Acid Technologies to Increase Efficiency of Acid Treatments in Carbonates: Case Studies from Central Asia. In Proceedings of the International Petroleum Technology Conference, Beijing, China, 26–28 March 2019. [Google Scholar]
- Hall-Thompson, B.; Ernesto, A.R.; Abdulrahman, N.; Alsuhaimi, A. Acid Stimulation-Best Practices for Design, Selection and Testing of Acid Recipes in Low Permeability Carbonate Reservoirs. In Proceedings of the International Petroleum Technology Conference, Dhahran, Saudi Arabia, 13–15 January 2020. [Google Scholar]
- Gurbatova, I.P.; Plotnikov, V.V.; Popov, N.A.; Sysoev, I.V. Specifics of Study of Flow Properties of Oriented Core of Structurally Complex Carbonate Reservoirs. Bull. Perm Natl. Res. Polytech. Univ. Geol. Oil Gas Min. 2013, 9, 79–86. [Google Scholar]
- Farooq, U.; Ahmed, J.; Ali, S.; Siddiqi, F.; Kazmi, S.A.A.; Mushir, K. Heterogeneity in the Petrophysical Properties of Carbonate Reservoirs in Tal Block. In Proceedings of the SPWLA 60th Annual Logging Symposium, The Woodlands, TX, USA, 15–19 June 2019. [Google Scholar]
- Kanevskaya, R.D.; Novikov, A.V. Methods of Wormhole Simulation under Hydrochloric Acid Treatment of Carbonate Reservoirs. Oilfield Eng. 2018, 3, 19–28. [Google Scholar] [CrossRef]
- Trushin, Y.; Aleshchenko, A.; Danilin, K.; Folomeev, A.; Haydar, A.; Gorin, A.; Sharifullin, A. Complex Approach to the Design of Acid Treatment of Carbonate Reservoirs. In Proceedings of the SPE Russian Petroleum Technology Conference, Moscow, Russia, 22–24 October 2019. [Google Scholar]
- Khuzin, R.; Shevko, N.; Melnikov, S. Improving Well Stimulation Technology Based on Acid Stimulation Modeling, Lab and Field Data Integration. In Proceedings of the SPE Russian Petroleum Technology Conference, Moscow, Russia, 22–24 October 2019. [Google Scholar]
- Buijse, M.A.; Glasbergen, G. A semi-empirical model to calculate wormhole growth in carbonate acidizing. In Proceedings of the SPE Annual Technical Conference and Exhibition, Dallas, Texas, 9–12 October 2005. [Google Scholar]
- Daccord, G.; Touboul, E.; Lenormand, R. Carbonate acidizing: Toward a quantitative model of the wormholing phenomenon. SPE Prod. Eng. 1989, 4, 63–68. [Google Scholar] [CrossRef]
- Chordia, M.; Trivedi, J.J. Diffusion in naturally fractured reservoirs-a-review. In Proceedings of the Asia Pacific Oil and Gas Conference and Exhibition, Brisbane, Australia, 18–20 October 2010. [Google Scholar]
- Ravelev, K.A. Comparative Analysis of Effectiveness of Acid Compositions Application for Hydrochloric Acid Treatment of Bottomhole Zone of a Carbonate Reservoir. Probl. Hydrocarb. Ore Mineral. Depos. Dev. 2019, 1, 194–196. [Google Scholar]
- Iolchuev, A.M.; Savenyuk, O.V. Analysis of the Scale Control Method by Intermittent Injection of a Scale Inhibitor into Bottomhole Zone. Sci. Eng. Technol. (Polytech. Bull.) 2018, 4, 53–71. [Google Scholar]
- Mishchenko, I.T. Borehole Oil Production. In Oil Gas Moscow; FGUP: Moscow, Russia, 2003. [Google Scholar]
- Musabirov, M.K.; Dmitrieva, A.Y.; Khusainov, R.F.; Abusalimov, E.M.; Ganiev, B.G.; Ismagilov, F.Z. Increasing the Effectiveness of Foam Acid and Large-Volume Selective Treatment in the Carbonate Fields of Pao Tatneft. Oil Ind. 2019, 11, 116–119. [Google Scholar]


| Job No. | Deposit | Formation | Skin Factor Actual Change | Skin Factor Predicted Change | Deviation, % |
|---|---|---|---|---|---|
| 1 | Ozyornoye | Bashkirian-Serpukhovian | −3.40 | −3.27 | 3.82 |
| 2 | Unvinskoye | Bashkirian-Serpukhovian | −2.80 | −2.90 | 3.57 |
| 3 | Zmeyevskoye | Tournaisian | −3.20 | −2.94 | 8.13 |
| 4 | Yurchukskoye | Famennian | −2.50 | −2.74 | 9.60 |
| 5 | Yurchukskoye | Bashkirian | −2.70 | −2.53 | 6.30 |
| 6 | Logovskoye | Tournaisian-Famennian | −2.60 | −2.84 | 9.23 |
| 7 | Pavlovskoye | Tournaisian | −2.40 | −2.57 | 7.08 |
| 8 | Shagirtsko-Gozhanskoye | Vereiskian (V3V4) | −2.90 | −2.71 | 6.55 |
| 9 | Dorokhovskoye | Tournaisian | −2.80 | −2.83 | 1.07 |
| 10 | Pavlovskoye | Tournaisian | −3.00 | −2.96 | 1.33 |
| 11 | Sibirskoye | Bashkirian-Serpukhovian | −2.90 | −2.70 | 6.90 |
| 12 | Churakovskoye | Tournaisian | −2.80 | −2.58 | 7.86 |
| 13 | Rassvetnoye | Bashkirian | −3.10 | −3.26 | 5.16 |
| 14 | Rassvetnoye | Bashkirian | −2.50 | −2.79 | 11.60 |
| 15 | Kurbatovskoye | Tournaisian | −2.60 | −2.77 | 6.54 |
| 16 | Yurchukskoye | Bashkirian-Serpukhovian | −2.80 | −2.68 | 4.29 |
| 17 | Yurchukskoye | Bashkirian-Serpukhovian | −2.90 | −2.64 | 8.97 |
| 18 | Chikulayevskoye | Tournaisian | −2.70 | −2.85 | 5.56 |
| Prepared Mixture | Composition of Interacting Products | |
|---|---|---|
| Water—25% Oil—25% AC—50% | 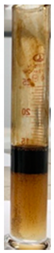 | 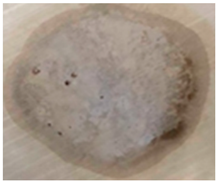 |
| Water—33.3% Oil—33.33% AC—33.34% |  |  |
| Water—0% Oil—50% AC—50% | 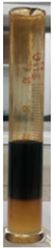 | 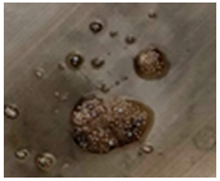 |
| Speed | Plunger Diameter, mm | |||
|---|---|---|---|---|
| 100 | 120 | |||
| Pumping Rate, L/s | Pressure, MPa | Pumping Rate, L/s | Pressure, MPa | |
| II | 2.24 | 50.0 | 3.23 | 34.4 |
| III | 4.28 | 25.9 | 6.16 | 18.0 |
| IV | 6.50 | 17.1 | 9.36 | 11.8 |
| V | 9.78 | 11.3 | 14.08 | 1.9 |
| Date | Oil Flow Rate, m3/day | Deviations in Oil Flow Rate, % | Liquid Flow Rate, m3/day | Deviations in Liquid Flow Rate, % | ||
|---|---|---|---|---|---|---|
| Actual | Design | Actual | Design | |||
| June 2019 | 1.7236 | 1.7236 | - | 3.2110 | 3.2110 | - |
| July 2019 | 7.4143 | 7.0612 | 4.76 | 20.9546 | 19.9949 | 4.58 |
| August 2019 | 7.2705 | 6.9148 | 4.89 | 20.9147 | 19.8235 | 5.22 |
| September 2019 | 7.2128 | 6.7741 | 6.08 | 20.8075 | 19.6605 | 5.51 |
| October 2019 | 6.9606 | 6.6387 | 4.63 | 20.5710 | 19.5057 | 5.18 |
| November. 2019 | 6.9340 | 6.5086 | 6.14 | 20.6366 | 19.3587 | 6.19 |
| December. 2019 | 6.7527 | 6.3835 | 5.47 | 20.0301 | 19.2191 | 4.05 |
| Date | Oil flow Rate, m3/day | Cumulative Oil Production, Thous. m3 | Liquid Flow Rate, m3/day | Cumulative Liquid Production, Thous. m3 | ||||
|---|---|---|---|---|---|---|---|---|
| Basic | Design | Basic | Design | Basic | Design | Basic | Design | |
| January2019 | 1.7891 | 1.7891 | 49.4261 | 49.4261 | 3.2110 | 3.2110 | 59.9109 | 59.9109 |
| January2020 | 1.6641 | 6.2640 | 50.0560 | 50.9784 | 3.2110 | 19.0929 | 61.0861 | 64.1740 |
| January2021 | 1.5575 | 5.1407 | 50.6417 | 53.0355 | 3.2110 | 17.9362 | 62.2581 | 70.8852 |
| January2022 | 1.4647 | 4.4581 | 51.1918 | 54.7637 | 3.2110 | 17.4499 | 63.4301 | 77.3300 |
| January2023 | 1.3641 | 4.0507 | 51.7069 | 56.3068 | 3.2110 | 17.2217 | 64.6021 | 83.6478 |
| January2024 | 1.2422 | 3.7704 | 52.1820 | 57.7304 | 3.2110 | 17.1556 | 65.7774 | 89.9339 |
| January2025 | 1.1376 | 3.5840 | 52.6136 | 59.0676 | 3.2110 | 17.2215 | 66.9494 | 96.2056 |
| January2026 | 1.0562 | 3.4548 | 53.0123 | 60.3496 | 3.2110 | 17.3781 | 68.1214 | 102.5209 |
| January2027 | 0.9885 | 3.3365 | 53.3841 | 61.5867 | 3.2110 | 17.5682 | 69.2934 | 108.9009 |
| January2028 | 0.9305 | 3.2241 | 53.7340 | 62.7857 | 3.2110 | 17.7579 | 70.4686 | 115.3689 |
| January2029 | 0.8836 | 3.1110 | 54.0639 | 63.9400 | 3.2110 | 17.9399 | 71.6407 | 121.8859 |
© 2020 by the authors. Licensee MDPI, Basel, Switzerland. This article is an open access article distributed under the terms and conditions of the Creative Commons Attribution (CC BY) license (http://creativecommons.org/licenses/by/4.0/).
Share and Cite
Putilov, I.; Krivoshchekov, S.; Vyatkin, K.; Kochnev, A.; Ravelev, K. Methods of Predicting the Effectiveness of Hydrochloric Acid Treatment Using Hydrodynamic Simulation. Appl. Sci. 2020, 10, 4828. https://doi.org/10.3390/app10144828
Putilov I, Krivoshchekov S, Vyatkin K, Kochnev A, Ravelev K. Methods of Predicting the Effectiveness of Hydrochloric Acid Treatment Using Hydrodynamic Simulation. Applied Sciences. 2020; 10(14):4828. https://doi.org/10.3390/app10144828
Chicago/Turabian StylePutilov, Ivan, Sergey Krivoshchekov, Kirill Vyatkin, Aleksandr Kochnev, and Kirill Ravelev. 2020. "Methods of Predicting the Effectiveness of Hydrochloric Acid Treatment Using Hydrodynamic Simulation" Applied Sciences 10, no. 14: 4828. https://doi.org/10.3390/app10144828
APA StylePutilov, I., Krivoshchekov, S., Vyatkin, K., Kochnev, A., & Ravelev, K. (2020). Methods of Predicting the Effectiveness of Hydrochloric Acid Treatment Using Hydrodynamic Simulation. Applied Sciences, 10(14), 4828. https://doi.org/10.3390/app10144828