Article

Modeling Photovoltaic Potential for Bus Shelters on a City-Scale: A Case Study in Lisbon

1
CICS.NOVA Interdisciplinary Centre of Social Sciences, Faculty of Social Sciences and Humanities (NOVA-FCSH), Universidade NOVA de Lisboa, 1069-061 Lisboa, Portugal
2
Instituto Dom Luiz (IDL), Faculdade de Ciências da Universidade de Lisboa, Campo Grande, 1600-276 Lisboa, Portugal
3
Centre for Geographical Studies, Institute of Geography and Spatial Planning, Universidade de Lisboa, 1600-276 Lisboa, Portugal
*
Author to whom correspondence should be addressed.
Appl. Sci. 2020, 10(14), 4801; https://doi.org/10.3390/app10144801
Submission received: 20 May 2020 / Revised: 9 July 2020 / Accepted: 10 July 2020 / Published: 13 July 2020
(This article belongs to the Special Issue Solar Applications in the Public Space)

Abstract

:
The 2030 Agenda for Sustainable Development set 17 Sustainable Development Goals (SDGs). These include ensuring access to affordable, reliable, sustainable and modern energy for all (SGD7) and making cities and human settlements inclusive, safe, resilient and sustainable (SGD11). Thus, across the globe, major cities are moving in the smart city direction, by, for example, incorporating photovoltaics (PV), electric buses and sensors to improve public transportation. We study the concept of integrated PV bus stop shelters for the city of Lisbon. We identified the suitable locations for these, with respect to solar exposure, by using a Geographic Information System (GIS) solar radiation map. Then, using proxies to describe tourist and commuter demand, we determined that 54% of all current city bus stop shelters have the potential to receive PV-based solutions. Promoting innovative solutions such as this one will support smart mobility and urban sustainability while increasing quality of life, the ultimate goal of the Smart Cities movement.

1. Introduction

Green policies aim to decarbonize the energy supply. Recognizing cities’ importance in mitigating future energy and CO2 emissions growth, the European Council has included in the 2030 climate and energy framework targets for increasing the use of renewable energies to at least 27% of energy consumption [1]. Additionally, and to assist cities and human settlements in achieving a better and more sustainable future, the United Nations’ 2030 Agenda for Sustainable Development defined 17 goals for the coming years. Among these, two Sustainable Development Goals (SDG) aim to promote energy efficiency through renewable sources and to support sustainable urbanization. These are SDG7—affordable and clean energy—and SDG11—sustainable cities and communities [2].
Solar technologies have evolved and are now commonly applied in the urban environment. Typical applications include electricity (photovoltaic—PV) and heat energy for residential use. However, other applications can also use PV technology. These include street lighting, charging stations for mobile devices or e-bikes, informative multimedia stands, carports, road signs and many others. In these PV-based urban applications, no external electrical power supply is needed, so there is no cabling or trenching required, thus keeping installation costs low and providing environmentally friendly energy with zero carbon emissions. It also means that there is minimal disturbance to paved surfaces in the city, making it possible to provide electricity in previously inaccessible areas or where the cost of providing grid-supply electricity is too high.

1.1. Photovoltaic-Based Urban Applications: Solar Bus Shelters

Bus shelters are public transport infrastructures that, through innovative solar-based applications, can deliver better services and contribute to increasing the citizens’ quality of life, the goal of the smart city model. Today, bus shelters are public places that are designed to afford some protection from the wind, rain or sun while waiting for the bus. However, their function as public places can also be extended to an all-new range of PV-based services such as Wi-Fi access, digital touch-screens (with breaking news, meteorology, timetables or real-time traffic information), recharging stations for mobile devices, digital signage, advertisement LCD monitors, security cameras and, for visually impaired people, tactile labels indicating the lines that stop at the shelter as well as voice announcement systems.
Improving lighting is also an opportunity, since good lighting allows travelers to feel safe when they arrive on a platform [3]. Most shelter lighting is connected to the electrical grid, usually the same grid that powers street lighting. Nevertheless, solar-powered lighting, generally provided by LEDs, can be installed on those shelters with adequate sunlight.
Several cities have already invested in solar bus shelters, offering lighting solutions, providing services to help the citizens and the tourists, or allowing for mobile charging while waiting for the next bus (Table 1).

1.2. State of the Art

Not all locations in the city are suitable for solar panels. Thus, decision-makers and planners must decide where to promote PV-based urban solutions using realistic scenarios based on local potential [10]. There is already a significant amount of literature addressing the solar potential of building rooftops and facades [11]. However, the estimation of the PV potential of non-conventional urban surfaces is a novel field of investigation. The authors in [12,13] analyzed the solar potential of streets for intelligent urban furniture and services that require powering. The proposed methodology could measure the solar energy exposure of a flat surface at any height above the street level within the unoccupied volume of an urban environment. The method was used by [14] to evaluate the viability of installing solar street lights. The results obtained for a Lisbon neighborhood showed that 50% of the existing street lights could be powered by solar panels.
The authors in [15] performed a feasibility analysis, using solar irradiation maps, to identify suitable areas in Turin, Italy, for the installation of PV modules on top of public transport shelters. The tested prototype, designed to offer a Wi-Fi connection, two USB chargers and an air pollution control system, could be implemented in 43% of the available locations, according to a minimum cover of the electrical load.
The authors in [16] suggested a GIS-based model for locating PV charging stations in Beijing, China. Several evaluation criteria for the location of PV charging stations were tested: natural (including solar radiation), economic, technical and social factors. The results show that social factors and future expandable potential are more significant when planning the PV layout.
In this work, we take one step forward by addressing the solar potential of common urban structures in the public space, considering other criteria rather than solely the solar potential. Using bus shelters as a case study, a framework is proposed to match the best solar production sites with the local energy demand. This is done by (1) evaluating the solar potential of all bus shelters within a city, according to geographical and technical criteria, and then (2) selecting the best locations for implementation according to social criteria (e.g., tourist and commuter use) as a proxy for local energy demand. This framework can be applied to any PV-based urban solution in the public space, from street lighting to charging stations for mobile devices or e-bikes, or to informative multimedia stands.
The remainder of the article is organized as follows. In the next section, Section 2, the study area, the materials and the methodology for assessing a city’s potential for PV-based urban applications are presented. Section 3 outlines how the methodology was tested in Lisbon, Portugal, and the results are discussed; the city’s potential for solar bus shelters is evaluated according to geographical, technical and social criteria and presented in a set of alternative planning scenarios. In the final part of the article, Section 4, conclusions are drawn based on the achievements and limitations of the proposed approach, and directions for future research are pointed out.

2. Materials and Methods

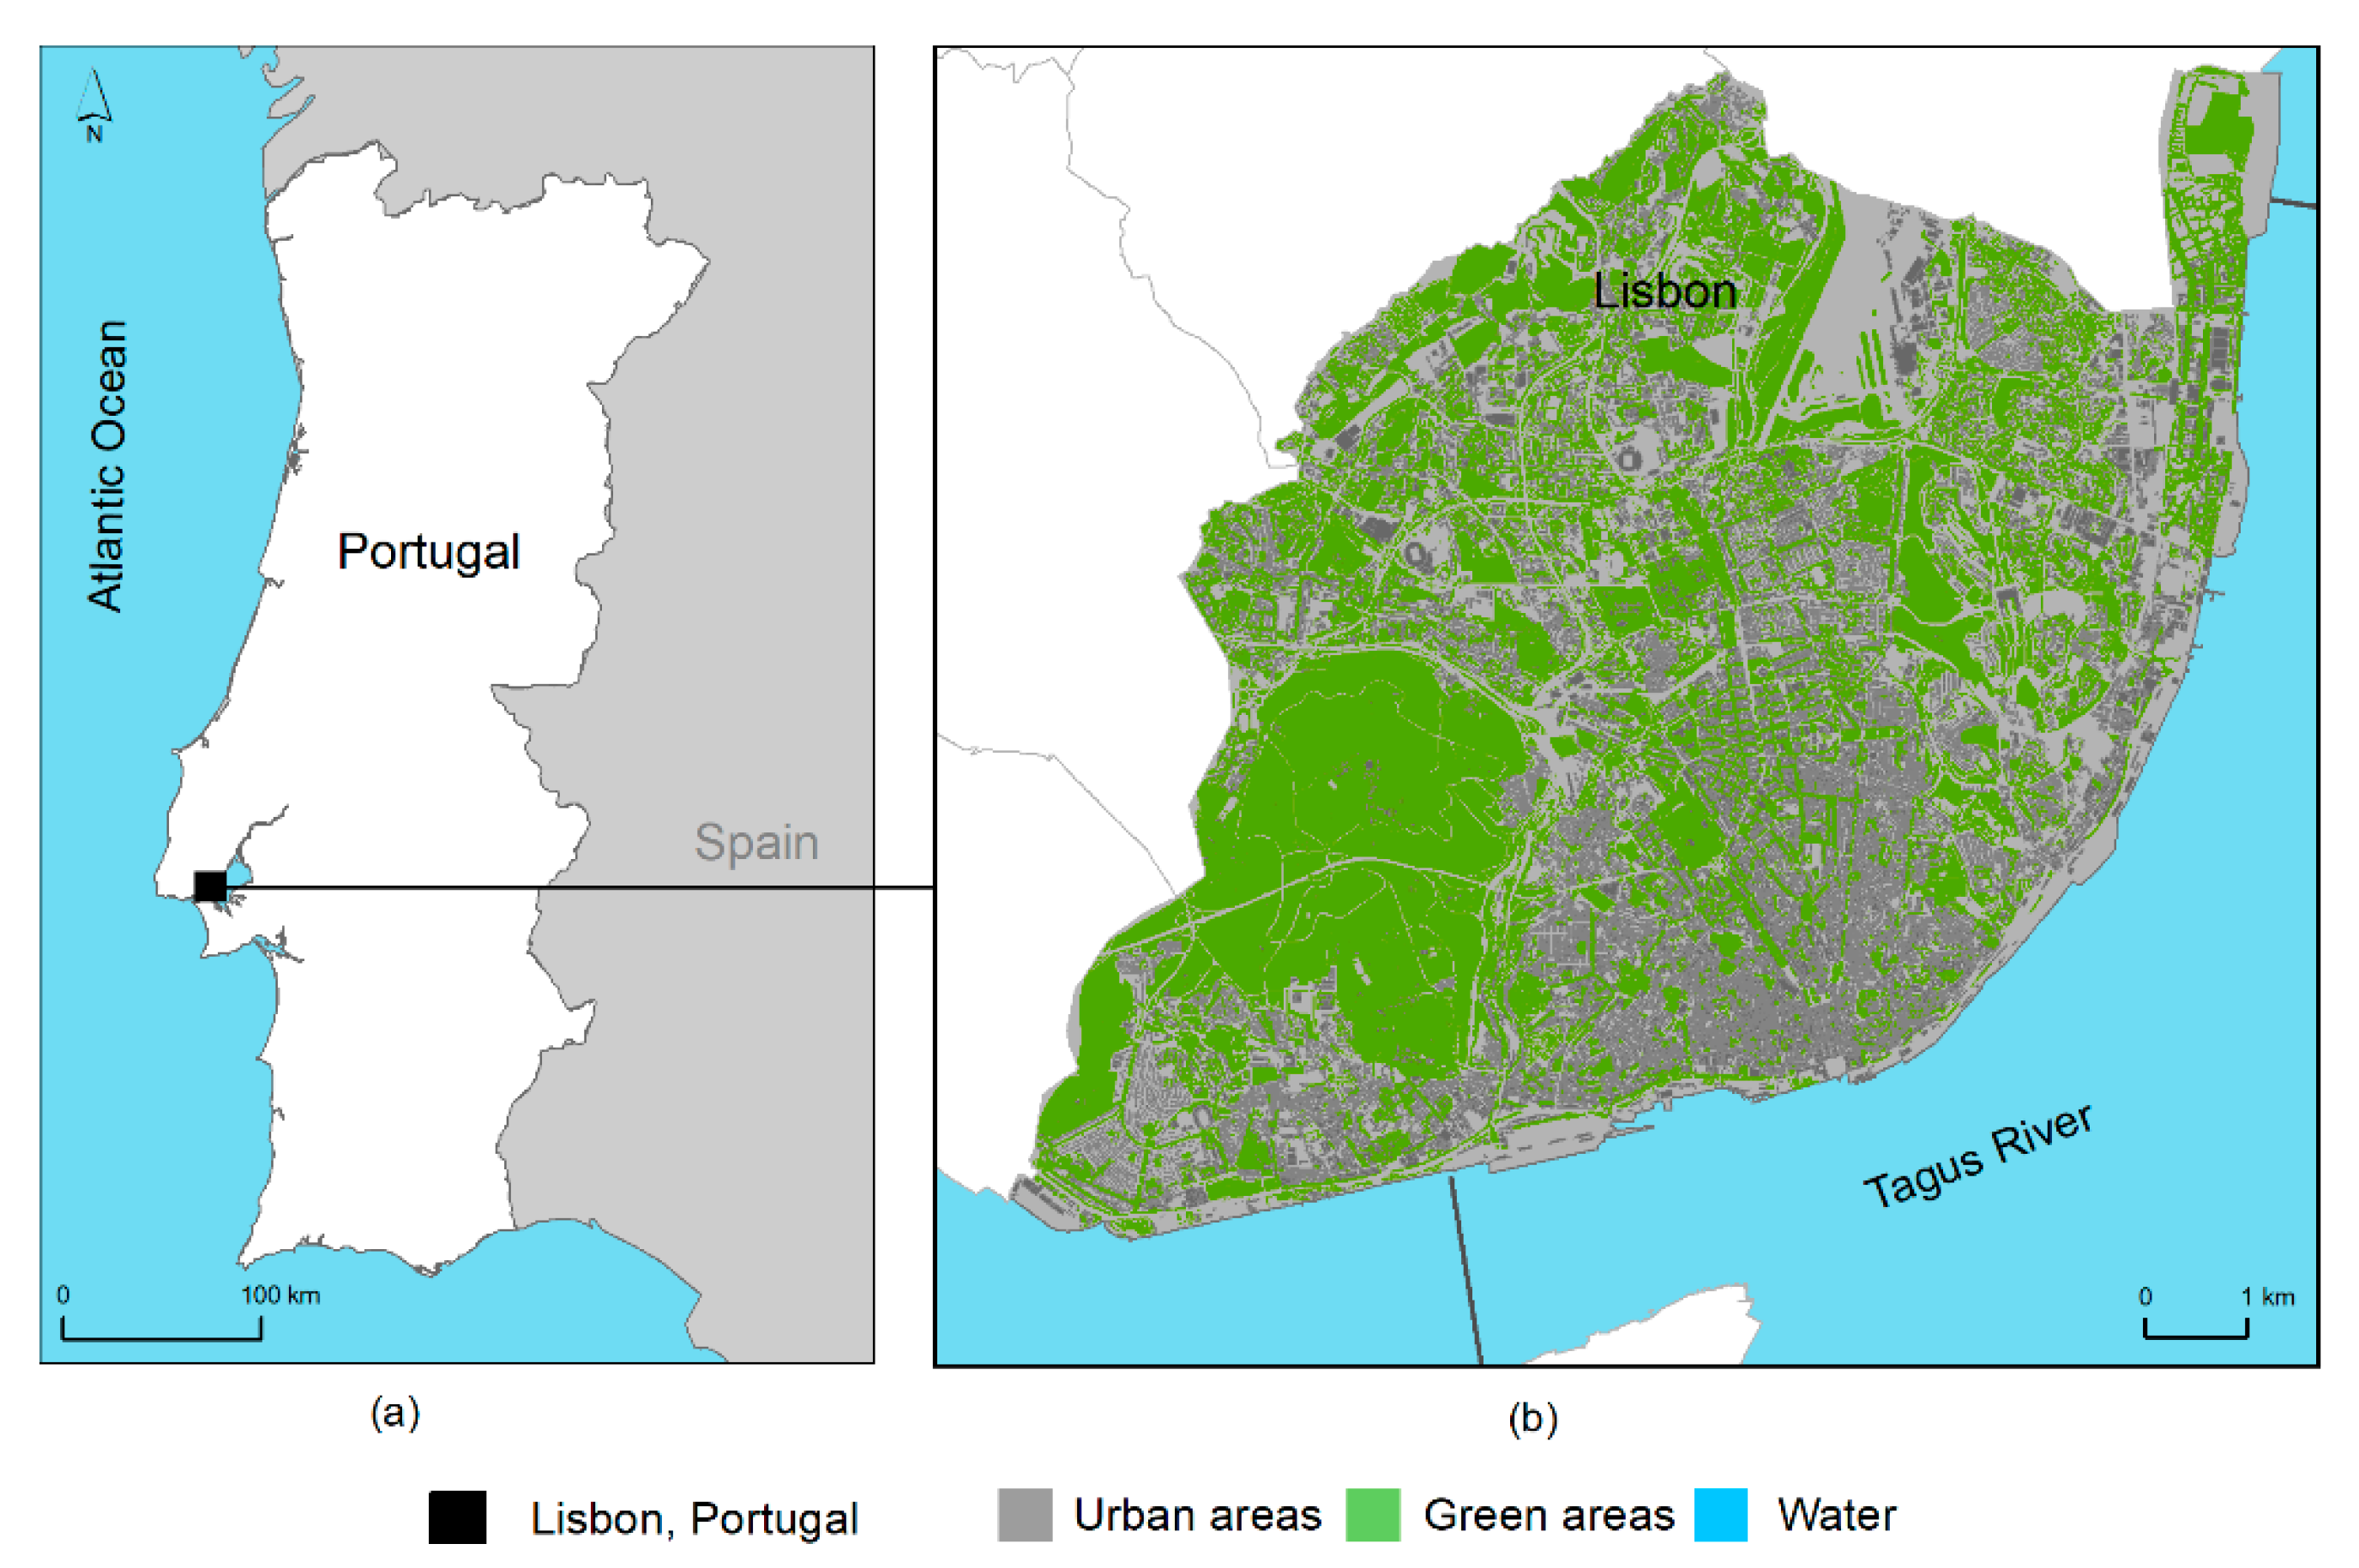
2.1. Study Area and Dataset

The methodology presented applies to any city. To demonstrate its implementation, Lisbon, capital of Portugal (Figure 1), was selected. Located on the Atlantic coast of Portugal, the city has an average of 8 h of sunshine per day, one of Europe’s capital cities with the highest solar insolation. Lisbon’s metropolitan area has 2.8 million inhabitants, 550,000 of whom inhabit the city (2011 national census). However, the number of city users almost doubles due to commuting movements.
The city is served by a wide public transportation network. The bus network in 2016 was composed of a fleet of 758 buses covering 88 routes and served 140.6 million passengers [17]. Daily bus services are used by residents, workers, students, city visitors and tourists. Nevertheless, and in line with other cities, the number of passengers has been declining. In 2009, a series of surveys were conducted by the bus service operator to identify some of the causes of the shift from public transport to private cars. One of the reasons pointed out was that the bus was perceived as being an outdated and old-fashioned form of transport. Based on these findings, several measures were implemented to improve its image, from renewing part of the fleet to offering free Wi-Fi internet on two routes.
For studying the PV potential of the bus shelters in Lisbon, three main data sources were used: (1) an ortho-photo (with a 50 cm spatial resolution) for characterizing the urban context; (2) a point shapefile with the locations of the 1880 bus stops (with and without shelters), available at the city hall; and 3) a Digital Surface Model (DSM) obtained from a Light Detection And Ranging (LiDAR) flight mission over Lisbon in 2006 to model the sun radiation available at each location in the city (Figure 2). From the original LiDAR point cloud (with a density of 1–2 points per m2), a surface image was produced based on the second return, with a 1 m resolution, representing the DSM of the city.
For studying the social demand for bus shelters, two types of users were selected: tourists and daily commuters. The users’ preferred locations were used as a proxy for local energy demand. These were obtained from a dataset including sightseeing bus tours collected from local tourist companies, and open geographic data from Lisbon City Council, including tourist attractions, schools, health care facilities and metro and train stations.

2.2. Bus Shelter Photovoltaic Potential

The assessment of the city’s potential for PV-based urban applications in the public space is based on a two-stage methodology. Firstly, a map of the solar resource is derived at the city level, and secondly, the best bus shelter locations for PV-based applications are identified (Figure 3). The results are then presented as spatial planning scenarios.

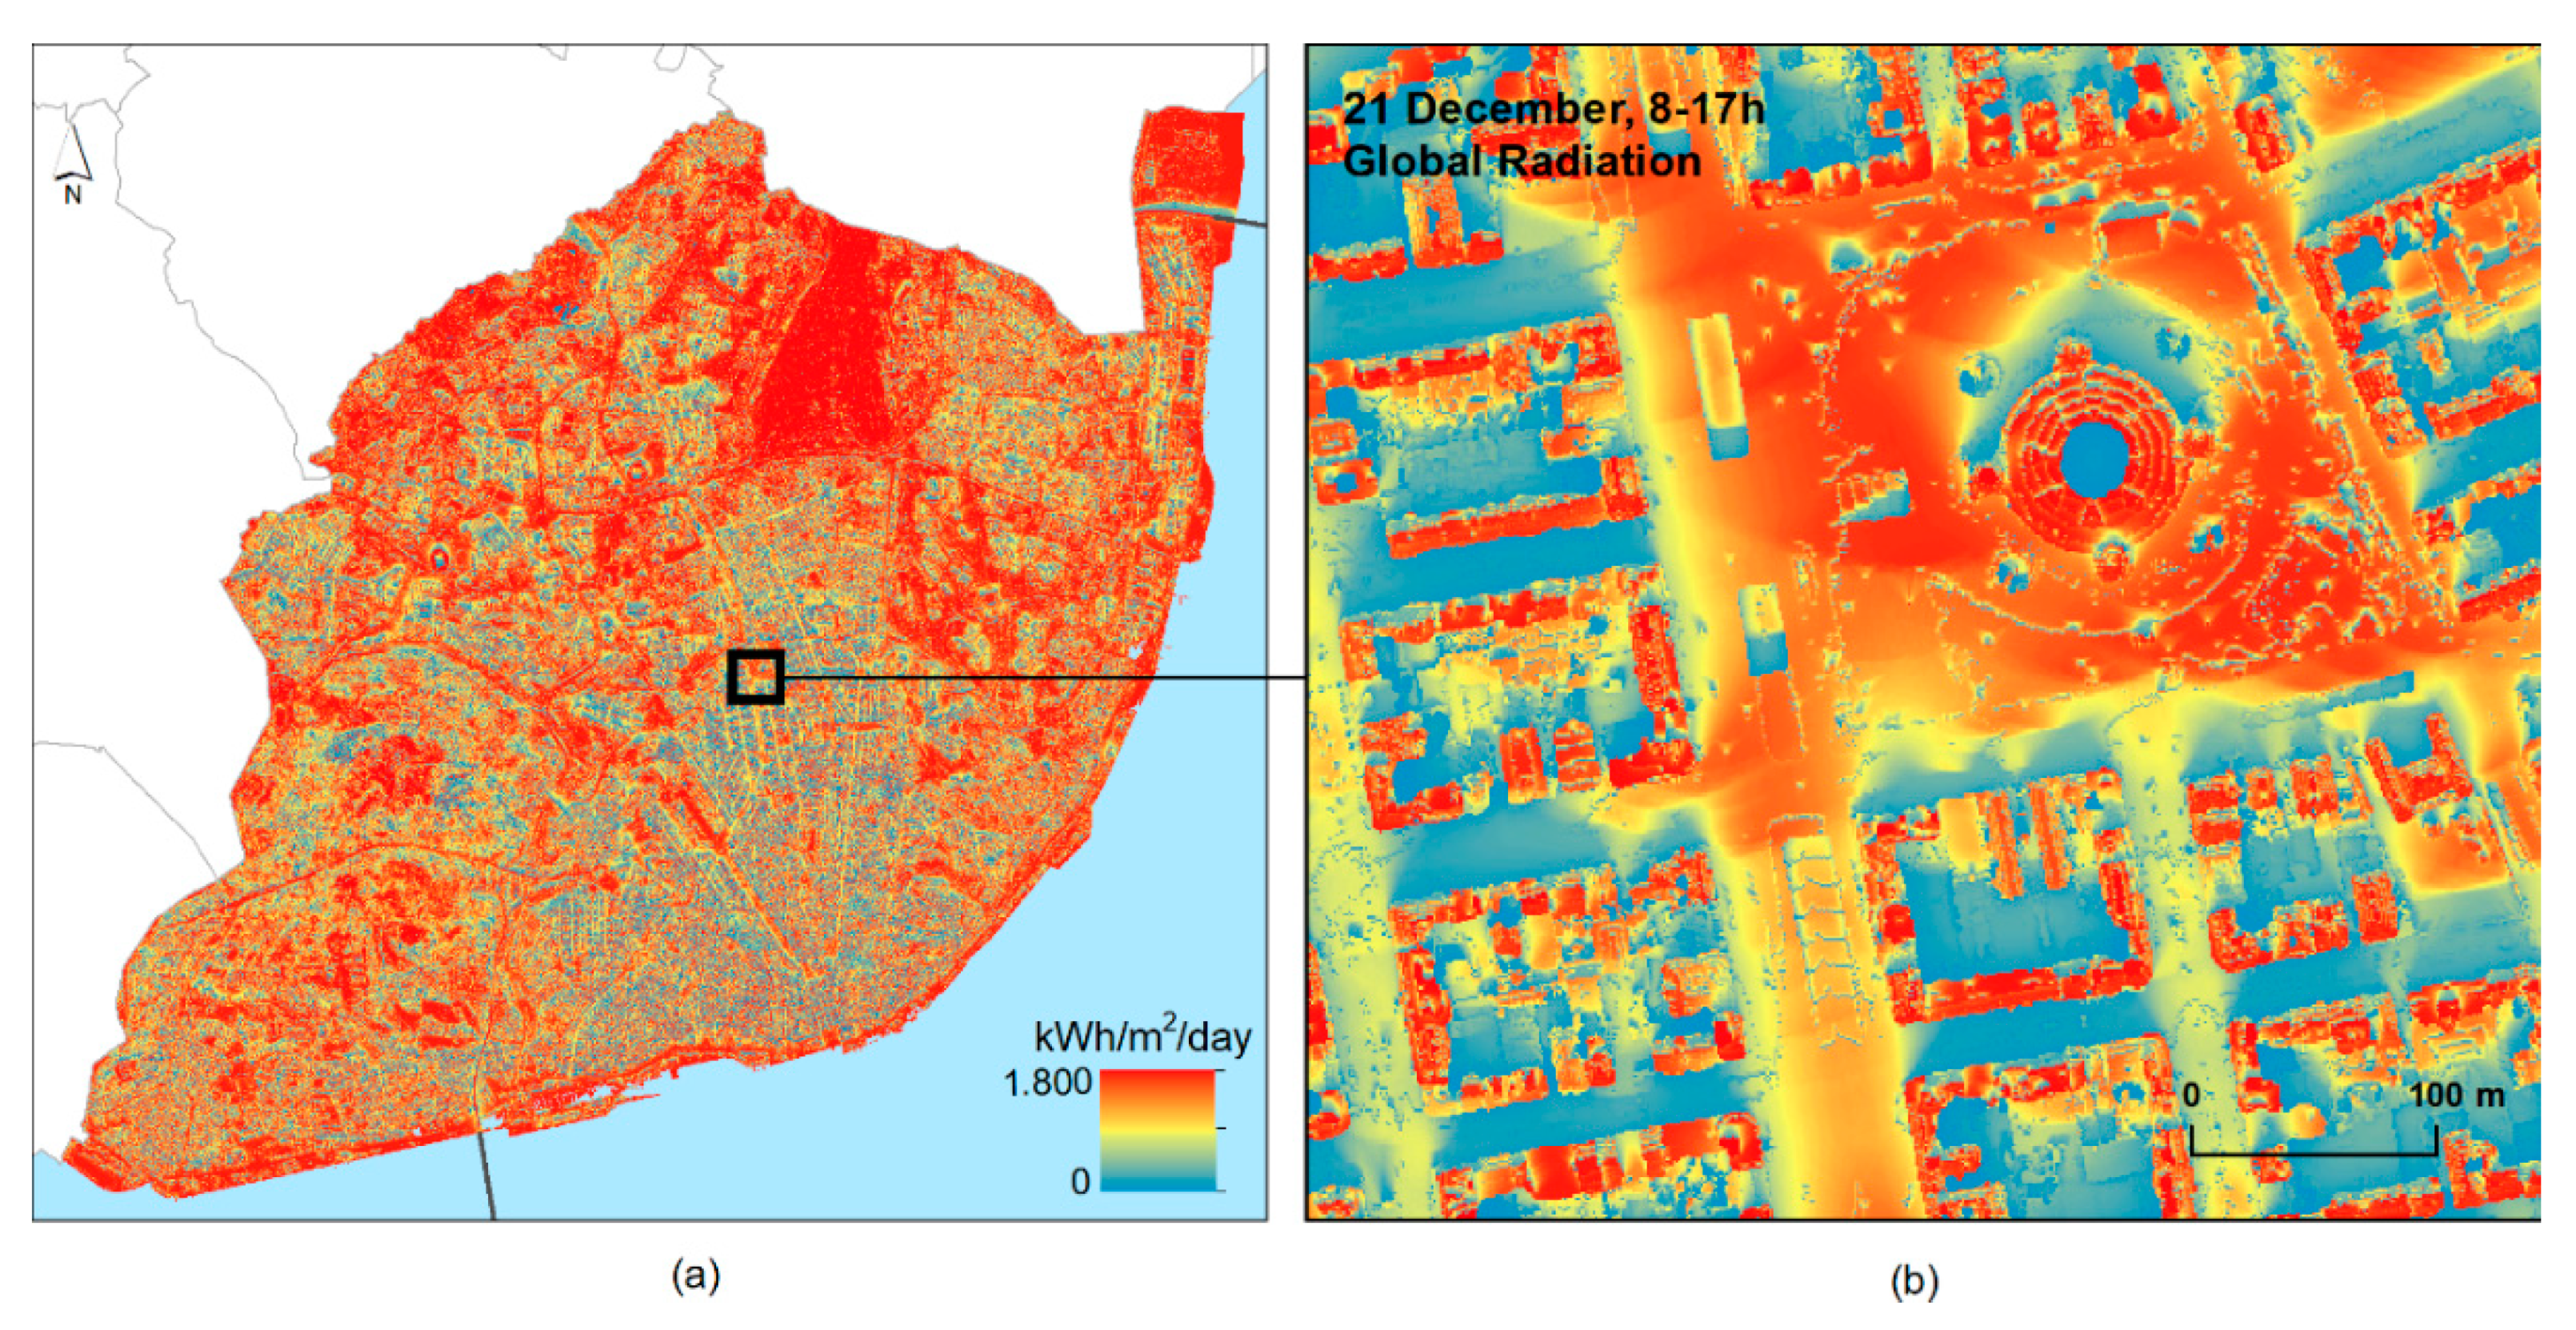
2.2.1. Assessing the City’s Solar Potential

The availability of solar radiation is affected by the time of the day and season, the atmospheric conditions, the latitude and the local topography. Several solar spatial databases are available for Europe, including Meteonorm (https://meteonorm.com/), S@tel-Light (http://www.satel-light.com/), NASA POWER (https://power.larc.nasa.gov/), SOLEMI (https://www.dlr.de/) and PVGIS (https://re.jrc.ec.europa.eu/). The data provided are intended for continental/national analysis. However, for regional and local scale analysis, while the periodicity of the measurement (i.e., time resolution) provides good accuracy (ranging from 30 min to hourly, daily and monthly averages), the spatial detail does not. For large spatial and temporal scales, computing radiation and accounting for obstructions to sunlight can only be performed using computational modeling of the physical context [18]. In these situations, solar availability is usually modeled in a Geographic Information System (GIS) environment [19], generally through a Digital Surface Model (DSM) derived from LiDAR data. The level of detail is essential in the urban analysis, since the incident solar radiation varies along the surface (1) due to the presence of buildings with distinct morphologies, (2) on an hourly basis and (3) on a seasonal basis due to sun-path movements. For a list of existing solar mapping tools, see [18]. In a state-of-the-art review performed by [18], 12 numerical models out of 21 were identified as suitable for urban spaces. From this set, ArcGIS Solar Analyst [20] and GRASS GIS r.sun [21] have been widely applied.
In this work, the solar radiation is modeled for the whole city surface, using ArcGIS’ Solar Analyst (Esri), following the work of [10,22]. This model requires as input the city’s DSM and local climatological parameters such as transmissivity and diffuse radiation fractions, compiled by [23,24].
The Area Solar Radiation Tool—available in Solar Analyst—calculates, for each location (pixel) on the surface, the direct radiation and the global radiation (direct and diffuse portions). In the present work, the worst solar scenario was investigated by selecting the 21st of December, the winter solstice. Then, by taking into account the site’s latitude and elevation, the local aspect, the shifts in the Sun’s angle and the shadows cast by surrounding features (like buildings or trees), the model produces a map of the solar irradiation (direct + diffuse fractions) at each location, for the shortest day of the year.
Although the project’s focus is the public space, in this initial task, all elements above ground must be considered, mainly buildings, since they affect the access to sunlight in the surrounding areas, a key factor when sizing PV systems.

2.2.2. Modeling the Solar Bus Shelters’ Photovoltaic Potential

After modeling the solar resource at the city’s surface, the next step is to identify the best bus shelters located in the public space (Figure 3):
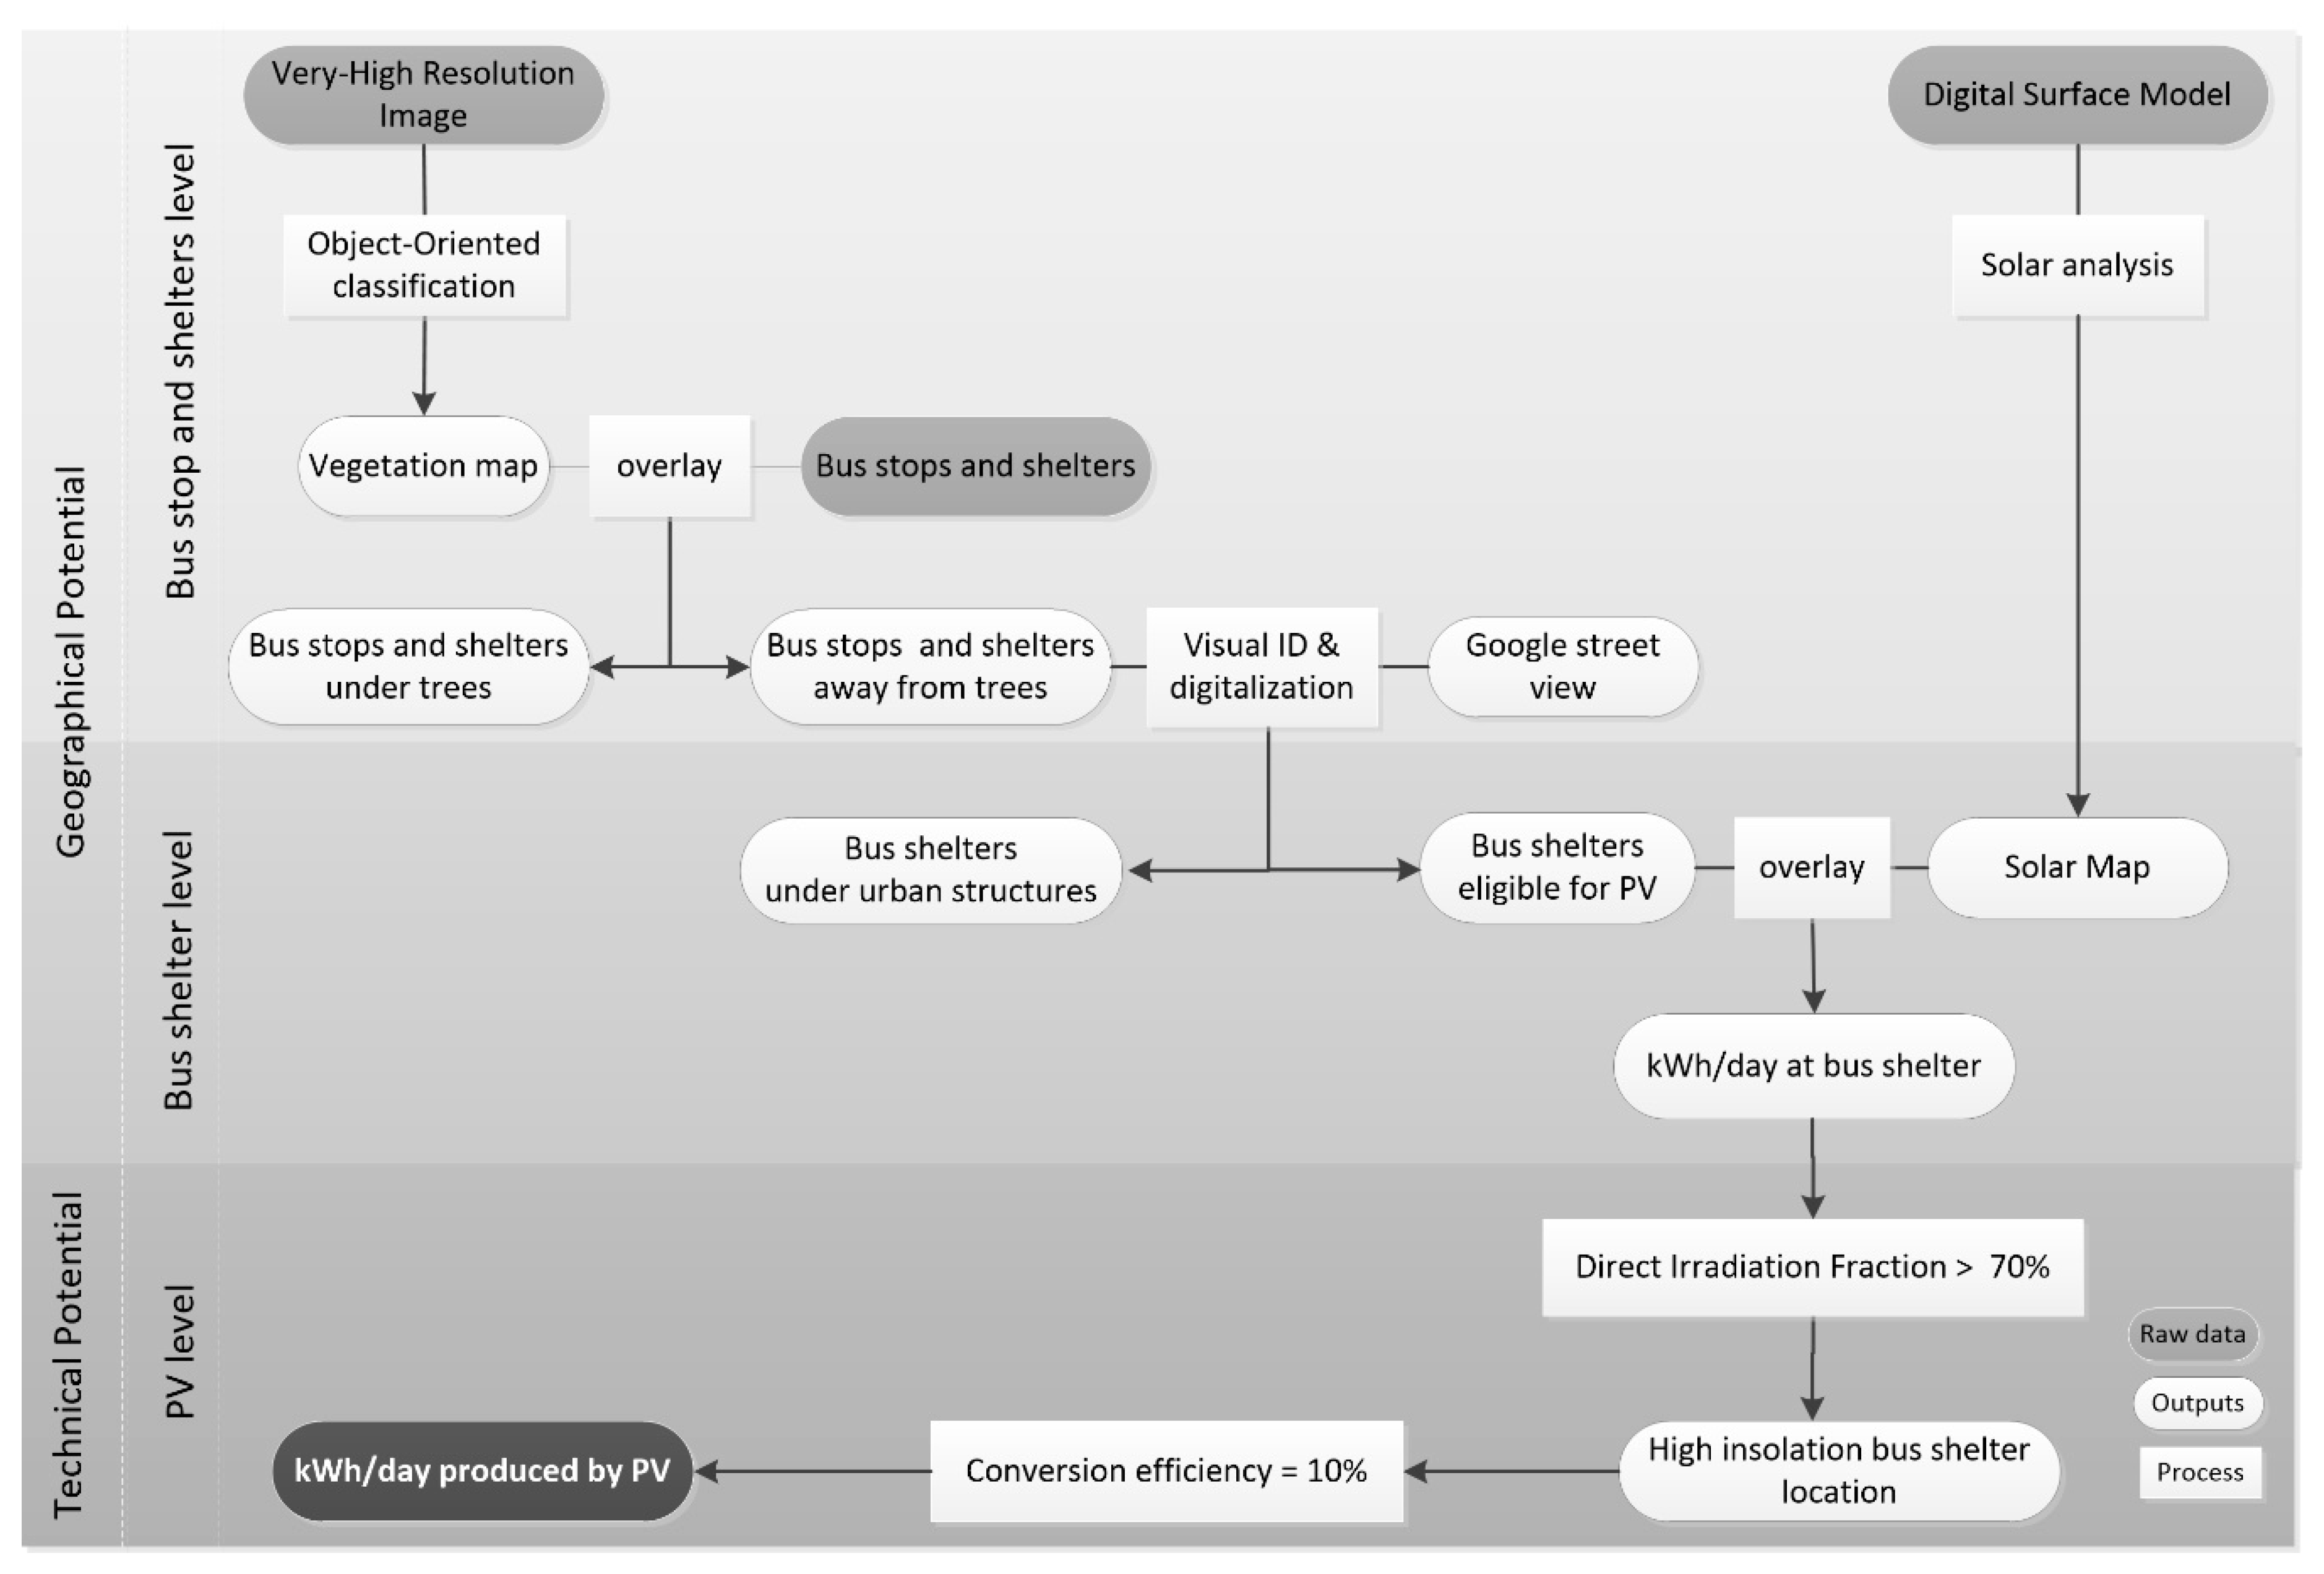
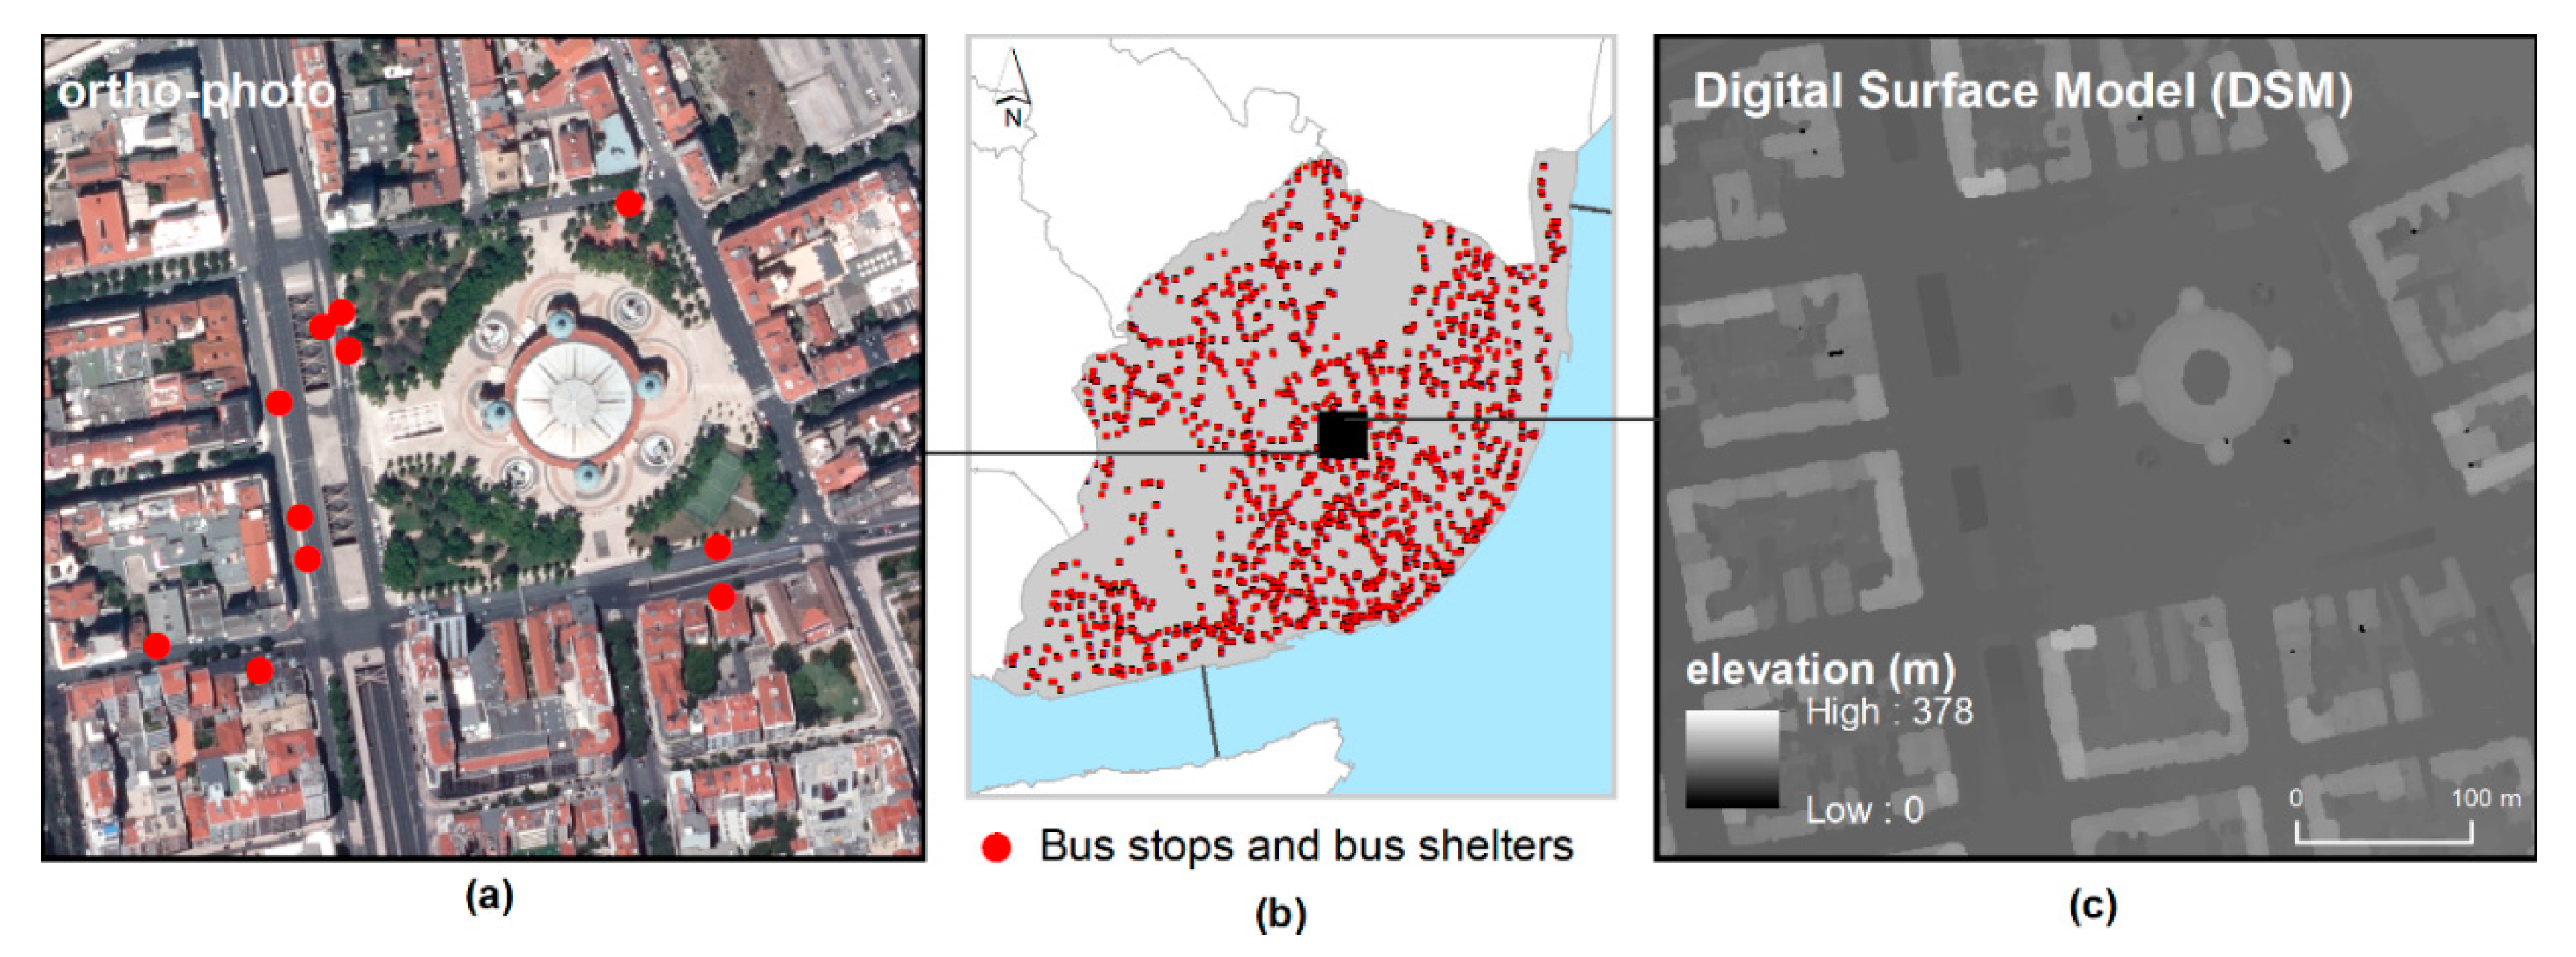
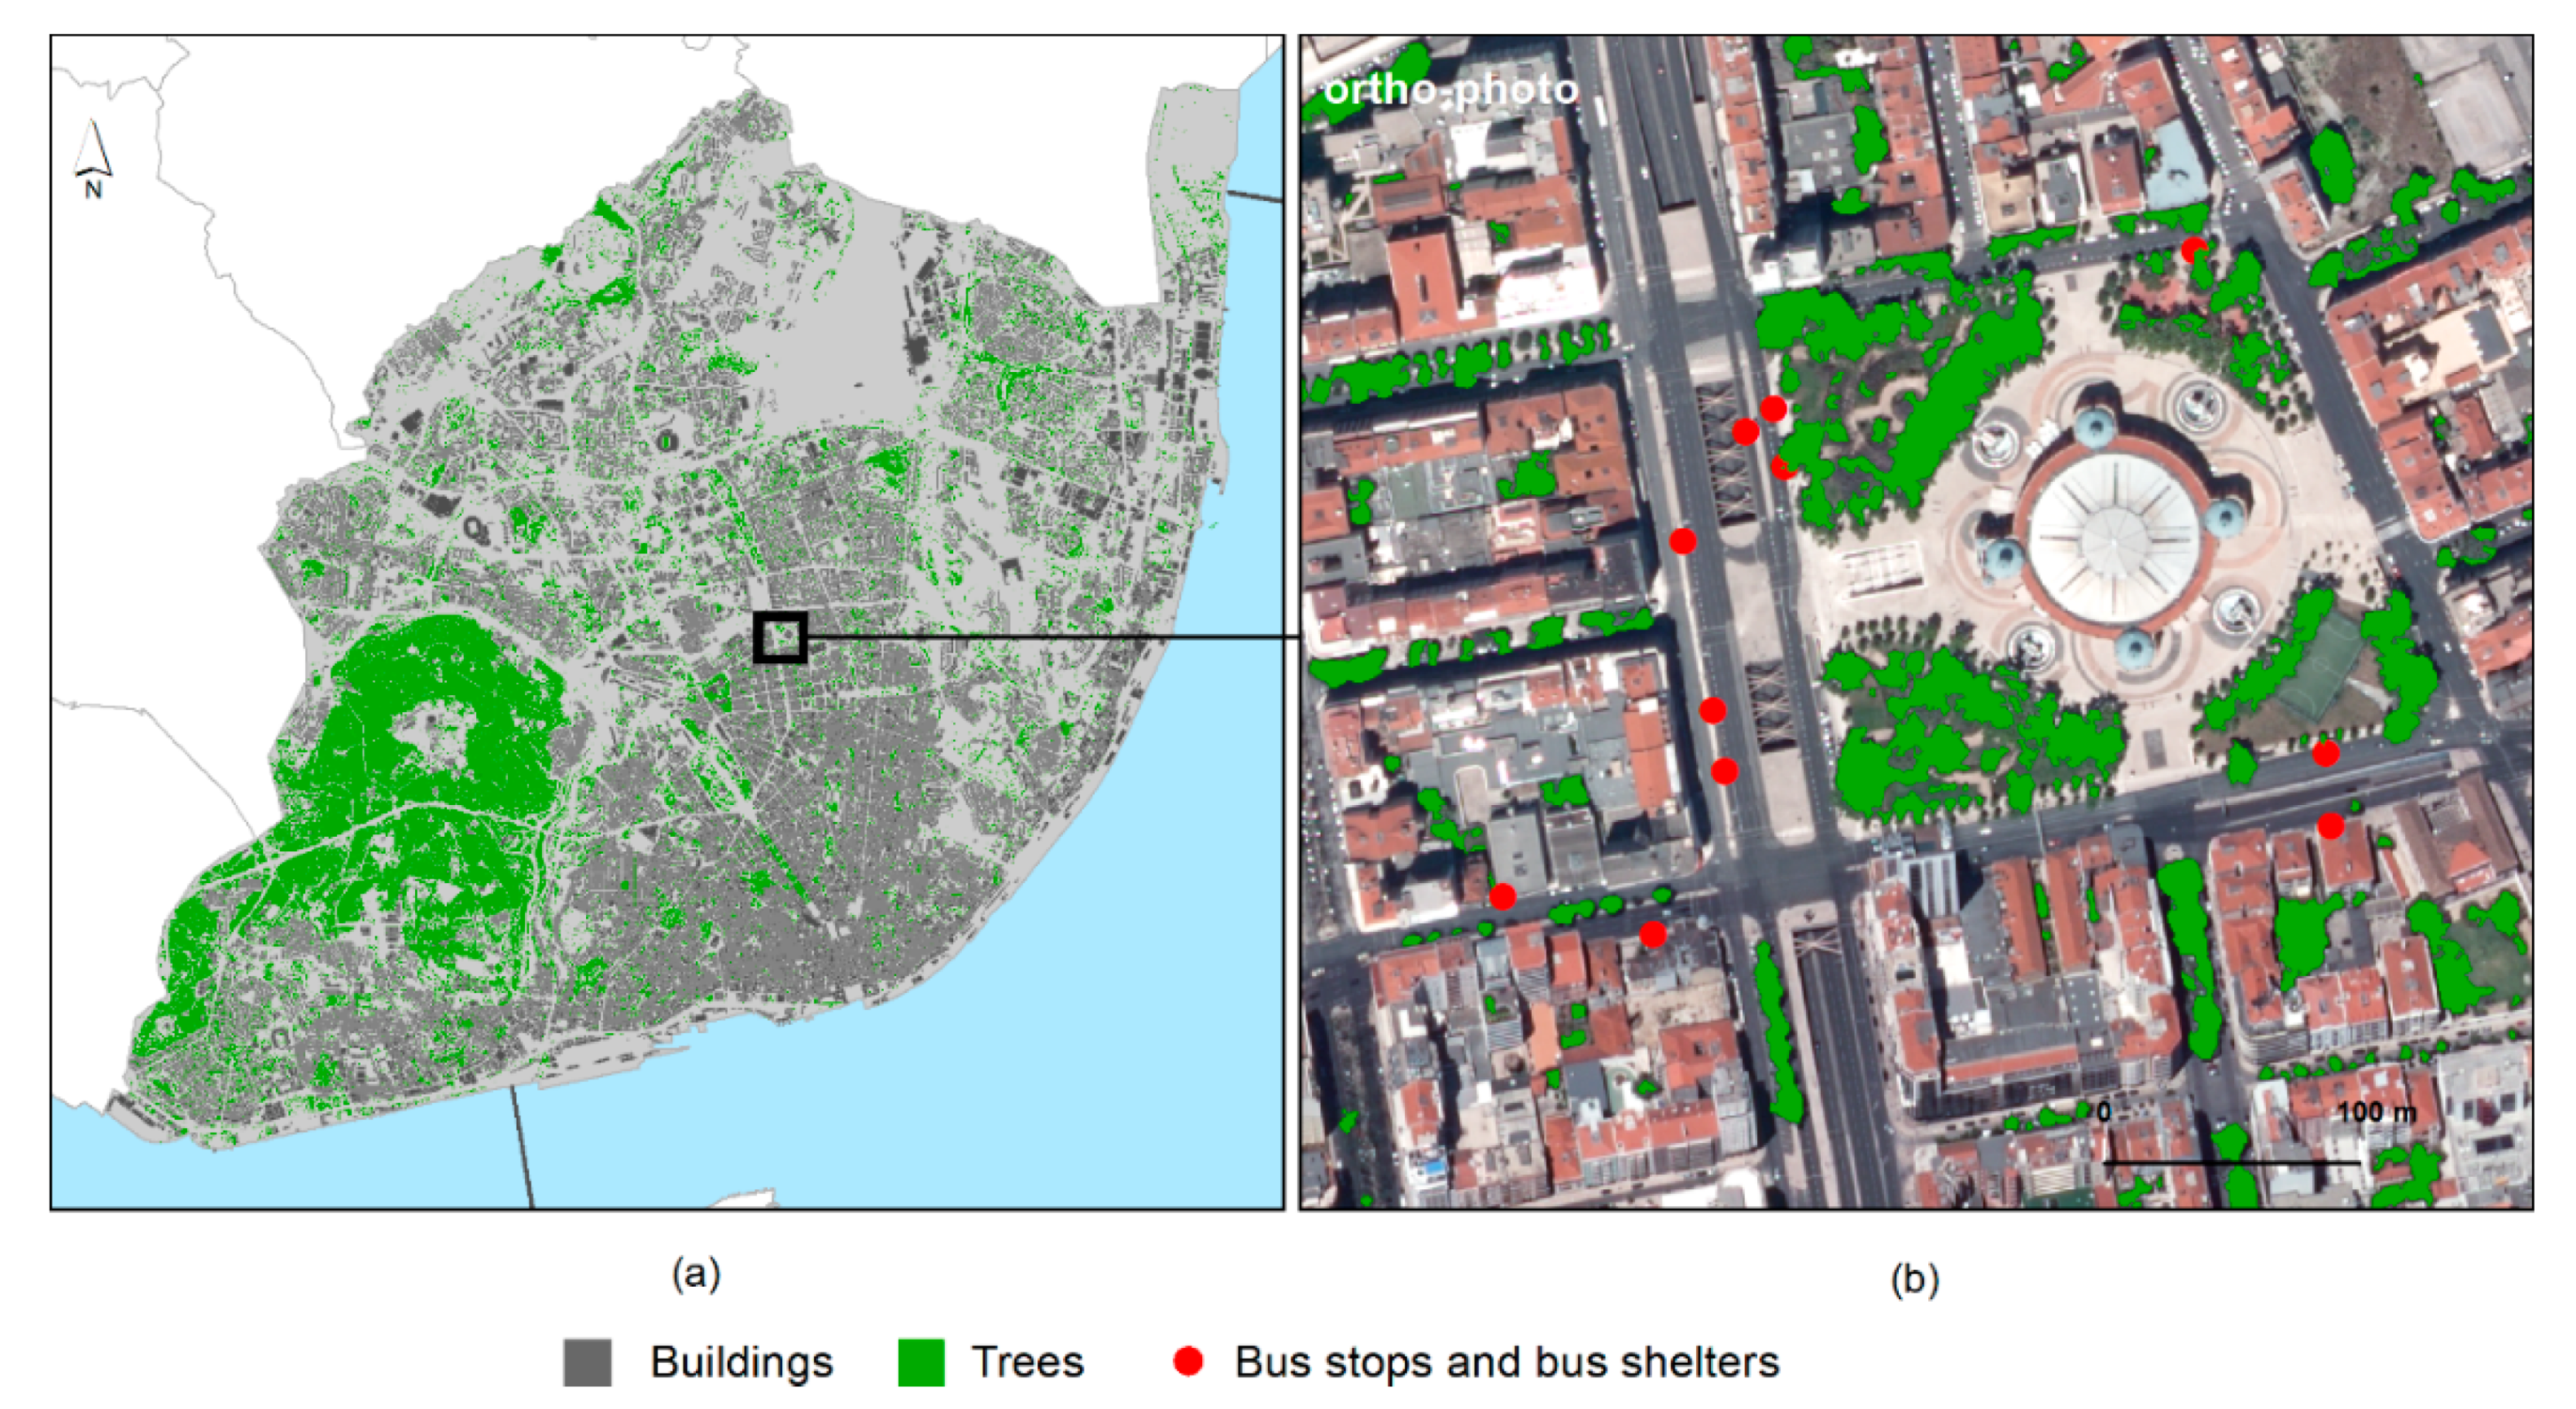
  • The first assumption made is that to be considered for PV potential analysis, a bus shelter must not be under any type of vegetation (e.g., trees) [25] or urban structures, such as bridges or balconies. The analysis begins with the examination of the point shapefile with all the bus stops available in the city (raw data). The goal is to eliminate all locations under trees. For this task, a Very-High-Resolution (VHR) image is used. Through an object-oriented classification, a map with the tree coverage of the city is produced and used to determine each shelter’s suitability, following the methodology proposed by [26]. The locations that are away from trees are then subject to visual identification based on Google Street View information. The aim is to produce a polygon layer with the eligible bus shelters (i.e., locations away from trees and with shelters). This layer already has the dimensions of each shelter, a key element when performing PV system design and sizing.
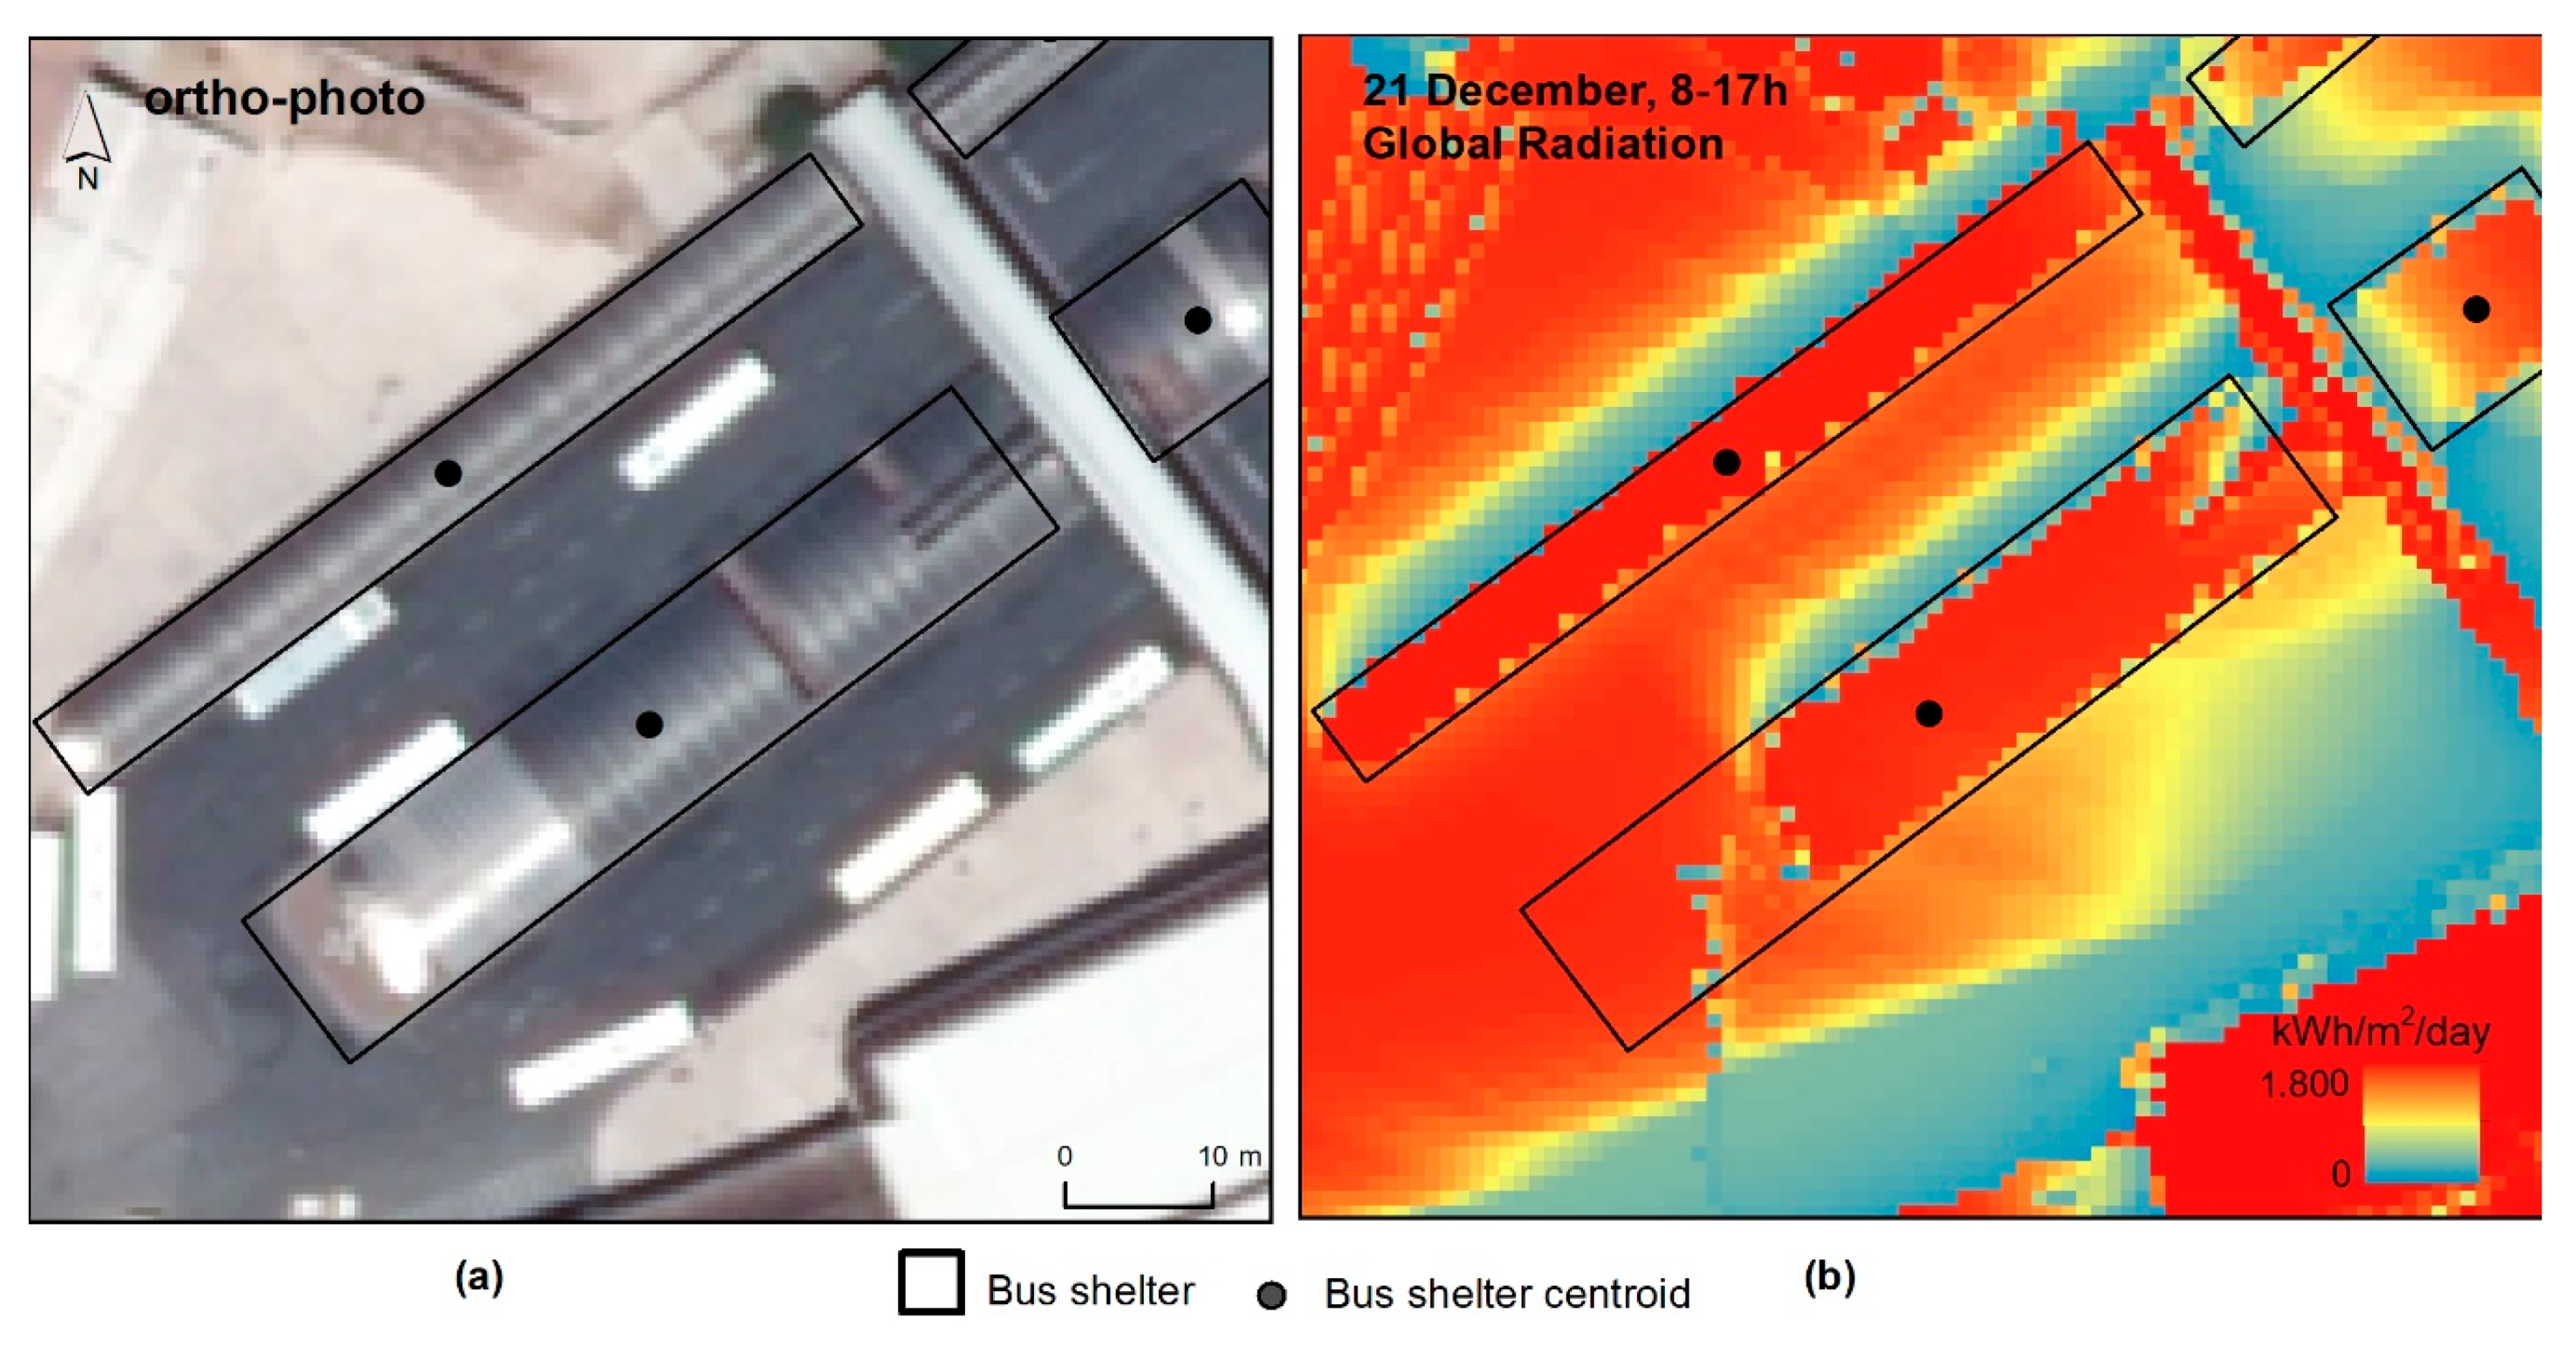
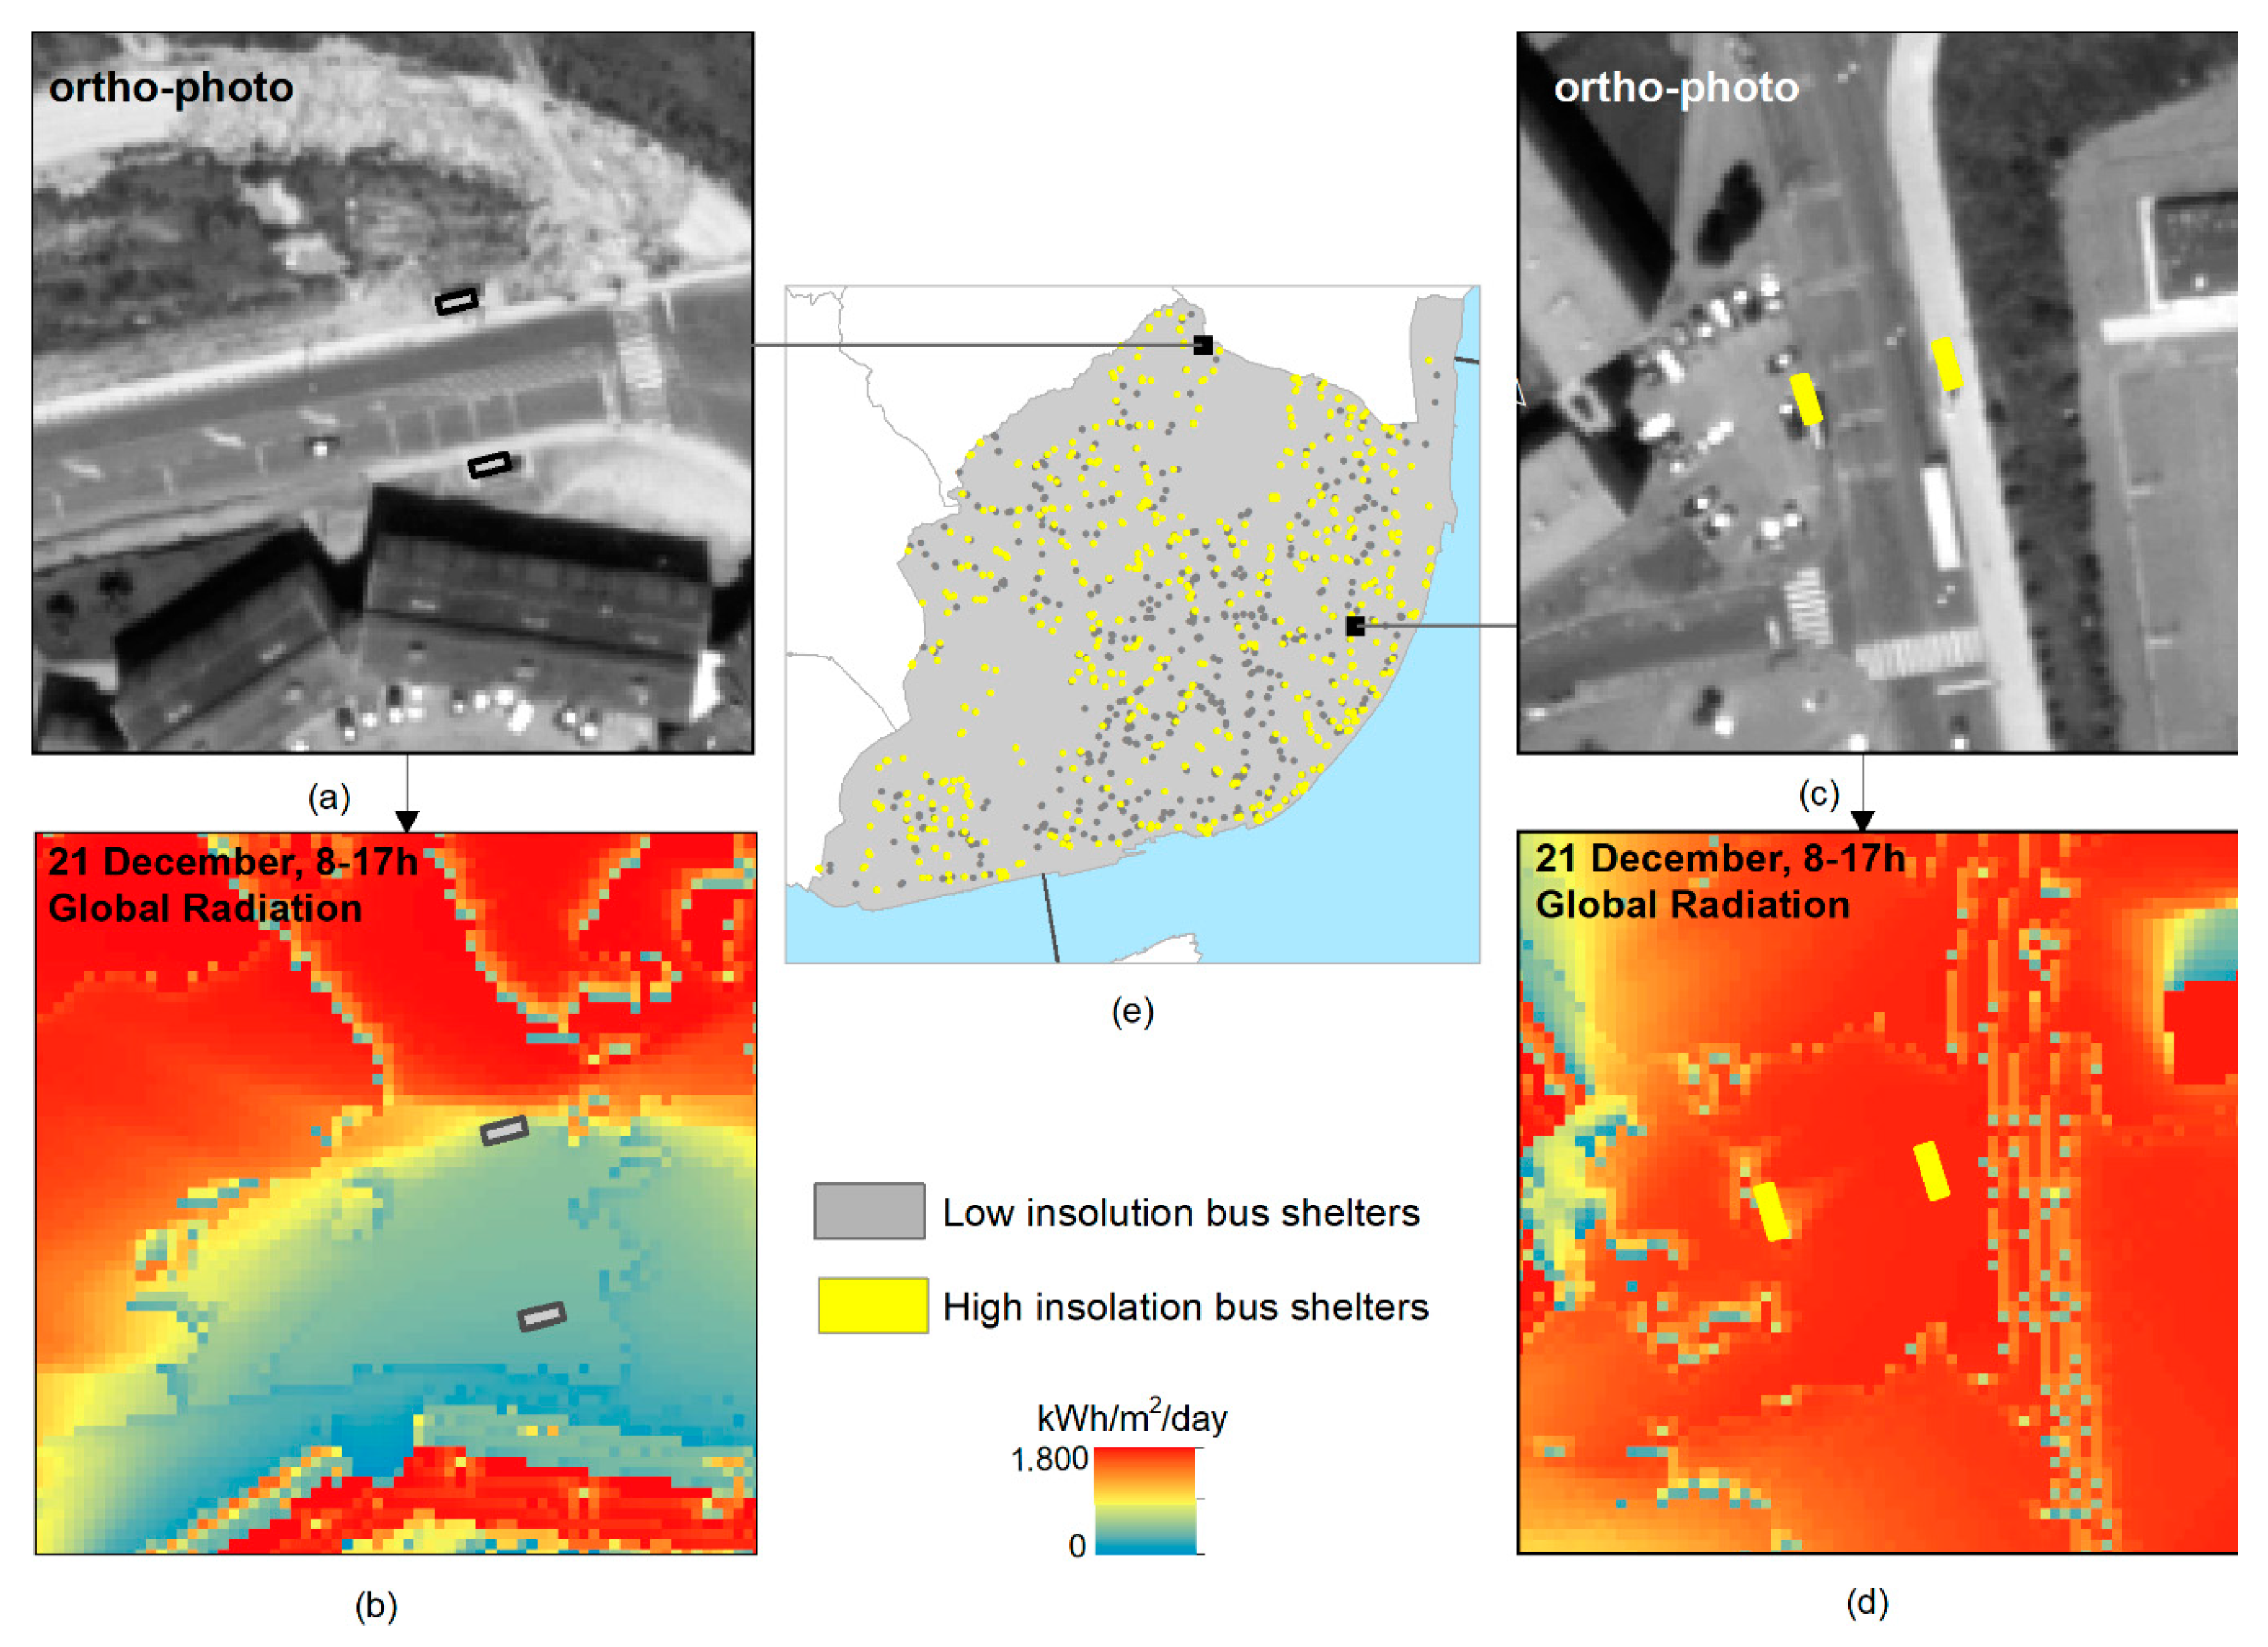
  • After modeling the solar resource and mapping the suitable bus shelters, the amount of energy that reaches each bus shelter is quantified through an overlay analysis.
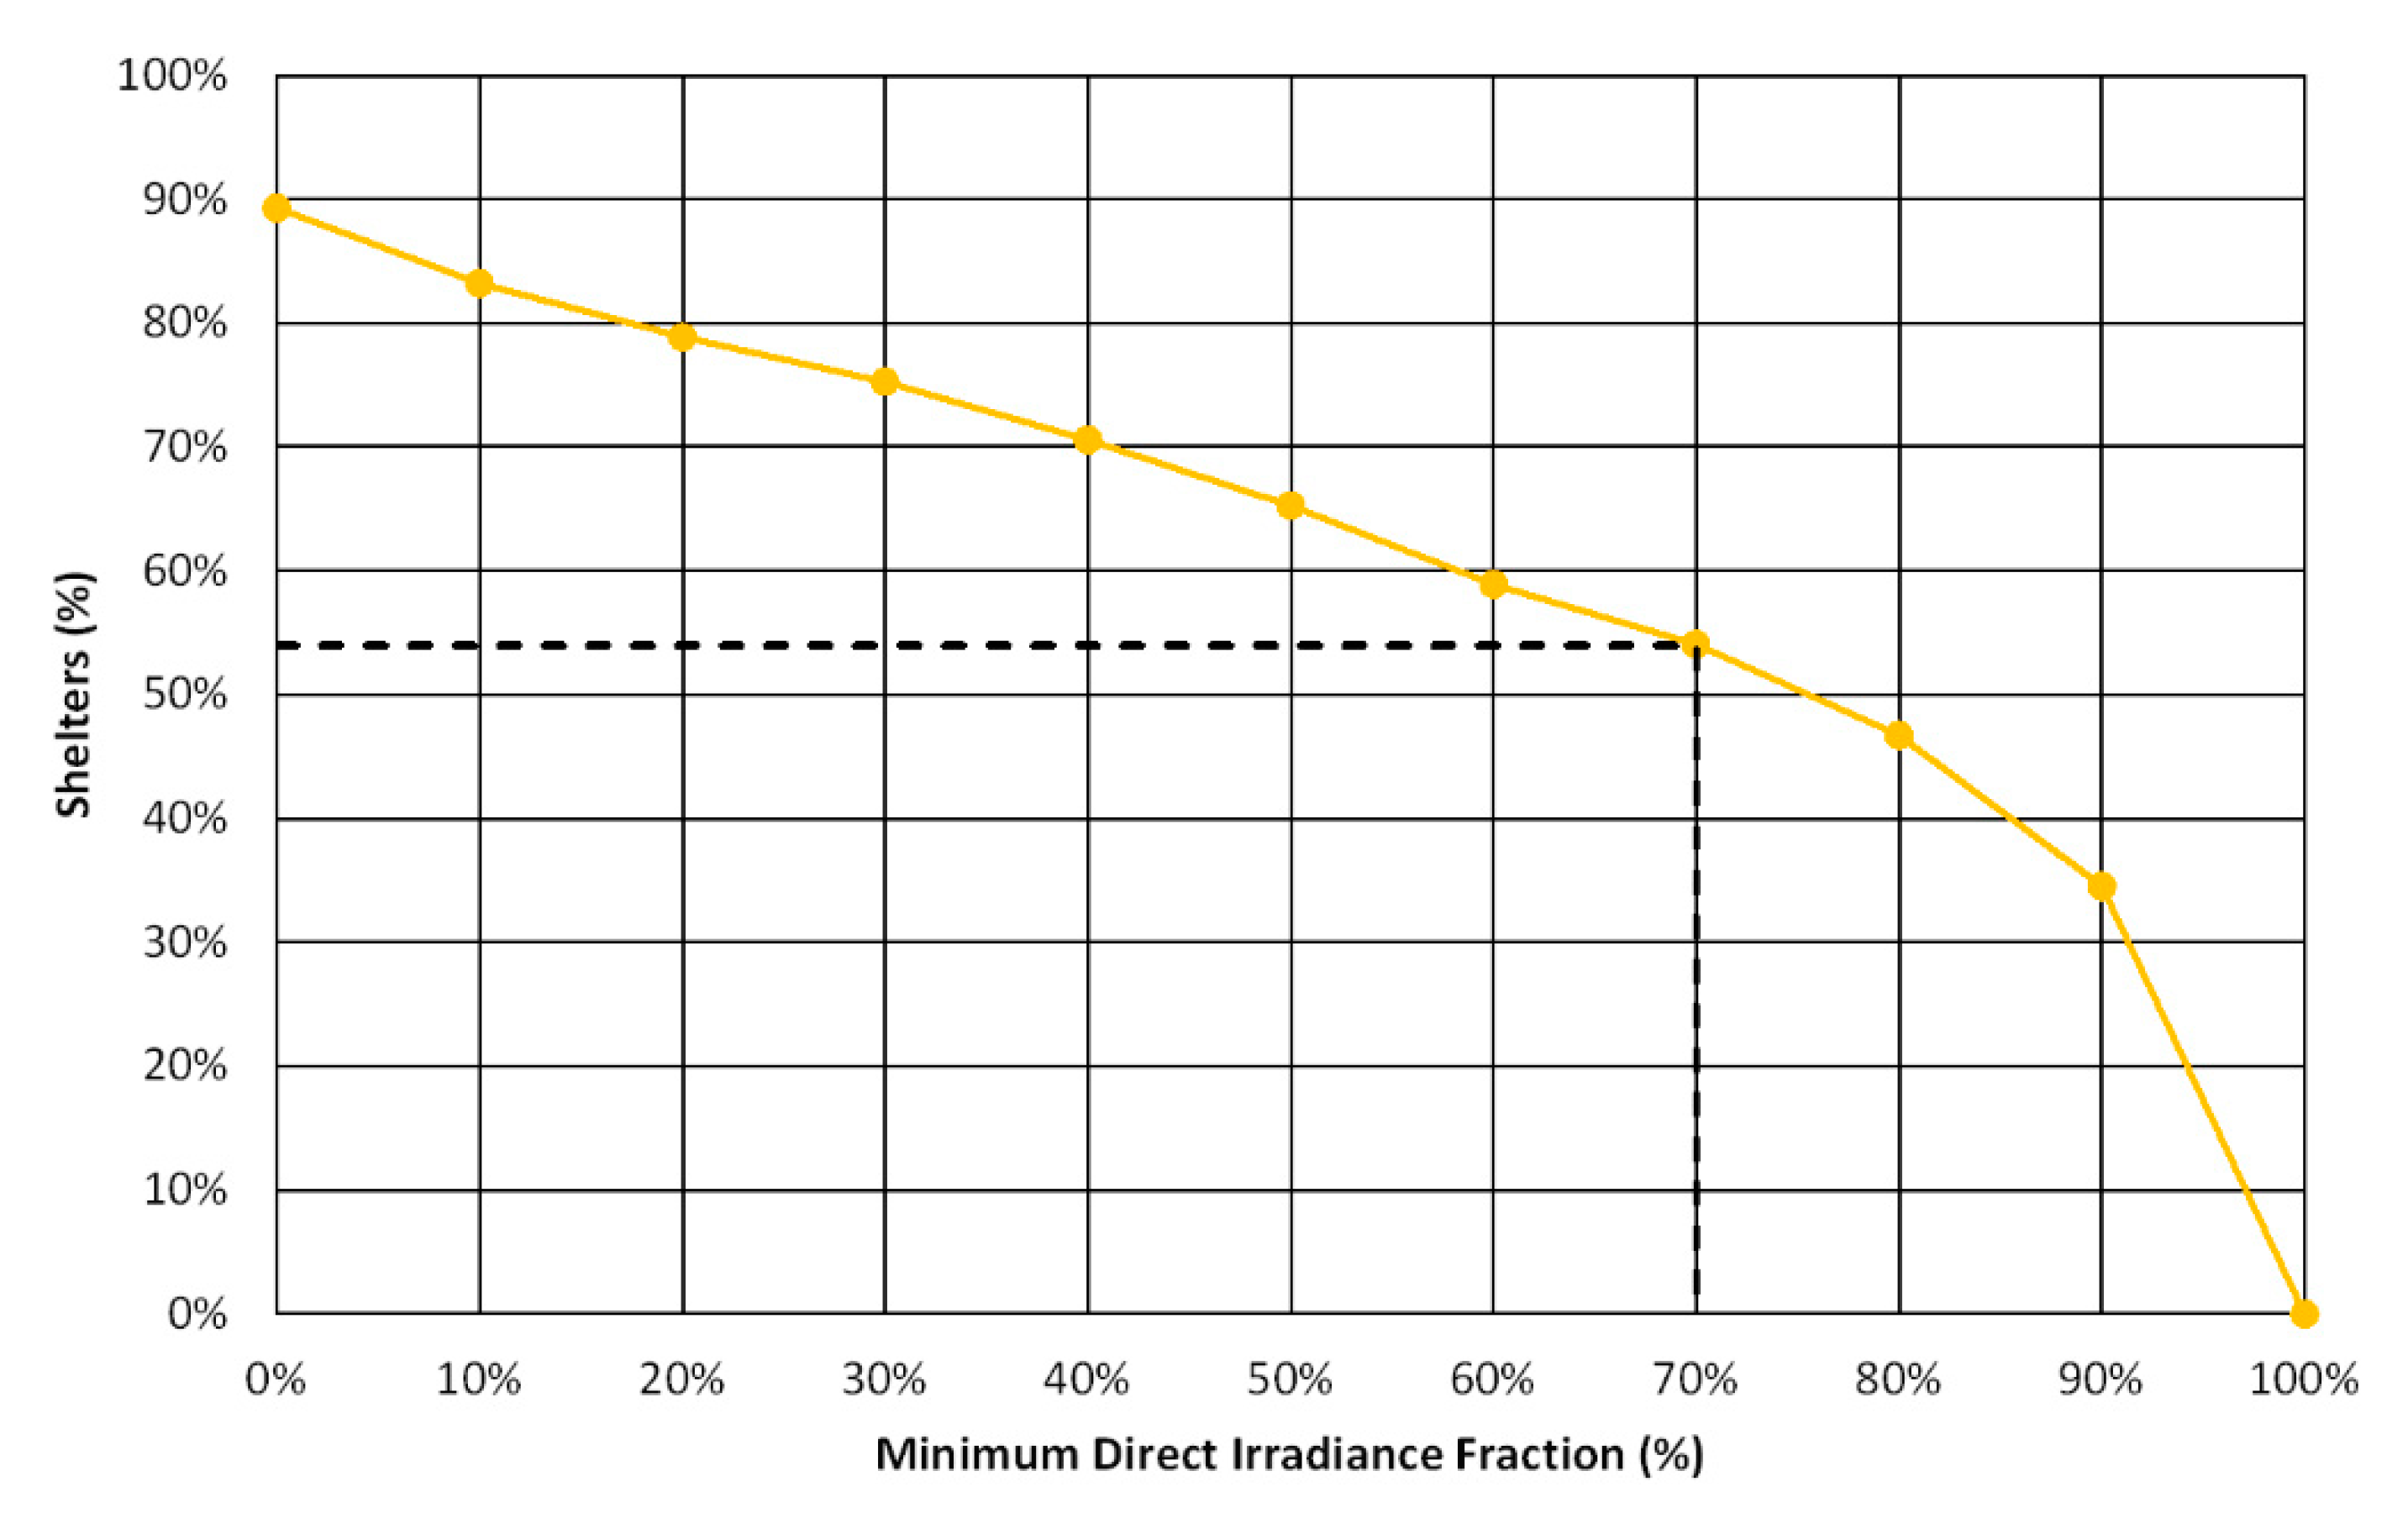
  • The methodology continues with the assessment of the technical potential of the shelters with the best geographic conditions. To select the shelters with higher irradiation, and consequently less shadowing, the Direct Irradiance Fraction (DIF) is proposed. This quality factor is used to describe the amount of insolation that an array will capture (as a percentage), relative to what an optimally oriented, unshaded array would capture in the same location. Therefore, the DIF is calculated for each bus shelter, and only those having a value higher than 70% are found to meet the geographic criteria making them suitable for a PV panel. Note that this threshold is adjustable upon financial analysis. In fact, according to the PV installation cost, the value can be more or less restrictive. The result is a layer with the location of shelters with higher solar radiation in the city. Applying the PV efficiency, the energy produced at each bus shelter is calculated. The final output is the map with the best production sites according to geographical and technical criteria, i.e., the city’s solar bus shelters.
The PV potential of each solar bus shelter is then compared with the energy required by some typified applications:
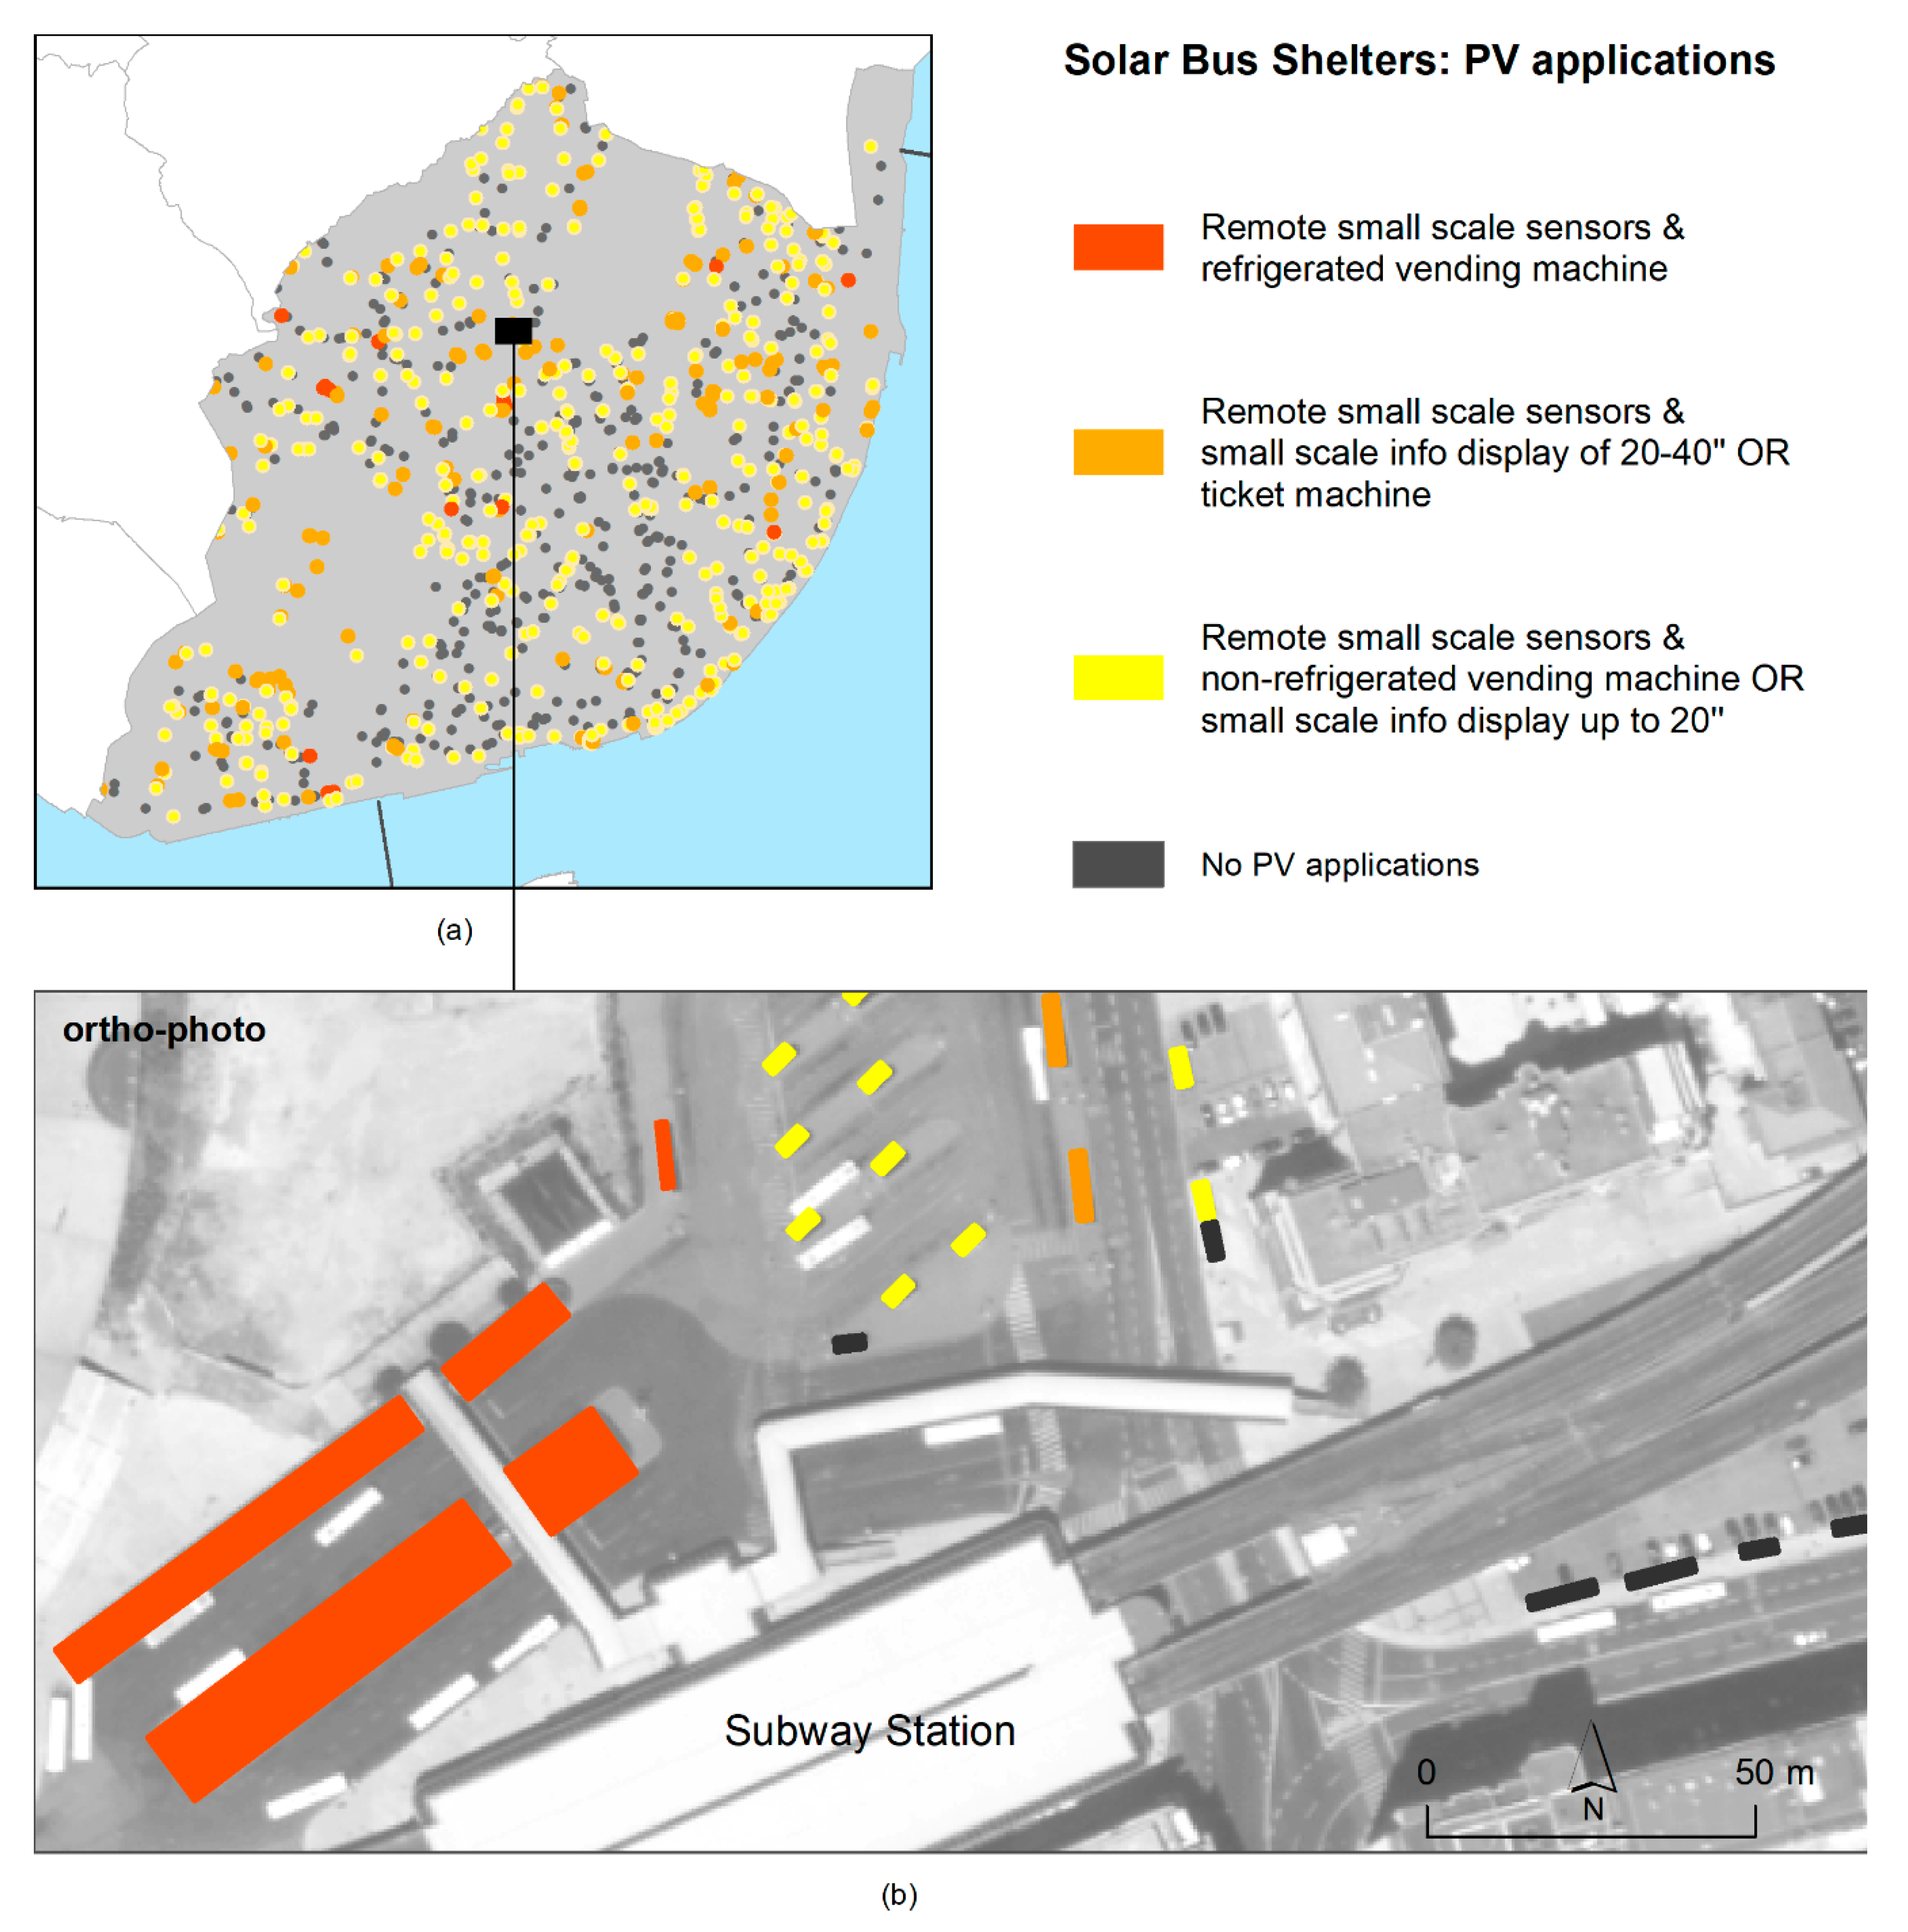
  • Level 1 applications require less energy and include remote small-scale sensors. Based on the concept of the Internet of Things (IoT), such sensors can deliver public information or gather data about the frequency of commuters in a shelter at a certain time, increasing the quality of the bus service.
  • Level 2 includes non-refrigerated vending machines or LCDs up to 20′. These amenities can provide personal hygiene items or real-time information on a digital screen.
  • Level 3 applications include larger digital displays and ticket machines.
  • Level 4 includes the most energy-demanding applications like refrigerated vending machines that offer commuters hot or cold drinks, snacks or food.
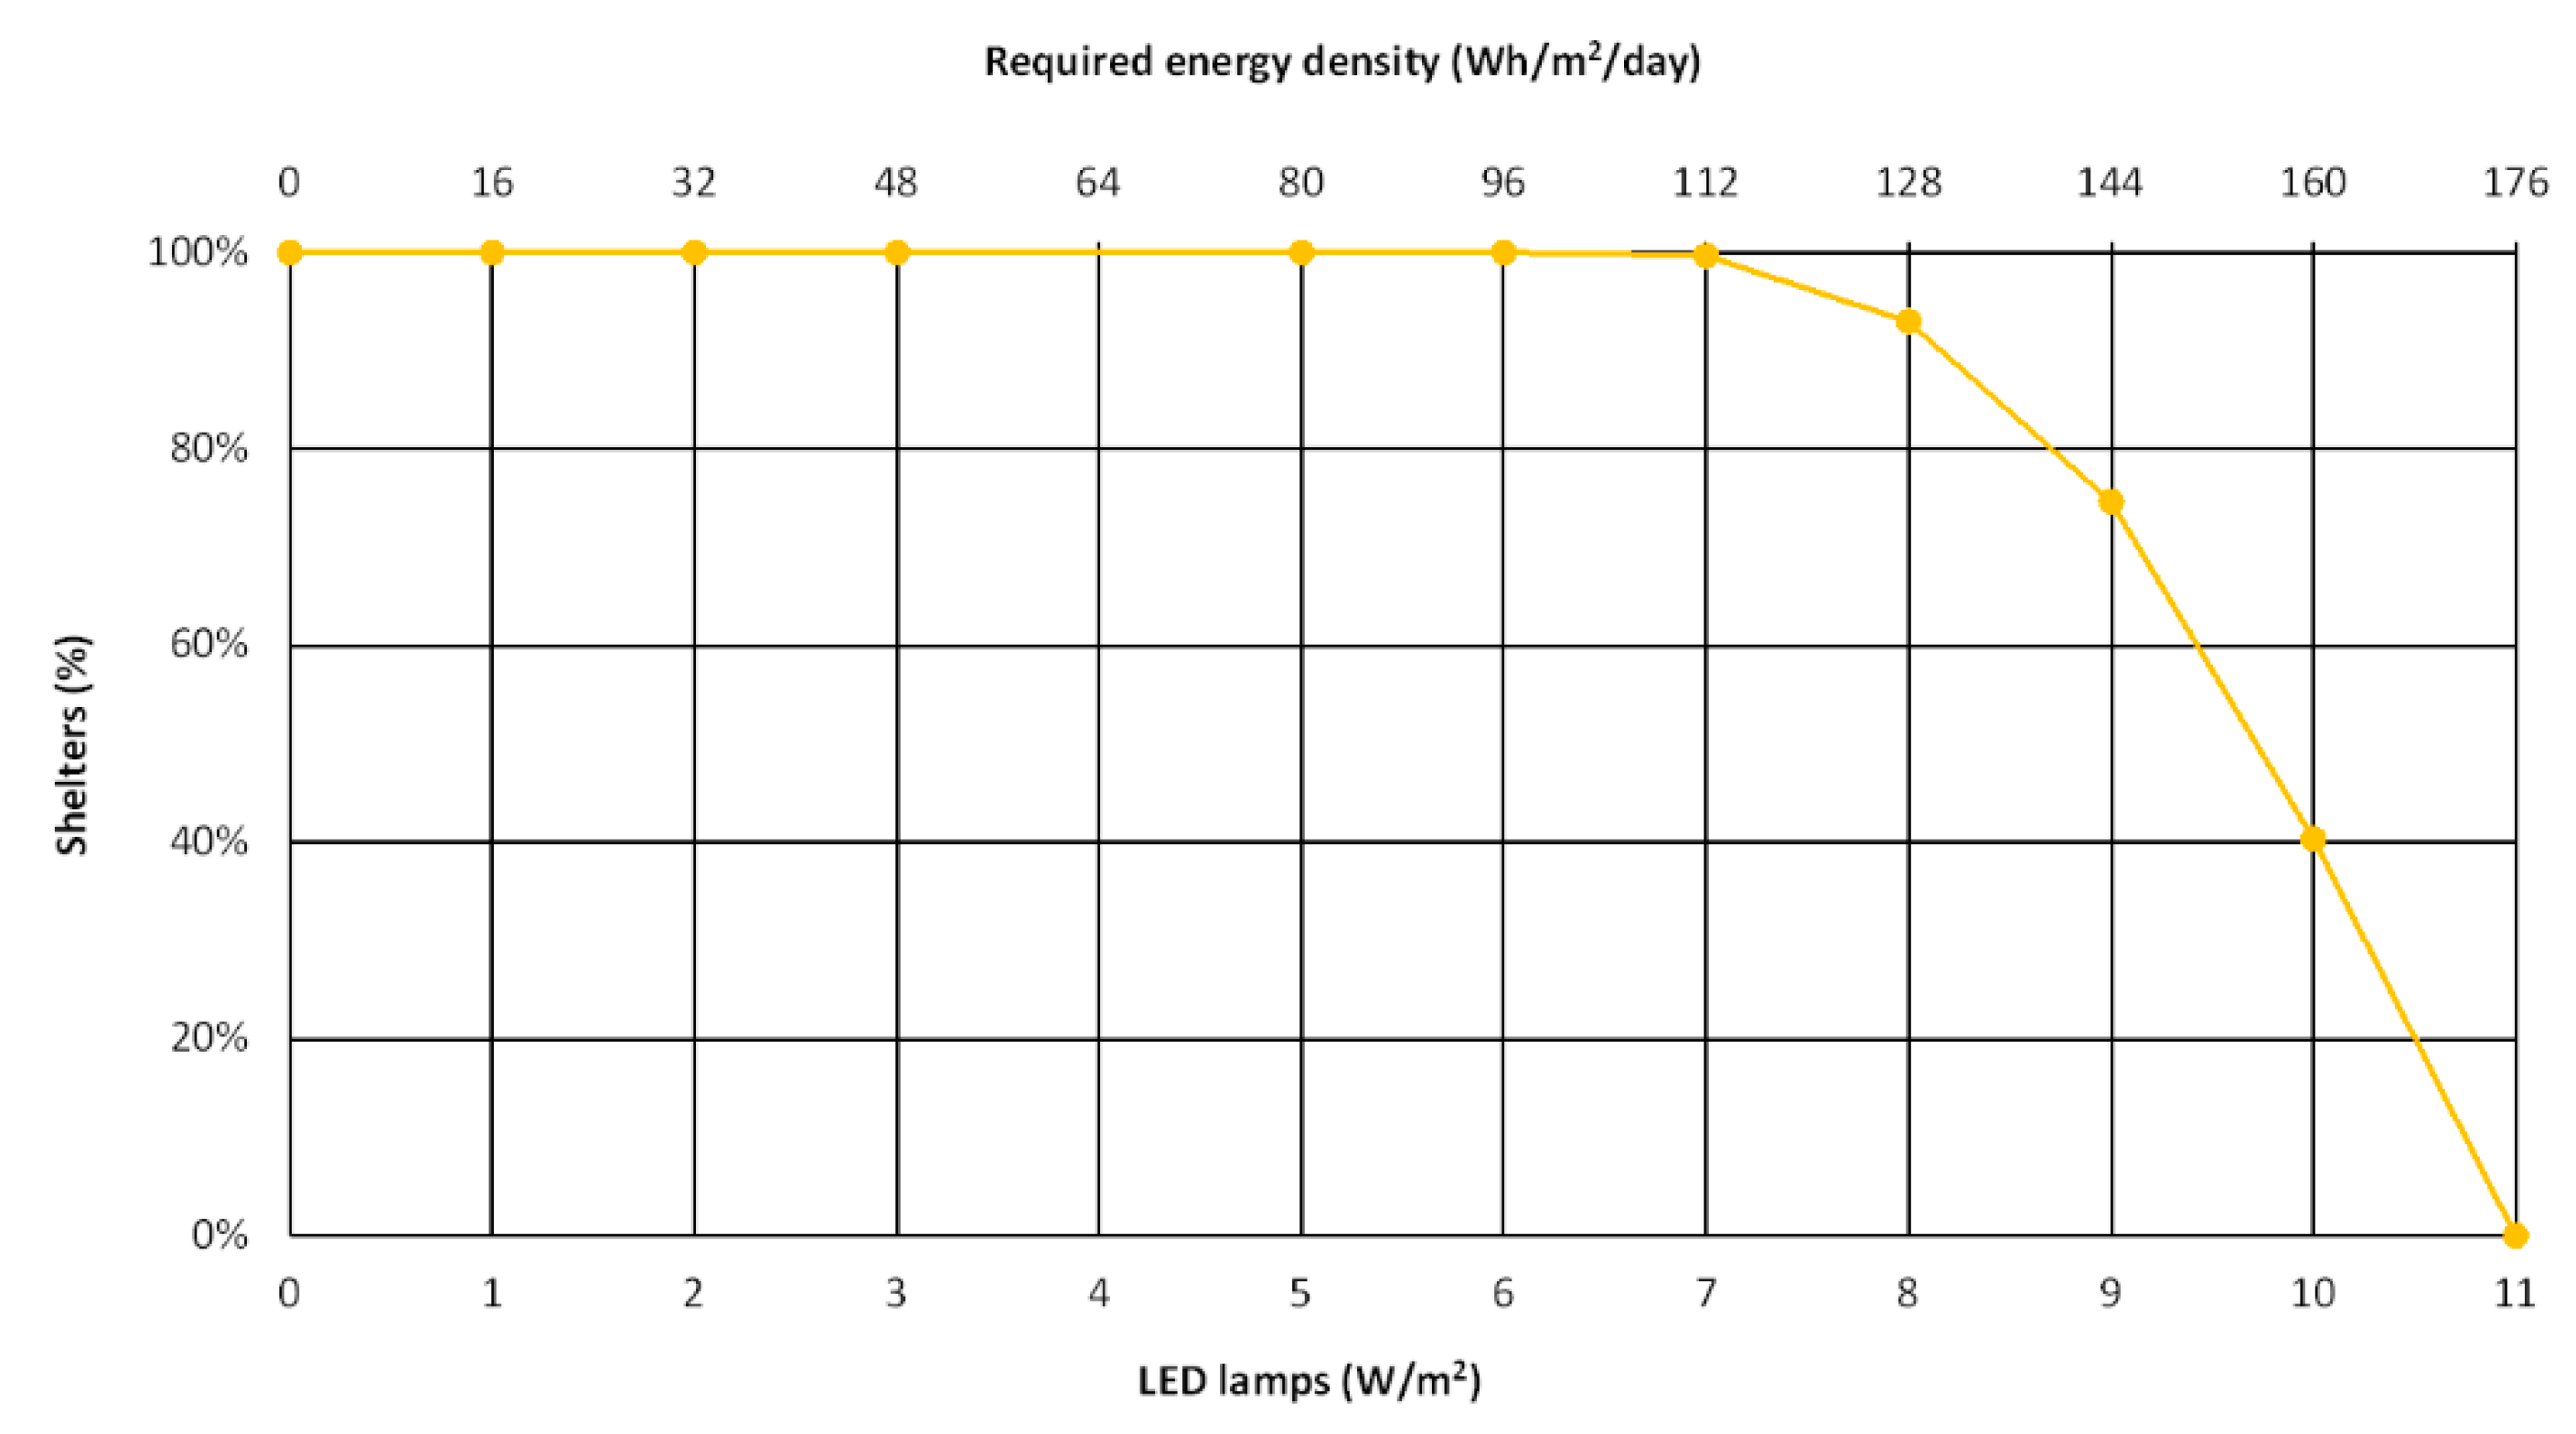
  • Additionally, the illumination capacity of each shelter is investigated.
All these applications constitute added value initiatives that can improve the quality of the public space and the services offered to the users.

2.2.3. Spatial Planning Scenarios

To support PV planning, two target audiences for the solar bus shelters are evaluated: regular and irregular commuters (e.g., tourists). Profiling these two groups implies identifying their preferred bus locations, i.e., a proxy for those places where the local energy consumption can occur. The bus shelters that are generally used more by tourists are in the vicinity of the city’s tourist attractions and are also served by sightseeing bus tours. On the other hand, the daily commuters use the bus to attend school or health care facilities or to reach metro or train stations (usually near services or commercial areas).
Following a multi-criteria approach, three spatial planning scenarios—tourists, commuters, and tourists and commuters—are presented.

3. Results and Discussion

3.1. The City’s Solar Bus Shelters

To obtain the location of the bus shelters eligible for PV installation, the shapefile with the bus stops available in the city had to be analyzed and refined. Of the 1880 available locations, 1558 were identified as having a shelter. Of these, 369 were eliminated due to the presence of trees compromising the available radiation (Figure 4).
The remaining 1189 point locations were subjected to visual analysis using the ortho-photo and the Google Street View tool. In this analysis, all identifiable shelters were digitalized, and those that were under structures like balconies and bridges were identified. Furthermore, the shelters that were under trees, and that were not classified as so, were also signalized (29). From this analysis, one concludes that the initial tree classification had an overall accuracy of 93%.
From this cleaning and refining stage, the output was a polygon file with the 1132 bus shelters available in Lisbon. Such bus shelters have the geographical characteristics that make them eligible for PV installation.
The next step was to evaluate the solar resources available at each shelter. Based on the city’s DSM, a solar map was derived for the 21st of December (the northern hemisphere’s shortest day) from 8 a.m. to 5 p.m. The parameters for determining solar insolation in the Solar Analyst tool were sky size resolution of 200 cells and viewshed calculated using 360 azimuth directions directions. The atmospheric parameters of direct radiation transmissivity and diffuse radiation fraction were the same as those determined for Lisbon by [23,24]. The solar map quantifies the direct and global radiation in each location of the surface (kWh/m2/day) (Figure 5). The calculation time was 705 h using a standard desktop PC.
The solar resource of each bus shelter was determined by using the Direct Irradiance Fraction (DIF). To characterize the shadowing effect, the local Direct Radiation value was compared with the maximum Direct Radiation value found at the 1132 bus shelters (1.198 kWh/m2/day), i.e., the value of a pixel that did not suffer any shading. The central point of each shelter was used as a proxy for the shelters’ area potential. Other metrics were tested, such as the maximum radiation in the shelter’s area, the mean or the mode values. However, problems arose due to the misalignment between the raster file with the radiation information and the polygons obtained from the visual identification of shelters over the ortho-photo (Figure 6). This is a common problem when detailed vector and VHR raster datasets are compared (e.g., [27]).
The high insolation bus shelters in Lisbon were selected based on a threshold of DIF > 70% (Figure 7). The results showed that 612 shelters out of 1132 (54%) received the required energy, making them suitable for PV panel installation (Figure 8). These are the city’s solar bus shelters.
For the selected high insolation shelters, the PV potential was assessed by considering the bus shelter area, the Global Radiation that reaches each shelter, and a system energy conversion efficiency of 10%. The PV module efficiency, battery charger efficiency and battery charging efficiency are dependent on the manufacturers, system configuration and also operating conditions. The values provided are conservative, at the lower end of the spectrum: the PV system power conversion efficiency was 13% [28], and the battery charger system efficiency was 80% [29]. The chosen values indicate the expected minimum energy that could be generated and stored. These are easily altered for specific system configurations.
The results indicated that all the shelters produced more than 0.7 kWh/day but fewer (63) produced 1.8 kWh/day or more. In this set, eight shelters presented very high PV potential (>100 kWh/day) due to their large dimensions (e.g., interface stations).
The PV potential was then compared with the energy required by some typified applications (Table 2).
The solar bus shelters were rated based on local energy production and the possibility of receiving the mentioned applications. Every shelter could accommodate a remote small-scale sensor, but fewer would be suitable for a small info display to deliver pertinent information, and even fewer would be suitable for a ticket vending machine. Higher-energy-consumption applications, such as coffee vending machines, were only possible in 23 shelters. Among these, only eight shelters, due to their large dimensions, would be suitable for more demanding applications. The solar bus shelters were then mapped according to the level of energy required for each application (Figure 9).
Furthermore, the illumination capability was also investigated, considering the required energy density (i.e., kWh/m2/day) necessary to feed LED lamps, functioning 16 h in a day (winter conditions) (Figure 10). We can conclude that all the solar bus shelters would be suitable for up to 7 W/m2 LED lamps, but only 40% would be suitable for 10 W/m2 LED lamps. Higher-energy-consumption LED lamps would not be possible to install.

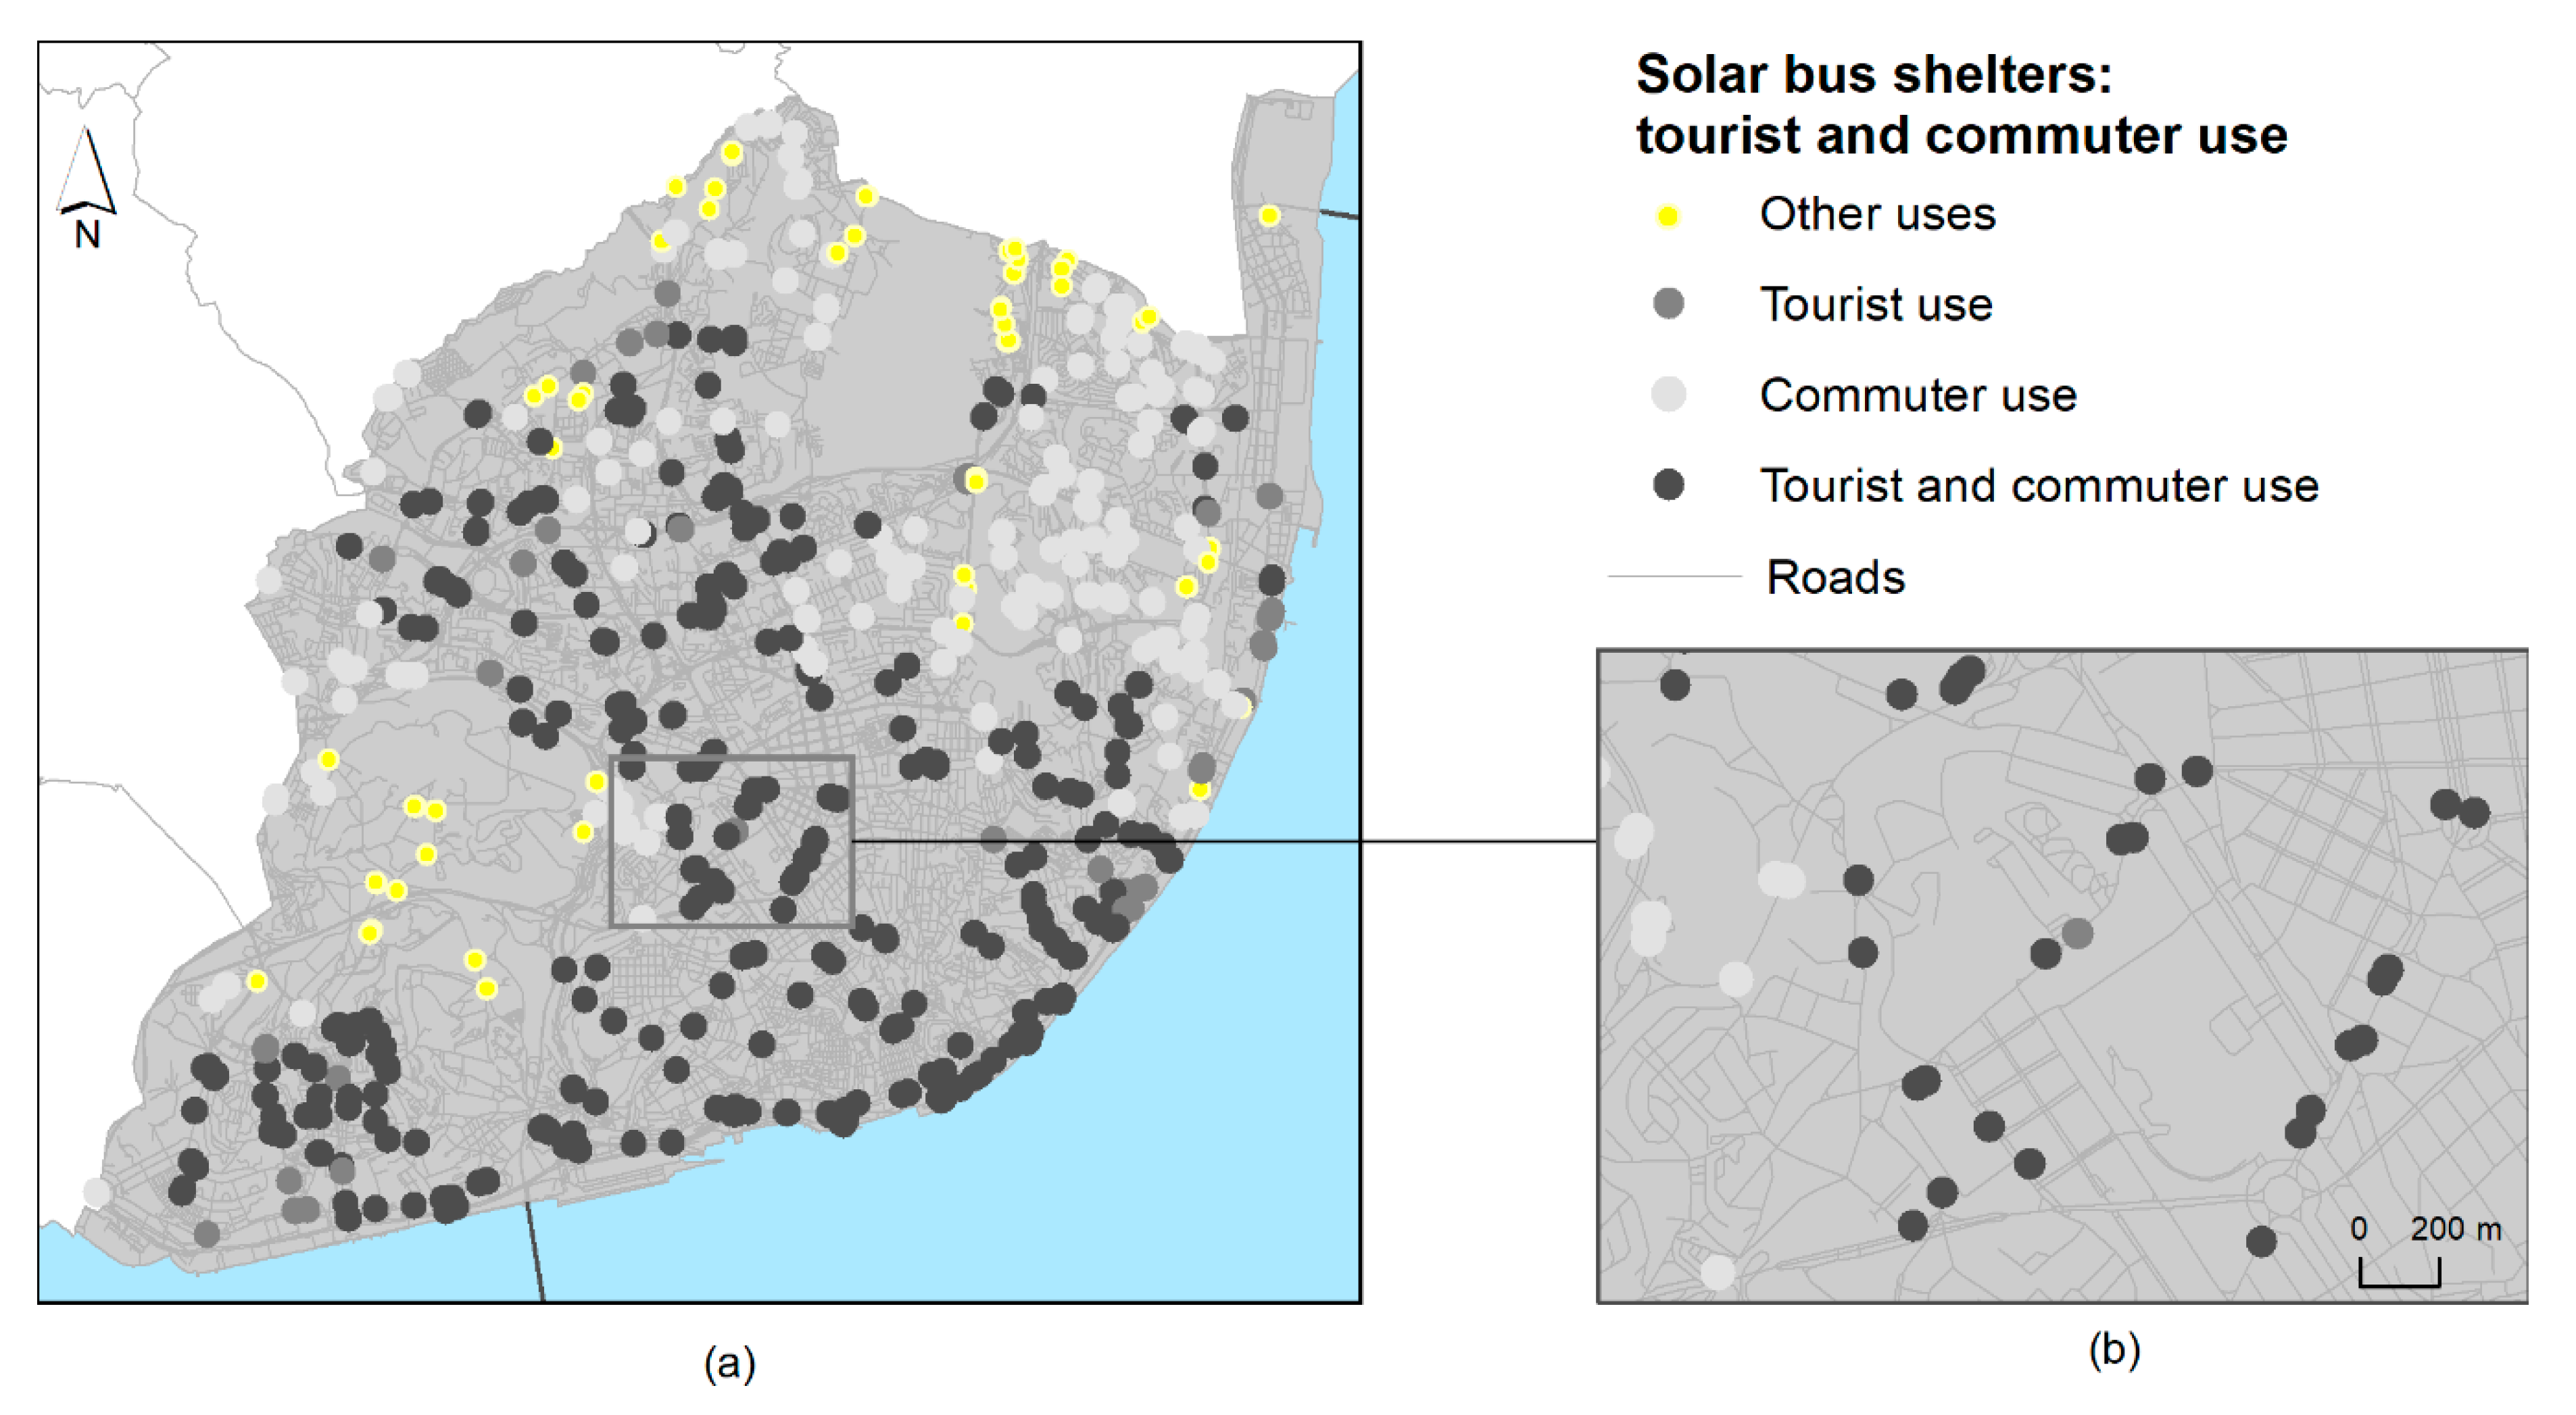
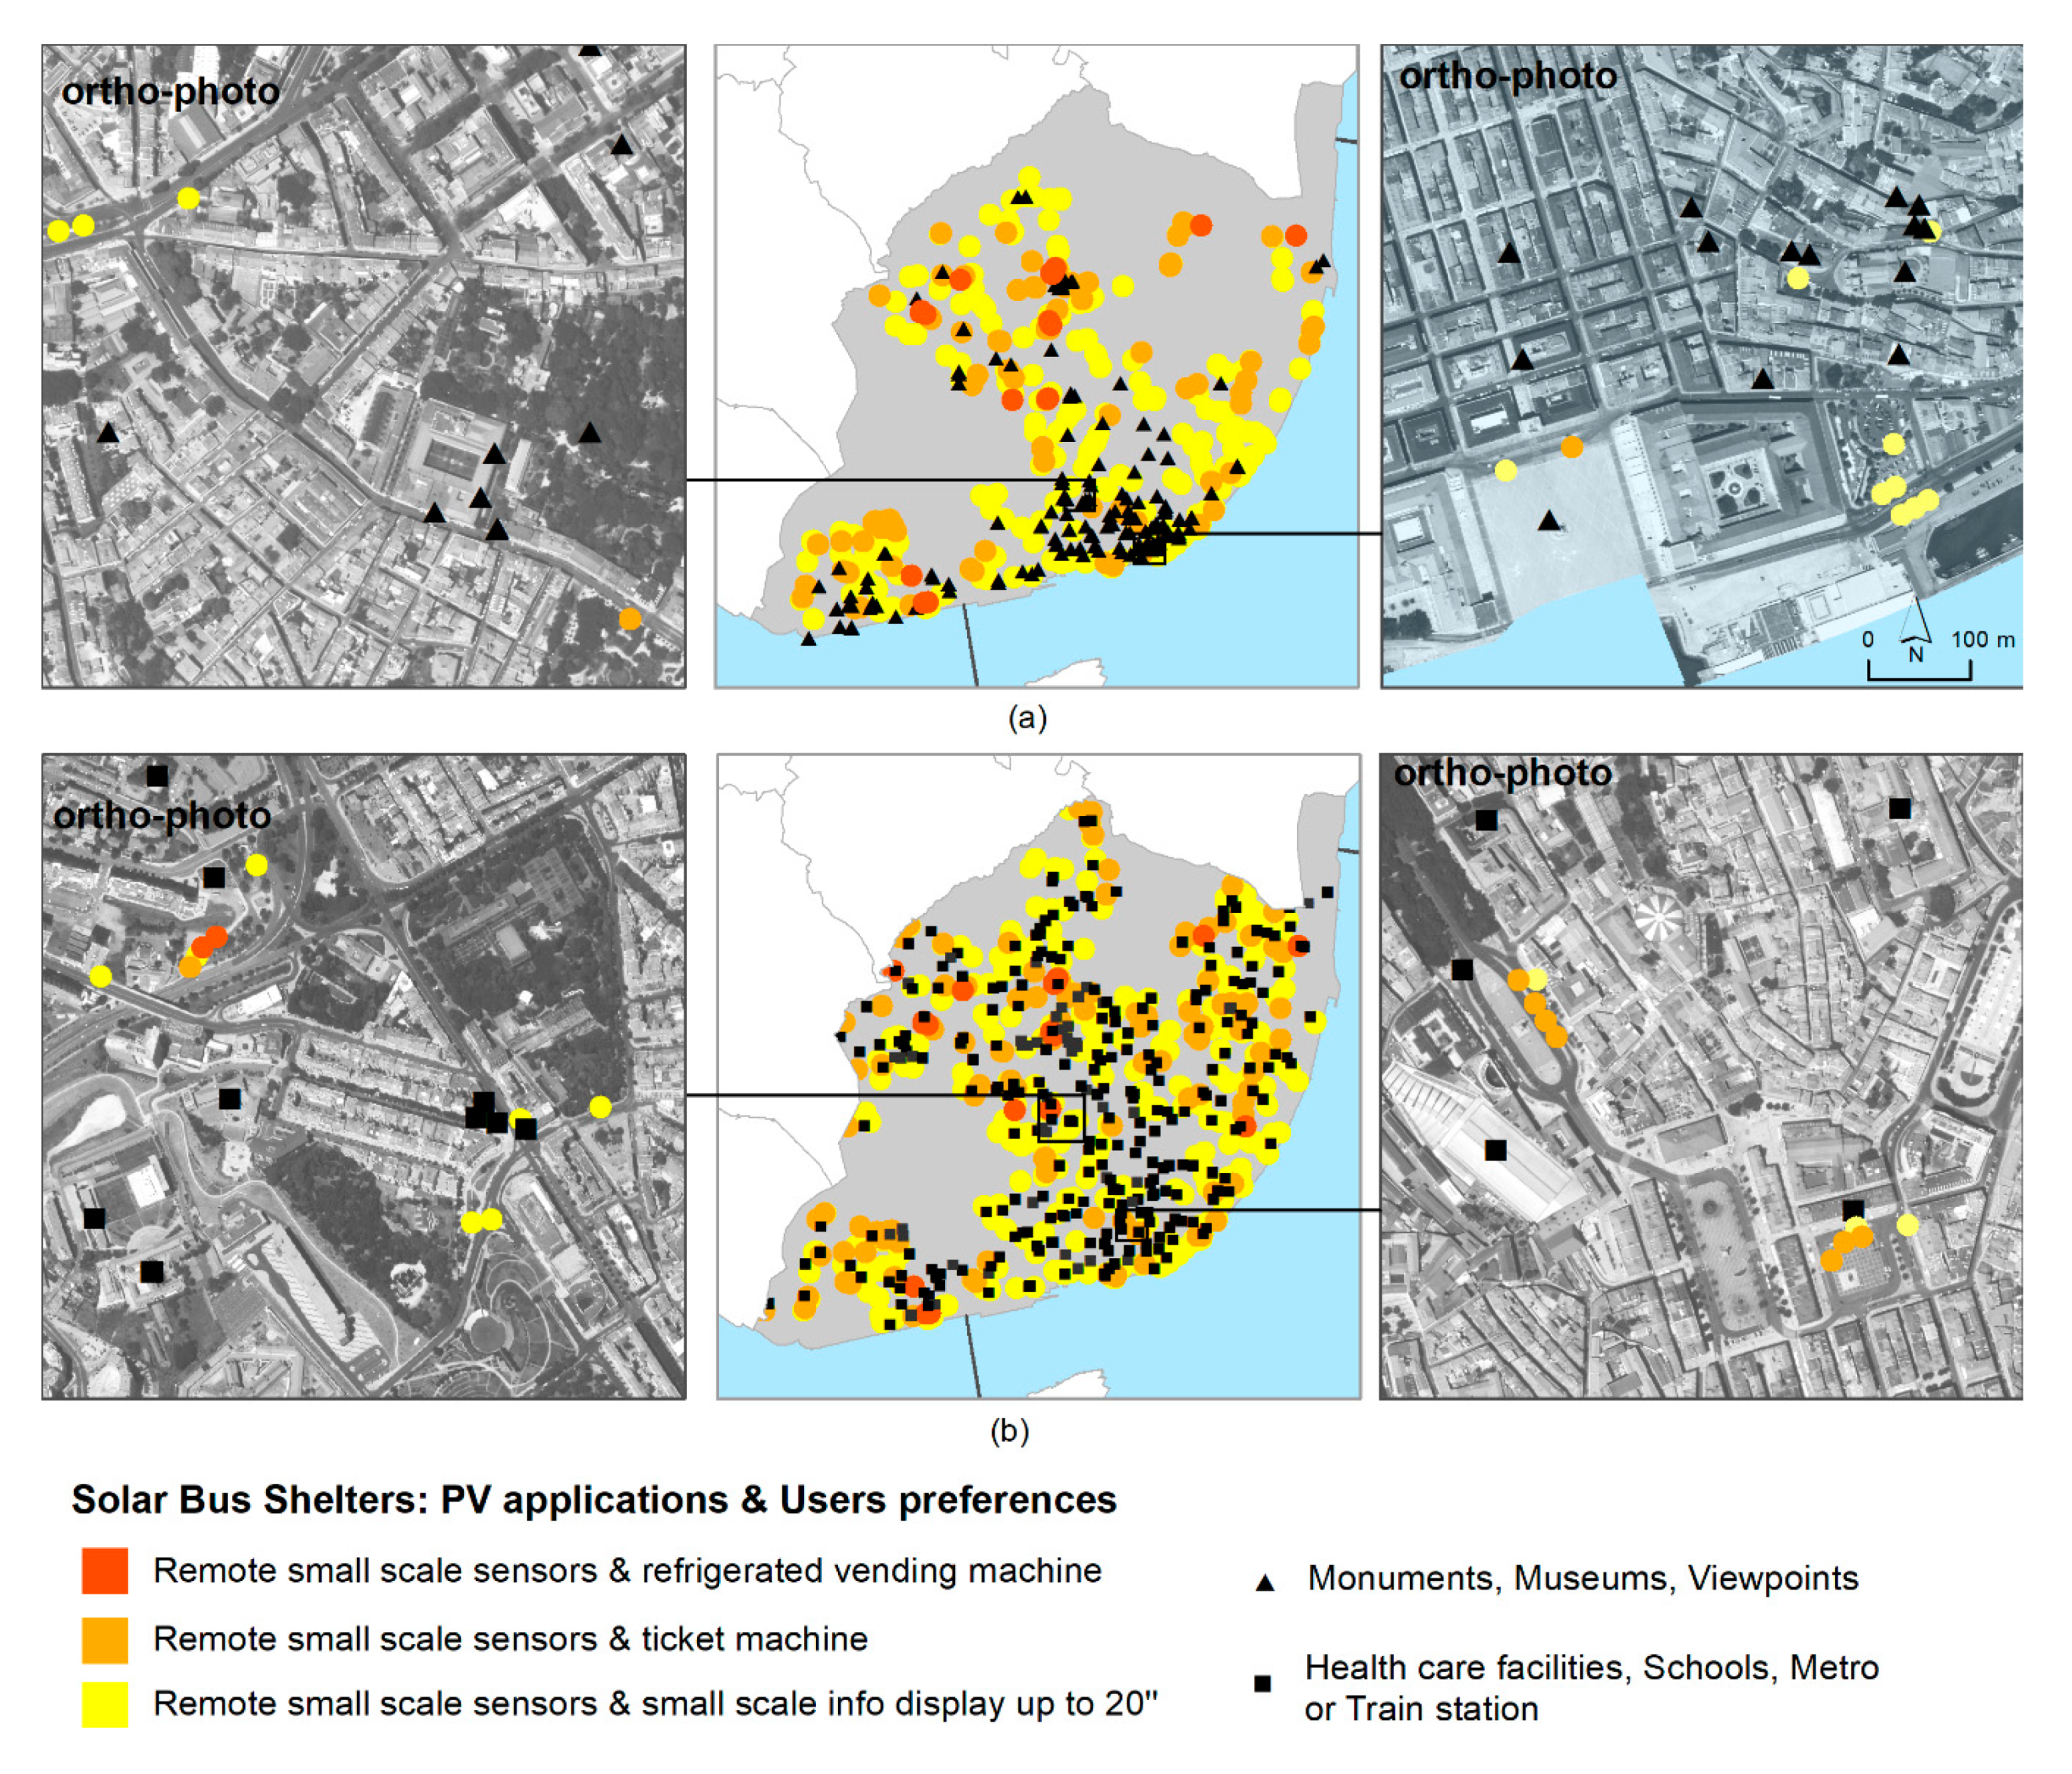
3.2. Spatial Planning Scenarios

The 612 solar bus shelters were further investigated according to social criteria (tourists and daily commuters). There are no data on the number of users at each stop, so proxies were used to describe this phenomenon. Proximity analysis was applied to select the bus shelters according to their estimated use. Generally, in the public transit industry, buffers at 400 m around bus stops and 800 m around rail stations are commonly used to identify the areas from which most transit users will access the system by foot [30].
To characterize the tourist use, all the high insolation shelters that served sightseeing tours or that were within 800 m of monuments, museums and viewpoints were identified. For characterizing the commuter use, the bus shelters within 400 m of schools (basic, secondary and high), health care facilities (hospitals and medical centers), and metro and train stations were selected. The rationale was that tourists are more willing to walk longer distances than daily commuters. For each category, the georeferenced information available at the city hall was used.
According to the proximity analysis of the 612 solar bus shelters, 551 are within the proxy distance, detailed above. From this, 374 are used by tourists and 510, by the city’s commuters. Among these, 333 served both tourists and city commuters (Table 3) (Figure 11).
Planning for solar innovative solutions requires knowledge about not only the local energy production capabilities but also the existence of local demand and where it occurs in the city. The goal is to match the city’s geographical and technical potential with its social one. To support decision-makers regarding implementation strategies, several planning scenarios were produced based on the PV-based applications and the respective target audience. Based on (1) the bus shelter locations used by the tourists and the daily commuters and (2) the spatial distribution of bus shelters with typified PV applications, three planning scenarios were produced (Table 4). As anticipated, being higher in number, the bus shelters used by commuters would be suitable for more PV applications and more lighting power than those used by tourists. Nevertheless, half of the locations (308) served both uses and could offer small-scale info displays, ticket machines or refrigerated vending machines, and 21% (128) could be equipped with 10 W/m2 LED lamps.
The tourist use pattern follows the cultural attraction sites, being more concentrated on the riverside, while the daily use is dispersed throughout the city (Figure 12).
The results indicate that 612 bus shelters have the potential to be improved. This constitutes an opportunity for providing a better experience to commuters and tourists while improving the quality of the public space. Furthermore, through renovation, Solar bus shelters can create value for businesses and public transport providers.

4. Concluding Remarks

The purpose of this study was to analyze the potential of structures in the public space for low-carbon innovative technological solutions while contributing to meeting local sustainable energy targets. The renovation of bus shelters with solar-based applications is presented as a case study. Bus stops’ large protective panels provide ideal spaces for the application of solar cells. For low energy consumption applications, the bus shelter may not consume much energy, and so the excess energy could be fed into the electricity grid, if such a connection is economically viable. Shelters can also house a variety of amenities for travelers that can improve satisfaction with wait times, improve safety perceptions and provide valuable system utilization information. Outside of buses, bus stops are the most visible representation of the public transport system.
Two situations favored the choice of these structures. On the one hand, bus shelters are spread across the urban area and serve thousands of passengers every day. Consequently, their renovation has a great impact on the quality of the public space around them. On the other hand, good bus shelters are an essential part of the public transport system. Their modernization through the provision of innovative services is a way of improving the users’ perception of public transport, thus promoting sustainable and smart mobility.
The bus shelters were assessed in terms of local electricity production capabilities and local electricity demand potential. The methodology used, as input data, a Very-High-Resolution image and a detailed Digital Surface Model. All the shelters were evaluated in a GIS environment, based on geographical, technical and social criteria. The result was the determination of the city’s potential to implement solar bus shelters. Using Lisbon as a case study, the results show that 612 shelters out of 1132 (54%) receive the required solar radiation to install PV panels. These results are in line with those presented by [15].
We also investigated which PV-based applications could be installed in these solar bus shelters, according to their PV-generation capacity. Four typified applications were analyzed, from lower-energy-demanding applications (such as remote small-scale sensors or small-scale info displays) to higher-energy-demanding ones (such as refrigerated vending machines). While every shelter would be suitable for remote small-scale sensors, all the other applications were only possible in fewer shelters, and the top-level applications were only possible in those shelters with higher dimensions, usually present at interface stations. The possibility of having lighting was also tested, and the results indicate that all the PV shelters would be suitable for up to 7 W/m2 LED lamps but only 40% would be suitable for 10 W LED lamps. Higher-energy-consumption LED lamps would not be possible to install. Future studies shall verify these results obtained from geographic modeling against measured data.
The results are presented in planning scenarios. These show where and what PV-based applications can be implemented and serve as a demonstration of the usefulness of the proposed methodology to planners and energy advisers. Such knowledge about the city’s potential for PV-based applications can be used to improve urban development plans, to integrate solar energy into new regulations or to support and orient incentive policy design towards the use of more efficient sites or neighborhoods within the city.
The planning scenarios were based on target audiences—tourists and daily commuters. Since no data about the average daily boarding or passenger transfer activity were available, proximity analysis was used as a proxy to characterize the local electricity demand. For this analysis, we applied buffer distances around each bus stop to identify the areas of influence. In future work, this step can be improved by using distances calculated on the street network. The inexistence of such data also compromised the evaluation of the local seasonal demand, namely regarding tourist activity. Detailed data would improve the analysis.
We found that many of the features available through solar bus shelters, including Wi-Fi connectivity, information displays and ambient data collection through integrated sensors, are also being applied to a range of other smart infrastructure and services (e.g., [31,32]). Consequently, bus shelters are not the only piece of everyday urban infrastructure that can be made “smarter”. Future work will include testing other solutions oriented towards improving urban sustainability using renewable energy and considering the public space, the citizens and the environmental benefits.

Author Contributions

Conceptualization, T.S.; data curation, T.S.; formal analysis, T.S. and K.L.; investigation, T.S.; methodology, T.S.; validation, K.L. and J.R.; writing—original draft, T.S. and J.R.; writing—review and editing, J.A.T. All authors have read and agreed to the published version of the manuscript.

Funding

This research was funded by national funds through FCT—Foundation for Science and Technology, I.P., within the scope of the project “UIDB/04647/2020” of CICS.NOVA—Centro Interdisciplinar de Ciências Sociais da Universidade Nova de Lisboa and project “UIDB/50019/2020” of IDL—Instituto Dom Luiz. The first author was financed by the FCT, under the Norma Transitória—DL 57/2016/CP1453/CT0004.

Acknowledgments

The authors would like to thank Logica for the opportunity to use the LiDAR dataset.

Conflicts of Interest

The authors declare no conflict of interest.

References

  1. EUROSTAT. Sustainable Development in the European Union: 2019 Monitoring Report on Progress towards the SDGS in an EU Context; Publications office of the European Union: Luxembourg, 2019; ISBN 978-92-76-00778-4. [Google Scholar]
  2. SDGs: Sustainable Development Knowledge Platform. Available online: https://sustainabledevelopment.un.org/sdgs (accessed on 13 June 2020).
  3. Kooi, B. Security Concerns at Hot-Spot Bus Stop Locations. J. Appl. Secur. Res. 2015, 10, 277–307. [Google Scholar] [CrossRef]
  4. Vancouver Bus Shelters Use Solar Powered LED Lighting. Available online: https://carmanah.com/industry-news/industry-vancouver-bus-shelters-use-solar-powered-led-lighting/ (accessed on 12 June 2020).
  5. Solaripedia | Green Architecture & Building | Projects in Green Architecture & Building Bus Stops Go Solar for Lighting, Safety. Available online: http://www.solaripedia.com/13/199/bus_stops_go_solar_for_lighting,_safety.html (accessed on 12 June 2020).
  6. London Transparent about Its New Solar Bus Shelters. Available online: https://newatlas.com/london-polysolar-transparent-solar-bus-shelter/42735/ (accessed on 12 June 2020).
  7. JCDecaux. The Multi-Faceted Bus Shelters of Paris. Available online: https://www.jcdecaux.com/blog/multi-faceted-bus-shelters-paris (accessed on 12 June 2020).
  8. Radius Displays San Francisco Bus Shelters. Available online: http://www.radiusdisplays.asia/products/san-francisco-bus-shelters/ (accessed on 12 June 2020).
  9. Kirk, M. Singapore May Have Designed the World’s Best Bus Stop. Available online: https://www.citylab.com/commute/2017/03/singapore-may-have-designed-the-worlds-best-bus-stop/518226/ (accessed on 12 June 2020).
  10. Santos, T.; Gomes, N.; Freire, S.; Brito, M.C.; Santos, L.; Tenedório, J.A. Applications of solar mapping in the urban environment. Appl. Geogr. 2014, 51, 48–57. [Google Scholar] [CrossRef]
  11. Karoline, F. Technical and Economic Potential for Photovoltaic Systems on Buildings; KIT Scientific Publishing: Karlsruhe, Deutschland, 2018; ISBN 978-3-7315-0787-1. [Google Scholar]
  12. Rodrigo, C.M. Potencial Solar em Espaço Livre Urbano. Master’s Thesis, Universidade de Lisboa, Lisboa, Portugal, 2016. [Google Scholar]
  13. Santos, T.; Rocha, J.; Lobato, K. Method for solar potential mapping of the intra-building over the street unoccupied urban volume. In Proceedings of the 37th European PV Solar Energy Conference and Exhibition, Lisbon, Portugal, 7–11 September 2020. [Google Scholar]
  14. Mordomo, C.F. Potencial PV no Espaço Público Urbano. Master’s Thesis, Universidade de Lisboa, Lisboa, Portugal, 2018. [Google Scholar]
  15. Mutani, G.; Vodano, A.; Pastorelli, M. Photovoltaic solar systems for smart bus shelters in the urban environment of Turin (Italy). In Proceedings of the 2017 IEEE International Telecommunications Energy Conference (INTELEC), Osaka, Japan, 22–26 October 2017; pp. 20–25. [Google Scholar]
  16. Zhou, J.; Wu, Y.; Wu, C.; He, F.; Zhang, B.; Liu, F. A geographical information system based multi-criteria decision-making approach for location analysis and evaluation of urban photovoltaic charging station: A case study in Beijing. Energy Convers. Manag. 2020, 205, 112340. [Google Scholar] [CrossRef]
  17. CARRIS Indicadores de Atividade. Available online: http://www.carris.pt/pt/indicadores-de-atividade/ (accessed on 30 October 2017).
  18. Freitas, S.; Catita, C.; Redweik, P.; Brito, M.C. Modelling solar potential in the urban environment: State-of-the-art review. Renew. Sustain. Energy Rev. 2015, 41, 915–931. [Google Scholar] [CrossRef]
  19. Kanters, J.; Wall, M.; Kjellsson, E. The solar map as a knowledge base for solar energy use. Energy Procedia 2014, 48, 1597–1606. [Google Scholar] [CrossRef] [Green Version]
  20. Fu, P.; Rich, P.M. Design and implementation of the Solar Analyst: An ArcView extension for modeling solar radiation at landscape scales. In Proceedings of the Nineteenth Annual ESRI User Conference, San Diego, CA, USA, 26–30 July 1999; Volume 1, pp. 1–31. [Google Scholar]
  21. Hofierka, J.; Suri, M. The solar radiation model for Open source GIS: Implementation and applications. In Proceedings of the Open source GIS-GRASS Users Conference, Trento, Italy, 11–12 September 2002; Volume 2002, pp. 51–70. [Google Scholar]
  22. Brito, M.C.; Gomes, N.; Santos, T.; Tenedório, J.A. Photovoltaic potential in a Lisbon suburb using LiDAR data. Sol. Energy 2012, 86, 283–288. [Google Scholar] [CrossRef]
  23. Santos, T. Producing Geographical Information for Land Planning Using VHR Data: Local Scale Applications; LAP LAMBERT Academic Publishing GmbH & Co. KG: Saarbrücken, Germany, 2011; ISBN 978-3-8473-0460-9. [Google Scholar]
  24. Gomes, N.M.P. Integração de Dados LIDAR com Imagens de Muito Alta Resolução Espacial Para Determinação de Áreas Urbanas com Potencial Solar. Master’s Thesis, Universidade Nova de Lisboa, Lisboa, Portugal, 2011. [Google Scholar]
  25. Fogl, M.; Moudrý, V. Influence of vegetation canopies on solar potential in urban environments. Appl. Geogr. 2016, 66, 73–80. [Google Scholar] [CrossRef]
  26. Santos, T.; Freire, S. Testing the contribution of worldview-2 improved spectral resolution for extracting vegetation cover in urban environments. Can. J. Remote Sens. 2015, 41, 505–514. [Google Scholar] [CrossRef]
  27. Santos, T.; Tenedório, J.A.; Gonçalves, J.A. Quantifying the city’s green area potential gain using remote sensing data. Sustainability 2016, 8, 1247. [Google Scholar] [CrossRef] [Green Version]
  28. Benavente, F.; Lundblad, A.; Campana, P.E.; Zhang, Y.; Cabrera, S.; Lindbergh, G. Photovoltaic/battery system sizing for rural electrification in Bolivia: Considering the suppressed demand effect. Appl. Energy 2019, 235, 519–528. [Google Scholar] [CrossRef]
  29. Philipps, D.S.; Ise, F.; Warmuth, W.; Conferences, P.; GmbH, C. Photovoltaics Report; Fraunhofer Institute for Solar Energy Systems; ISE: Lausanne, Switzerland, 2020; p. 48. [Google Scholar]
  30. El-Geneidy, A.; Grimsrud, M.; Wasfi, R.; Tétreault, P.; Surprenant-Legault, J. New evidence on walking distances to transit stops: Identifying redundancies and gaps using variable service areas. Transportation 2014, 41, 193–210. [Google Scholar] [CrossRef]
  31. Roggema, R.; Roggema, A. (Eds.) Smart and Sustainable Cities and Buildings; Springer International Publishing: Cham, Switzerland, 2020; ISBN 978-3-030-37634-5. [Google Scholar]
  32. Gómez-Carmona, O.; Casado-Mansilla, D.; López-de-Ipiña, D. Multifunctional interactive furniture for smart cities. Proceedings 2018, 2, 1212. [Google Scholar] [CrossRef] [Green Version]
Figure 1. Location of the study area, Lisbon, Portugal (a), and the city’s land use land cover map (b).
Applsci 10 04801 g001
Figure 2. Datasets used for studying bus shelters’ photovoltaic (PV) potential: ortho-photo (a), bus stops and bus shelters (b) and Digital Surface Model (c).
Applsci 10 04801 g002
Figure 3. Solar resource analyses at the city scale and selection of the solar bus shelters.
Applsci 10 04801 g003
Figure 4. Tree map derived from the object-oriented classification of the ortho-photo for the whole city (a) and a neighborhood close-up (b).
Applsci 10 04801 g004
Figure 5. Map of the Global Radiation for the 21st December (a), and a neighborhood close-up (b).
Applsci 10 04801 g005
Figure 6. Misalignment between the bus shelter (a) and the solar map (b).
Applsci 10 04801 g006
Figure 7. The fraction of bus shelters as a function of a minimum Direct Irradiance Fraction.
Applsci 10 04801 g007
Figure 8. Low (a,b) and high (c,d) insolation bus shelters’ spatial distribution in Lisbon (e).
Applsci 10 04801 g008
Figure 9. Solar bus shelters with typified PV applications (a), and an interface station example (b).
Applsci 10 04801 g009
Figure 10. Evolution of the percentage of bus shelters according to LED power density and energy requirements.
Applsci 10 04801 g010
Figure 11. Solar bus shelter locations according to tourist and commuter use (a), and close-up view of a neighborhood (b).
Applsci 10 04801 g011
Figure 12. Solar bus shelter locations according to the PV applications and tourist (a) and commuter (b) preferences.
Applsci 10 04801 g012
Table 1. Cities with pilot solar-powered bus shelters.
City, CountryPV-Based SolutionsReference
Vancouver, CanadaLighting[4]
Tucson, USALighting[5]
Seattle, USALighting[5]
London, EnglandLighting and informative displays[6]
Paris, FranceInformative displays[7]
San Francisco, USALighting and informative displays[8]
Singapore, ChinaMobile charge[9]
Table 2. Solar bus shelters suitable for PV-typified applications.
Application ExamplePower (kW)Daily Energy Required (kWh/day)Bus Shelters
L1: Remote small-scale sensors<0.01<0.24612100%
L2: Non-refrigerated vending machine
L2: Small-scale info display up to 20″
0.01 < P < 0.050.24 < E < 1.243070%
L3: Small-scale info display up to 20 to 40″
L3: Ticket machine
0.05 < P < 0.11.2 < E < 2.415926%
L4: Refrigerated vending machine0.1 < P < 0.52.4 < E < 12234%
Table 3. Solar bus shelters according to estimated use.
Bus Stop/Rail Station DistancesBus SheltersUsers of Solar Bus Shelters
TouristsCommutersTourists and Commuters
400–800 m551374510333
>800 m61000
Table 4. Solar bus shelters scenarios based on the PV capability and the estimated use.
Users of Solar Bus Shelters
TouristsCommutersTourists and Commuters
PV applicationsL1 + L2:
Remote small-scale sensors/small scale info display up to 20′
261359231
L1 + L3:
Remote small-scale sensors/ticket machine
9212881
L1 + L4:
Remote small-scale sensors/refrigerated vending machine
212314
PV illumination10 W/m2 LED lamps144197128

