Article

Hybrid Forecasting Models Based on the Neural Networks for the Volatility of Bitcoin

1
Department of Mathematics, Yonsei University, 50 Yonsei-ro Seodaemun-gu, Seoul 03722, Korea
2
School of Liberal Arts, Seoul National University of Science and Technology, Seoul 01811, Korea
*
Author to whom correspondence should be addressed.
Appl. Sci. 2020, 10(14), 4768; https://doi.org/10.3390/app10144768
Submission received: 10 June 2020 / Revised: 7 July 2020 / Accepted: 9 July 2020 / Published: 10 July 2020
(This article belongs to the Special Issue Applied Machine Learning)

Abstract

:
In this paper, we study the volatility forecasts in the Bitcoin market, which has become popular in the global market in recent years. Since the volatility forecasts help trading decisions of traders who want a profit, the volatility forecasting is an important task in the market. For the improvement of the forecasting accuracy of Bitcoin’s volatility, we develop the hybrid forecasting models combining the GARCH family models with the machine learning (ML) approach. Specifically, we adopt Artificial Neural Network (ANN) and Higher Order Neural Network (HONN) for the ML approach and construct the hybrid models using the outputs of the GARCH models and several relevant variables as input variables. We carry out many experiments based on the proposed models and compare the forecasting accuracy of the models. In addition, we provide the Model Confidence Set (MCS) test to find statistically the best model. The results show that the hybrid models based on HONN provide more accurate forecasts than the other models.

1. Introduction and Review of Models

1.1. Introduction

Online transactions over the Internet have depended on trusted financial institutions, which are central players for safe transactions. Nakamoto [1] proposed Bitcoin as a digital currency to provide an easy method to perform online transactions. Bitcoin is a peer-to-peer crypocurrency system, where Bitcoin transactions occur with no central players. All Bitcoin transactions are verified by the nodes of the peer-to-peer networks and added to the blockchain as the Bitcoin ledger. The information of all historical transactions and all Bitcoin clients is stored in the blackchain. That is, Bitcoin transactions are recorded in the blockchain. The value of Bitcoin is not based on the economic condition in any country and depends on only the supply and demand of the network. Thus, Bitcoin has been utilized widely as a digital currency that can be exchanged for real products or services based on the Bitcoin market value. In fact, there are various digital currencies such as Ethereum, Ripple, Stellar, etc. However, we focus only on Bitcoin because the Bitcoin market capitalization is about 50% of the total estimated digital currency capitalization at present.
As the Bitcoin market has grown over the years, there have been many studies to analyze the Bitcoin market in recent years. Urquhart [2] studied the efficiency of Bitcoin market. In an efficient market, due to the random nature of unpredictable events, variations are random. To find the inefficiency, Urquhart employed a battery of highly powerful tests for randomness and found evidence of inefficiency. The high-frequency multifractal properties of Bitcoin were examined in [3]. Gajardo et al. [4] analyzed the asymmetric multifractal cross-correlations among stock market indices, commodities and Bitcoin. Yonghong et al. [5] also investigated the time-varying long-term memory in the Bitcoin market. Dyhrberg [6,7] showed that Bitcoin has a clear role in the market for portfolio management. Some researchers studied Bitcoin as an investment vehicle [8,9,10]. They found out that Bitcoin investment has characteristic features such as high average return and volatility. Although the volatilities of various financial indices have an important impact on the Bitcoin market, the most important factor that affects the high volatility of Bitcoin is the speculative behavior of users. In addition, there was a study on economic analyses of Bitcoin as a currency [11]. According to Iwamura et al. [11] and Yermack [12], Bitcoin may not be suitable as currency since Bitcoin has high volatility. Baur et al. [13] also showed that Bitcoin is used as a speculative investment due to high volatility and large returns. In practice, since the Bitcoin market has high volatility, the study on the volatility of Bitcoin has been very important. We focus on the volatility of Bitcoin in this paper. Specifically, we study the accurate methods for forecasting of Bitcoin volatility.
Many researchers have investigated the analysis and prediction of Bitcoin volatility recently. Baur and Dimpfl [14] analyzed asymmetric volatility effects for Bitcoin. Other studies attempted to show that Bitcoin volatility has some properties such as chaos, randomness, multi-fractality and long-range memory [15,16]. Additionally, there have been many studies on the forecasting of Bitcoin volatility. Balcilar et al. [17] studied the prediction of Bitcoin volatility with a quantile test based on the trading volume. Katsiampa [18] investigated several GARCH family models to find the best model for Bitcoin volatility and found that the AR-CGARCH is the optimal model. Chu et al. [19] provided the best fitting models based on GARCH models for volatilities of cryptocurrencies including Bitcoin. They fit 12 GARCH models to each cryptocurrency and found that IGARCH (1,1) model provides a good fit. Conrad et al. [20] used the GARCH-MIDAS model to improve the prediction of long-term Bitcoin volatility. However, GARCH models have limitations that are hard to capture complex fluctuation and nonlinear correlation of time series data. In order to overcome these limitations, many researchers have proposed the non-parametric forecasting methods based on machine learning approaches such as ANN for better forecasting of Bitcoin volatility [21,22,23].
Over the past few years, there have been various hybrid models based on ANN to improve the forecasting ability of the time series data. In particular, the hybrid models based on ANN and GARCH models have been proposed to improve forecast accuracy for the time-series data such as market indices, exchange rate, stock volatility, gold price, oil price and metal, etc. [24,25,26,27,28,29,30]. These results have shown that the hybrid models have an advantage compared to ANN models. The so-called ANN-GARCH models are the hybrid models that incorporate the GARCH forecasts as the explanatory variables to the ANN models and have been developed consistently by many researchers. For instance, Hajizadeh et al. [31] proposed two ANN-GARCH models to improve the forecasting performance of the S&P 500 index volatility. They used various input variables including financial indicators and the simulated volatility by GARCH models, and the proposed hybrid model with EGARCH model show better accuracy than the traditional GARCH models and ANN models. Kristjanpoller et al. [32] provided the methodology and the application for the volatility forecast of three Latin American stock indexes using a hybrid ANN-GARCH model. Lahmiri and Boukadoum [33] presented an ensemble system based on a hybrid EGARCH-ANN model which is trained with a different distributional assumption. In addition, Seo et al. [34] constructed the hybrid ANN-GARCH model with Google domestic trend and various activation functions for better forecasting accuracy of S&P 500 index volatility. In this paper, we also employ the ANN-GARCH models for accurate forecasting of the realized volatility of Bitcoin. Specifically, we develop ANN-GARCH models with HONN and Google trends (GT) data and compare the proposed models to find the best fitting model for Bitcoin volatility.
The contribution of this work is to find the optimal hybrid model for forecasting Bitcoin’s volatility. To present our result, this paper is structured as follows. In the next subsection, we review the models used in this paper. In Section 2, we describe the data used for the proposed hybrid models. In Section 3, we construct efficient hybrid models and provide the results of the experiments by the proposed models. In Section 4, we present the concluding remarks.

1.2. Review of Models

In this section, we introduce GARCH family models used to construct our hybrid models. More specifically, we review the GARCH model, EGARCH model and GJR-GARCH model. The forecasts by GARCH family models are used as the explanatory variables to ANN. We also review ANN model and HONN model with various activation functions used in this paper.

1.2.1. GARCH Model

The ARCH model proposed by Engle [35] was the first model with the conditional distribution to describe the fat tail characteristics or the volatility clustering properties of time series. However, the ARCH model has computational problems when a large number of parameters are needed for a high order model. To solve these problems, Bollerslev [36] proposed the GARCH model, which is one of the most popular models for forecasting the volatility of time series. Since the GARCH models include the conditional variance terms as well as the squared residual terms, the models can predict the volatility well by using a sum of weighted products of the predicted variance from the past.
The GARCH ( p , q ) model is defined as the follows.
y t 2 = w + i = 1 q α i ε t i 2 + i = 1 p β i y t i 2 ,
where ε t = y t Z t , { Z t } is a sequence of independent and identically distributed random variables with zero mean and unit variance, { ε t } is a sequence of the error terms, the positive parameters α i and β i satisfy the condition i = 1 q α i + i = 1 p β i < 1 for the stability of the GARCH model. This condition ensures that the conditional variance y t has nonnegative values and finite expected value. Here, w, α i and β i are the estimated parameters by using maximum likelihood estimation.

1.2.2. EGARCH Model

The exponential GARCH (EGARCH) model proposed by Nelson [37] allows negative parameters unlike the GARCH model. That is, the parameters of the model have no restrictions to ensure the non-negativity of the volatility. This model can describe the volatility leverage effect which reflects the asymmetric impacts and captures asymmetric behavior of the time series.
The EGARCH ( p , q ) model is defined as follows.
log y t 2 = w + i = 1 q α i | ε t i | y t i 2 π + γ ε t i y t i + i = 1 p β i log y t i 2 ,
where α i with no restrictions captures the volatility clustering effect, β i measures the persistence in conditional volatility irrespective of the events in the market and γ measures the asymmetric leverage coefficient to describe the leverage effect of volatility. α i , β i and γ are parameters to be estimated.

1.2.3. GJR-GARCH Model

The GJR-GARCH model proposed by Glosten et al. [38] is one of nonlinear GARCH family models to allow for asymmetry effects by integrating a dichotomous variable into the GARCH model. This model allows the larger impact of negative shocks to have a more distinct impact on volatility than a positive impact. The model also presented improved forecasting ability [39].
The conditional variance of GJR-GARCH ( p , q ) model is defined as follows.
y t 2 = w + i = 1 q α i + γ i 1 { ε t i < 0 } ε t i 2 + i = 1 p β i y t i 2 ,
where
1 { · } = 1 , ε t i < 0 , 0 , ε t i 0 ,
and
w 0 , p 0 , q 0 , α i 0 , β i 0 , α i + γ i 0 and i = 1 p α i + i = 1 q β i + 2 i = 1 q γ i < 1 .
where α i and β i are similar to the coefficients in the EGARCH model, and γ i means the asymmetric leverage coefficient. The parameters w , α i , β i and γ i are estimated by the maximum likelihood approach.

1.2.4. Artificial Neural Network (ANN)

ANN is one of the nonparametric nonlinear models which are used widely to overcome the limitations of the linear models in machine learning. ANN is constructed appropriately based on the characteristics extracted from the real data and has no hypothesis about the underlying model. ANN also has at least three layers (input layer, hidden layer, output layer). ANN with single hidden layer used for forecasting is illustrated in Figure 1.
The output result from input layer and hidden layer is generally as follows.
output = f i = 0 n x i w i ,
where x i and w i represent the set of input data from node i and the weight associated with the connection to the node i, and f is one of the activation functions. The activation functions used in this paper are presented in Table 1. The sigmoid function shows high sensitivity to small changes in input variables. This property provides a good classifier. The hyperbolic tangent function (Tanh) has an advantage over the sigmoid function. Since the derivative of the function is steeper, it will have faster learning and grading. In addition, it is well known that the Rectified Linear Unit (ReLU) is a good estimator and show very efficient calculation when all neurons are activated in the same manner. Exponential Linear Unit (ELU) provides fast learning because ELU shrinks the difference between the unit natural gradient and the normal gradient.
The main work of ANN is to find the optimal weights for better performance using the activation functions. We use the back-propagation method to obtain the weights. We also carry out many experiments with four activation functions to find the best forecasting model.

1.2.5. Higher Order Neural Network (HONN)

HONN proposed by Giles and Maxwell [40] has been widely used to simulate the higher-order nonlinear inputs and to provide some basis for the simulations as ‘open box’ [41]. Because first-order networks do not take advantage of meaningful relationships between the input variables, the networks need a lot of training passes with a large training set. To improve this disadvantage, HONN has been developed. In general, with the selection of good input variables, it is known that HONN provides better forecasting performance than the classic ANN.
In Equation (4), the independent variable is presented as the linear combination. Specifically, the variable is expressed by multiplying each input variable ( x i ) by a weight ( w i ) and adding the results. We can easily make out the higher-order terms of the inputs from the first-order terms. Here, we consider the second order HONN to improve the volatility forecasting. Let us define the input vector x and the weight vector w by
x = [ x 0 , x 1 , , x n ] and w = [ w 0 , w 1 , , w n ] ,
respectively. Then the input vector x h and the weight vector w h in HONN are given by
x h = [ x 0 , x 1 , , x n , x 0 2 , x 0 x 1 , x 0 x 2 , , x n 1 x n , x n 2 ] and w h = [ w 0 , w 1 , , w n , w 00 , w 01 , w 02 , , w n 1 n , w n n ] ,
respectively. From these vectors, the output with the activation functions f can be calculated as follows.
output = f w h · x h = f i = 0 n w i x i + i = 0 n j = i n w i j x i x j .
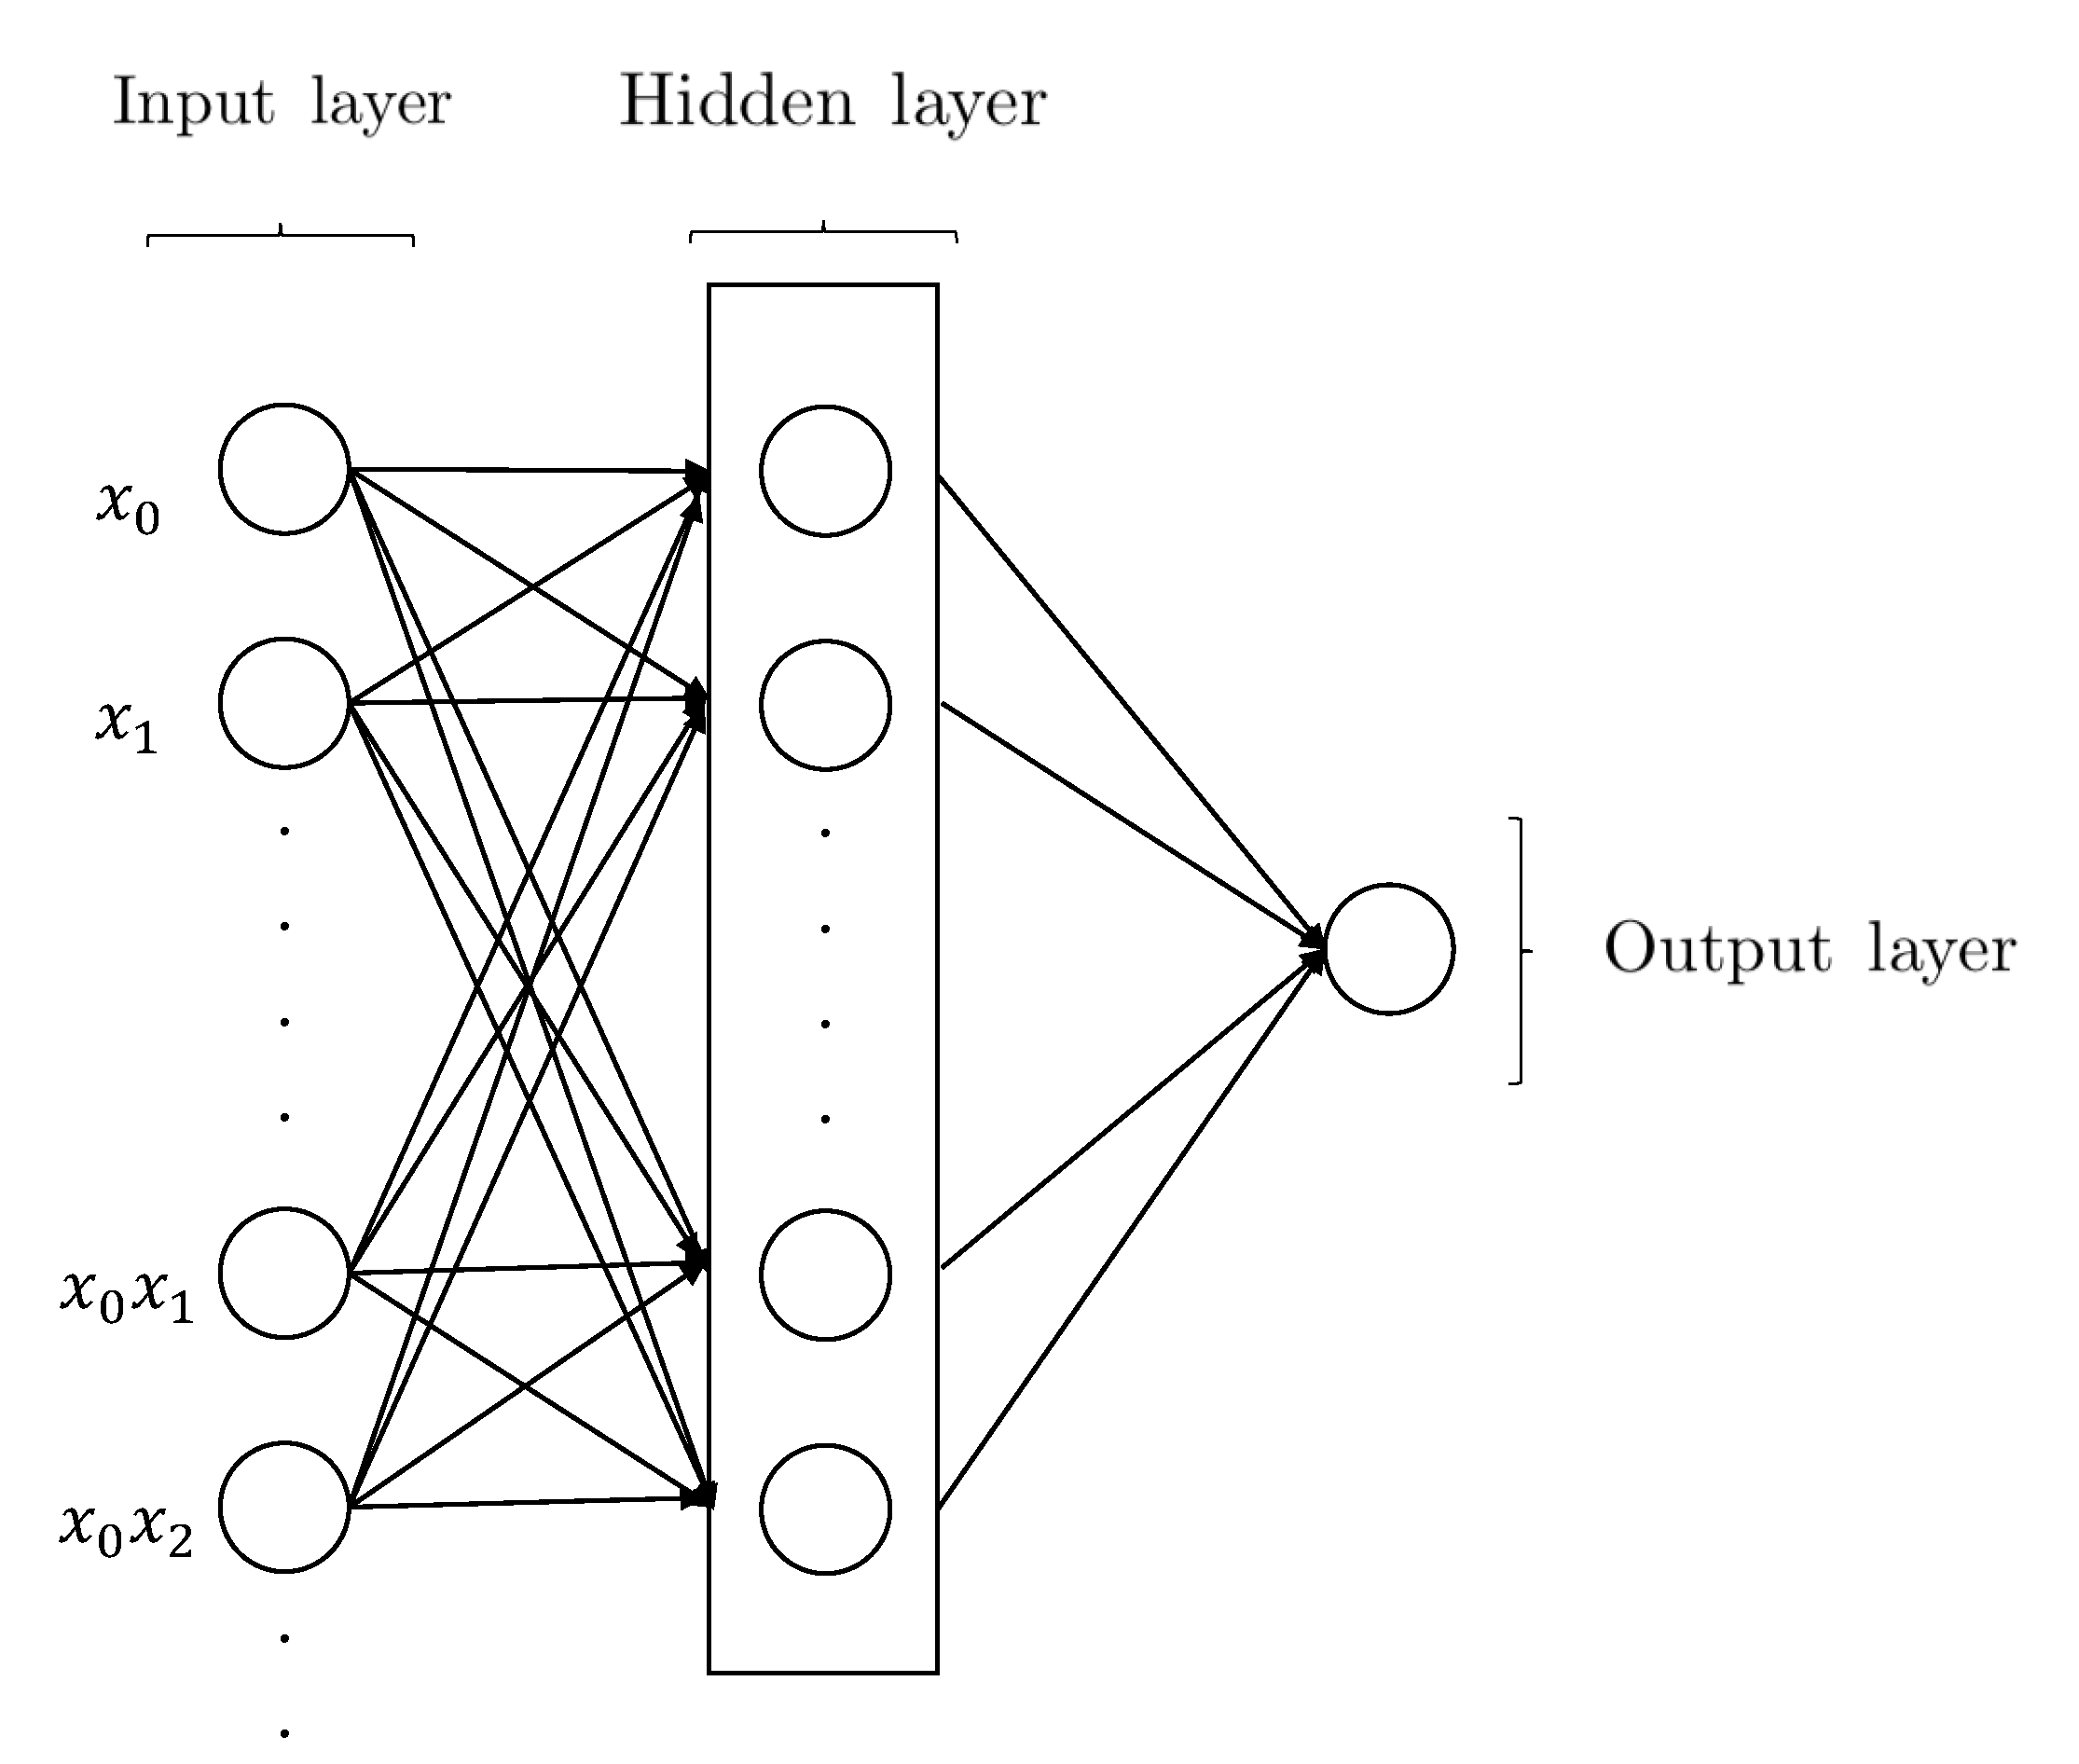
The structure of a second-order HONN used in this paper is illustrated in Figure 2. We construct the hybrid models based on this second-order HONN for the accurate forecasting.

2. Material and Methods

The time series data analyzed in this paper were the daily historical prices of Bitcoin over the period between 1 January 2012 and 30 November 2019. The data were downloaded from the website (https://bitcoincharts.com/). To define the volatility of Bitcoin price, the closing prices p t at time t are transformed into log return r t = log p t log p t 1 . The realized volatility of Bitcoin was computed as the variance of r t , and the realized volatilities in a 5-day window as weekly volatilities are used to analyze the volatility of Bitcoin in this paper. Then, the realized volatility ( R V t ) of Bitcoin at time t is computed as
R V t = 1 5 i = t + 1 t + 5 ( r i r ¯ t ) 2 ,
where r ¯ t is mean of r t during 5 days after time t.
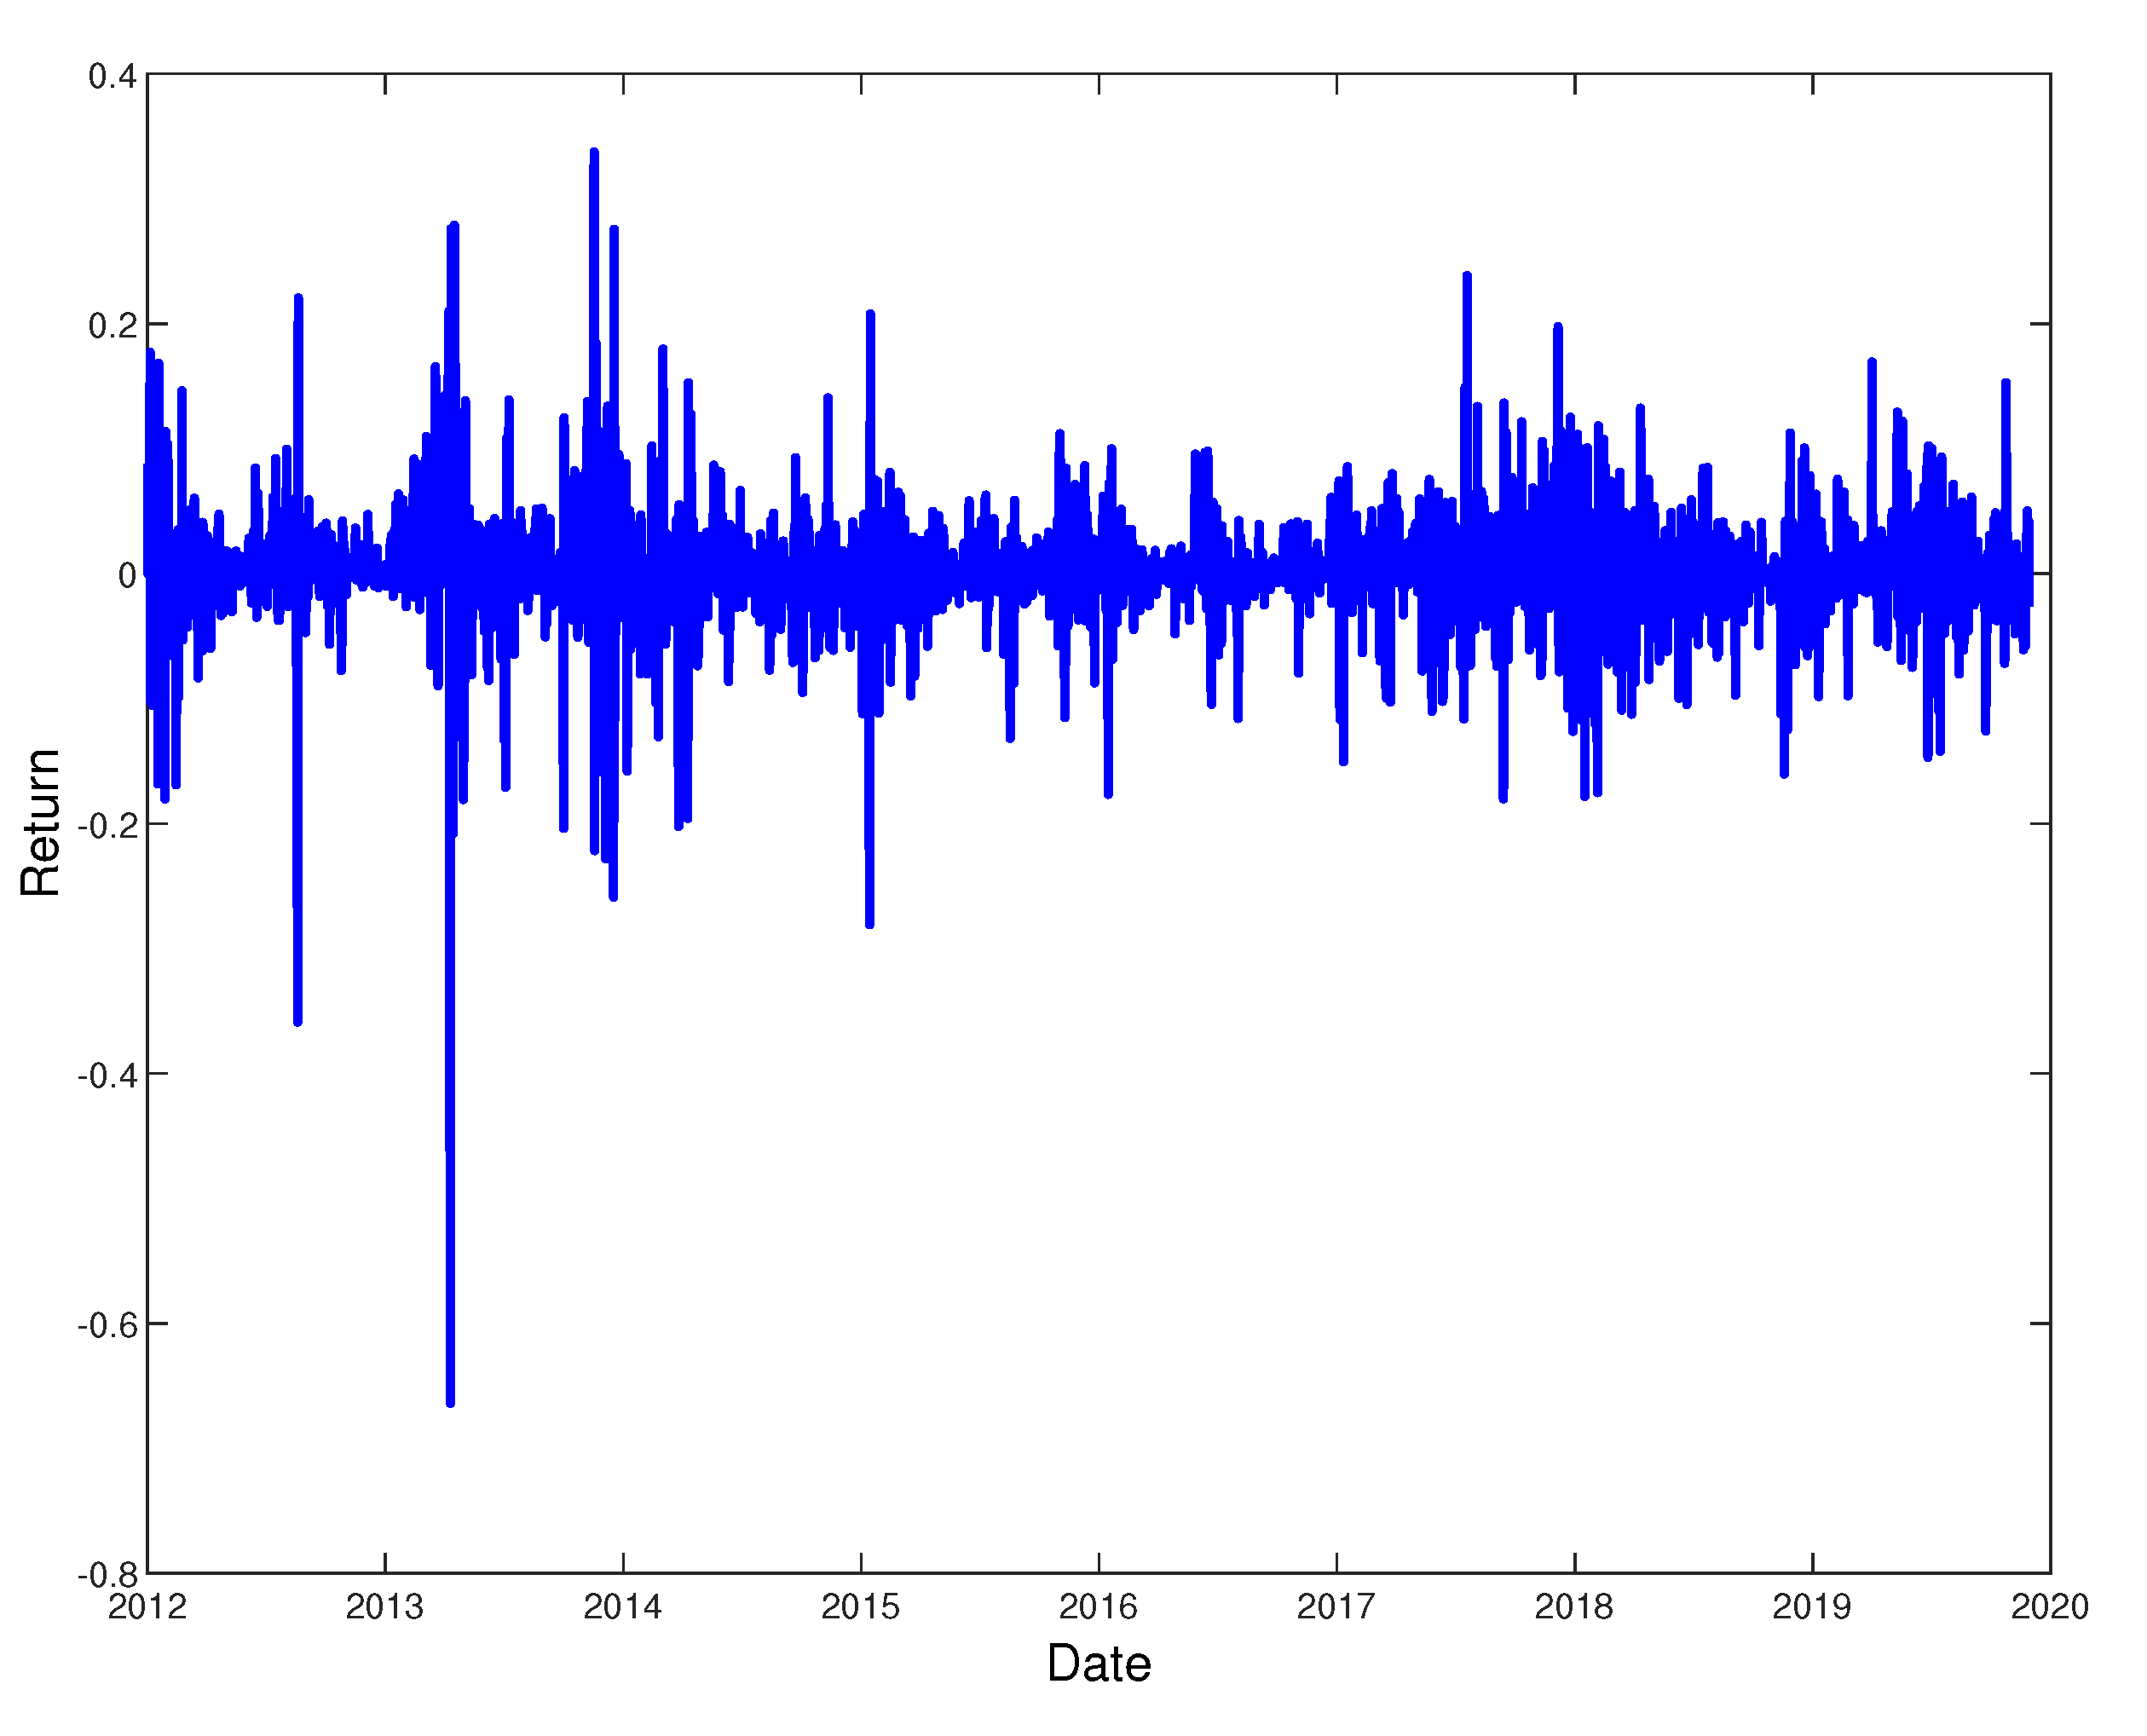
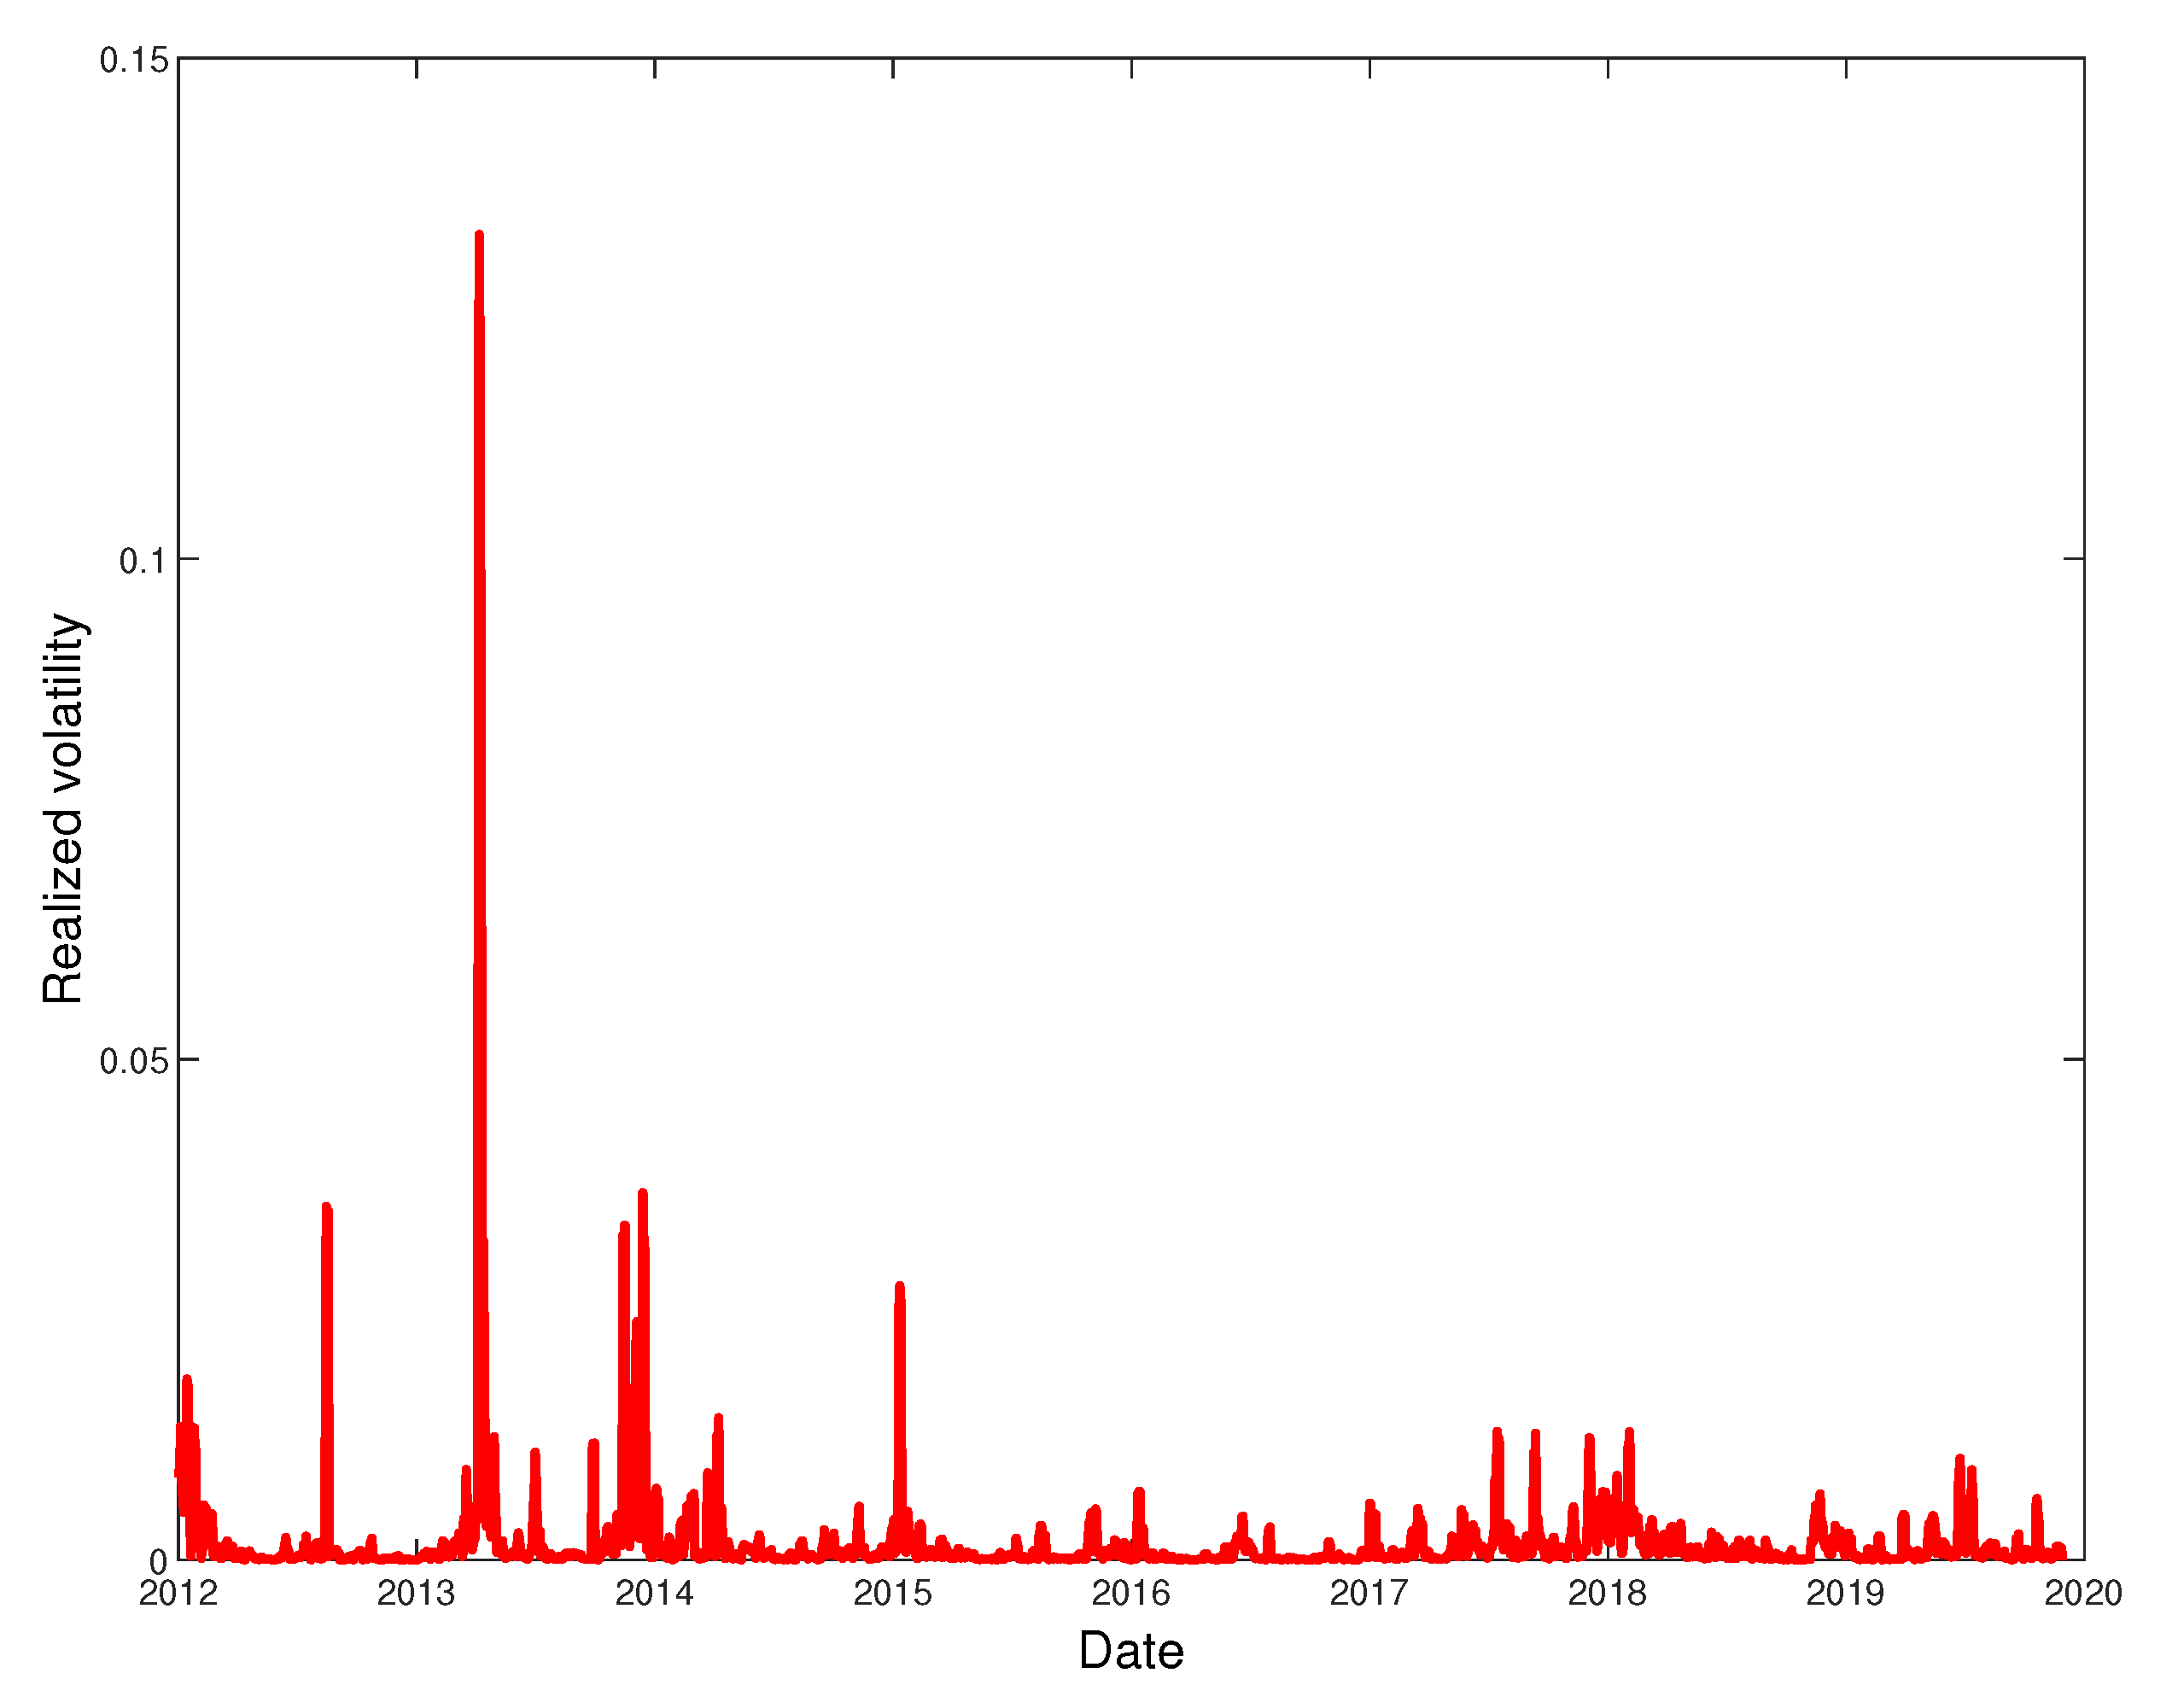
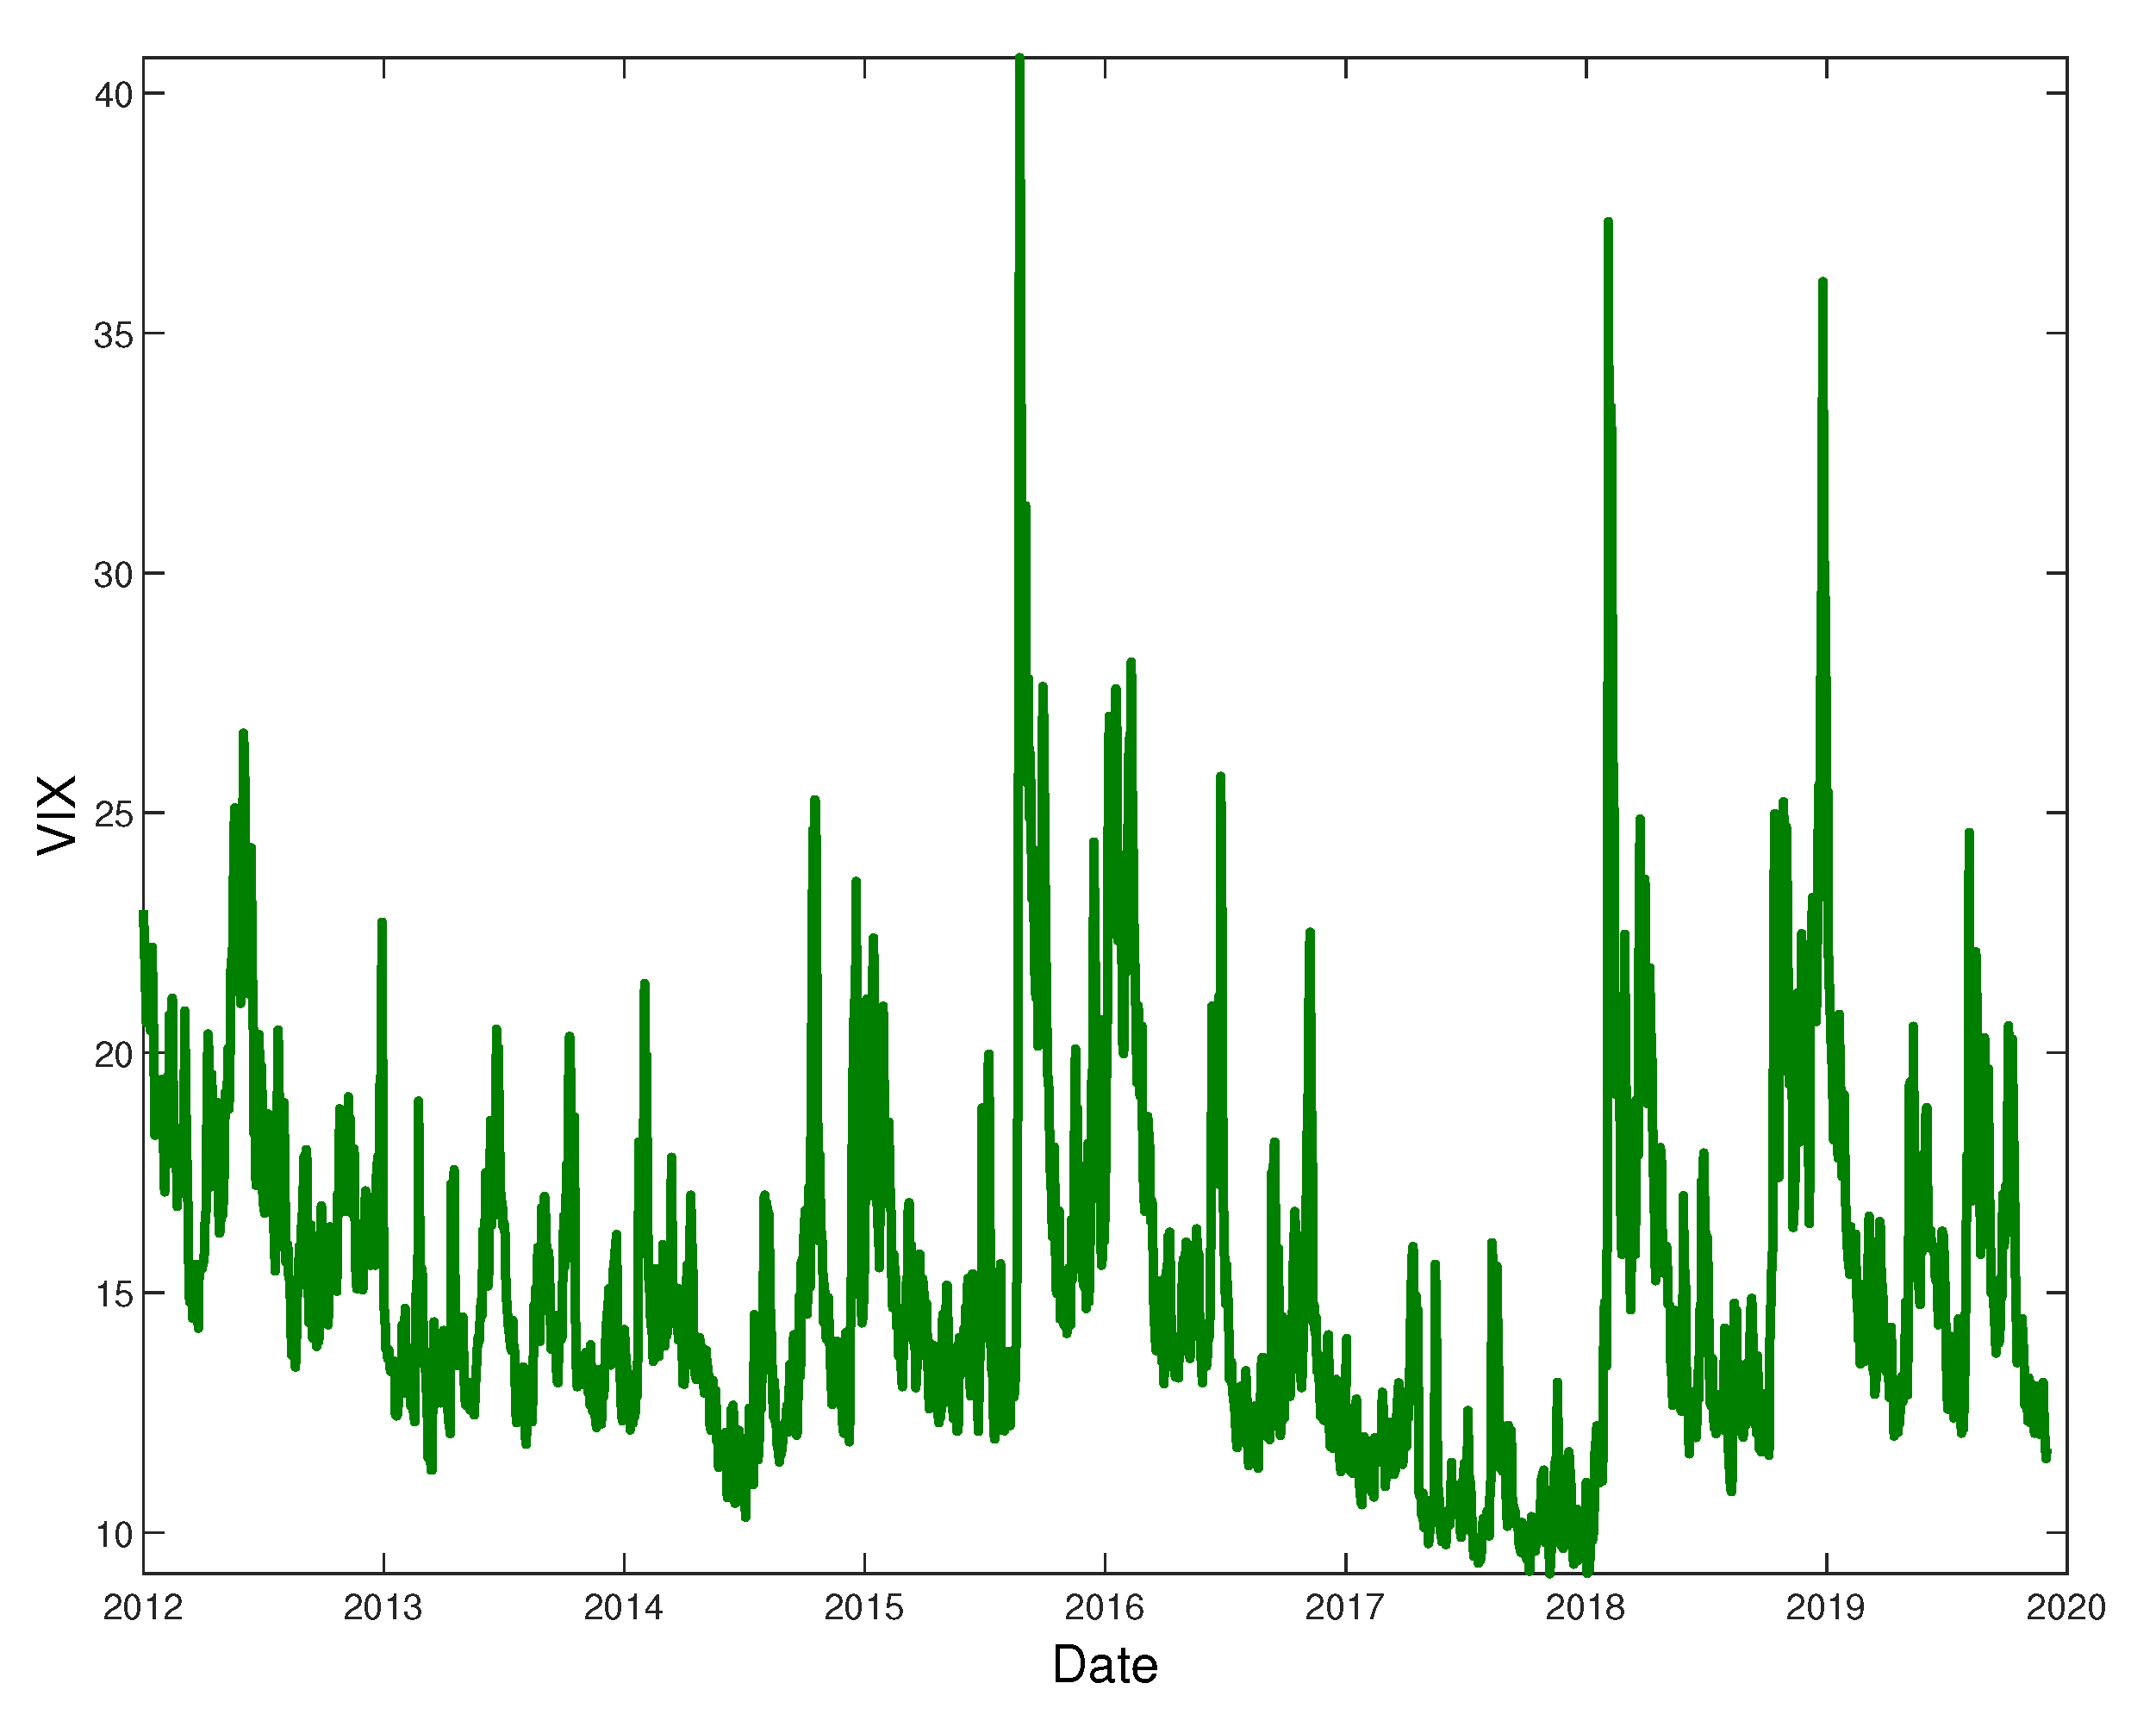
In order to improve the accuracy of the volatility forecast, the selection of the input data which influence on the volatility of Bitcoin is very important. In this paper, we consider the GT data and VIX data as the explanatory variables. GT is the data that presents the popularity of search queries related to various sectors in Google. In fact, GT data has been used as explanatory variables in the ANN to forecast of the financial time series by many researchers [34,42,43,44]. We used ‘Bitcoin’ GT data as the input variable, which is a good measure to describe the Bitcoin market [45]. VIX index introduced the Chicago Board Options Exchange (CBOE) in 2004 extrapolates the future volatility from the liquid options written on the S&P 500 and is calculated as the square root of the risk-neutral expectation of the 30 days variance of the S&P 500 return which is estimated by the forward option price expiring in 30 days. From the previous works [46,47], we can find the significant relationship between the VIX index and Bitcoin. Thus, we choose the VIX index as the input data to the ANN-based on the researches. Specifically, 5-days moving averages of VIX index and GT data are used as the input data. In Figure 3, the time series of log return r t of Bitcoin price are displayed. Figure 4 and Figure 5 illustrate the realized volatility of bitcoin price and VIX index, respectively.
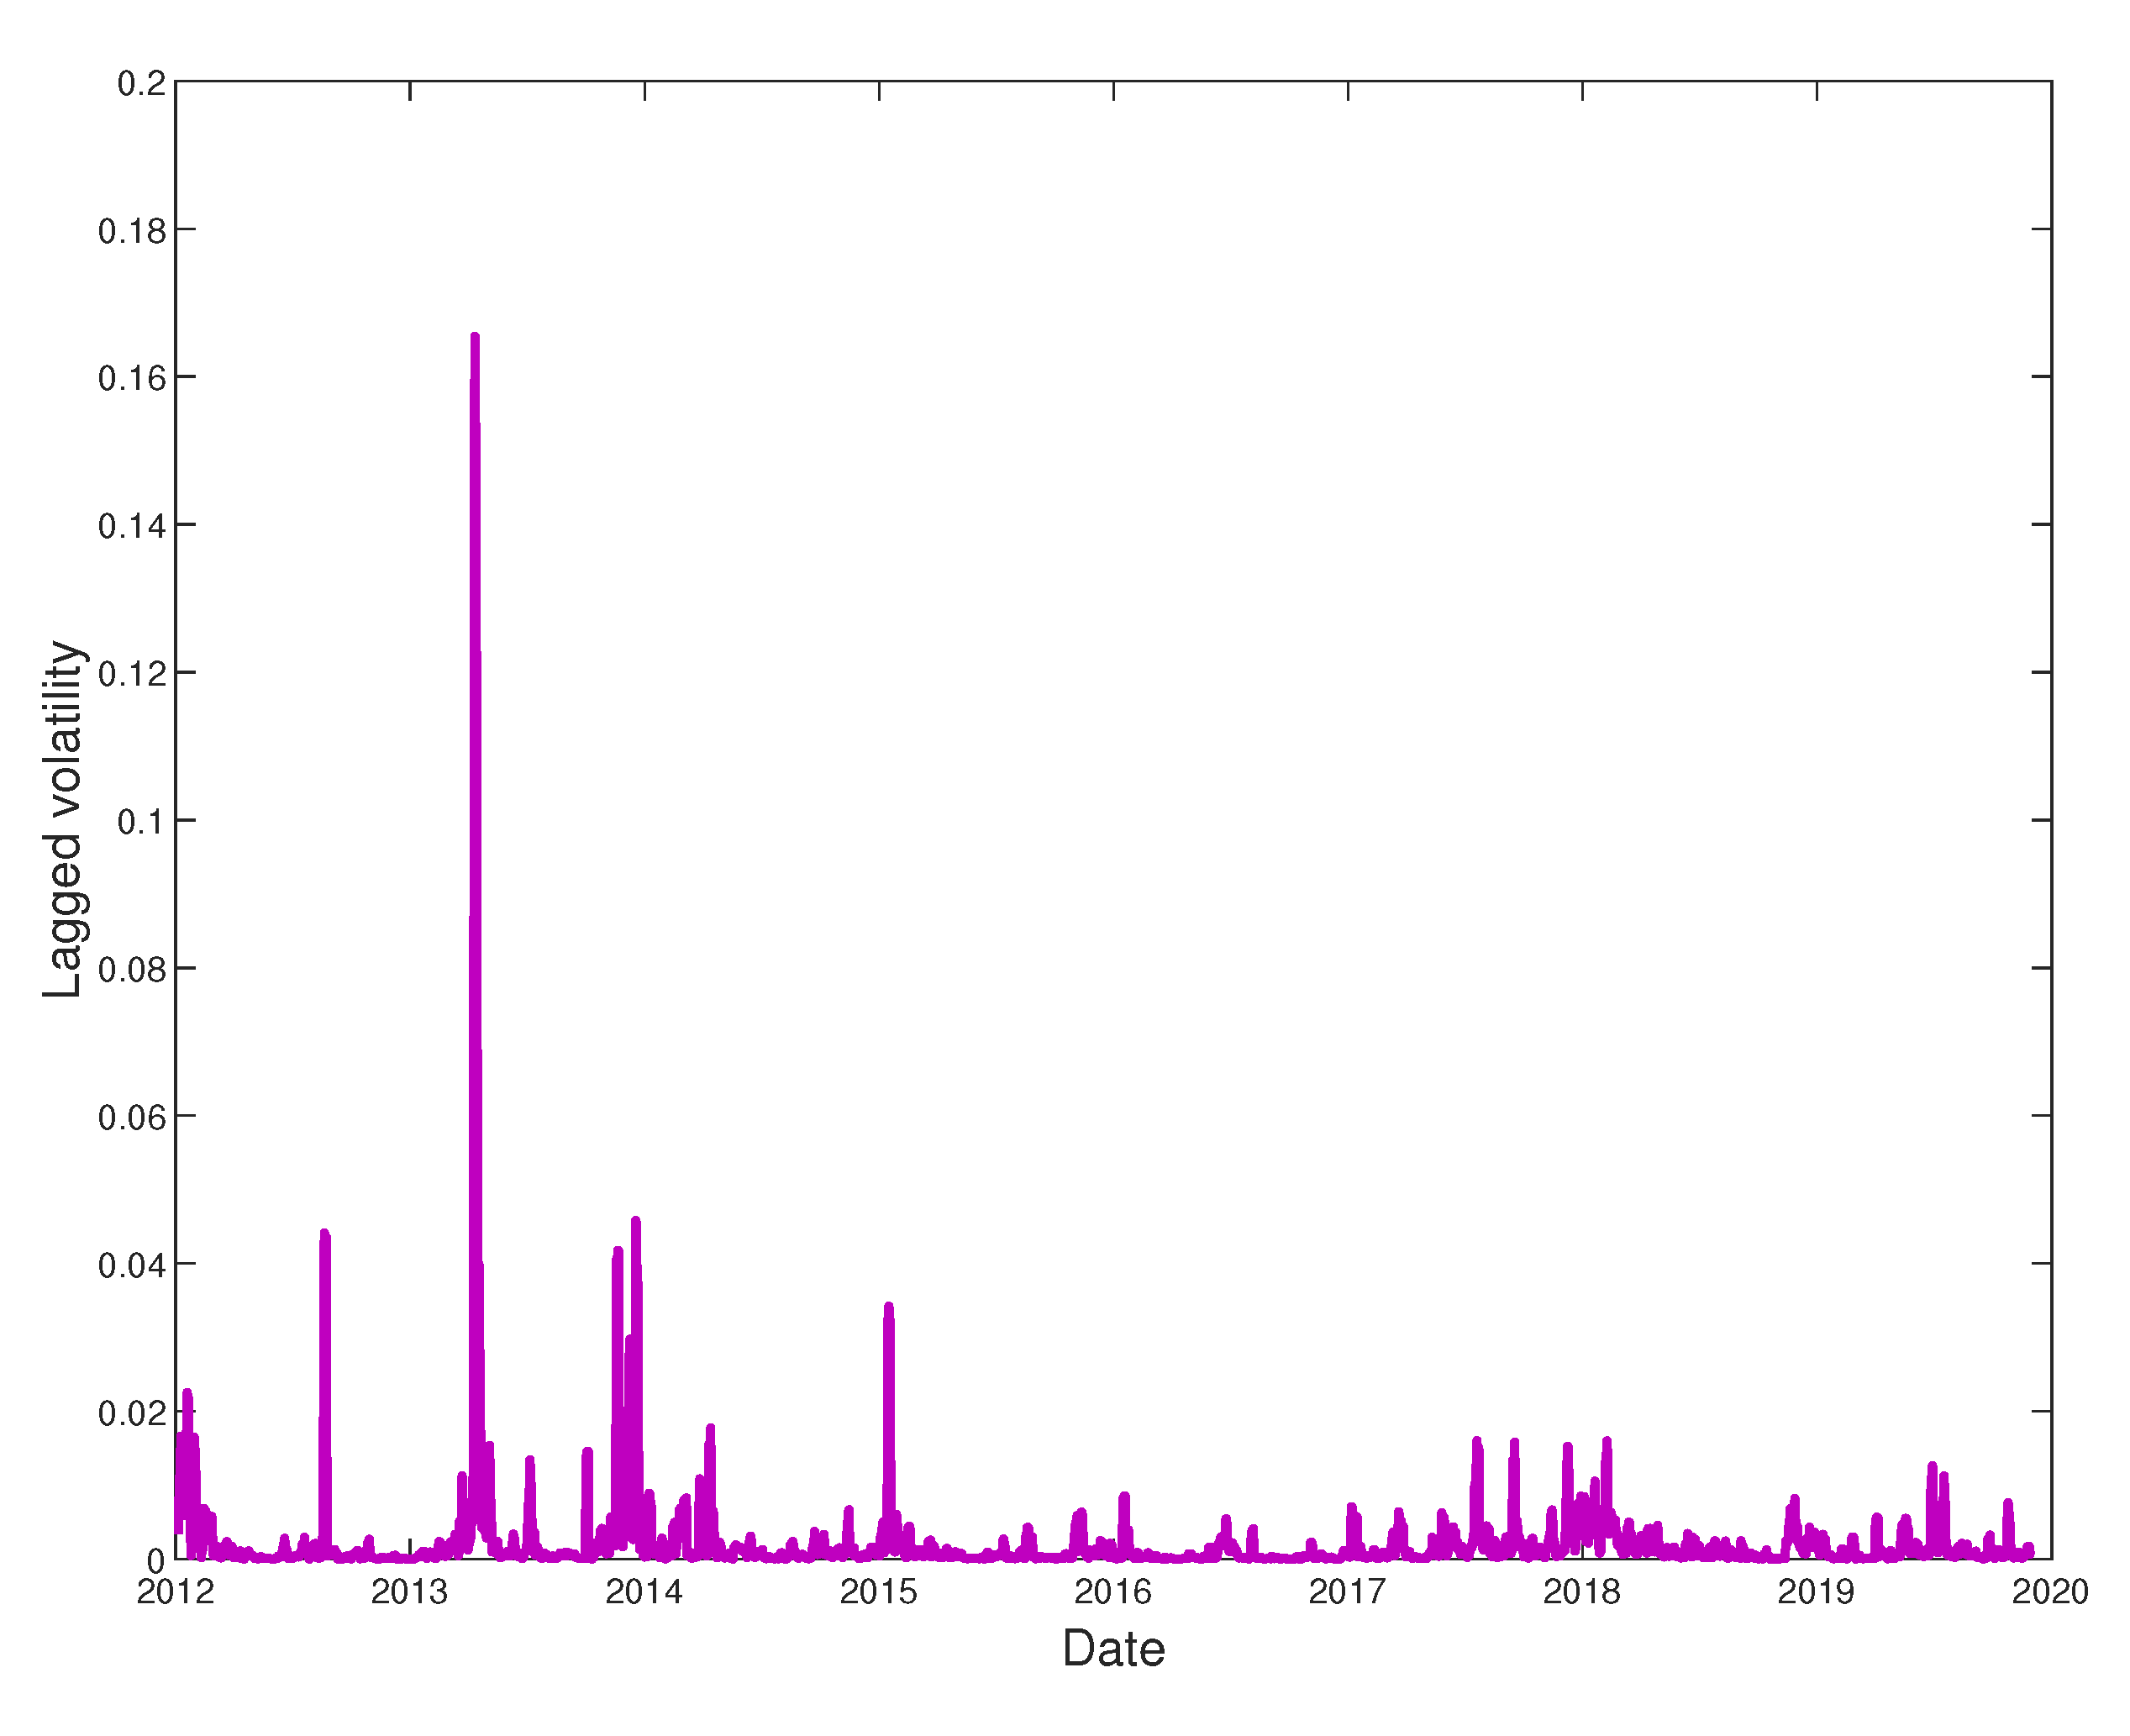
In order to construct a more accurate model for forecasting of Bitcoin volatility, we use the 1-day lagged weekly volatility ( L V t ) as the endogenous variable and the outputs of GARCH family models as the exogenous variables. In other words, L V t and GARCH family outputs are used as the input variables to improve the forecasting ability of the hybrid model. Here, the outputs of the GARCH models introduced in the previous section are used, and L V t is calculated by
L V t = 1 5 i = t 1 t 5 ( r i r ¯ t ) 2 .
Note that days in windows of L V t have no intersection with 5 days in windows of R V t . L V t is displayed in Figure 6. In this study, 80% of the data set (in-sample: 2012.01.01–2018.04.30) are used for training, and 20% (out-of-sample: 2018.05.01–2019.11.30) of the data set are used for testing. All experiments are implemented using Python 3. Additionally, we utilize three measures to compare the performance of the proposed models. These measures are the mean absolute error (MAE), the root mean square error (RMSE) and the mean absolute percentage error (MAPE) and as follows.
MAE = 1 n t | σ t ^ R V t | , RMSE = 1 n t ( σ t ^ R V t ) 2 1 / 2 , MAPE = 1 n t σ t ^ R V t R V t ,
where σ t ^ is the predicted volatility of Bitcoin and n is the number of the predicted data. Obviously, the lower values of the measures, the better accuracy of the model. For more details, see [48].

3. Hybrid Models and Results

In this paper, we propose several hybrid models based on GARCH family models, ANN and HONN to find a more accurate model for forecasting of Bitcoin volatility. Specifically, the hybrid models are constructed with the ANN by using the selected GARCH models and the selected explanatory variables. The models are implemented by the ANN with a single hidden layer and various neurons using the back-propagation method and classified according to whether including the explanatory variables or not. The proposed models are used for 1-day ahead forecast of weekly realized volatility, and then the best model is determined by comparing the results.
We compare the proposed models to find the best volatility forecasting model in the bitcoin market. We first forecast the volatility of Bitcoin price using the classic GARCH family models. Concretely, we use GARCH, EGARCH and GJR-GARCH model among the GARCH family models and the ( p , q ) parameters ranging from (1,1) to (3,3). In order to find the optimal GARCH model for the hybrid model, we provide AIC and BIC values in Table 2 and three measures to compare the performances of the models for forecasting volatilities in Table 3. According to the results in Table 2 and AIC and BIC criteria, EGARCH(3,3) model is the best model. On the other hand, according to the results in Table 3, we can see that the GJR-GARCH(1,1) model performs the best among the introduced GARCH family models.
Other models except for the classic GARCH models are based upon the ANN approach or the HONN approach. In other words, the models are constructed by using the selected input variables to ANN or HONN. Similar to [31,34], we propose the ANN-GARCH models for the forecasting of the Bitcoin volatility using the outputs of the GARCH family models. Specifically, we define the GT-GARCH model and GT-VIX-GARCH model according to the input variables. The input variables of the models are in Table 4. In order to find the optimal number of nodes in the hidden layer and the activation function for the models, we carry out the experiments using the Adam optimizer method [49] to update the network weights. The results are indicated with four activation functions in Table 5 and Table 6. As shown in Table 5 and Table 6, two measures (MAE, RMSE) show that the GT-GARCH model is better than the GT-VIX-GARCH model, and one measure (MAPE) shows a different result. From these results, we can not find a significant performance difference between the GT-VIX-GARCH model and the GT-GARCH model. That is, we conclude that two models may have a similar predictive ability. To improve the accuracy of the model, we adopt the HONN approach. Specifically, we propose three types of hybrid models (GT-H model, GT-VIX-H model, GT-VIX-GARCH-H model) based on the HONN.
Table 7, Table 8 and Table 9 are presented the results of the models based on the HONN. To examine well the proposed models based on the HONN, we present a summary of the input variables of each model in Table 10. In Table 10, ‘ L V t ’ is in Equation (6), ‘GT’ means Google trends data, ‘VIX’ means VIX index data, ‘GJR-GARCH(1,1)’ means forecast by GJR-GARCH(1,1) and ‘EGARCH(3,3)’ means forecast by EGARCH(3,3). Table 7 and Table 8 present the results of the HONN model without the outputs of GARCH models as shown in Table 10. We can see that MAE and MAPE in Table 7 and Table 8 increase in all cases as compared to the values in Table 5 and Table 6. That is, GT-H model and GT-VIX-H model do not show better performance compared to the models based on the ANN. To improve the model, we adopt the HONN model with the outputs of GARCH family models. Among the introduced GARCH models, we chose GJR-GARCH(1,1) and EGARCH(3,3) from the results in Table 2 and Table 3. By using the outputs of GJR-GARCH(1,1) and EGARCH(3,3) as input variables in the HONN, we finally construct and propose a new type of hybrid model (GT-VIX-GARCH-H model) for better forecasting of Bitcoin volatility.
Table 9 shows the results of three performance measures obtained by the GT-VIX-GARCH-H model. We can see the improvement in forecasting accuracy in Table 9. The results in Table 9 show that the hybrid models with selected GARCH models based on the HONN model for volatility forecasting of Bitcoin reduce the performance measures (MAE, RMSE, MAPE). That is, in all cases, the measures decrease compared to the measures of the other models. More specifically, compared to the GJR-GARCH(1,1) forecast, MAE is reduced by 11 %, MAPE is reduced by 30 %. Furthermore, we analyze the robustness of our results to determine whether the proposed models are statistically significant. For the analysis, we apply the MCS test [50] to GT-VIX-GARCH-H models. The detailed results of the MCS test, which can be interpreted as a level of confidence for the forecasts, are presented in Table 11. According to the results in Table 11, we can find that the GT-VIX-GARCH-H model with the Relu function and 30 nodes, which has the lowest MAE, is the best model for forecasting of Bitcoin volatility.

4. Concluding Remarks

We develop the models based on the neural networks for forecasting volatility of Bitcoin price in this paper. Specifically, we propose several hybrid models to improve the forecasting and conduct more than 10,000 experiments to find the optimized model. We investigate as follows. Firstly, we construct the ANN-GARCH models with 1-day lagged volatility, Google Trends, VIX and outputs of GARCH models based on the previous works. Secondly, we propose the new hybrid models which incorporate the outputs of GARCH models as input to HONN model. HONN model, which use the linear combinations of the variables as the input variables, is efficient and performs generally better than the classic ANN mode when the number of good input variables for the ANN model is small. In fact, most of the proposed hybrid models show good performances with no statistical difference, but we focus on finding the best forecasting model for Bitcoin’s volatility.
In order to find the best model among the proposed models, we carry out many experiments changing the activation functions and the number of nodes. We also adopt three performance measures to compare the forecasting accuracy of the proposed models. Consequently, the hybrid models based on the HONN model which can capture higher-order correlations in input variables show the improved performance for forecasting of Bitcoin volatility. Compared to the best GARCH model, the best GT-VIX-GARCH-H model improves by 11%, 2.2% and 30% for MAE, RMSE and MAPE, respectively. In addition, compared to the best ANN-GARCH model, the best GT-VIX-GARCH-H model improves by 2.2%, 2.5% and 3.9% for MAE, RMSE and MAPE, respectively. In other words, these results show that the hybrid models based on the HONN model provide more accurate forecasting results and are appropriate for forecasting of volatility in the Bitcoin market.

Author Contributions

G.K. designed the experiments; M.S. collected and analyzed the data; M.S. and G.K. contributed analysis tools; M.S. and G.K. wrote the paper. All authors have read and agreed to the published version of the manuscript.

Funding

This work is supported by the National Research Foundation of Korea grant funded by the Korea government (No. NRF-2017R1E1A1A03070886).

Conflicts of Interest

The authors declare no conflict of interest.

References

  1. Nakamoto, S. Bitcoin: A Peer-to-Peer Electronic Cash System; ReadLiberty.Org: Chicago, IL, USA, 2008. [Google Scholar]
  2. Urquhart, A. The inefficiency of Bitcoin. Econ. Lett. 2016, 148, 80–82. [Google Scholar] [CrossRef]
  3. Stavroyiannis, S.; Babalos, V.; Bekiros, S.; Lahmiri, S.; Uddin, G.S. The high frequency multifractal properties of Bitcoin. Physica A 2019, 520, 62–71. [Google Scholar] [CrossRef]
  4. Gajardo, G.; Kristjanpoller, W.D.; Minutolo, M. Does bitcoin exhibit the same asymmetric multifractal cross-correlations with crude oil, gold and DJIA as the Euro, Great British Pound and Yen. Chaos Solitons Fractals 2018, 109, 195–205. [Google Scholar] [CrossRef]
  5. Yonghong, J.; He, N.; Weihua, R. Time-varying long-term memory in Bitcoin market. Financ. Res. Lett. 2018, 25, 280–284. [Google Scholar]
  6. Dyhrberg, A.H. Bitcoin, gold and the dollar–a garch volatility analysis. Financ. Res. Lett. 2016, 16, 85–92. [Google Scholar] [CrossRef] [Green Version]
  7. Dyhrberg, A.H. Hedging capabilities of bitcoin. is it the virtual gold? Financ. Res. Lett. 2016, 16, 139–144. [Google Scholar] [CrossRef] [Green Version]
  8. Marie, B.; Kim, O.; Ariane, S. Virtual currency, tangible return: Portfolio diversification with bitcoin. J. Asset Manag. 2015, 16, 365–373. [Google Scholar]
  9. Hong, K. Bitcoin as an alternative investment vehicle. Inf. Technol. Manag. 2017, 18, 265–275. [Google Scholar] [CrossRef]
  10. Chuen, D.L.K.; Guo, L.; Wang, Y. Cryptocurrency: A new investment opportunity? J. Altern. Invest. 2017, 20, 16–40. [Google Scholar] [CrossRef]
  11. Iwamura, M.; Kitamura, Y.; Matsumoto, T.; Saito, K. Can we stabilize the price of a Cryptocurrency?: Understanding the design of Bitcoin and its potential to compete with Central Bank money. Hitotsub. J. Econ. 2019, 60, 41–60. [Google Scholar] [CrossRef] [Green Version]
  12. Yermack, D. Is Bitcoin a Real Currency? An Economic Appraisal. In Handbook of Digital Currency; Academic Press: Cambridge, MA, USA, 2015; pp. 31–44. [Google Scholar]
  13. Baur, D.G.; Hong, K.H.; Lee, A.D. Bitcoin: Medium of exchange or speculative assets? J. Int. Financ. Mark. Inst. Money 2018, 54, 177–189. [Google Scholar] [CrossRef]
  14. Baur, D.G.; Dimpfl, T. Asymmetric volatility in cryptocurrencies. Econ. Lett. 2018, 173, 148–151. [Google Scholar] [CrossRef]
  15. Lahmiri, S.; Bekiros, S. Chaos, randomness and multi-fractality in bitcoin market. Chaos Solitons Fractals 2018, 106, 28–34. [Google Scholar] [CrossRef]
  16. Lahmiri, S.; Bekiros, S.; Salvi, A. Long-range memory, distributional variation and randomness of bitcoin volatility. Chaos Solitons Fractals 2018, 107, 43–48. [Google Scholar] [CrossRef]
  17. Balcilar, M.; Bouri, E.; Gupta, R.; Roubaud, D. Can volume predict Bitcoin returns and volatility? A quantiles-based approach. Econ. Model 2017, 64, 74–81. [Google Scholar] [CrossRef] [Green Version]
  18. Katsiampa, P. Volatility estimation for bitcoin: A comparison of GARCH models. Econ. Lett. 2017, 158, 3–6. [Google Scholar] [CrossRef] [Green Version]
  19. Chu, J.; Chan, S.; Nadarajah, S.; Osterrieder, J. GARCH modelling of cryptocurrencies. J. Risk Financ. Manag 2017, 10, 17. [Google Scholar] [CrossRef]
  20. Conrad, C.; Custovic, A.; Ghysels, E. Long-and Short-Term Cryptocurrency Volatility Components: A GARCH-MIDAS Analysis. J. Risk Financ. Manag. 2018, 11, 23. [Google Scholar] [CrossRef]
  21. Kristjanpoller, W.; Minutolo, M.C. A hybrid volatility forecasting framework integrating GARCH, artificial neural network, technical analysis and principal components analysis. Expert Syst. Appl. 2018, 109, 1–11. [Google Scholar] [CrossRef]
  22. Peng, Y.; Albuquerque, P.H.M.; Sá, J.M.C.; Padula, A.J.A.; Montenegro, M.R. The best of two worlds: Forecasting high frequency volatility for cryptocurrencies and traditional currencies with Support Vector Regression. Expert Syst. Appl. 2018, 97, 177–192. [Google Scholar] [CrossRef]
  23. Lahmiri, S.; Bekiros, S. Cryptocurrency forecasting with deep learning chaotic neural networks. Chaos Solitons Fractals 2019, 118, 35–40. [Google Scholar] [CrossRef]
  24. Tseng, C.H.; Cheng, S.T.; Wang, Y.H.; Peng, J.T. Artificial neural network model of the hybrid EGARCH volatility of the Taiwan stock index option prices. Physica A 2008, 387, 3192–3200. [Google Scholar] [CrossRef]
  25. Tseng, C.H.; Cheng, S.T.; Wang, Y.H. New hybrid methodology for stock volatility prediction. Expert Syst. Appl. 2009, 36, 1833–1839. [Google Scholar] [CrossRef]
  26. Zahedi, J.; Rounaghi, M.M. Application of artificial neural network models and principal component analysis method in predicting stock prices on Tehran Stock Exchange. Physica A 2015, 438, 178–187. [Google Scholar] [CrossRef]
  27. Kristjanpoller, W.; Minutolo, M.C. Gold price volatility: A forecasting approach using the Artificial neural network-GARCH model. Expert Syst. Appl. 2015, 42, 7245–7251. [Google Scholar] [CrossRef]
  28. Kristjanpoller, W.; Minutolo, M.C. Forecasting volatility of oil price using an artificial neural network-GARCH model. Expert Syst. Appl. 2016, 65, 233–241. [Google Scholar] [CrossRef]
  29. Lahmiri, S. Modeling and predicting historical volatility in exchange rate markets. Physica A 2017, 471, 387–395. [Google Scholar] [CrossRef]
  30. Kristjanpoller, W.; Hernández, E. Volatility of main metals forecasted by a hybrid ANN-GARCH model with regressors. Expert Syst. Appl. 2017, 84, 290–300. [Google Scholar] [CrossRef]
  31. Hajizadeh, E.; Seifi, A.; Zarandi, M.F.; Turksen, I.B. A hybrid modeling approach for forecasting the volatility of S&P 500 index return. Expert Syst. Appl. 2012, 39, 431–436. [Google Scholar]
  32. Kristjanpoller, W.; Fadic, A.; Minutolo, M.C. Volatility forecast using hybrid Neural Network models. Expert Syst. Appl. 2014, 41, 2437–2442. [Google Scholar] [CrossRef]
  33. Lahmiri, S.; Boukadoum, M. An ensemble system based on hybrid EGARCH-ANN with different distributional assumptions to predict S&P500 intraday volatility. Fluct. Noise Lett. 2015, 14, 1550001. [Google Scholar]
  34. Seo, M.; Lee, S.; Kim, G. Forecasting the Volatility of Stock Market Index Using the Hybrid Models with Google Domestic Trends. Fluct. Noise Lett. 2019, 18, 1950006. [Google Scholar] [CrossRef]
  35. Engle, R.F. Autoregressive conditional heteroscedasticity with estimates of the variance of United Kingdom inflation. Econometrica 1982, 50, 987–1007. [Google Scholar] [CrossRef]
  36. Bollerslev, T. Generalized autoregressive conditional heteroskedasticity. J. Econom. 1986, 31, 307–327. [Google Scholar] [CrossRef] [Green Version]
  37. Nelson, D.B. Conditional heteroskedasticity in asset returns: A new approach. Econometrica 1991, 59, 347–370. [Google Scholar] [CrossRef]
  38. Glosten, L.; Jagannathan, R.; Runkle, D. On the relation between the expected value and the volatility nominal excess return on stocks. J. Financ. 1993, 46, 1779–1801. [Google Scholar] [CrossRef]
  39. Brownlees, C.; Engle, R.; Kelly, B. A practical guide to volatility forecasting through calm and storm. J. Risk 2011, 14, 3–22. [Google Scholar] [CrossRef]
  40. Giles, L.; Maxwell, T. Learning, invariance and generalization in higher order neural networks. Appl. Opt. 1987, 26, 4972–4978. [Google Scholar] [CrossRef]
  41. Zhang, M.; Xu, S.; Fulcher, J. Neuron-adaptive higher order neural-network models for automated financial data modelling. IEEE Trans. Neural Netw. 2002, 3, 188–204. [Google Scholar] [CrossRef]
  42. Xiong, R.; Nichols, E.P.; Shen, Y. Deep learning stock volatility with Google domestic trends. arXiv 2015, arXiv:1512.04916. [Google Scholar]
  43. Hamid, A.; Heiden, M. Forecasting volatility with empirical similarity and Google Trends. J. Econ. Behav. Organ. 2015, 117, 62–81. [Google Scholar] [CrossRef]
  44. Dimpfl, T.; Jank, S. Can Internet search queries help to predict stock market volatility? Eur. Financ. Manag. 2016, 22, 171–192. [Google Scholar] [CrossRef] [Green Version]
  45. Kristoufek, L. BitCoin Meets Google Trends and Wikipedia: Quantifying the Relationship between Phenomena of the Internet Era. Sci. Rep. 2013, 3, 3415. [Google Scholar] [CrossRef] [PubMed] [Green Version]
  46. Kjærland, F.; Khazal, A.; Krogstad, E.A.; Nordstrøm, F.B.; Oust, A. An Analysis of Bitcoin’s Price Dynamics. J. Risk Financ. Manag. 2018, 11, 63. [Google Scholar] [CrossRef] [Green Version]
  47. Aalborg, H.A.; Molnár, P.; Vries, J.E. What can explain the price, volatility and trading volume of Bitcoin? Financ. Res. Lett. 2019, 29, 255–265. [Google Scholar] [CrossRef]
  48. Botchkarev, A. Performance metrics (error measures) in machine learning regression, forecasting and prognostics: Properties and typology. arXiv 2018, arXiv:1809.03006. [Google Scholar]
  49. Kingma, D.P.; Ba, J. Adam: A method for stochastic optimization. arXiv 2014, arXiv:1412.6980. [Google Scholar]
  50. Hansen, P.R.; Lunde, A.; Nason, J.M. The model confidence set. Econometrica 2011, 79, 453–497. [Google Scholar] [CrossRef] [Green Version]
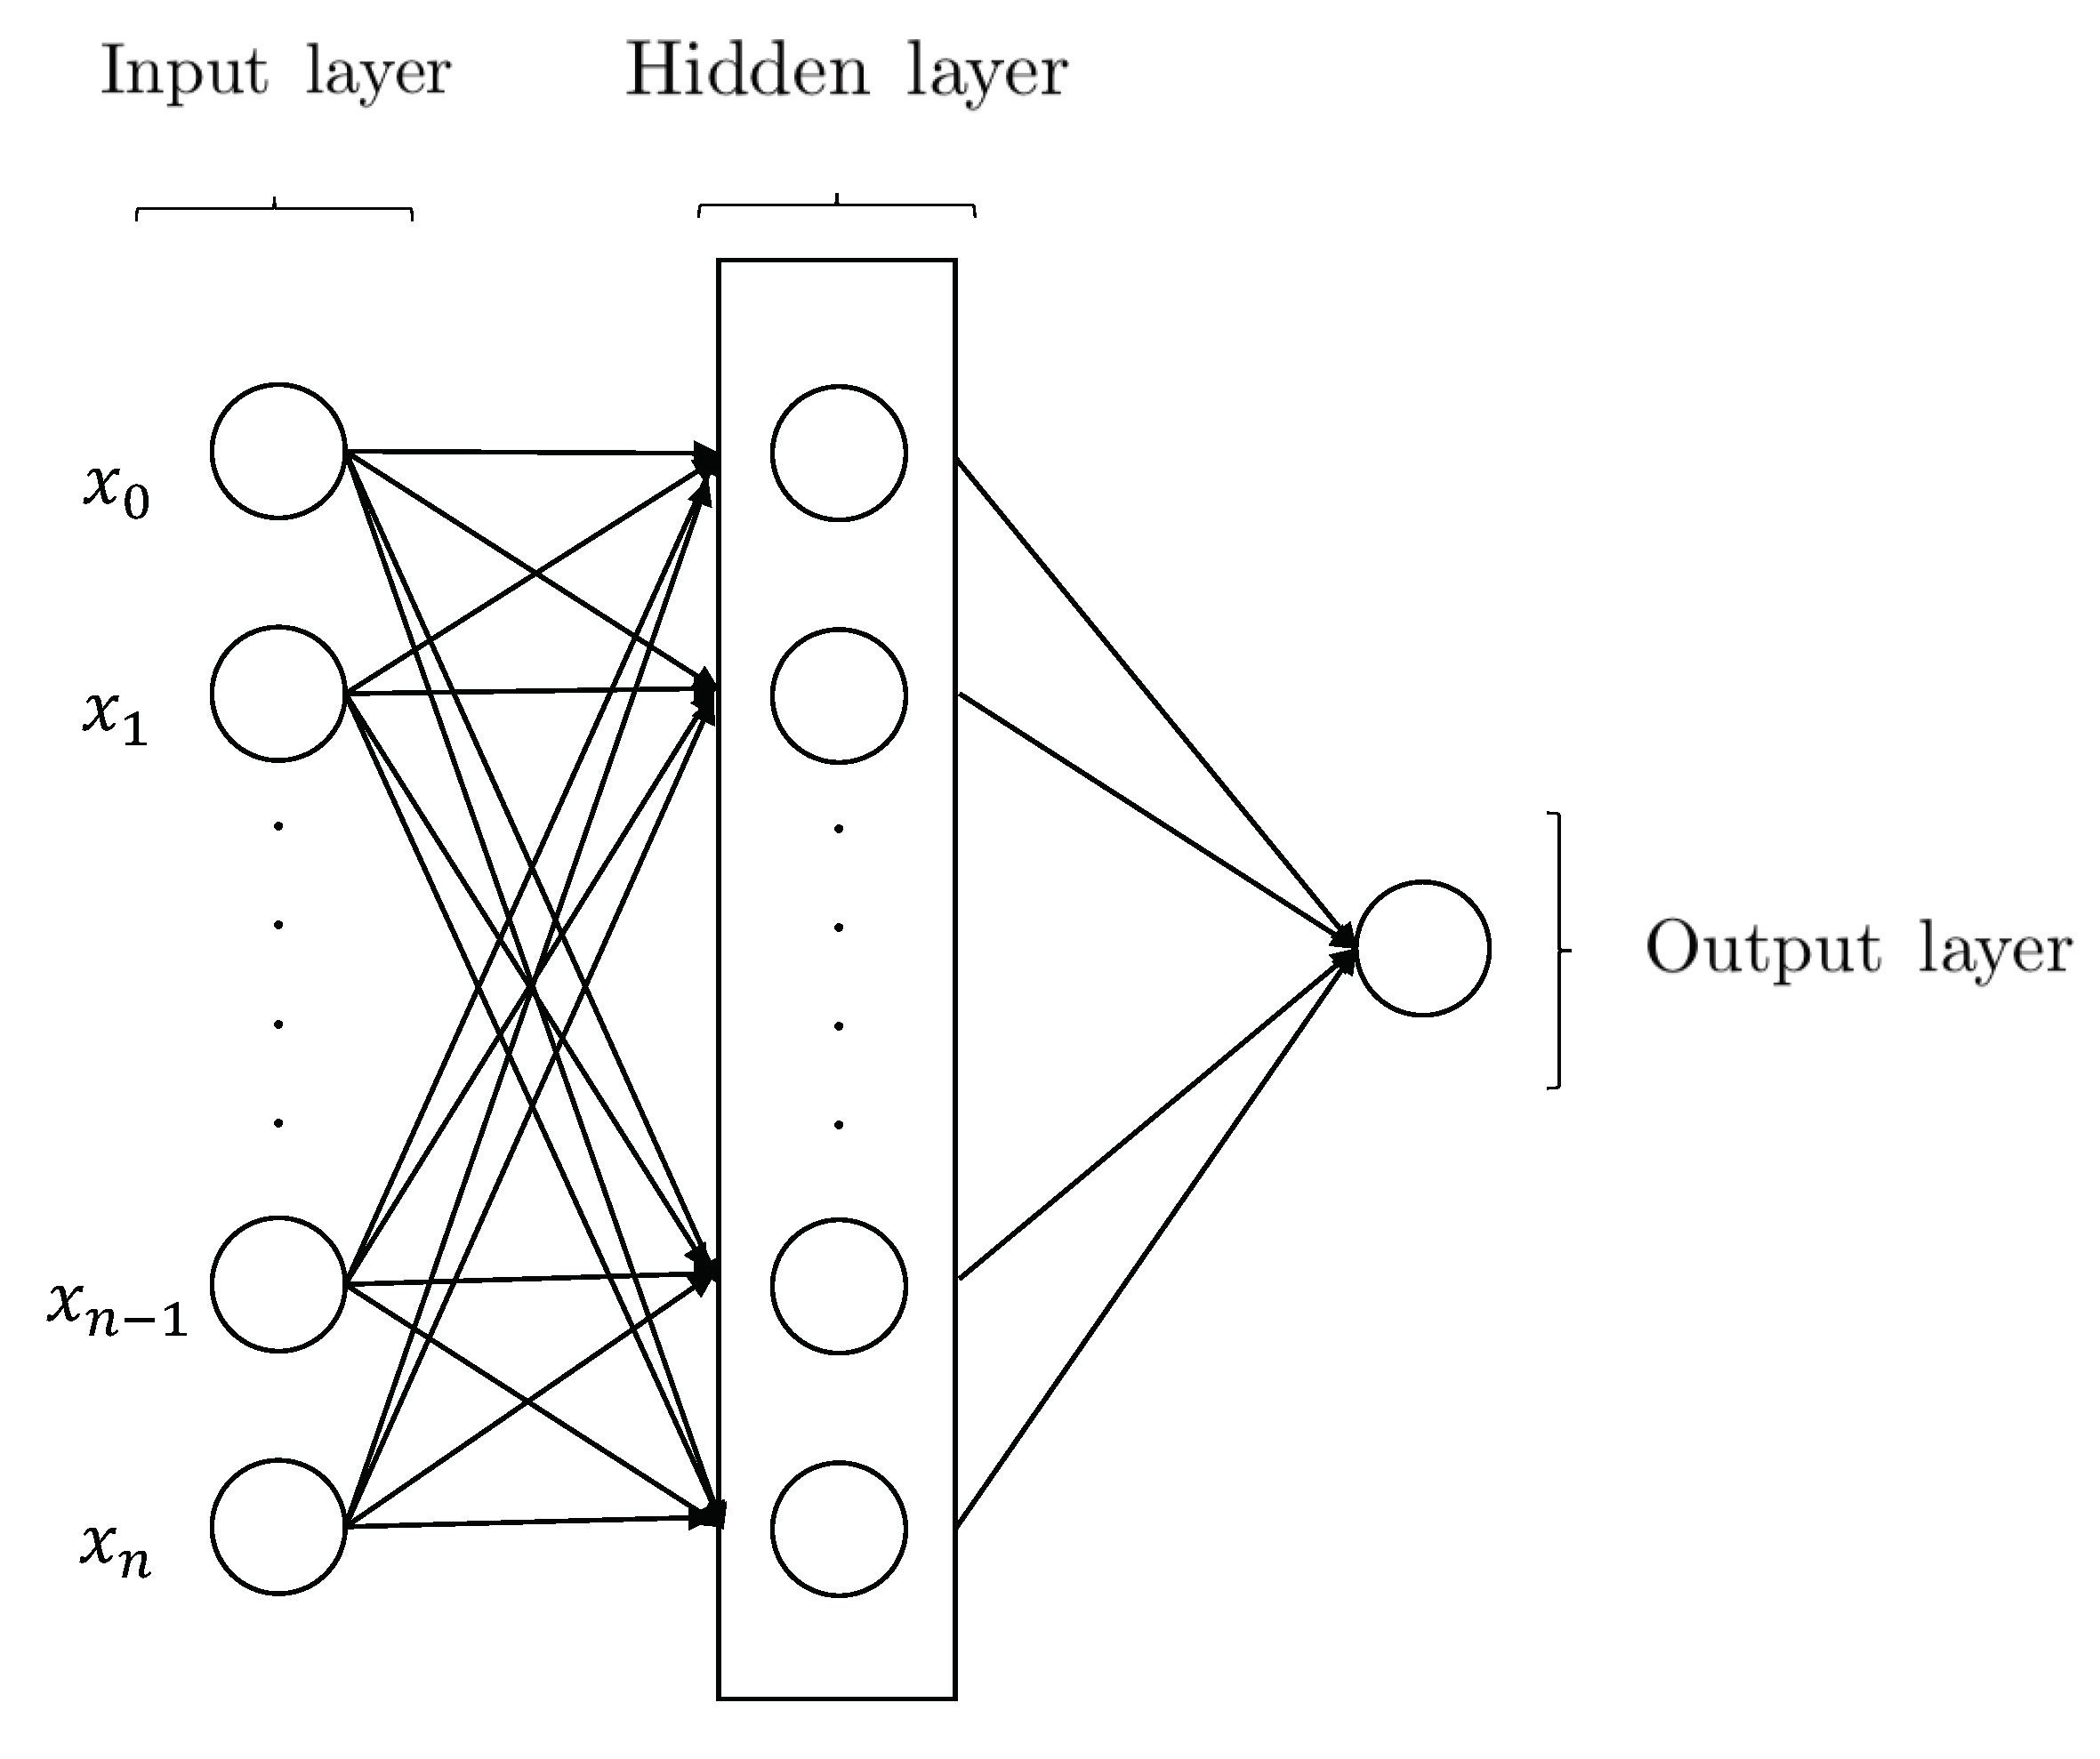
Figure 1. The structure of Artificial Neural Network (ANN).
Applsci 10 04768 g001
Figure 2. The structure of Higher Order Neural Network (HONN).
Applsci 10 04768 g002
Figure 3. Log return r t of Bitcoin price from 1 January 2012 to 30 November 2019.
Applsci 10 04768 g003
Figure 4. Realized volatility R V t of r t afrom 1 January 2012 to 30 November 2019.
Applsci 10 04768 g004
Figure 5. VIX index from 1 January 2012 to 30 November 2019.
Applsci 10 04768 g005
Figure 6. Lagged volatility L V t of r t from 1 January 2012 to 30 November 2019.
Applsci 10 04768 g006
Table 1. Activation functions used in this paper.
NameActivation Function
Sigmoid f ( x ) = 1 1 + e x
Hyperbolic Tangent (Tanh) f ( x ) = e x e x e x + e x
Rectified Linear Unit (ReLU) f ( x ) = 0 for x < 0 x for x 0
Exponential Linear Unit (ELU) f ( x ) = α ( e x 1 ) for x < 0 x for x 0
Table 2. GARCH models.
   Models    ( p , q )     AIC     BIC    
    GARCH    (1,1)   −7593.56   −7570.83    
    GARCH    (2,2)   −7633.38   −7599.30    
    GARCH    (3,3)   −7630.73   −7585.28    
    GJR GARCH    (1,1)   −7589.75   −7561.34    
    GJR GARCH    (2,2)   −7577.91   −7538.14    
    GJR GARCH    (3,3)   −7558.42   −7507.29    
    EGARCH    (1,1)   −7646.91   −7618.51    
    EGARCH    (2,2)   −7665.96   −7626.19    
    EGARCH    (3,3)   −7687.68   −7636.55    
Table 3. GARCH models performance.
   Models    ( p , q )     MAE     RMSE     MAPE    
    GARCH    (1,1)   0.01820086   0.022997082   60.71728437
    GARCH    (2,2)   0.018615039   0.023244302   62.97792289
    GARCH    (3,3)   0.031275112   0.274933282   104.4275052
    GJR GARCH    (1,1)   0.018100989   0.022782066   59.57816469
    GJR GARCH    (2,2)   0.018273329   0.022976453   61.3172729
    GJR GARCH    (3,3)   0.018353907   0.023128309   61.44172661
    EGARCH    (1,1)   0.021923047   0.025916869   80.21691954
    EGARCH    (2,2)   0.021758949   0.025850653   79.23566863
    EGARCH    (3,3)   0.022439612   0.026596278   81.70952727
Table 4. Input variables of models.
Models Selected Input Variables
GT GARCH model {GARCH(1,1), GARCH(2,2), GARCH(3,3), GJR-GARCH(1,1), GJR-GARCH(2,2),
GJR-GARCH(3,3), EGARCH(1,1), EGARCH(2,2), EGARCH(3,3), GT, L V t }
GT VIX GARCH model {GARCH(1,1), GARCH(2,2), GARCH(3,3), GJR-GARCH(1,1), GJR-GARCH(2,2),
GJR-GARCH(3,3), EGARCH(1,1), EGARCH(2,2), EGARCH(3,3), GT, L V t , VIX }
Table 5. GT-GARCH model performance.
   Model   Activation Function   Nodes    MAE     RMSE     MAPE    
   GT-GARCH   Relu   10   0.016455061   0.0228628   44.03939302
         20   0.016455761   0.02286762   44.01794052
         30   0.016456899   0.022870071   44.01377941
         40   0.016457765   0.02287134   44.01490369
         50   0.016456698   0.022868367   44.01481934
      Tanh   10   0.01645589   0.022866914   44.02158481
         20   0.016456046   0.022867024   44.02205182
         30   0.016457015   0.022869247   44.01766755
         40   0.016457969   0.022870135   44.0273439
         50   0.016457073   0.022869712   44.01422672
      Elu   10   0.016456301   0.022867778   44.01894413
         20   0.016451684   0.02284573   44.10871
         30   0.016456961   0.022866742   44.03292253
         40   0.016455294   0.022864722   44.02362704
         50   0.016456115   0.022866339   44.0296898
      Sigmoid   10   0.016456811   0.02286878   44.02080023
         20   0.016457144   0.022869732   44.01885011
         30   0.016456885   0.022867327   44.02887424
         40   0.016456888   0.022870528   44.01028107
         50   0.016457102   0.022868327   44.02443017
Table 6. GT-VIX-GARCH model performance.
   Model   Activation Function   Nodes    MAE     RMSE     MAPE    
   GT-VIX-GARCH   Relu   10   0.016464618   0.022961953   43.6754142
         20   0.016463169   0.022961503   43.66309023
         30   0.016464239   0.022963376   43.66271481
         40   0.016464096   0.022965466   43.65610286
         50   0.016468159   0.022966994   43.68492065
      Tanh   10   0.016465239   0.022964124   43.67126798
         20   0.016463913   0.022960066   43.67926114
         30   0.016464939   0.022962888   43.67179649
         40   0.01646529   0.022962936   43.68079538
         50   0.016463781   0.022958457   43.68308928
      Elu   10   0.016464796   0.022964955   43.66256389
         20   0.016465883   0.02296502   43.67128545
         30   0.016464635   0.022962084   43.67544449
         40   0.016466452   0.022966505   43.66998111
         50   0.016462585   0.022957731   43.67119374
      Sigmoid   10   0.01646477   0.022963578   43.67003712
         20   0.016461495   0.022957864   43.67131767
         30   0.016464624   0.022961432   43.67831534
         40   0.016464975   0.022965387   43.66149144
         50   0.01647861   0.02302727   43.4274305
Table 7. GT-H model performance.
   Model   Activation Function   Nodes    MAE     RMSE     MAPE    
   GT-H   Relu   10   0.016941584   0.022027929   52.70636488
         20   0.016941599   0.02202816   52.70680583
         30   0.016941163   0.022027678   52.70298093
         40   0.016940914   0.022027074   52.70274993
         50   0.016941279   0.022027853   52.70347102
      Tanh   10   0.016941714   0.022027935   52.70708064
         20   0.016942079   0.022028228   52.70821739
         30   0.016941977   0.022028122   52.70722389
         40   0.016941485   0.022028033   52.70475844
         50   0.016940999   0.022027369   52.70261778
      Elu   10   0.01694181   0.022028066   52.70750404
         20   0.016941503   0.022027574   52.70587155
         30   0.016942019   0.022027821   52.7097488
         40   0.01694203   0.022027968   52.70826475
         50   0.01694185   0.022027961   52.71021157
      Sigmoid   10   0.016941511   0.022027945   52.70543218
         20   0.016941295   0.022027628   52.70568077
         30   0.016941514   0.022028015   52.70581447
         40   0.016942199   0.022028407   52.70889483
         50   0.016941966   0.022027852   52.70746498
Table 8. GT-VIX-H model performance.
   Model   Activation Function   Nodes    MAE     RMSE     MAPE    
   GT-VIX-H   Relu   10   0.016745304   0.022489019   48.02497968
         20   0.01674541   0.02248914   48.0246867
         30   0.016746443   0.022489882   48.02759455
         40   0.016745041   0.022488647   48.02404413
         50   0.016748236   0.022522086   47.82463374
      Tanh   10   0.016745657   0.022489571   48.02533742
         20   0.016745787   0.02248942   48.02683015
         30   0.016745458   0.02248931   48.02374776
         40   0.016744942   0.022489028   48.0238152
         50   0.01674544   0.022489515   48.02256555
      Elu   10   0.01674516   0.02248885   48.02508728
         20   0.016745349   0.022488898   48.02401028
         30   0.016745336   0.022489   48.02517194
         40   0.016745663   0.022488933   48.02556819
         50   0.016745491   0.022489525   48.02760086
      Sigmoid   10   0.016745208   0.022489047   48.02402778
         20   0.016745744   0.022489067   48.02780298
         30   0.0167453   0.022489284   48.0246795
         40   0.016745533   0.022488691   48.02600782
         50   0.016745073   0.022489534   48.02441867
Table 9. GT-VIX-GARCH-H model performance.
   Model   Activation Function   Nodes    MAE     RMSE     MAPE    
   GT-VIX-GARCH-H   Relu   10   0.016099377   0.022304876   41.97126277
         20   0.016101827   0.02228648   42.07658833
         30   0.016095555   0.022284853   42.03342476
         40   0.016109686   0.022277813   42.13001676
         50   0.016097934   0.02228606   42.05669279
      Tanh   10   0.016098348   0.022302633   41.964812188
         20   0.01609808   0.022231812   42.38508374
         30   0.016094577   0.022298402   42.01919185
         40   0.016098404   0.022302775   42.04282541
         50   0.016096921   0.022285756   42.04785915
      Elu   10   0.016108832   0.02236164   41.71558473
         20   0.016100976   0.022290669   42.06674165
         30   0.016098687   0.022285274   42.06192355
         40   0.016101002   0.022291082   42.06727282
         50   0.016105162   0.022295976   42.088699
      Sigmoid   10   0.016099661   0.022292957   42.06001306
         20   0.016099905   0.022281962   42.06856524
         30   0.016100028   0.022278299   42.07671847
         40   0.016105448   0.022285267   42.1902812
         50   0.016096398   0.02229977   42.03760228
Table 10. Input variables of models.
    Input Variables
Models LV t ( x 0 ) GT ( x 1 ) VIX ( x 2 ) GJR GARCH ( 1 , 1 ) ( x 3 )     EGARCH ( 3 , 3 ) ( x 4 )
    GT H model OOXXX
    GT VIX H model OOOXX
    GT VIX GARCH H model OOOOO
Table 11. Model confidence set.
   Loss Function
   Ranking   Model   Activation Function   Nodes    MAE    MCS    
   1   GT-VIX-GARCH-H   Relu   30   0.016095555   1.000    
   2   GT-VIX-GARCH-H   Tanh   20   0.01609808   0.991    
   3   GT-VIX-GARCH-H   Tanh   30   0.016094577   0.991    
   4   GT-VIX-GARCH-H   Relu   50   0.016097934   0.991    
   5   GT-VIX-GARCH-H   Tanh   40   0.016098404   0.991